Back to Journals » International Journal of Chronic Obstructive Pulmonary Disease » Volume 18
Characteristics of Serum Autoantibody Repertoire and Immune Subgroup Variation of Tuberculosis-Associated Obstructive Pulmonary Disease
Authors Jiang M, Pang N ![]() , Wang J
, Wang J ![]() , Li Z
, Li Z ![]() , Xu D
, Xu D ![]() , Jing J
, Jing J ![]() , Chen D, Li F
, Chen D, Li F ![]() , Ding J, Li Q
, Ding J, Li Q
Received 9 August 2023
Accepted for publication 16 November 2023
Published 5 December 2023 Volume 2023:18 Pages 2867—2886
DOI https://doi.org/10.2147/COPD.S434601
Checked for plagiarism Yes
Review by Single anonymous peer review
Peer reviewer comments 3
Editor who approved publication: Prof. Dr. Richard Russell
Min Jiang,1,* NanNan Pang,2,* Jing Wang,1 Zheng Li,1 Dan Xu,1 Jing Jing,1 Dan Chen,3 Fengsen Li,1 Jianbing Ding,4 Qifeng Li5
1Xinjiang Key Laboratory of Respiratory Disease Research, Traditional Chinese Medical Hospital of Xinjiang Uygur Autonomous Region, Urumqi, 830011, Xinjiang, People’s Republic of China; 2CAS Key Laboratory of Bio-Medical Diagnostics, Suzhou Institute of Biomedical Engineering and Technology, Chinese Academy of Sciences, Suzhou, 215163, People’s Republic of China; 3School of Public Health, Xinjiang Medical University, Urumqi, 830017, Xinjiang, People’s Republic of China; 4Department of Immunology, College of Basic Medicine, Xinjiang Medical University, Urumqi, 830011, Xinjiang, People’s Republic of China; 5Xinjiang Institute of Pediatrics, Xinjiang Hospital of Beijing Children’s Hospital, Children’s Hospital of Xinjiang Uygur Autonomous Region, Urumqi, 830011, Xinjiang, People’s Republic of China
*These authors contributed equally to this work
Correspondence: Qifeng Li, Xinjiang Institute of Pediatrics, Xinjiang Hospital of Beijing Children’s Hospital, Children’s Hospital of Xinjiang Uygur Autonomous Region, Urumqi, 830054, People’s Republic of China, Tel +86-991 3056239, Fax +86-991 3056237, Email [email protected]
Background: Studying the potential etiology and pathogenesis of tuberculosis-associated chronic obstructive pulmonary disease (TOPD) from an autoimmunity perspective may provide insights into peripheral blood autoantibodies and immune cells, as well as their interactions.
Methods: This study examined the serum autoantibody repertoire in healthy individuals, patients with chronic obstructive pulmonary disease (COPD), patients with pulmonary tuberculosis (TB), and TOPD patients using the HuProtTM protein chip. Autoantigens in the peripheral blood of TOPD patients were verified using ELISA assay. Various epitopes and immune simulation were predicted using bioinformatic methods. Flow cytometry was employed to detect macrophages(M&phis;), T cells, and innate lymphoid cells (ILCs) in the peripheral blood.
Results: COPD patients displayed distinct alterations in their IgG and IgM autoantibodies compared to the other groups. GeneOntology (GO) and Kyoto Encyclopedia of Genes and Genomes(KEGG)analyses revealed that these autoantibodies were associated with regulating macrophages, T cells, and B cells. ELISA results confirmed the upregulation of expression of proliferating cell nuclear antigen (PCNA), Mitogen-Activated Protein Kinase 3 antigen (MAPK3), and threonine protein kinase 1 antigen (AKT1) proteins in the peripheral blood of TOPD patients. Bioinformatic analysis predicted multiple potential epitopes in Th, CTL, and B cells. Immune simulation results demonstrated that PCNA, MAPK3, and AKT1 can activate innate and adaptive immune responses and induce the expression of different cytokines, such as IFN-g and IL-2. Furthermore, data obtained from flow cytometry assay revealed an upregulation in the face of Th1 cells in the peripheral blood of TOPD patients.
Conclusion: Tuberculosis infection can effectively induce autoimmune responses, contributing to increased expression of Th1 cells and associated cytokines, ultimately leading to immune dysregulation. Furthermore, the accumulation of pulmonary inflammatory response facilitates the progression of TOPD and is helpful for the clinical diagnosis and the development of targeted therapeutic drugs for this disease.
Keywords: chronic obstructive pulmonary disease, COPD, autoantibody, autoimmunity, inflammatory phenotype
Introduction
Chronic Obstructive Pulmonary Disease (COPD) represents a heterogeneous disease characterized by persistent, progressive, and aggravated airflow obstruction, chronic lung inflammation, lung morphological alterations, and lung parenchymal destruction.1 Apart from tobacco smoke, COPD has been known to occur in patients with previous pulmonary TB.2–4 Several studies have shown that tuberculosis can independently increase the risk of developing COPD, and having a history of tuberculosis can increase the prevalence of COPD by an average of three times.This elevation can directly correlate with an increased severity of obstruction and level of inflammation, termed Tuberculosis-Associated Obstructive Pulmonary Disease (TOPD).5 TOPD forming the TOPD phenotype of COPD is a sequela and complication following tuberculosis, and a considerable number of COPD patients belong to this group. The pathogenesis of this tuberculosis-related condition remains unclear.
Infection with mycobacteria has been substantiated as one of the major environmental triggers that can incite autoimmunity,6,7 TB can cause autoimmune manifestations such as nodular vasculitis, Sjögren’s syndrome, SLE, RA, dermatomyositis, and polymyositis.8 Multiple surface Mtb molecules can differently orchestrate immune responses. Mycobacterial lipids have been shown to act as adjuvants, stimulating the production of antibodies by innate B-1-like B cells.9 After infection with Mycobacterium tuberculosis, both apoptosis and apoptotic phagosomes can activate auto-reactive T cells, leading to an autoimmune response.10 A cross-reactive autoantigen between Mycobacterium tuberculosis and the host can effectively serve to stimulate autoreactive T cells, thereby leading to the production of IFN-γ as well as TNF-α, Synergistic stimulation by IFN-γ of B cells lead to the induction of T-bet+ B-cells and production of IgG2a.11,12 Infection by Mycobacterium tuberculosis can trigger an autoimmune response in the host due to cross-reactivity with host antigens.Notably, elastin can bind to the antigen 85 complex (Ag85) of Mycobacterium tuberculosis, thus serving as a pivotal ligand that can facilitate its invasion. In addition, infection by Mycobacterium tuberculosis can provoke a neutrophil-mediated destruction of the elastin matrix.13 Hence, an infection with Mycobacterium tuberculosis could potentially induce an autoimmune response which can contribute to the pathogenesis of tuberculosis-associated COPD. COPD is fundamentally an inflammatory disease, with its pathogenesis primarily involving an acquired immune response to the newly formed or altered epitopes.14,15 A substantial number of clinical and experimental studies have affirmed the crucial role of autoimmunity in the pathogenesis of COPD.16,17 For instance, COPD patients can generate autoantibodies which can target the pulmonary bronchial epithelial cells. Concomitantly, serum anti-co-stimulatory CD80 autoantibody levels experience significant elevation, but approximately 50% of COPD patients present autoantibodies against the primary pulmonary artery endothelium, thus contributing to epithelial lysis and lung tissue destruction. These specific manifestations suggest role of potential risk factors involved in the pathogenesis of COPD.
This study investigated the disparity in the peripheral serum autoantibodies between TOPD and COPD patients, concurrently analyzing the variances in immunocyte subsets across the two different groups. Moreover, by utilizing the autoimmunity status as a starting point, this study delved into the potential role of tuberculosis infection in the inception as well as progression of COPD. Overall, such an approach could be conducive to facilitate a better understanding of the etiology and pathogenesis of tuberculosis-associated COPD, and holds immense scientific and clinical significance when devising the targeted prevention and treatment strategies. Overall, in-depth research on the source and function of autoantibodies could be potentially useful for the development of biomarkers and targeted drugs for TOPD clinical detection.
Materials and Methods
Diagnosis Inclusion and Exclusion Criteria
In this study, we included outpatients and inpatients in Xinjiang Uygur Autonomous Region Chinese Medicine Hospital from March 2021 to December 2022. All patients were diagnosed according to the Global Initiative for Chronic Obstructive Lung Disease (GOLD) criteria. All patients met the following inclusion criteria:1) irreversible obstructive dysfunction defined as the forced expiratory volume in one second (FEV1) < 80% predicted and FEV1/forced vital capacity (FVC) < 70% after using bronchodilator, 2) no acute exacerbation, 3) age 40–75 years. The exclusion criteria included were as following:1) patients with other respiratory diseases or other lung diseases with restrictive ventilatory impairment, 2) severe systemic illnesses such as severe cardiovascular diseases, hepatorenal diseases, and hematopoietic system diseases, 3) immunosuppressants in the previous 30 days before enrollment.
Diagnostic criteria for Tuberculosis:18 were as following: 1) positive sputum for tuberculosis; 2) confirmation of tuberculosis through imaging examination; 3) lack of treatment prior to admission; and 4) an age greater than 18 years. Exclusion criteria constituted: 1) negative sputum culture for pulmonary tuberculosis (MTB); 2) infection with human immunodeficiency virus (HIV) or any pathogen other than MTB; 3) pulmonary tuberculosis patients with different underlying conditions such as hypertension, diabetes, immunological disorders, kidney diseases, malignant tumors, viral hepatitis, and respiratory diseases; 4) individuals who have undergone surgery in the past three months; (5) patients requiring tuberculosis re-treatment; and (6) patients suffering from the multidrug-resistant tuberculosis.
COPD patients were further categorized into two different groups: the Tuberculosis-Associated Obstructive Pulmonary Disease group, based on their tuberculosis infection history. The study was approved by the Ethics Committee of Xinjiang Uygur Autonomous Region Chinese Medicine Hospital, and written informed consent was procured from each individual taking part in the study, our study complies with the Declaration of Helsinki.
Lung Function and COPD Related Questionnaires
The various clinical questionnaires were compiled to record the patient data such as past history of smoking, respiratory diseases, TB infection, anti-tuberculosis treatment, and the different lung function parameters (FEV1, FVC, and FEV1/FVC%). This involved completion of the COPD assessment test (CAT), and the Modified Medical Research Council scale (mMRC) as described previously.19
Sampling
First, 5 mL of heparin sodium-anticoagulated whole blood samples were collected during morning fasting from all the subjects. Then, the whole blood earmarked for flow cytometry analysis was instantly placed in a flow tube for antibody staining, whereas blood samples intended for the serum collection were left at the room temperature for 30 minutes, and thereafter centrifuged at 3000 rpm for 10 minutes. The extracted serum was immediately stored at −80°C.
Autoantibody Detection by Human Proteome Chip
HuProtTM V4.0, which encompasses 21,000 human proteins, can maintain a coverage of 81%, and full-length gene representation of 89%, currently constitutes the highest throughput protein chip globally. Specifically, this protein chip was subjected to a 1-hour incubation with a 1% Bovine Serum Albumin (BSA) sealer at the room temperature. Subsequently, the serum samples, diluted 1:200 using PBST containing 10% BSA, were added and incubated overnight at 4°C, followed by three wash cycles with 1×PBST. Cy3-labeled anti-human IgG (1:1000) and Cy5-labeled anti-human IgM (1:1000) were then added for a 1-hour incubation at the room temperature, followed by three additional rounds of washing with PBST. The protein chips were subsequently scanned at the room temperature with a LuxScan 10K microarray chip scanner (LuxscantM 10 Ka). The raw data was obtained from GenePix Pro v6.0. The median strength values of both the foreground and background for each point on the protein chip were acquired and the final strength for each point was determined by the difference between the median strength values of the foreground and background.20
Autoantibody Repertoire
The normalization of the Signal-to-Noise Ratio (SNR) was employed for calculations involving the differential expression multiples between the selected group and other groups for any specific protein. This was represented as fold change, which equals the expression value of the selected group divided by the mean value of other groups. This fold change signifies the degree by which the selected group can exceed others. Defined as the potential difference, a fold change equal to or greater than 2 is typically recognized. It is widely accepted that the higher the difference multiple, the more pronounced could be the divergence between the two groups. To avoid the possible comparisons involving negative proteins across the different groups, the detection threshold for the positive proteins was established based on the SNR distribution of the various protein spots on the chip post-normalization but pre-sample comparison. A protein was classified as a positive when both IgG-SNR and IgM-SNR exceeded 4. Consequently, the cutoff thresholds (cutoff-IgG ≥ 4, cutoff-IgM ≥ 4) were determined based on the control group’s SNR on the protein. DAVID (http://david.ncifcrf.gov/), an online database, was used for the gene difference analysis and Gene Ontology (GO) and Kyoto Encyclopedia of Genes and Genomes (KEGG) enrichment analysis. Additionally, another database, STRING (https://string-db.org/), was utilized for the protein-protein interaction network analysis.
Epitope Identification
The antigenicity of the different proteins was predicted by using the online antigen prediction software, Vaxijen v2.0.
Bioinformatic Epitope Prediction in T Cells
Epitope Prediction in Th Cells
The various cell epitopes were predicted utilizing SYFPEITHI (http://www.syfpeithi.de/bin/MHCServer.dll/EpitopePrediction.htm) and IEDB (http://www.iedb.org/) platforms. Six different MHC-class II molecular alleles were specifically selected.21 These could be predicted by using four software types and included HLA-DRB1*01:01, HLA-DRB1*03:01, HLA-DRB1*04:01, HLA-DRB1*07:01, HLA-DRB1*11:01, HLA-DRB1*15:01. The screening criteria used were as follows: SYFPEITHI score >20, IEDB rank<1.00, Net MHC II pan rank<10, and Net MHC II rank<10. The predicted peptide length for each server was configured at 15, with all other settings left as the default.
Prediction of Epitopes in CLT Cells
SYFPEITHI and IEDB online software were used to predict the potential CTL cell epitopes of proteins. Specifically, in this study, the following HLA-A alleles were selected: HLA-A*01:01, HLA-A*02:01, HLA-A*03:01, HLA-A*11:01, HLA-A*24:02, HLA-A*26:01,21 with 6 MHC-I molecular dominant gene loci. The screening criteria were defined as follows: SYFPEITHI score > 20, IEDB rank < 0.1, Net MHC rank <10. Each epitope was set to have a peptide length of 9 amino acids, and all other settings were kept as the default.
Bioinformatic Epitope Prediction in B Cells
To predict the various epitopes in B cells, two distinct tools were employed: ABC Pred (https://webs.iiitd.edu.in/raghava/abcpred/ABC_submission.html)22 and BepiPred 1.0 Server (http://www.cbs.dtudk/services/BepiPred-1.0).
Flow Cytometry
Th1, Th2 and Th17 surface staining was performed as previously described (Mahnke et al, 2013). Briefly, 100μL of whole blood was incubated with FITC-CD4 (SK3, BD, San Jose, CA, USA), PE-Cy5-CD183 (1C6/CXCR3, BD, San Jose, CA, USA), and PE-CD196 (11A9, BD, San Jose, CA, USA). Treg surface staining was performed CD4-PE-Cy7 (RM4-5), CD127-PE (HIL-7R-M21), CD25-FITC(2A3).ILC2 staining: 200μL of whole blood was incubated with the following antibodies (all from BD unless specified otherwise), including Lineage-FITC, CD3 (UCHT1), CD19 (HIB19), CD123 (7G3), CD11b (M1/70), CD11c (B-ly6), CD8 (RPA-T8), FceRI (AER-37 (CRA-1), CD14 (M5E2), CD4 (RPA-T4), CD56 (B159), CD45-APC-Cy7 (2D1), CRTH2-PerCP-Cy5.5 (BM16), CD127-PE-Cy7 (HIL-7R-M21).M1 and M2 staining: 50μL of whole blood was incubated with CD14-PE,CD68-PE-Cy7,CD86-FITC,CD206-PerCP-Cy5.5. The above systems were incubated for 30 minutes at the room temperature in the dark. Isotype control was added to block the nonspecific binding. The cells were thereafter lysed using red blood cell lysate for 10–15 min and then washed with PBS twice. All the samples were detected by BD flow cytometry (LSR II, BD, USA), and analyzed using Kaluza software (Beckman Coulter, Inc) or FlowJo_V10 (Tristar, USA).
Enzyme-Linked Immunosorbent Assays of Serum Sample
The concentrations of various autoantibodies and cytokines in the peripheral blood serum were detected using double antibody sandwich enzyme-linked immunosorbent assay (ELISA) kits. ELISA kits were purchased from Hangzhou Lianke Biotechnology Co., Ltd (Hangzhou, China). Briefly, ELISA plate was coated with capture antibody. The samples were added, and horseradish peroxidase-conjugated secondary monoclonal antibody was then added. After washing with PBST three times, tetramethylbenzidine was added in the dark for color development. Absorbance was then determined at 450 nm and a reference wavelength of 570nm using a spectrophotometer (Thermo, Waltham, MA, USA). The concentrations were calculated based on a standard curve.
Statistical Analysis
The data has been expressed as mean ± SEM. The Graphpad Prism 8 software package (Graphpad Software Inc., San Diego, CA, USA) was used for statistical analysis. One-way ANOVA was used to compare the data among multiple groups, followed by LSD-t test. P<0.05 was considered as statistically significant.
Results
Clinical Data of Patients
A summary of patient demographics has been shown in Table 1. We observed no statistically significant differences in socioeconomic information and measurement at the baseline. FEV1/FVC and 6MWD of COPD and TOPD patients was obviously lower than that in HC (P<0.001). In addition, CAT of COPD and TOPD patients was increased than in the HC groups.There was no significant difference in lung function between TB patients included in this study and HC group (P > 0.05).
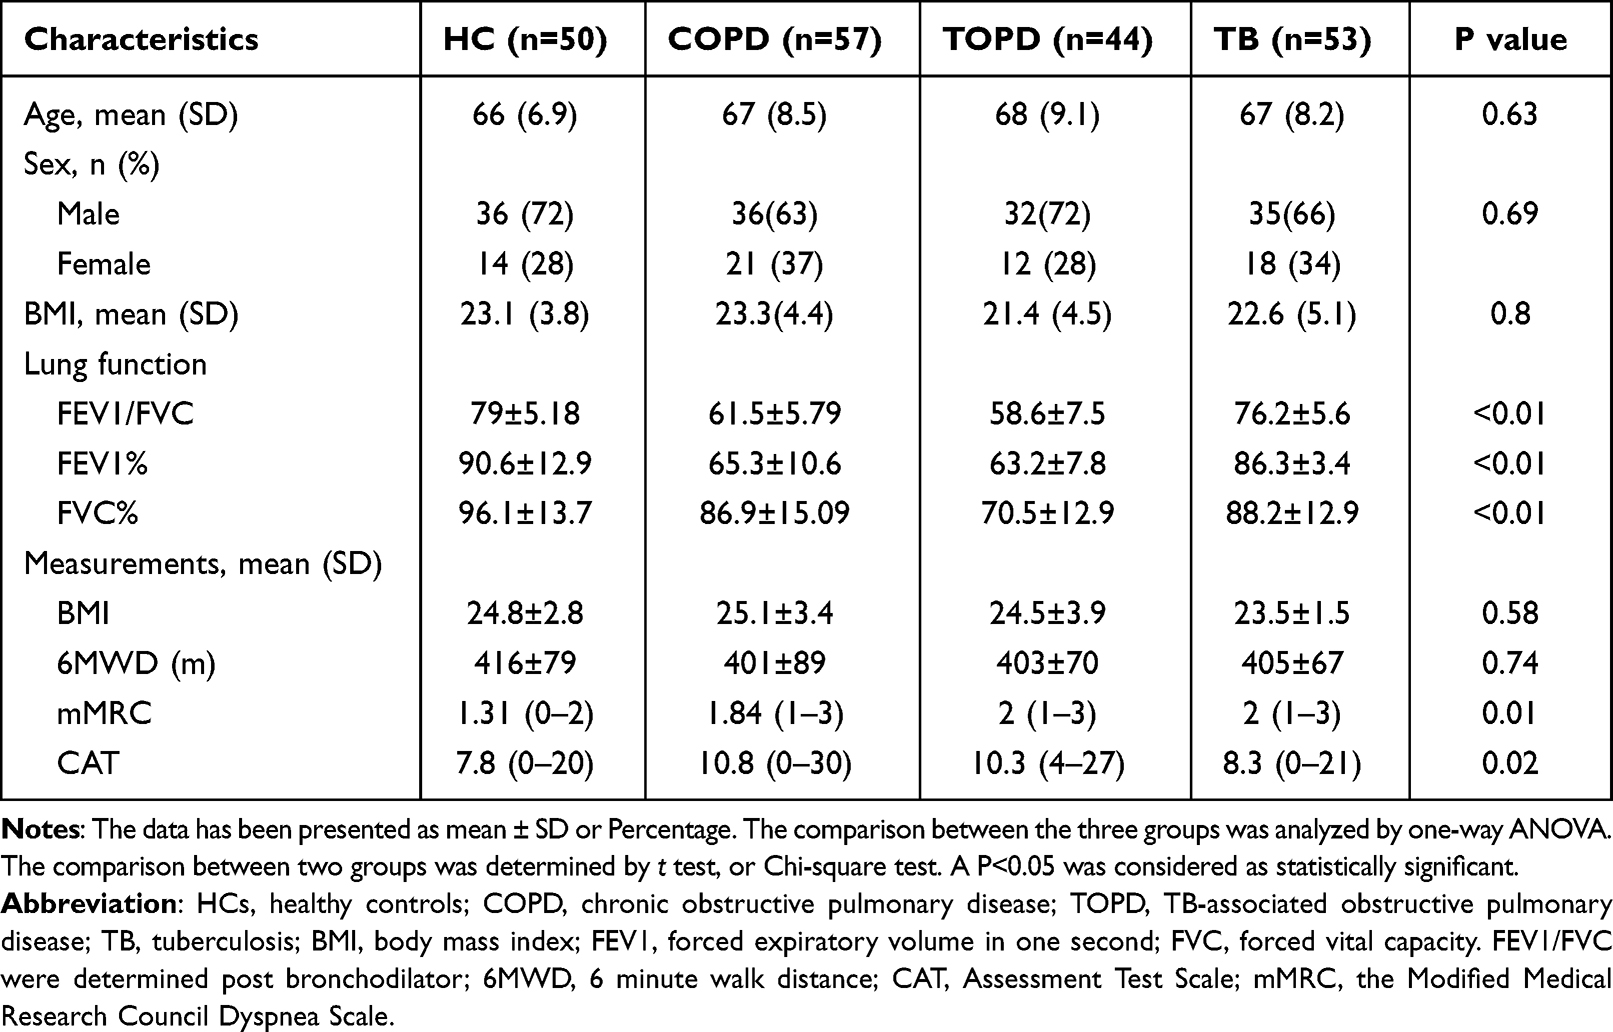 |
Table 1 Basic Clinical Data of TOPD Group, COPD Group, TB Group and Healthy Control Group |
Screening by HuProtTM
Differential Distribution of Autoantibodies in TOPD Patient Serum
The results of the fluorescent scanning signals on the proteome chip have been presented in Figure 1A. The green fluorescence demonstrated specific binding of IgG to the serum samples in the 532 nm channels. Under red fluorescence, IgM exhibited specific binding to the serum samples in the 635 nm channel (Figure 1A). Thereafter, by applying the screening criteria, a fold change (FC) of the mean of the experimental group/ the mean of the control group greater than 1.5 was used. Through this screening, we have identified 1736 differentially expressed IgG autoantibodies between TOPD patients and the control group. Among these, 718 were found to be up-regulated in the TOPD group, whereas the remaining 1218 were down-regulated (Figure 1B). Moreover, upon comparing TOPD with COPD and TB patients, a total of 665 IgG antibodies were observed to be specifically upregulated in TOPD, while 355 IgG antibodies were specifically down-regulated. Additional analyses, including GO and KEGG enrichment analysis, were then performed on the differentially expressed IgG antibodies. The upregulated IgG autoantibodies in TOPD patients were primarily associated with the cellular components such as mitochondria and nucleoplasm. They exhibited pleiotropic functions such as those related to DNA binding, DNA-binding transcription factor activity, transcription regulator activity, and were primarily involved in the regulation of RNA metabolic processes and macromolecule biosynthetic processes (Figure 1C). The enriched KEGG pathways included Ribosome mTOR signaling pathway. The signaling pathways were also linked to modulation of RNA degradation, and TGF-beta signaling pathway.
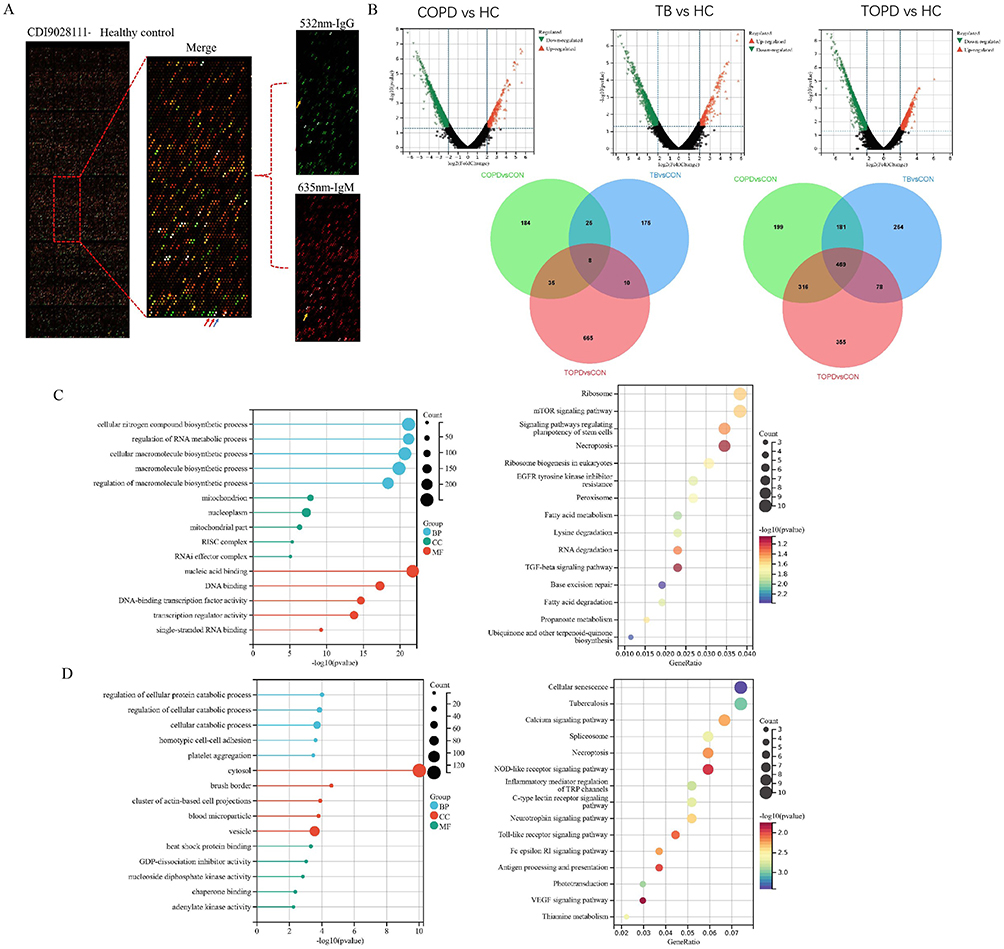 |
Figure 1 Distribution characteristics of IgG autoantibodies in peripheral blood of TOPD patients. (A) Show the chip results for the HC group of samples. The image on the left is the global scan of the chip, and the right is the enlarged image of the local chip (Block10). Among them, the green and red channels are 532 nm-IgG and 635 nm-IgM channels, respectively, which are merged into the composite diagram. The red arrow is the positive control point (human IgM, human IgG), and the blue arrow is the negative control point (Biotin-BSA). Yellow arrows are positive points.(B) Volcano and Venn diagram results. (C) up-regulated IgG autoantibody GO and KEGG results. (D) down-regulated IgG autoantibody GO and KEGG results. |
On the other hand, the down-regulated IgG autoantibodies in TOPD patients predominantly involved the different cellular components such as those associated with cytosol brush border, clusters of actin-based cell projections, and the blood microparticle vesicles. They performed diverse functions like heat shock protein binding, GDP-dissociation inhibitor activity, and nucleoside diphosphate kinase activity. These autoantibodies were mainly associated with the various cellular catabolic processes and homotypic cell-cell adhesion processes. The enriched KEGG pathways included those of cellular senescence, Tuberculosis, Calcium signaling pathway, Spliceosome, NOD-like receptor signaling pathway, and Inflammatory mediator regulation (Figure 1D).
A total of 1181 IgM autoantibodies were found to be differentially expressed, with 486 up-regulated and 695 down-regulated in TOPD patients (Supplementary Figure 1A). Interestingly, in comparison to patients with COPD and TB, 388 IgM antibodies were specifically up-regulated in TOPD, but 250 types exhibited specific down-regulation. GO and KEGG enrichment analyses were conducted to investigate the potential characteristics of the upregulated IgM antibodies. These antibodies were mainly localized in the cellular components such as cytosol and the spectrin-associated cytoskeleton. They exhibited molecular functions including NF-kappaB binding, histone deacetylase activity, and acetyl-CoA binding. Functionally, these antibodies were mainly involved in the control of stress response, negative regulation of protein targeting to the membrane, negative regulation of protein localization to the membrane, and histone H3 deacetylation (Supplementary Figure 1B). The KEGG enriched pathways associated with these antibodies included the cAMP, chemokine signaling pathways, and signaling pathways regulating pluripotency of stem cells (Supplementary Figure 1B). On the contrary, the down-regulated IgM autoantibodies in TOPD patients were localized predominantly in cytosol, intermediate filament cytoskeleton, and polymeric cytoskeletal fibers, and they performed diverse functions such as those of enzyme binding and phosphoprotein phosphatase activity. These antibodies are mainly involved in different processes related to keratinization. The KEGG enriched pathways associated with these down-regulated antibodies included the PI3K-Akt as well as p53 signaling pathways, natural killer cell-mediated pathways, and cytotoxicity (Supplementary Figure 1C).
We next investigated the expression of the various autoantibodies, such as antielastin, proteoglycan, cytokeratin 18/19, CD80, Collagens I, II, and IV, which have been previously implicated in COPD,17 in the samples available in this study. Interestingly, analysis using the HuProtTM protein chip revealed that these autoantibodies were included on the chip but could not be detected in the TOPD group in this study (Table 2). The result suggested that TOPD patients might have specific autoantibodies that are different from those currently involved in the pathogenesis of COPD, which could be used as a biomarker to distinguish TOPD from COPD.
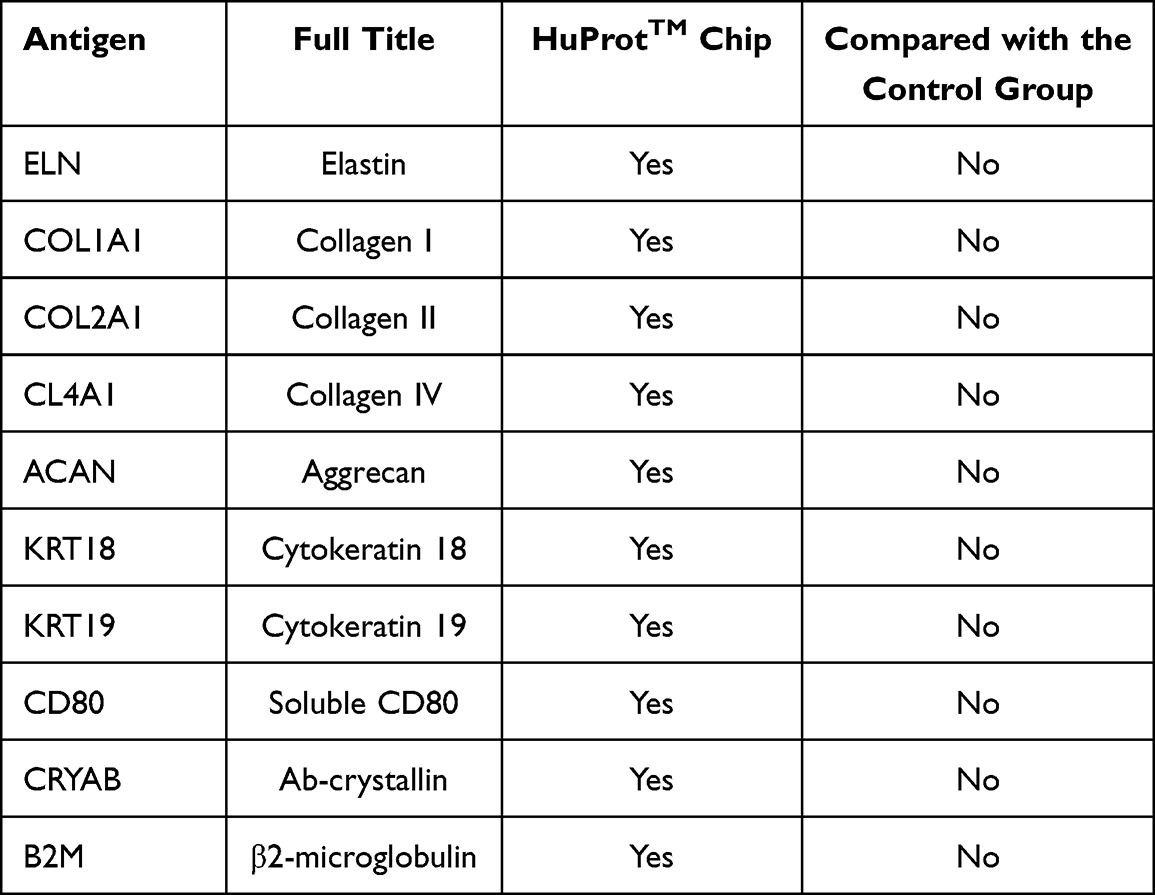 |
Table 2 Expression of Autoantibodies Associated with COPD in This Study |
Distribution Differences of Immune-Associated Autoantibody in TOPD Patient Serum
The various autoantibodies associated with the immune process in TOPD patient serum were further analyzed and the heat map results demonstrated significant differences in the distribution of immune-associated IgG antibodies among all the groups (Figure 2A). Specifically, 44 immune-associated IgG autoantibodies were observed to be markedly up-regulated in TOPD patients. GO and KEGG enrichment analysis revealed that the upregulated IgG autoantibodies primarily involved the MHC class I peptide loading complex. Additionally, different cellular components such as the extracellular region and nuclear envelope were also identified to be involved in regulation of the signaling activity of diverse cell receptors and stimulation of immune response to external stimuli (Figure 2B). On the contrary, the down-regulated IgG autoantibodies were primarily associated with the processes of antigen presentation and modulation of immune response (Figure 2C). Furthermore, significant differences were observed in the distribution of immune-associated IgM antibodies among all the groups (Supplementary Figure 2A). The upregulated IgM autoantibodies were predominantly associated with the extracellular region, proteasome complex as well as other cellular components involved in defense response, response to stress, and immune system processes (Supplementary Figure 2B). Conversely, it was noted that the down-regulated IgM autoantibodies primarily affected the receptor ligand activity and innate immune response (Supplementary Figure 2C).
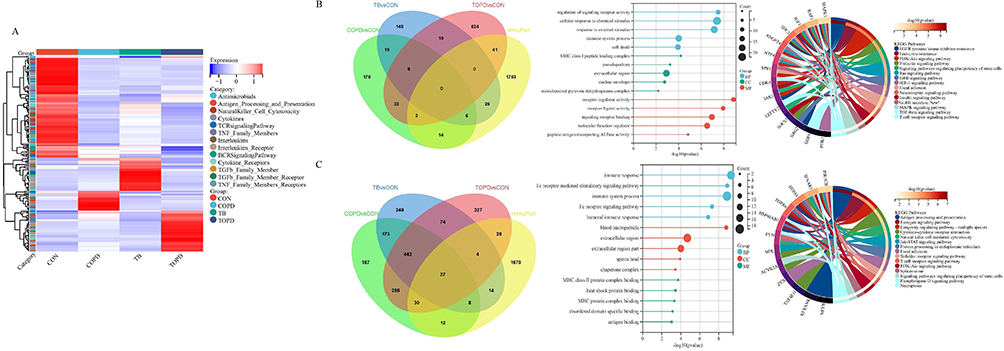 |
Figure 2 Distribution characteristics of immune-related IgG antibodies. (A) Heat maps of differentially expressed IgG autoantibodies. (B) Venn diagram, GO and KEGG results of immune-related up-regulated IgG autoantibodies. (C) Venn diagram, GO and KEGG results of immune-related down-regulated IgG autoantibodies. |
Analysis Results of the Protein-Protein Interaction Network
The protein-protein interaction network analysis, based on the String database, revealed that the autoantibodies associated with the immune process in TOPD patient serum with the highest interaction frequency with IgG autoantibodies was identified as the long non-coding RNA-binding protein antigen (HNRNPC), concomitant with other notable antigens such as proliferating cell nuclear antigen (PCNA), Mitogen Activated Protein Kinase 3 antigen (MAPK3), MCM5 antigen (MCM5), and RNA binding protein LARP7 (LARP7) (Figure 3A). Moreover, regarding IgM autoantibodies, the most prominent interactions were observed with heterogeneous autoantigens like long-chain non-coding serine/threonine protein kinase 1 antigen (AKT1), epidermal growth factor receptor antigen (EGFR), RuvB-like 1 (RUVBL1), Streptococcus mutans phosphoribose glycinamide transformylase antigen (GART), serine/threonine protein kinase 2 (AKT2), and TCP1 chaperone subunit 7 (CCT7), among others (Figure 3B).
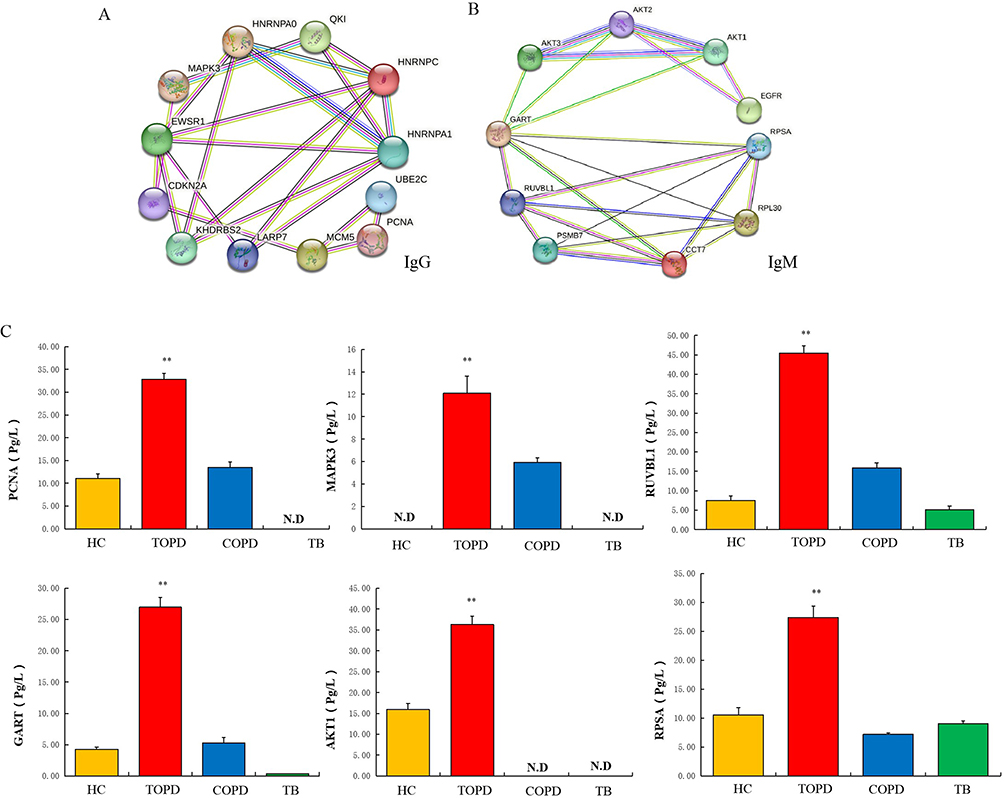 |
Figure 3 (A) Results of protein-protein interaction network analysis of IgG autoantibody proteins. (B) Results of protein-protein interaction network analysis of IgM autoantibody proteins. (C) Level of PCNA, MAPK3, RUVBL1, GART, AKT1 and RPSA autoantibodies in HC, TOPD, COPD and TB group.Data are shown as mean ± SEM. **P < 0.01. |
To assess the potential expression of proteins, an enzyme-linked immunosorbent assay (ELISA) was performed on the serum samples obtained from 50 individuals in the control group, 53 individuals with tuberculosis, 57 individuals with COPD, and 44 individuals with tuberculosis combined with COPD. The results indicated significantly higher expression levels of the autoantigens associated with PCNA, MAPK3, RUVBL1, GART, AKT1, and RPSA in the TOPD group. These findings were consistent with the results obtained from the autoantibody analysis conducted on a large sample using a protein chip. Specifically, PCNA, MAPK3, GART, and AKT1 were found to be specifically expressed in TOPD and thus can serve as specific antibodies for the clinical detection of TOPD (Figure 3C).
Identification of Epitopes
Property Analysis of Antigenic Peptides
The selection of the various proteins included PCNA from the Gen Bank database (Gen Bank_Q01844), MAPK3 (Gen Bank_Q1664), and the amino acid sequences of GART (Gen Bank_P22102) and AKT1 (Gen Bank_P31749). An online antigen prediction software, Vaxijen v2.0, was employed to predict the antigenicity of these proteins. The results indicated that overall protective antigen predictions for PCNA was (0.5563), MAPK3 (0.5757), GART (0.4742), and AKT1 (0.5520). Antigen scores of ≥0.5 and amino acid lengths ≥100 suggested strong antigenicity and appropriate peptide chain lengths, thereby indicating that PCNA, MAPK3, and AKT1 were suitable for the subsequent antigenic peptide prediction.
The Phyre2 system was used to predict the three-dimensional structures of the selected antigenic peptides, which were subsequently evaluated using the SWISS-MODEL system. The protein sequences were used for the prediction of CTL, Th cells and linear B cells antigenic peptides, whereas the three-dimensional structures were employed to predict the antigenic peptides of the structural B cells. The optimal models for PCNA, MAPK3, and AKT1 were individually selected (Table 3), and then their respective optimized 3D models were generated (Figure 4A). Finally, the SWISS-MODEL system was utilized to obtain evaluation results (Figure 4B), which confirmed that all these antigenic peptides were located within the trusted region, thus indicating their reliability.
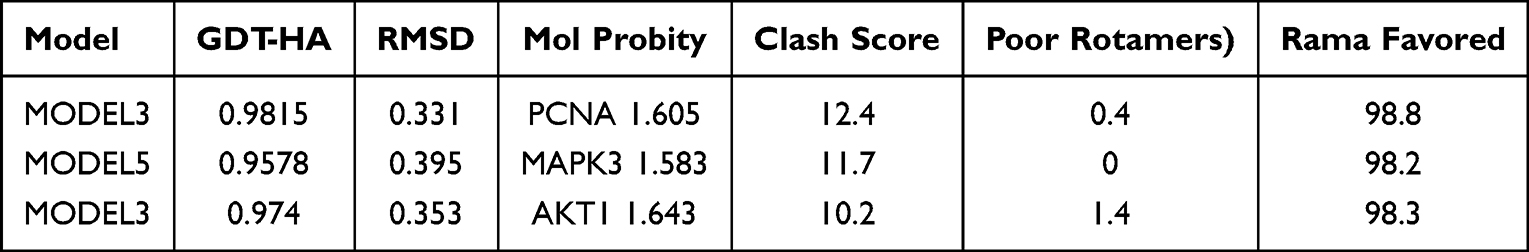 |
Table 3 Structure Information on Galaxy Refine |
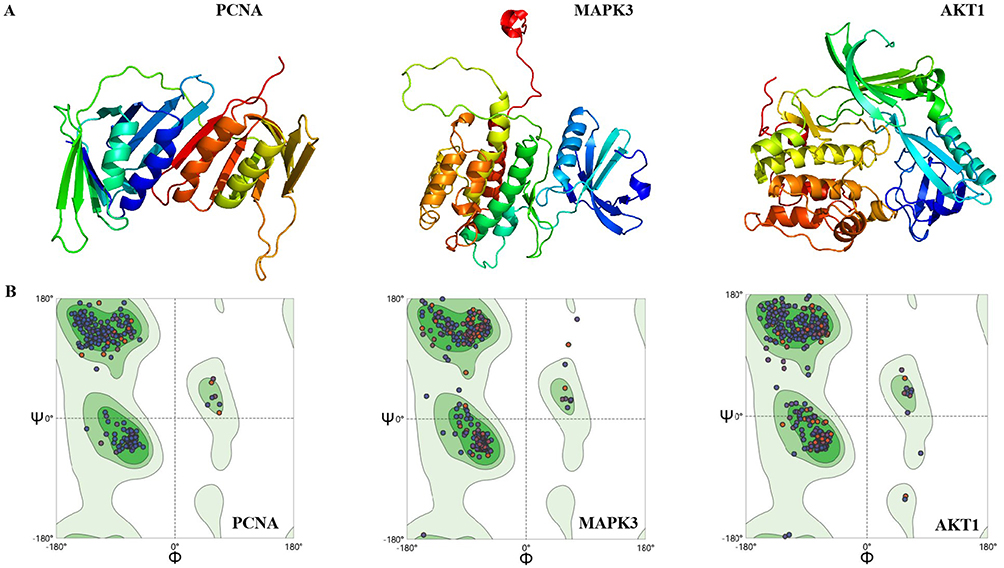 |
Figure 4 (A) Candidate model generated by the Galaxy Refine server, (B) 3D protein model shown by the Ramachandran diagram. |
Identification of CTL Epitopes
To achieve epitope coverage for 90% of the global population, three different subtypes (A2, A3, and B7) were considered for the prediction of CTL epitopes. Based on the highest predicted scores and an IC50 < 500 nM (representing various epitopes with strong binding affinity to MHC molecules), one epitope was selected from each antigenic peptide. Nine epitopes were thereafter chosen accordingly (Table 4).
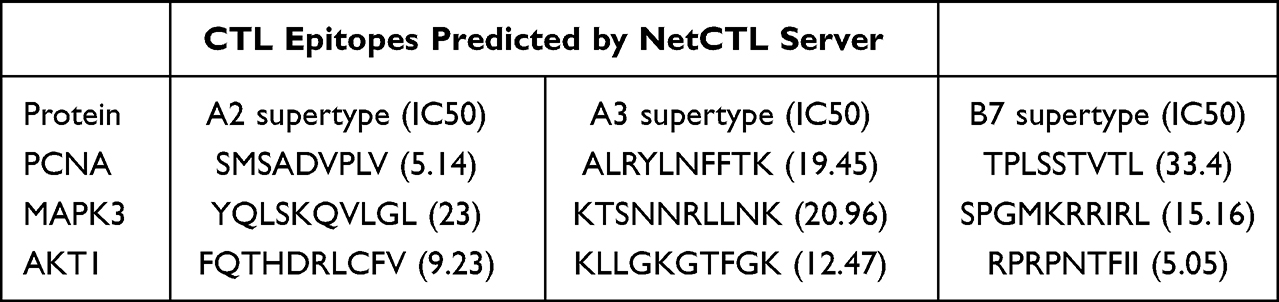 |
Table 4 PCNA, MAPK3 and AKT1 CTL Epitopes Prediction |
Prediction of Epitopes in Th Cells
Three distinct HLA subtypes, namely HLADR, HLA-DQ, and HLA-DP, were selected for the prediction of Th cells epitopes. Based on the IC50 < 500 nM criterion for each protein, a total of 17 epitopes were further chosen (Table 5).
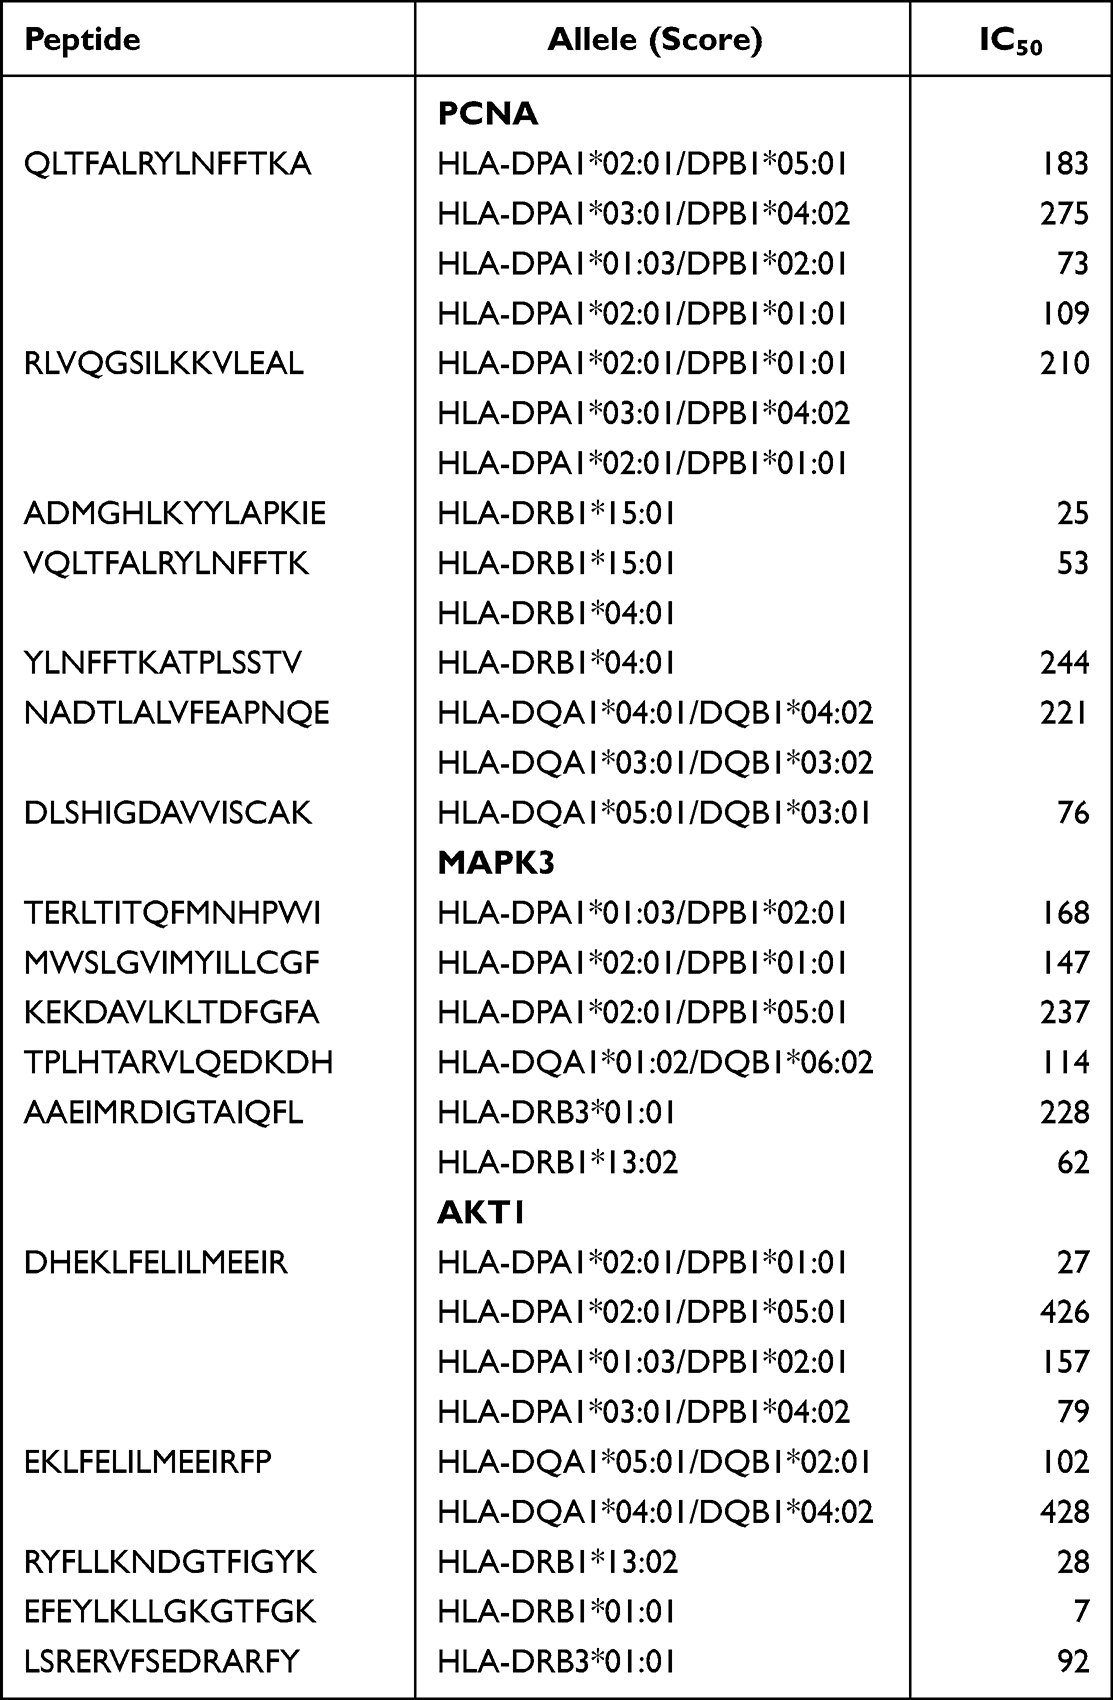 |
Table 5 Th Epitopes of PCNA, MAPK3 and AKT1 Antigenic Peptides |
Prediction of Epitopes in B Cells
In this study, a careful selection of five linear antigenic peptides with appropriate chain lengths and low scores was carried out for PCNA, MAPK3, and AKT1 (Table 6). Additionally, ten structural antigenic peptides (Table 7) and their corresponding 3D models (Supplementary Figure 3) were also selected for further analysis.
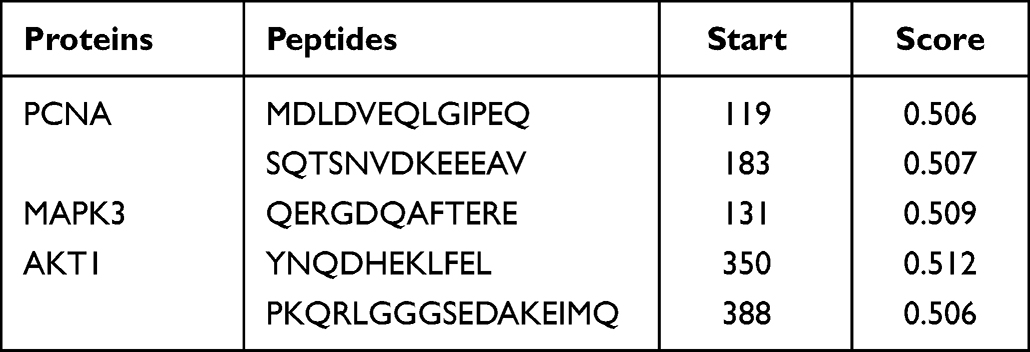 |
Table 6 Linear Antigenic Peptides in B Cells and Scores |
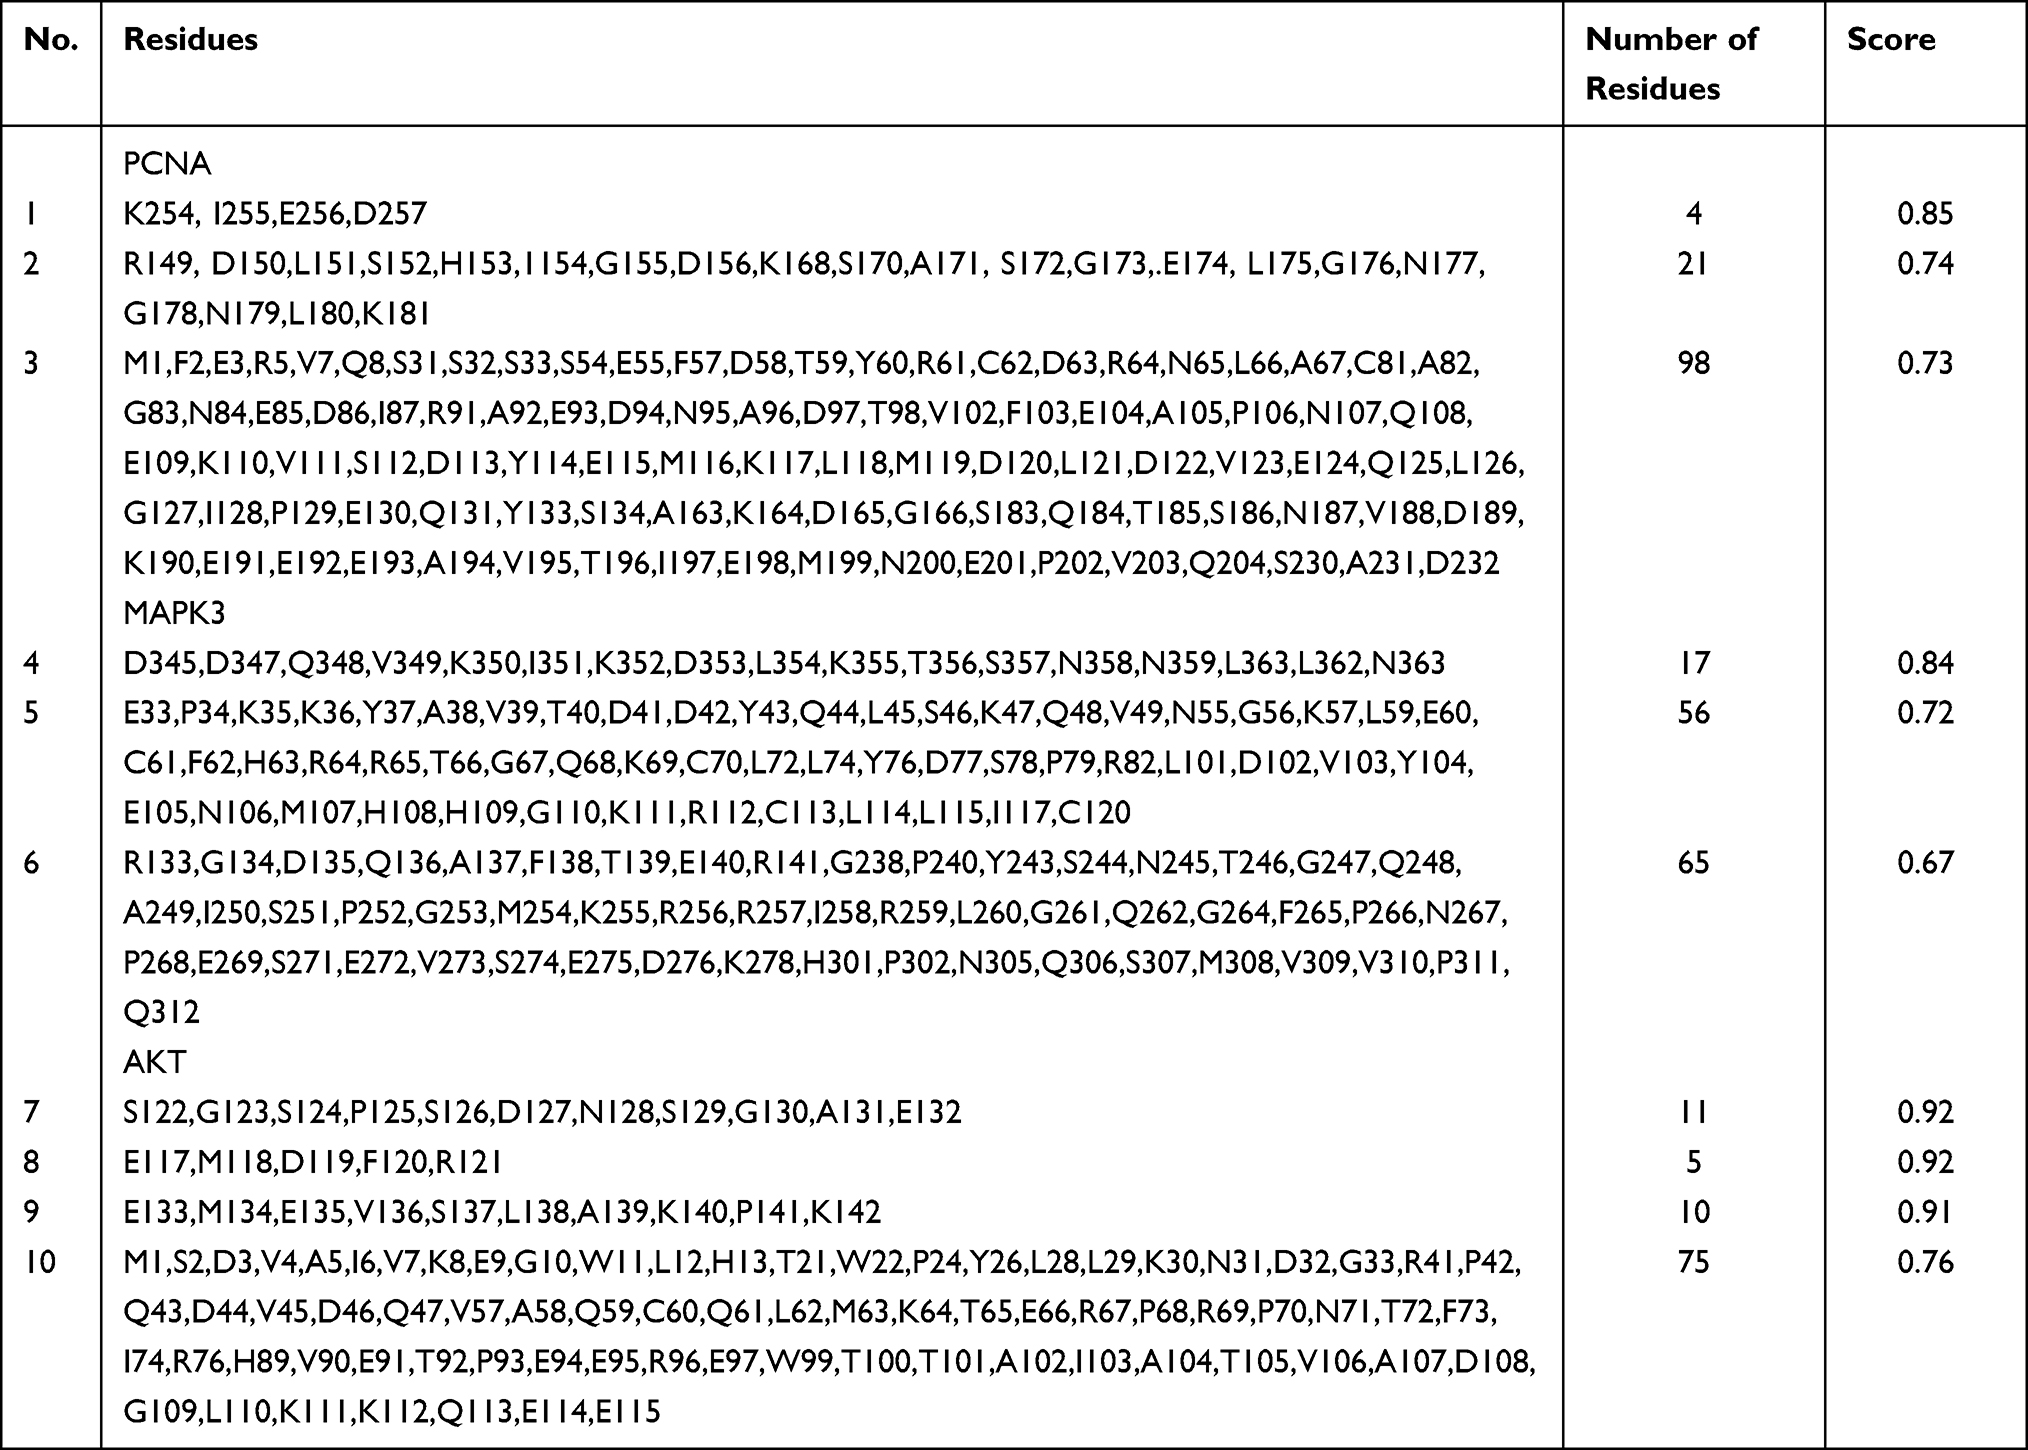 |
Table 7 Predicted Discontinuous Epitopes |
Immune Simulation
The immune simulation results demonstrated that PCNA, MAPK3, and AKT1 could effectively stimulate the innate immune system and triggered the innate immune response. Upon stimulation by PCNA, MAPK3, and AKT1, the population of NK cells exhibited a gradual increase, reaching its peak count on day 10 (Figure 5A). On the contrary, the dendritic cells (DCs) reached their maximum count on day 23, primarily in the form of resting cells. DCs in the presenting suppl-2 state peaked on day 2 and then subsequently declined (Figure 5B). Macrophages, along with DCs can play a vital role in clearing infected cells. Our findings indicated that presenting-2 macrophages began to proliferate on day 2, followed by a gradual decline. Once presenting-2 macrophages reached their peak, the population of the active macrophages increased, reaching a sustained high level of activation on day 7 (Figure 5C). Moreover, it was observed that PCNA, MAPK3, and AKT1 all exhibited sustained high activity in epithelial cells (Figure 5D).
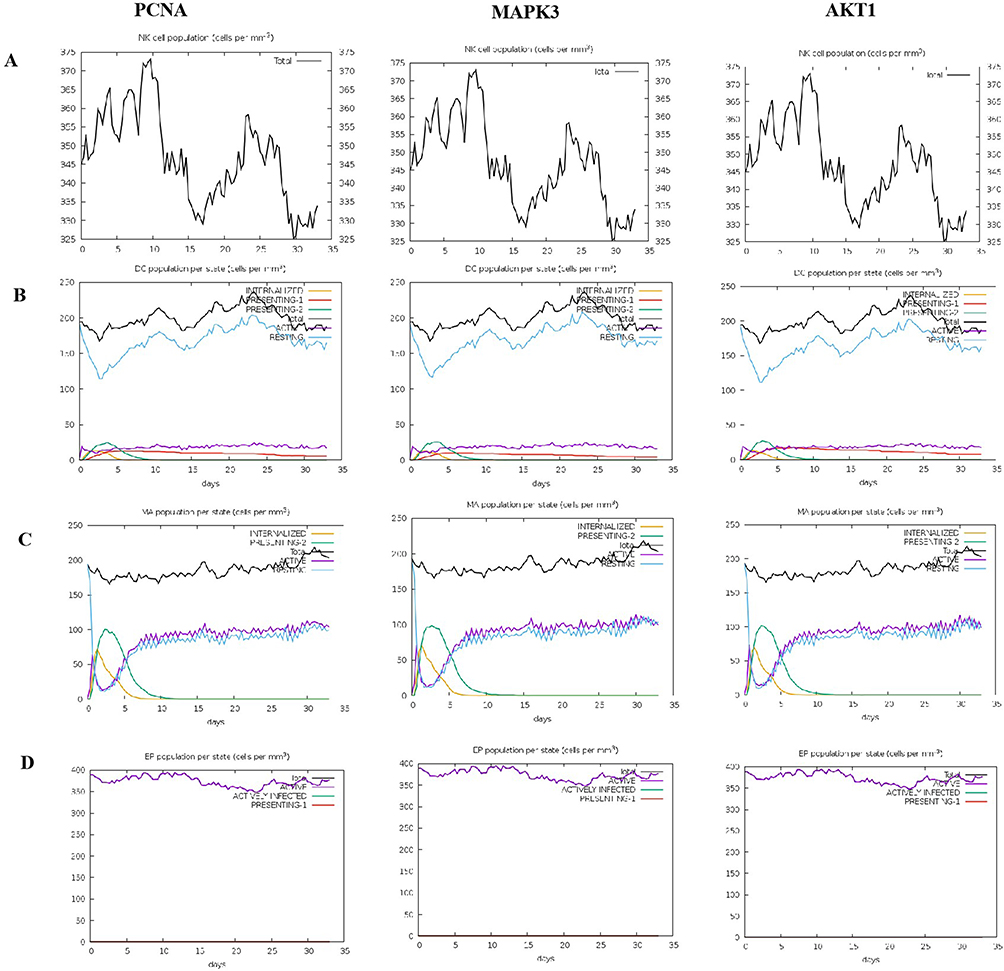 |
Figure 5 The innate immune responses induced by PCNA, MAPK3, and AKT1 in C-ImmSim server. (A) Expression of NK cells after antigen stimulation. (B) Expression of DC cells (black) after antigen stimulation. (C) Expression in macrophages (black) after antigen stimulation. (D) Secretion from active epithelial cells (purple) after antigen stimulation. |
According to the C-ImmSim prediction, B lymphocytes primarily displayed antigen-presenting function during the initial stage following PCNA stimulation (Figure 6A). It was found that on day 12, B cells produced elevated levels of IgG and IgM antibodies (Figure 6B). PCNA stimulated the proliferation of both the memory and non-memory CD4+T lymphocytes (Figure 6C). Moreover, the number of Treg cells increased gradually and peaked on the 7th day, but the number of non-memory cytotoxic T cells exhibited a gradual increase and reached its peak on the 13th day (Figure 6D and E). Conversely, the memory cytotoxic T cells remained at equilibrium without exhibiting any significant change (Figure 6F). Furthermore, cytotoxic T lymphocytes gradually became active, gradually reaching their peak on day 30 after stimulation, whereas resting cytotoxic T lymphocytes showed the opposite trend (Figure 6G). Our results also demonstrated that PCNA induced high levels of IFN-g and IL-2 (Figure 6H). The predictions for MAPK3 and AKT1 also aligned with those of PCNA (results not shown).
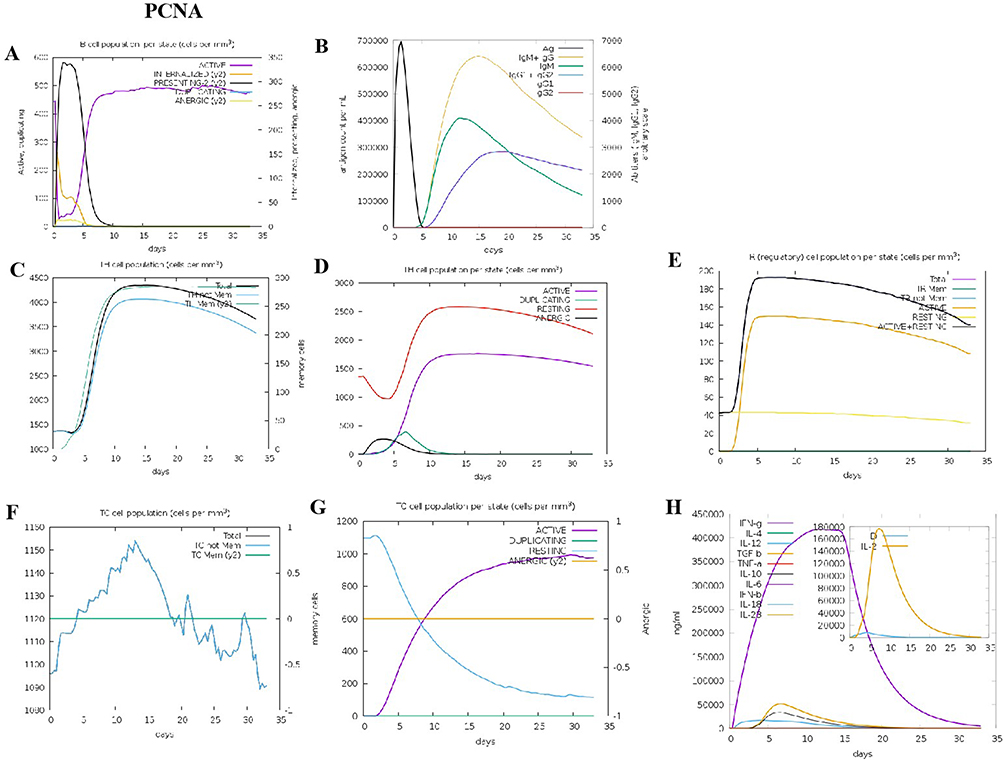 |
Figure 6 The adaptive immune responses induced by PCNA in C-ImmSim server. (A) Active B cell (purple) secretion after antigen stimulation. (B) The primary B cell antibody produced after antigen stimulation is IgM + IgG (yellow) changes over time. (C and D) Changes in the secretion level of helper T lymphocytes and the secretion levels of helper T lymphocytes of different memory types. (E) Changes in Treg T cell secretion after antigen stimulation. (F and G) Changes in the level of CD8+T secretion after antigen stimulation and the secretion of different types of CD8+T cells. (H). Changes in secretion levels of cytokines, mainly IFN-g (purple) and IL-2 (yellow). |
Changes of Immunocytes in the Peripheral Blood of TOPD Patients
Immune cell dysregulation plays a pivotal role in the development and progression of autoimmune diseases.23 In this study, flow cytometry was employed to monitor the possible changes in immune cell populations, including Th1, Th2, Th17, Treg, ILC1, ILC2, ILC3, M1, and M2 macrophages, in the peripheral blood of patients with TOPD. It was observed that comparable to COPD, TOPD patients exhibited an upward trend in Th1 cells but showed a decrease in Th2 cells, but the proportion of Th17 cells did not display significant statistical variation (Figure 7A). Additionally, the proportion of Treg cells in TOPD patients did not display a significant increase. (Figure 7B).
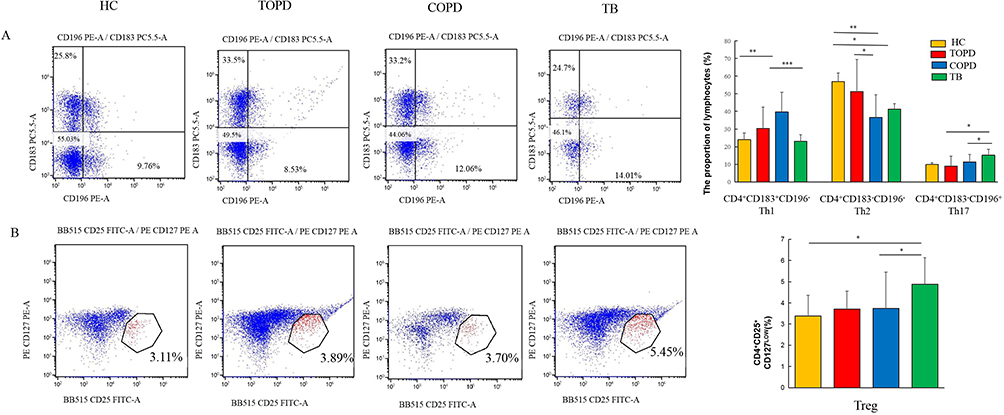 |
Figure 7 Th cells and Treg cell in different groups. (A) Level of Th1(CD183+CD196−),Th2(CD183− CD196−), Th17(CD183−CD196+) cells in HC, COPD, TB, and TOPD group. (B) Level of Treg cell in HC, COPD, TB, and TOPD group. Data are shown as mean ± SEM.*P < 0.05, **P < 0.01, ***P < 0.001. |
The findings regarding innate lymphocyte subsets indicated a significant decrease in the proportion of ILC1 cells in COPD patients in comparison to the control group (P < 0.05). Although there was no significant difference noted in the proportion of ILC1 cells in TOPD patients, a similar downward trend was observed as in COPD patients. The proportion of ILC2 cells increased to varying degrees in both TOPD and COPD patients, although no statistical difference was observed. In contrast, ILC2 cells were significantly decreased in the TB group. Additionally, compared to the control group, ILC3 cells decreases in both TOPD and COPD groups, but without statistical significance, whereas ILC3 cells were significantly increased in TB patients (P < 0.01) (Figure 8).
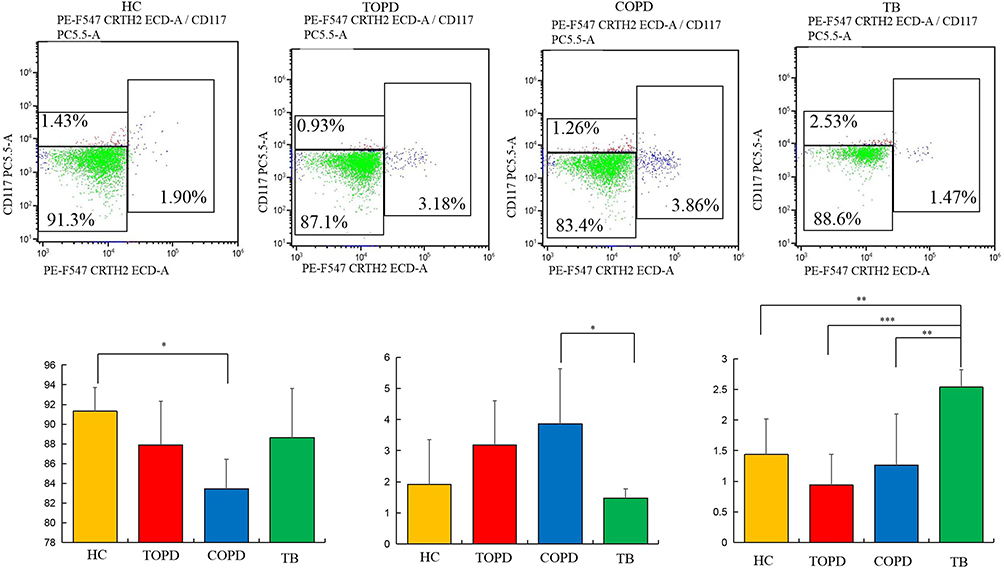 |
Figure 8 ILC cells in different groups. Level of ILC1 (Lin−CD45+CD127+CRTH2−CD117−),ILC2(Lin−CD45+CD127+ CRTH2+CD117±), and ILC3(Lin−CD45+CD127+CRTH2−CD117+) cells in HC, COPD, TB, and TOPD group. Data are shown as mean ± SEM.*P < 0.05, **P < 0.01, ***P < 0.001. |
For macrophages, no statistical difference was observed between each group as well as the control group. Interestingly, compared to the control group, M2 macrophages demonstrated a decreasing trend in TOPD and COPD patients, although without statistical significance. Notably, TB patients exhibited the smallest proportion of M2 macrophages (P < 0.01) (Figure 9).
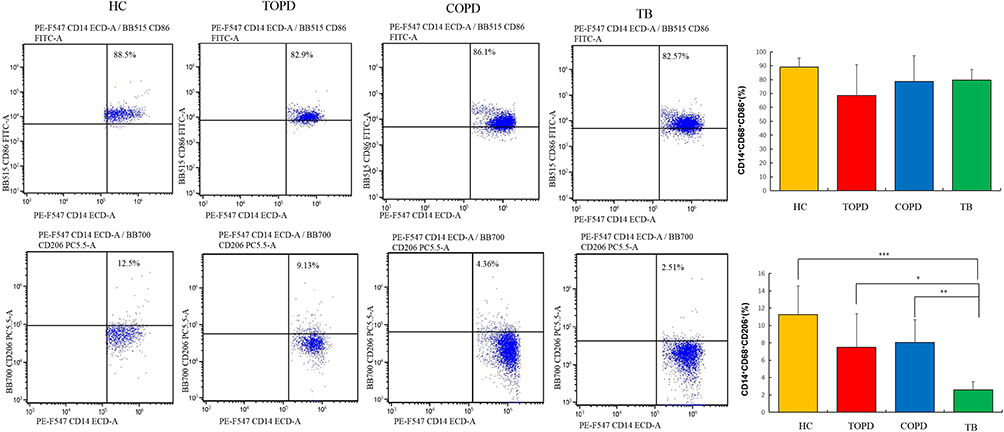 |
Figure 9 Macrophage cells in different groups. Level of M1(CD14+CD68+CD86+), M2(CD14+CD68+CD206+) cells in HC, COPD, TB, and TOPD group. Data are shown as mean ± SEM.*P < 0.05, **P < 0.01, ***P < 0.001. |
IFN-γ Was Highly Expressed in Peripheral Blood of TOPD Patients
ELISA method was employed to assess the expression of IFN-γ, IL-4, IL-17a, and IL-10 in the peripheral blood serum of all individuals belonging to the TB, TOPD, COPD, and HC groups (Figure 10). The results demonstrated a significantly elevated expression level of IFN-γ in TOPD, in comparison to the HC group (P < 0.01). Regarding IL-4 and IL-17A expression levels, no significant changes were observed in TOPD in comparison to the HC group. However, the expression level of IL-10 was significantly lower in the TOPD group than in both the HC and TB groups (P < 0.05).
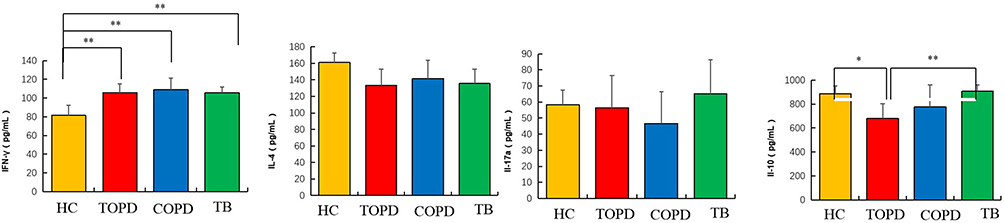 |
Figure 10 IFN-γ was highly expressed in peripheral blood of TOPD patients. Serum IFN-γ, IL-4, IL-17a and IL-10 expression in patients with TB, TOPD, COPD and healthy controls. Data are shown as mean ± SEM.*P < 0.05, **P < 0.01. |
Discussion
TOPD is a condition primarily characterized by irreversible airflow restriction that occurs during or after anti-tuberculosis treatment.24 A number of studies have demonstrated that significantly elevated levels of white blood cell count, C-reactive protein, and partial pressure of carbon dioxide are present in the peripheral blood of individuals with a history of tuberculosis compared to those without tuberculosis,25,26 Tuberculosis history can lead to pulmonary fibrosis and result in obstructive or restrictive ventilation dysfunction in patients with cavitation, tractive bronchiectasis, bronchial stenosis, or parenchymal lung destruction.27–29 In recent years, several researchers have investigated several potential pathogenic mechanisms associated with TOPD, including small airway obstruction, chronic inflammation, bronchiectasis, lung parenchymal destruction etc. However, further elucidation of the underlying mechanisms of disease occurrence and development is still necessary.
According to the finding of a previous study, mycobacterial infection serves as one of the environmental triggers that can initiate autoimmunity.30 The role of autoimmunity in occurrence of chronic airway diseases such as asthma and COPD has also gained attention in recent years.31,32 At present, autoimmune diseases mainly focus on targeting the inhibition of B cells or autoreactive T cells,33 enhancing the function of specific Treg cells,34 and neutralizing or modifying antibodies. The types of autoantibodies help to guide the treatment, so the search for new and characteristic autoantibodies has important clinical significance for the targeted therapy of TOPD. In this study, we have employed the HuProtTM protein chip, containing approximately 20,000 proteins, to effectively screen for TOPD, tuberculosis, COPD, and the control group. In addition, after comparing the differential expression of the different autoantibodies present in TOPD patients and the control group, we have constructed a TOPD autoantibody profile.
The results of our study revealed a significantly higher incidence of down-regulated IgG and IgM autoantibodies in TOPD patients compared to the control group. Interestingly, Ma et al have previously reported lower levels of autoantibodies in smokers with COPD compared to non-smokers with COPD,32 Moreover, other studies have shown that healthy individuals possess relatively high levels of autoantibodies against specific antigens, but patients with autoimmune diseases such as multiple sclerosis exhibit no significant increase in autoantibody production in comparison to the healthy individuals.35,36 As autoantibody can play a vital role in maintenance of tissue homeostasis by clearing the cell debris, relatively down-regulated autoantibody in TOPD patients might lead to an imbalance in tissue homeostasis and promote disease development, but this effect still needs to be further explored.
It has been demonstrated that non-cigarette derived antigens, including anti-extracellular matrix proteins, anti-cytokeratin, anti-immune molecules, and other antibodies, could be associated with COPD.16,17,37,38 These antibodies are substantially elevated in COPD patients, and some of them are correlated with the COPD phenotype.14 Therefore, in this study, we have investigated the potential expression of these specific autoantibodies in TOPD patients. Although these autoantibodies were present on the HuProtTM protein chip, we compared them not only to the control group but also to tuberculosis, COPD, and the control group. Surprisingly, these antibodies were not found to be expressed in TOPD patients. A number of studies have shown that TB patients or other autoimmune diseases involved in Tb have different specific autoantibody profiles.30,39 In summary, this study provides sound evidence that the previously identified autoantibodies associated with COPD were not expressed in TOPD patients. These findings shed important light on the unique characteristics of autoantibody profiles in TOPD patients and reveal potential mechanisms underlying the development and progression of the disease. However, further research is necessary to delve deeper into these mechanisms and validate these findings.
When comparing TOPD patients with the TB group, the COPD group, and the control group, we found marked up-regulation of both IgG and IgM autoantibodies in TOPD patients. This up-regulation was associated with the distinct cellular localization and biological functions. Specifically, the autoantigens targeted by the upregulated antibodies in TOPD patients appeared to be enriched in several intracellular compartments such as the nucleus and cytoplasm. These autoantigens were predominantly involved in processes related to the regulation of messenger ribonucleoprotein complex, peroxisome, microbody, microtubule, and cytoplasmic particle pressure. Moreover, further analysis using the KEGG pathway database revealed that the upregulated IgG autoantibodies in TOPD patients were mainly associated with the lipid metabolism pathway, lysosome activity, and amino acid metabolism. Interestingly, studies have found that lipid molecules can stimulate innate-like B-1 B cells to antibody production, and the IgM production by B-1 B cells requires long-term stimulation by lipid antigens of the replicating mycobacteria.40 Moreover, in certain situations, lipid molecules have been used as adjuvants in animal models of autoimmune diseases.41 Therefore, the above described metabolic pathways observed by us may play a pivotal role in the progression of TOPD autoimmunity. Additionally, our results showed that these autoantibodies exhibited potential involvement in different signaling pathways, including MAPK, Toll-like receptor signaling, and T and B cell differentiation.
A number of previous studies have indicated that an imbalance of Th and Ts cells often accompanies the autoimmune response in tuberculosis and the corresponding epitopes of these cells can play a critical role in regulation of this process,42 Thus, accurate prediction of the various epitopes that can activate immunocytes holds immense significance for deciphering the molecular mechanisms underlying autoimmune response in individuals with TOPD. Such predictions can also provide valuable insights related to the research and development of targeted antibodies. In this study, we have employed ELISA to detect the core interacting autoantibodies identified through protein-protein interaction (PPI) analysis. Our results indicated specific expression of PCNA, MAPK3, and AKT1 in TOPD patients. Subsequently, we conducted epitope prediction and immune activation analysis. Specifically, we were able to predict 9 and 17 distinct epitope sequences in CTL and Th cells, respectively, as well as 5 linear epitope peptides in B cells, thereby indicating their developmental potential for these three proteins. In addition, 10 different structural antigenic peptides derived from B cells were identified. Immune simulation results demonstrated that PCNA, MAPK3, and AKT1 not only could induce epithelial cells to maintain high activity but also efficiently stimulated the innate immune system to induce an immune response but also promoted a robust Th1 adaptive immune response, thus resulting in elevated levels of cytokines such as IFN-γ and IL-2.
Mtb, which can enhance activation of macrophages) as well as dendritic cells (DCs) and promote Th1 protective response against intracellular pathogens is prone to producing autoantibodies.43 Moreover, the prolonged exposure of Toll-like receptors on the macrophages and dendritic cells (DCs) to autoantigens as well as endothelial cells can lead to their activation, differentiation into epithelioid cells, and the subsequent secretion of diverse cytokines such as TNF-α and IL-1. DCs carrying antigens can effectively migrate to the lymph nodes and present them to the T lymphocytes. Once activated, T lymphocytes differentiate into various subsets, including CD4+, CD8+, Th7, and Treg cells, which can effectively proliferate and migrate to the different inflammatory sites.44,45 In this study, immune simulation results showed that autoantigen can stimulate macrophages and DCs cells. In addition, reduced frequency of anti-inflammatory M2 macrophages or prolonged activation of M1 macrophages may be associated with the development of detrimental inflammation and autoimmunity.46 However, the results of flow cytometry showed that the changes of M1 and M2 cells in TOPD patients were not significant.
Numerous clinical studies have provided evidence that antigens obtained from Mtb can interact with the host, thus leading to the activation of autoreactive T cells and the production of diverse cytokines such as IFN-γ. TNF-α, which in turn, can promote autoimmune inflammatory responses, thereby aggravating the course of tuberculosis and other related diseases.12,47 Additionally, Mtb can cause extensive destruction of the extracellular matrix, thereby resulting in the release of novel potential autoreactive epitopes derived from the collagen and elastin and further intensify autoimmune response.30,48 Furthermore, flow cytometry results confirmed significant upregulation of Th1 cells in the peripheral blood of TOPD patients. Although prior studies have implicated the role of ILC in the pathogenesis of autoimmune diseases, no clear trend was observed in this study.
In conclusion, our findings shed important light on the complex immunopathogenesis of tuberculosis and provide novel insights into the autoimmune response mechanisms in patients with TOPD. Overall, understanding the various epitopes involved in immunocyte activation and the subsequent immune responses can pave the way for the development of targeted therapies. However, further research is necessary to validate these predictions and completely elucidate the therapeutic potential of targeting PCNA, MAPK3, and AKT1 in TOPD. Nevertheless, the clinical case collection in this study was relatively small and only the differential autoantibodies related to immunity were analyzed, which has certain limitations and defects.Unfortunately, due to technical and experimental limitations, it was not possible to obtain airway tissues from patients with TOPD in the short term, nor establish TOPD animal models. Therefore, this study is limited to the analysis of immune cell subsets in peripheral blood and the prediction of autoantigen epitopes in TOPD patients. As a result, we were unable to analyze the immune cell subsets in airway tissues of TOPD patients or verify the dominance of autoantigen epitopes. This deficiency and insufficiency of the study should be noted.
Conclusions
The pathogenesis of TOPD was investigated in terms of the autoimmune response. The findings indicated that tuberculosis infection can trigger an autoimmune response, leading to immune dysfunction and increased expression of Th1 cells as well as their associated cytokines. Furthermore, the accumulation of pulmonary inflammatory responses could initiate a cascade of pulmonary pathological processes, ultimately facilitating the progression of TOPD. Since Mycobacterium tuberculosis has the potential to induce autoimmune processes, targeting autoimmunity and its related symptoms could be crucial in predicting and clinically treating TOPD. Further study related to the production and the possible biological mechanisms of autoantibody may be one of the future research directions.This may lead to the development of new therapeutic targets and strategies.
Author Contributions
All authors made a significant contribution to the work reported, whether that is in the conception, study design, execution, acquisition of data, analysis and interpretation, or in all these areas; took part in drafting, revising or critically reviewing the article; gave final approval of the version to be published; have agreed on the journal to which the article has been submitted; and agree to be accountable for all aspects of the work.
Funding
This work was supported by the Xinjiang Uyghur Autonomous Region Key Laboratory Open Subjects[Project No: 2022D04022], the National Natural Science Foundation Regional Fund Project [grant numbers 81760793, 82060015], and theTianshan talent Training Program of Xinjiang Uygur Autonomous Region [grant numbers 2022TSYCCX0107].
Disclosure
The authors declare that they have no competing interests in this work.
References
1. Kheradmand F, Zhang Y, Corry DB. Contribution of adaptive immunity to human COPD and experimental models of emphysema. Physiol Rev. 2023;103(2):1059–1093. doi:10.1152/physrev.00036.2021
2. Aggarwal D, Gupta A, Janmeja AK, et al. Evaluation of tuberculosis-associated chronic obstructive pulmonary disease at a tertiary care hospital: a case-control study. Lung India. 2017;34(5):415–419. doi:10.4103/lungindia.lungindia_522_16
3. Mp S, Mohanty Mohapatra M, Mahesh Babu V, et al. Metabolic syndrome in post-pulmonary tuberculosis-associated obstructive airway disease: a cross-sectional analytical study. Cureus. 2022;14(3):e23640. doi:10.7759/cureus.23640
4. Christenson SA, Smith BM, Bafadhel M, et al. Chronic obstructive pulmonary disease. Lancet. 2022;399(10342):2227–2242. doi:10.1016/S0140-6736(22)00470-6
5. Allwood BW, Myer L, Bateman ED. A systematic review of the association between pulmonary tuberculosis and the development of chronic airflow obstruction in adults. Respiration. 2013;86(1):76–85. doi:10.1159/000350917
6. Starshinova A, Malkova A, Zinchenko Y, et al. Identification of autoimmune markers in pulmonary tuberculosis. Front Immunol. 2022;13:1059714. doi:10.3389/fimmu.2022.1059714
7. Belyaeva IV, Kosova AN, Vasiliev AG. Tuberculosis and autoimmunity. Pathophysiology. 2022;29(2):298–318. doi:10.3390/pathophysiology29020022
8. Chen S, Chen J, Chen L, et al. Mycobacterium tuberculosis infection is associated with the development of erythema nodosum and nodular vasculitis. PLoS One. 2013;8(5):e62653. doi:10.1371/journal.pone.0062653
9. Hardy R. R B-1 B cell development. J Immunol. 2006;177(5):2749–2754. doi:10.4049/jimmunol.177.5.2749
10. Campisi L, Barbet G, Ding Y, et al. Apoptosis in response to microbial infection induces autoreactive TH17 cells. Nature Immunol. 2016;17(9):1084–1092. doi:10.1038/ni.3512
11. Schrijver B, Hardjosantoso H, Ten Berge J, et al. No evidence for circulating retina specific autoreactive T-cells in latent tuberculosis-associated uveitis and sarcoid uveitis. Ocul Immunol Inflamm. 2021;29(5):883–889. doi:10.1080/09273948.2019.1698752
12. Tagirasa R, Parmar S, Barik MR, et al. Autoreactive T cells in immunopathogenesis of TB-associated uveitis. Invest Ophthalmol Vis Sci. 2017;58(13):5682–5691. doi:10.1167/iovs.17-22462
13. Kuo CJ, Ptak CP, Hsieh CL, et al. Elastin, a novel extracellular matrix protein adhering to mycobacterial antigen 85 complex. J Biol Chem. 2013;288(6):3886–3896. doi:10.1074/jbc.M112.415679
14. Patel KJ, Cheng Q, Stephenson S, et al. Emphysema-associated autoreactive antibodies exacerbate post-lung transplant ischemia-reperfusion injury. Am J Respir Cell Mol Biol. 2019;60(6):678–686. doi:10.1165/rcmb.2018-0224OC
15. Curtis JL, Freeman CM, Hogg JC. The immunopathogenesis of chronic obstructive pulmonary disease: insights from recent research. Proc Am Thorac Soc. 2007;4(7):512–521. doi:10.1513/pats.200701-002FM
16. Luo XM, Liu XY, Tang JH, et al. Autoantibodies against CD80 in patients with COPD. Clin Transl Immunol. 2016;5(10):e103. doi:10.1038/cti.2016.57
17. Wen L, Krauss-Etschmann S, Petersen F, et al. Autoantibodies in chronic obstructive pulmonary disease. Front Immunol. 2018;9:66. doi:10.3389/fimmu.2018.00066
18. Nakiyingi L, Nankabirwa H, Lamorde M. Tuberculosis diagnosis in resource-limited settings: clinical use of GeneXpert in the diagnosis of smear-negative PTB: a case report. Afr Health Sci. 2013;13(2):522–524. doi:10.4314/ahs.v13i2.46
19. Li FS, Zhang YL, Li Z, et al. Randomized, double-blind, placebo-controlled superiority trial of the Yiqigubiao pill for the treatment of patients with chronic obstructive pulmonary disease at a stable stage. Exp Ther Med. 2016;12(4):2477–2488. doi:10.3892/etm.2016.3680
20. Johannet P, Liu W, Fenyo D. Baseline serum autoantibody signatures predict recurrence and toxicity in melanoma patients receiving adjuvant immune checkpoint blockade. Clin Cancer Res. 2022;28(18):4121–4130. doi:10.1158/1078-0432.CCR-22-0404
21. Cheng P, Wang L, Gong W. In silico analysis of peptide-based biomarkers for the diagnosis and prevention of latent tuberculosis infection. Front Microbiol. 2022;13:947852. doi:10.3389/fmicb.2022.947852
22. Soria-Guerra RE, Nieto-Gomez R, Govea-Alonso DO, et al. An overview of bioinformatics tools for epitope prediction: implications on vaccine development. J Biomed Inform. 2015;53:405–414. doi:10.1016/j.jbi.2014.11.003
23. Place DE, Kanneganti T-D. Place D EKanneganti T D The innate immune system and cell death in autoinflammatory and autoimmune disease. Curr Opin Immunol. 2020;67:95–105. doi:10.1016/j.coi.2020.10.013
24. Sarkar M, Madabhavi I, Kumar K. Tuberculosis associated chronic obstructive pulmonary disease. Clin Respir J. 2017;11(3):285–295. doi:10.1111/crj.12621
25. Yakar HI, Gunen H, Pehlivan E, et al. The role of tuberculosis in COPD. Int J Chron Obstruct Pulmon Dis. 2017;12:323–329. doi:10.2147/COPD.S116086
26. Katare S, Harsha A. Correlations between inflammatory biomarkers in tuberculosis-associated obstructive pulmonary disease patients with anxiety and depression. Cureus. 2022;14(3):e22742. doi:10.7759/cureus.22742
27. Oh JY, Lee YS, Min KH, et al. Difference in systemic inflammation and predictors of acute exacerbation between smoking-associated COPD and tuberculosis-associated COPD. Int J Chron Obstruct Pulmon Dis. 2018;13:3381–3387. doi:10.2147/COPD.S177371
28. Park HJ, Byun MK, Kim HJ. History of pulmonary tuberculosis affects the severity and clinical outcomes of COPD. Respirology (Carlton, Vic). 2018;23(1):100–106. doi:10.1111/resp.13147
29. Allwood BW, Rigby J, Griffith-Richards S, et al. Histologically confirmed tuberculosis-associated obstructive pulmonary disease. Int J Tuberc Lung Dis. 2019;23(5):552–554. doi:10.5588/ijtld.18.0722
30. Starshinova A, Malkova А, Kudryavtsev I, et al. Tuberculosis and autoimmunity: common features. Tuberculosis (Edinb). 2022;134:102202. doi:10.1016/j.tube.2022.102202
31. Mukherjee M, Bulir CD, Radford K, et al. Sputum autoantibodies in patients with severe eosinophilic asthma. J Allergy Clin Immunol. 2018;141(4):1269–1279. doi:10.1016/j.jaci.2017.06.033
32. Ma A, Wen L, Yin J, et al. Serum levels of autoantibodies against extracellular antigens and neutrophil granule proteins increase in patients with COPD compared to non-COPD smokers. Int J Chronic Obstr. 2020;15:189–200. doi:10.2147/COPD.S235903
33. Lee DS, WRojas OL, Gommerman JL. B cell depletion therapies in autoimmune disease: advances and mechanistic insights. Nature Rev Drug Discov. 2021;20(3):179–199. doi:10.1038/s41573-020-00092-2
34. Eggenhuizen PJ, Ng BH, Ooi JD. Treg Enhancing Therapies to Treat Autoimmune Diseases. Int J Mol Sci. 2020;21(19):7015. doi:10.3390/ijms21197015
35. Quiros-Roldan E, Sottini A, Signorini SG, et al. Autoantibodies to Interferons in Infectious Diseases. Viruses. 2023;15(5):1215. doi:10.3390/v15051215
36. Nagele EP, Han M, Acharya NK, et al. Natural IgG autoantibodies are abundant and ubiquitous in human sera, and their number is influenced by age, gender, and disease. PLoS One. 2013;8(4):e60726. doi:10.1371/journal.pone.0060726
37. Byrne R, Todd I, Tighe PJ, et al. Autoantibodies in chronic obstructive pulmonary disease: a systematic review. Immunol Lett. 2019;214:8–15. doi:10.1016/j.imlet.2019.08.007
38. Cass SP, Dvorkin-Gheva A, Yang Y, et al. Differential expression of sputum and serum autoantibodies in patients with chronic obstructive pulmonary disease. Am J Physiol Lung Cell Mol Physiol. 2021;320(6):L1169–l1182.
39. Shen CY, Hsieh SC, Yu CL, et al. Autoantibody prevalence in active tuberculosis: reactive or pathognomonic? BMJ Open. 2013;3(7):e002665. doi:10.1136/bmjopen-2013-002665
40. Goodridge A, Cueva C, Lahiff M, et al. Anti-phospholipid antibody levels as biomarker for monitoring tuberculosis treatment response. Tuberculosis (Edinb). 2012;92(3):243–247. doi:10.1016/j.tube.2012.02.004
41. Apostólico JDS, Lunardelli VAS, Coirada FC, Boscardin SB, Rosa DS. Adjuvants: classification, modus operandi, and licensing. J Immunol Res. 2016;2016:1459394. doi:10.1155/2016/1459394
42. You Z, Li Y, Wang Q. The Clinical Significance of Hepatic CD69(+) CD103(+) CD8(+) resident-memory T cells in autoimmune hepatitis. Hepatology (Baltimore, Md). 2021;74(2):847–863. doi:10.1002/hep.31739
43. Rubtsov AV, Marrack P, Rubtsova K. T-bet expressing B cells – novel target for autoimmune therapies? Cel Immunol. 2017;321:35–39. doi:10.1016/j.cellimm.2017.04.011
44. Imperiale BR, García A, Minotti A, et al. Th22 response induced by Mycobacterium tuberculosis strains is closely related to severity of pulmonary lesions and bacillary load in patients with multi-drug-resistant tuberculosis. Clin Exp Immunol. 2021;203(2):267–280. doi:10.1111/cei.13544
45. Li L, Jiang Y, Lao S, et al. Mycobacterium tuberculosis-specific IL-21+IFN-γ+CD4+ T cells are regulated by IL-12. PLoS One. 2016;11(1):e0147356. doi:10.1371/journal.pone.0147356
46. Funes SC, Rios M, Escobar-Vera J, et al. Implications of macrophage polarization in autoimmunity. Immunology. 2018;154(2):186–195. doi:10.1111/imm.12910
47. Kushnareva Y, Mathews IT, Andreyev AY. Functional Analysis of Immune Signature Genes in Th1* Memory Cells Links ISOC1 and Pyrimidine Metabolism to IFN-γ and IL-17 Production. J Immunol. 2021;206(6):1181–1193. doi:10.4049/jimmunol.2000672
48. Pathak VK, Singh I, Singh SV, et al. Mimicking B and T cell epitopes between Mycobacterium leprae and host as predictive biomarkers in type 1 reaction in leprosy. Sci Rep. 2021;11(1):24431. doi:10.1038/s41598-021-04135-5
 © 2023 The Author(s). This work is published and licensed by Dove Medical Press Limited. The
full terms of this license are available at https://www.dovepress.com/terms
and incorporate the Creative Commons Attribution
- Non Commercial (unported, 3.0) License.
By accessing the work you hereby accept the Terms. Non-commercial uses of the work are permitted
without any further permission from Dove Medical Press Limited, provided the work is properly
attributed. For permission for commercial use of this work, please see paragraphs 4.2 and 5 of our Terms.
© 2023 The Author(s). This work is published and licensed by Dove Medical Press Limited. The
full terms of this license are available at https://www.dovepress.com/terms
and incorporate the Creative Commons Attribution
- Non Commercial (unported, 3.0) License.
By accessing the work you hereby accept the Terms. Non-commercial uses of the work are permitted
without any further permission from Dove Medical Press Limited, provided the work is properly
attributed. For permission for commercial use of this work, please see paragraphs 4.2 and 5 of our Terms.