Back to Archived Journals » International Journal of Wine Research » Volume 9
Changes in wine consumption are influenced most by health: results from a population survey of South Australians in 2013
Authors Stockley CS, Taylor AW, Montgomerie A ![]() , Dal Grande E
, Dal Grande E
Received 2 November 2016
Accepted for publication 22 December 2016
Published 13 March 2017 Volume 2017:9 Pages 13—22
DOI https://doi.org/10.2147/IJWR.S126417
Checked for plagiarism Yes
Review by Single anonymous peer review
Peer reviewer comments 2
Editor who approved publication: Dr Roger Pinder
Creina S Stockley,1 Anne W Taylor,2 Alicia Montgomerie,2 Eleonora Dal Grande2
1The Australian Wine Research Institute, 2Population Research & Outcome Studies, Discipline of Medicine, The University of Adelaide, Adelaide, SA, Australia
Aims: Individuals change their wine consumption over their life course, and mean volume typically declines with increasing age. Research on the reasons individuals change their consumption has primarily focused on youth/the young, but not on older adults. This study’s aim was to ascertain changes in wine consumption over a 12-month period in Australians at different ages and what influenced these changes.
Methods: As part of the Spring 2013 South Australian Health Omnibus Survey, persons (n=2,908) aged 15 years and over who had most recently had a birthday in the selected household were interviewed in their home by trained interviewers. Of these, 48.9% were males and their mean age was 46.3 (standard deviation 18.9) years.
Results: Regular, light–moderate wine consumers were generally stable in the amount of wine they drank over a 12 month period, particularly those aged 55 years and older. They generally cited health (48.0%) as a reason for decreasing their wine consumption. Those who usually consumed three to four standard drinks on days they drank wine were also more likely to give health (54.3%) as a reason for decreasing their consumption, as were heavy wine consumers (57.7%). The 25- to 34-year age-group was more likely to have decreased (36% vs 26%) their wine consumption in the last 12 months. The 15- to 24-year age-group was most likely to have increased (28% vs 10%) their wine consumption in the last 12 months. Health was most cited as the reason for decreasing this consumption, while family and friends were most cited as the reason for increasing this consumption.
Conclusion: In this representative population of South Australians, the wine consumption of previously identified at-risk groups for both short- and long-term harms, ie, youth and older adults, as well as excessive and heavy drinkers, was most influenced by health, family and friends, and employment.
Keywords: alcohol, wine, consumption, changes
Introduction
Excessive alcohol consumption is among the leading risk factors for decreases in health quality and longevity in developed countries.1–4 According to the National Health and Medical Research Council (NHMRC) Australian Guidelines to Reduce Health Risks from Drinking Alcohol (2009), lifetime risky drinkers are defined as people who consume more than two 10 g standard drinks per day on average over a 12-month period.5 Single-occasion risky drinkers are defined as people consuming five or more standard drinks on a single drinking occasion. The US Substance Abuse and Mental Health Services Administration defines heavy drinking or excessive drinking as drinking five or more drinks on the same occasion on each of five or more days in the previous 30 days.6
Patterns of alcohol consumption can change over a life course.7 For example, cross-sectional and longitudinal studies suggest that the prevalence of risky drinking decreases with age.8–12 There are both positive and negative motives for consuming alcohol, and these include to be social, to create a positive or relaxed mood, to cope, or to conform.13–16
The Australian Institute of Health and Welfare (AIHW) 2013 National Drug Strategy Household Survey (NDSHS) showed that both lifetime and single-occasion risky alcohol consumption have decreased in Australia over the previous 3 years.17 In 2013, 18.2% of people aged 14 years or older exceeded the lifetime-risk guidelines, and 26% exceeded the single-occasion risk guidelines at least once a month. Correspondingly, all other alcohol drinkers could be considered moderate consumers. The AIHW 2013 NDSHS also found that excessive alcohol consumption is the drug issue that people feel is of the most concern to the general community (42.5%), closely followed by tobacco and meth/amphetamines.17
According to the AIHW 2010 NDSHS, those alcohol consumers who consciously reduced their alcohol consumption cited concern for their health (50.9%) as the main reason for the reduction. In addition, risky drinkers (both lifetime and single occasion) were more likely than low-risk drinkers to reduce their alcohol consumption due to financial reasons (17.9% and 15%) or an increase in the price of alcohol they usually drank (10.8% and 8.1%). Males (20.2%) were more likely to mention drink/drunk-driving regulations as a reason for reducing consumption than females (14.5%).18 The AIHW 2013 NDSHS also showed that health remained the main reason for reducing alcohol consumption (49.1%). Other reasons cited included lifestyle, social, pregnancy and/or breastfeeding, taste/enjoyment, drink/drunk-driving regulation, financial, adult/parent/peer pressure, and increased price of usual drink. Reasons vary by age, gender, and alcohol-consumption pattern, and could be used to tailor intervention strategies to reduce excessive alcohol consumption. Variation by the usual alcohol beverage consumed has not been explored.17
The aim of this research was to analyze the data collected by the South Australian Health Omnibus Survey (HOS) to determine what influences wine consumers to change their consumption over a 12-month period. Subpopulations of specific interest were those identified as being at higher risk of alcohol-related harms by the AIHW 2010 NDSHS, namely, 14- to 25- and 50+-year age-groups, as well as heavy and excessive consumers.
Materials and methods
The HOS is a service provided since 1990 by Harrison Health Research, overseen by Population Research and Outcome Studies, University of Adelaide. The population survey is conducted annually, and questions are submitted by a number of government and nongovernment organizations to obtain data on a range of health issues in South Australia.19 Complete methods for the HOS have been previously described.20 Briefly, data were collected between September 3 and December 31, 2013. Seventy percent of the sample was selected from the Adelaide metropolitan area, with the remainder being drawn from those country towns with a population of 1,000 or more (based on latest Australian Bureau of Statistics [ABS] census information). Country towns with smaller populations were not included, because of the additional cost of interviewing people living in remote areas. The sample was obtained by first selecting a random sample of ABS-collector districts. Within each collector district, a random starting point was selected, and from this point ten households were then selected in a given direction with a fixed skip interval. The sampling methodology used was a clustered, multistage, systematic, self-weighting area sample. From the 5,200 households selected, 2,908 face-to-face interviews were conducted, with a response rate of 57.6%. The participation rate was 63.4%.
Persons aged 15 years and over who had most recently had a birthday in the selected household were interviewed in their home by trained health interviewers. Up to ten callbacks were made in an attempt to interview the selected person. There was no replacement for nonresponders, and hotels, motels, hospitals, nursing homes, and other institutions were excluded. The data were weighted by the individual’s probability of selection, as well as to benchmarks derived from the 2011 ABS Census by 10-year age-groups, gender, and geographic region (metropolitan/country). This ensured that the estimates calculated were representative of the South Australian population aged 15 years and over. Probability of selection in the household was calculated on the number of eligible people in the household. The weights reflected unequal sample-inclusion probabilities, and compensated for differential nonresponse.
The questionnaire and methodology for this survey were approved by The University of Adelaide Human Research Ethics Committee.20 Participation in the study was voluntary. Prior to contact by the interviewer, a primary approach letter was sent to inform the selected household of the purpose of the survey, which included who was eligible, voluntary participation, assurance of confidentiality, and privacy of information given during the survey, as well as contact details for general queries or to withdraw participation. Upon initial contact, the interviewers reiterated the contents of the primary approach letter, including the expected length of time to complete the interview. Consent from the respondent was obtained verbally at the start of the interview, and confirmation to continue participation in the face-to-face interview was obtained. Consent was recorded as a complete interview, and reasons for nonparticipation or inability to establish contact were also recorded.
Statistical analysis
All data presented in this paper are weighted estimates, and analyses were undertaken using Statistical Package for the Social Sciences (SPSS) software. For univariable analyses, χ2 tests were used to compare categorical variables. Initial analyses were undertaken to describe the demographic characters (ten-year age-groups and gender) of the respondents, based on the frequency (number of times per week) of wine consumption, the amount of wine consumed, changes in the amount of wine consumed, if any, over 12 months, the reason for these changes, and description of the change in alcohol consumed. Further analyses were undertaken to describe the number of standard glasses of wine consumed by household-income levels, frequency of wine consumption, changes in overall wine consumption, and reasons for these changes.
Results
Interviews were conducted with 2,908 respondents (48.9% males, mean age 46.3 [standard deviation 18.93] years). Overall, 18.1% of respondents had never consumed any alcoholic beverage, which was consistent with the 22% abstinence reported in the AIHW 2013 NDSHS.17 The overall wine consumption of the participants by age-group and gender is summarized in Table 1, with 23.6% reporting never consuming wine, while a further 13% had not consumed wine in the previous 12 months. Approximately a third (29.3%) of respondents drank wine at least once per week. Of these, 8.1% of respondents drank wine approximately daily (≥5 days/week).
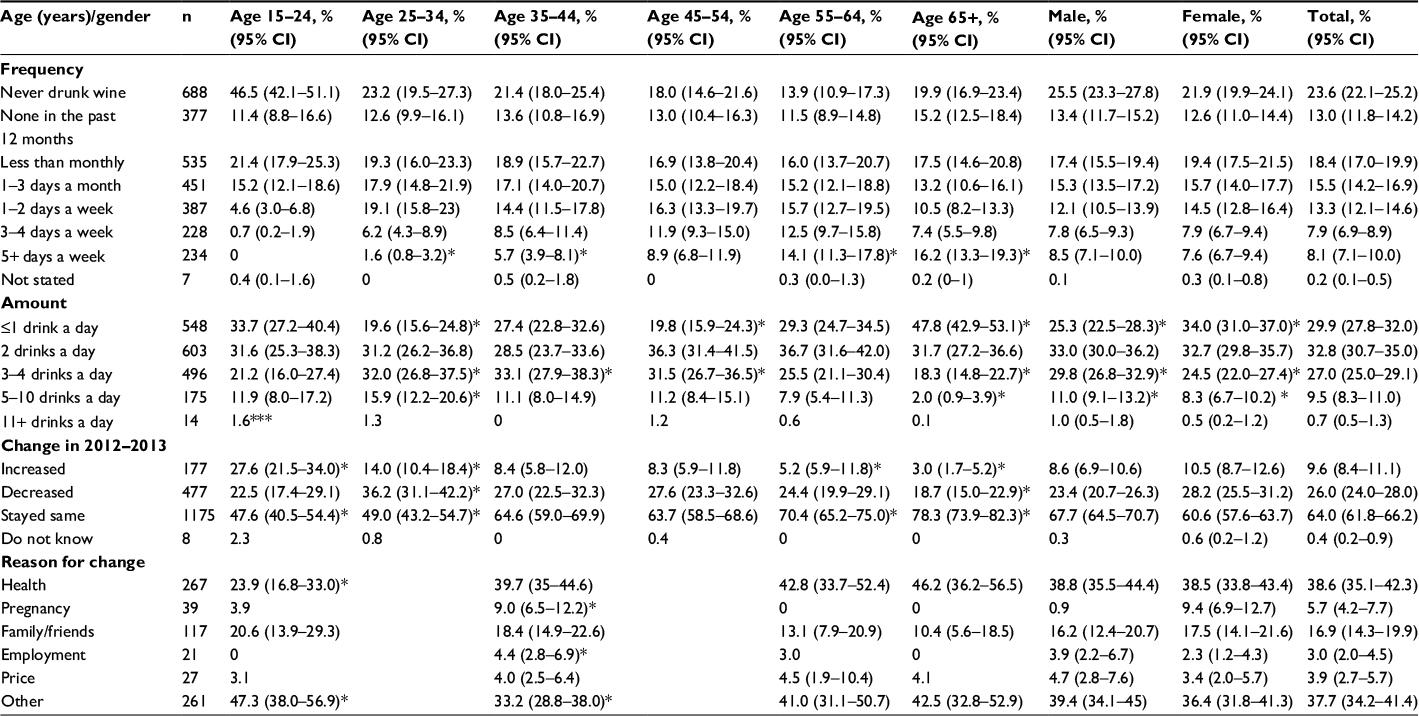 | Table 1 Wine consumption by age and gender, Health Omnibus Survey 2013 Notes: * Values within a row significantly different to all other categories (P<0.05); ***insufficient numbers. Abbreviation: CI, confidence interval. |
Age-group
Of those aged 15–24 years, 46.5% had never consumed wine, and in addition 11.4% had not consumed wine in the previous 12 months. This equated to 42.1% of 15- to 24-year-olds consuming wine in the previous 12 months. Nearly a quarter of this age-group were under 18 years old and unable to purchase wine legally. When analyzed separately, the 18- to 24-year-olds were still more likely never to have drunk wine (37.7%) compared with the total number of respondents (data not shown).
Concerning older adults, of respondents aged 55–64 years, 13.9% had never drunk wine, and in addition 11.5% had not consumed wine in the previous 12 months. This equated to 74.5% of 55- to 64-year-olds consuming wine in the previous 12 months. Of respondents aged 65 years and over, 19.9% had never drunk wine, and in addition 15.2% had not consumed wine in the previous 12 months. This equated to 64.5% of ≥65-year-olds consuming wine in the previous 12 months.
Level of wine consumption
Table 1 also highlights the amount of wine consumed per day by age-group and gender. Approximately two-thirds of respondents (62.6%) usually consumed two or fewer standard drinks of wine per drinking occasion, which is within the current NHMRC guidelines for reducing the risk of alcohol-related harm over a lifetime.5 In addition, 27% of respondents usually consumed three to four standard drinks of wine per drinking occasion, which is within the NHMRC guidelines for reducing the risk of alcohol-related harm on a single occasion.5
More women generally consumed up to two standard drinks of wine per drinking occasion compared to men (66.6% vs 58.3%). Respondents aged 65 years or more were significantly more likely to consume up to one standard drink on a day when they drank wine than all other age-groups (47.8% vs 25.3% for those respondents aged 15–64 years). This older age-group was also more likely to drink wine on ≥5 days per week. Of respondents aged 65 years and over, 16.2% drank wine ≥5 days per week compared to 6.1% of respondents aged 15–64 years. Respondents aged 25–34 years were more likely to consume five or more standard drinks per occasion than all other age-groups (17.2% vs 9% of all other respondents). Approximately 42.1% of respondents aged 15–24 years reported consuming wine in the previous 12 months. Two or fewer standard drinks per occasion were usually consumed by 65.6% of this age-group, while none drank daily and at most 5.3% had drunk wine weekly.
Table 2 shows that 62.7% (95% confidence interval [CI] 60.5%–64.9%) of respondents reported that on a day that they drink wine, they consumed two or fewer standard drinks of wine, 27% (95% CI 25%–29.1%) three to four wines, and 10.3% (95% CI 9%–11.8%) five or more wines. Table 2 also highlights the number of standard glasses of wine consumed by categories of household income, by frequency of wine consumption, and by changes in overall wine consumption in the previous 12 months. Respondents with lower household incomes (<AUD$40,001 per annum) were more likely usually to have up to two standard drinks when they drank wine (72.1% vs 62.6% of all respondents). Respondents living in households with a greater disposable income (>AUD$100,000) consumed more wine per occasion (above two standard drinks, 44.9%). Respondents whose highest qualification was a tertiary bachelor degree or higher were three times more likely to consume three to four standard drinks per occasion (33%), those with a trade qualification or apprenticeship were more likely to have two standard drinks per occasion (41%), while those who had left school aged 15 years or younger were more likely to have up to one standard drink per occasion (39%, data not shown).
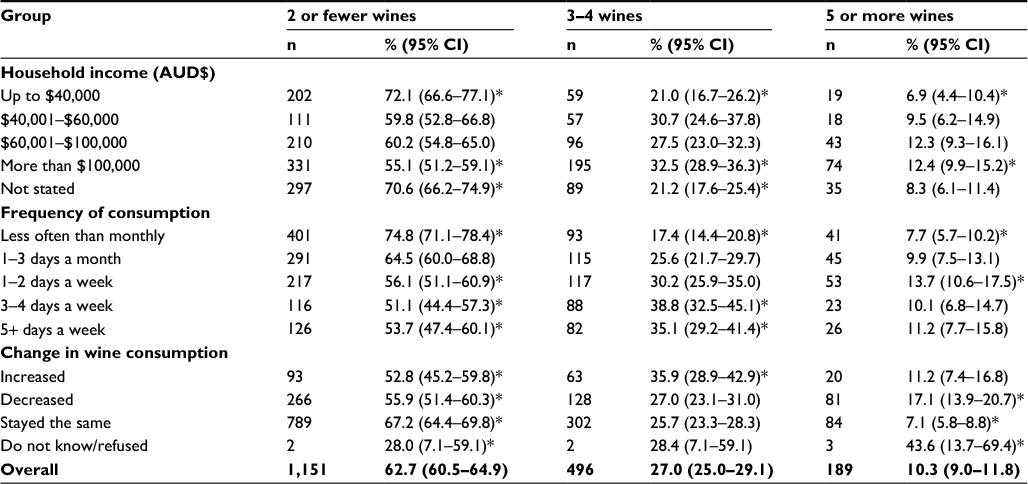 | Table 2 Number of standard wines usually consumed on a day when wine is drunk Notes: *Values within a row significantly different to all other categories (P<0.05). Abbreviation: CI, confidence interval. |
Figure 1 and Table 2 also highlight the number of standard drinks usually consumed by frequency of consumption. Respondents who drank less often than monthly were more likely to consume up to two standard drinks compared with the total number of respondents (74.8% vs 57.7% of respondents drinking at least 1–3 days a month or more). Those who drank more often on 3–4 and 5+ days/week, however, were more likely to drink at the level of single-occasion risky drinking, ie, three to four standard drinks per occasion (38.8% and 35.1%, respectively, vs 23.7% of respondents who drank 1–2 days per week or less). Figure 2 shows the change in wine consumption within the previous 12-month period, with 64% of respondents not changing the amount of wine that they consumed. Respondents who usually consumed five-plus standard drinks on a day when they usually drank wine or who drank wine 1–2 days/week (moderate consumers) were more likely to have decreased their consumption of wine (17.1% and 55.9%, respectively, vs 25.8% of all respondents).
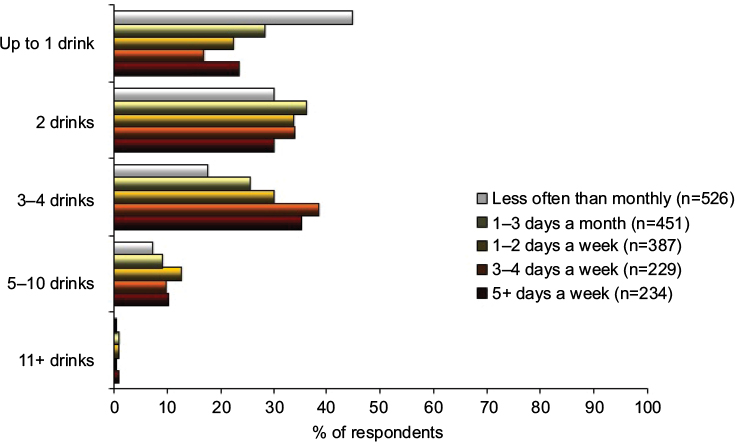 | Figure 1 Number of standard drinks usually consumed by frequency of consumption. |
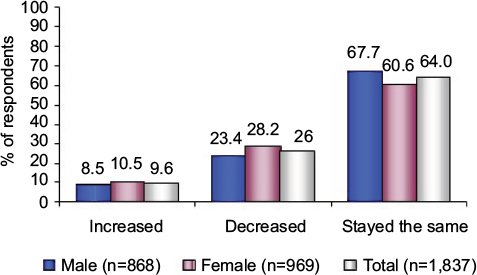 | Figure 2 Change in wine consumption in the previous 12 months by South Australians aged 15 years and over by gender. |
Change in wine consumption
Concerning the change in alcohol consumption within the previous 12-month period, 87.1% of respondents did not change the main type of alcoholic beverage they consumed. Table 3 highlights the changes in the main type of alcoholic beverage consumed for the 12.9% who did change. The main changes overall were from beer to wine (2.4%) and from spirits to wine (2.4%). Women were more likely to have changed from spirits to wine (4.3% vs 0.6%), whereas men were more likely to have changed from beer to wine (3.8% vs 0.8%). In terms of changes to wine consumption per se, Table 1 highlights the proportion who increased, decreased, or stayed the same in their wine-consumption pattern over the previous 12 months, with 64% not changing, 26% decreasing, and 9.6% increasing their wine consumption. Age-related differences were observed. The wine consumption of respondents aged 55–64 years and 65 years and over was significantly more likely to have stayed the same in the previous 12-month period compared to all respondents (70.4% and 78.3%, respectively, compared to 64% of all other categories combined). Conversely, respondents aged 25–34 years were more likely to have increased (14% vs 9.6%) or decreased (36.2% vs 26%) their wine consumption in the previous 12-month period, while respondents aged 15–24 years were more likely to have increased their wine consumption (27.6% vs 9.6%).
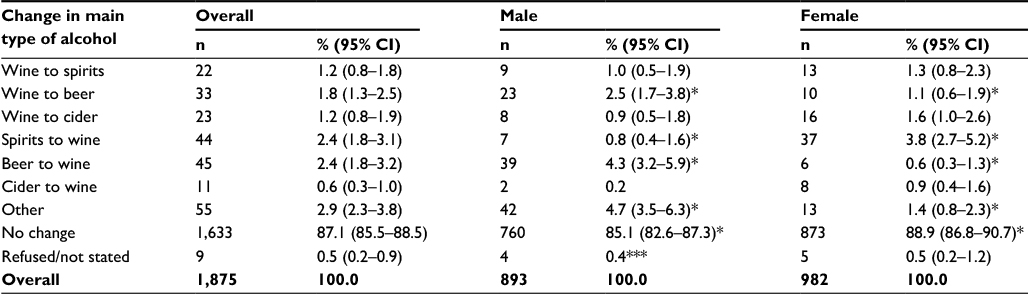 | Table 3 Change in main type of alcohol in the last 12 months Notes: *Values within a row significantly different to all other categories (P<0.05); ***insufficient numbers. Abbreviation: CI, confidence interval. |
Reasons provided for change in wine consumption
Tables 1 and 4 detail the reasons that had prompted the change for respondents who stated that they had changed their wine consumption in the previous 12-month period. Their answer was facilitated by a prompt card provided to the interviewees.
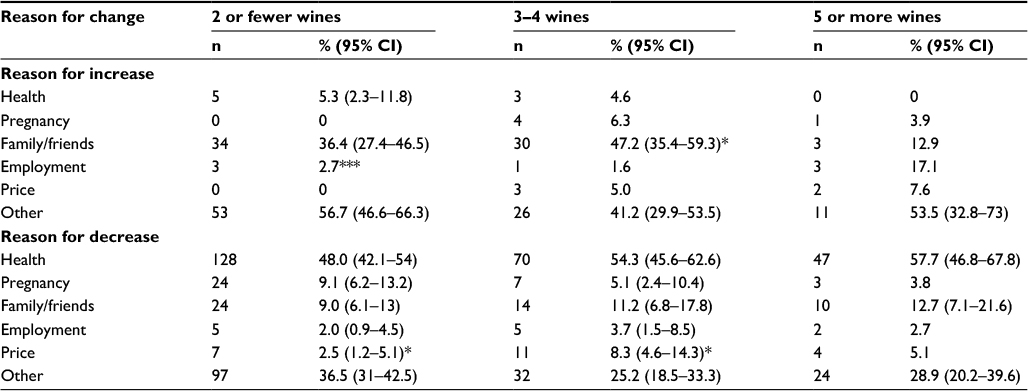 | Table 4 Reason for increase and decrease in wine consumption in last 12 months by number of standard wines usually consumed on day when wine is drunk§ Notes: *Values within a row are statistically significantly different to all other categories (P<0.05). §Multiple responses given for reasons for change; ***insufficient numbers. Abbreviation: CI, confidence interval. |
Discussion
This study, undertaken in South Australia (2012–2013) on self-reported wine consumption, had a large sample size, so the results observed and conclusions drawn are applicable to the Australian population. Reported wine consumption remained relatively stable over the previous 12 months.21,22 In particular, wine consumption was most stable for regular light–moderate male drinkers aged from 55 years of age onward and for those who owned or were purchasing their own home, being presumably less disadvantaged in terms of financial resources. For example, respondents with the lowest household incomes usually drank one standard drink of wine per occasion. They are not necessarily less disadvantaged, however, in terms of education. These findings are consistent with those in the published literature where an econometric analysis of aggregate alcohol consumption showed that income, rather than price, is a main source of variation over time in consumption.23 Overall, wine consumption decreased mostly among females aged 25–34 years who describe their occupation as “disabled” or “home duties”. Unmarried students aged 15–24 years living in South Australia, however, were the most likely age-group to have increased their overall wine consumption.
Overall, respondents who usually drank a higher number of standard drinks when they drank wine were more likely to be 25–34 years of age, male, and unemployed or not working because of a disability. Those who usually drank fewer standard drinks when they drank wine were more likely to be aged over 65 years and female. Those who drank wine less frequently were also more likely to consume fewer standard drinks. Respondents with a greater disposable income (>AUD$100,000), however, generally consumed more wine per occasion (more than three standard drinks), as did those with a tertiary degree. Approximately a third (29.3%) of respondents drank wine at least once per week. Of these, only 8.1% of respondents drank wine approximately daily (≥5 days/week). This observation is consistent with that of AIHW 2013 NDSHS for all alcohol consumption, which suggested that only 6.5% of all alcohol consumers now drink daily.17 A further 7.9% drank wine 3–4 days/week and 13.3% drank wine 1–2 days/week.
In this study, older wine drinkers were more likely to be regular light–moderate consumers, while heavy and excessive wine drinkers were more likely to be males aged 25–34 years who were financially disadvantaged, being either unemployed or not working because of a disability, and living in rural regions. Underage drinkers were less likely to have ever consumed wine, and when they did drank more moderately than young adults aged over 18 years (data not shown). At most, 5.3% of those aged 15–24 years had drunk wine weekly in the previous 12 months. This reflects trends seen in both the AIHW 2010 and 2013 NDSHS data, where fewer individuals aged 12–17 years were drinking any alcoholic beverage and the proportion abstaining increased significantly between 2010 and 2013 (from 64% to 72%).17,18
Regarding beverage substitutions, although 87.1% of respondents had not changed the main type of alcohol that they consumed over the previous 12 months, 15- to 24-year-olds were most likely to change their choice of alcoholic beverage, while those aged 65 years and over and 55–64 years were the least likely to change. These data are also consistent with the AIHW 2010 NDSHS.18 Of those respondents who changed from another alcoholic beverage to wine, most common changes were from beer to wine and spirits to wine (both 2.4%). Gender differences were observed, where males were more likely to have changed from beer to wine (3.8% vs 0.6%) and females from spirits to wine (4.3% vs 0.8%).
Of the 11.7% heavy wine drinkers identified in this study, ie, those consuming five or more drinks per occasion, 43.1% had not changed their wine consumption over the previous 12 months, while 44.5% decreased it and 10.5% increased it. Group-based analysis has previously suggested that abstainers and moderate alcohol drinkers exhibit greater stability than heavy alcohol drinkers.24 Approximately 50% of heavy wine drinkers drank heavily at least weekly, while 13.9% drank five or more drinks almost daily. Those who drank heavily on 1–2 days per week could be considered to have a typical weekend binge-drinking pattern.25
Drivers for change
A third of wine consumers had changed their wine consumption in the previous 12 months. One in four people decreased their wine consumption, and one in ten increased it. Consistent with the published literature, in this study more females than males changed their overall consumption and more females than males had decreased their overall wine consumption in the previous 12 months, both of which were statistically significant.17,18 Overall wine consumption was most stable in the 65+-year age-group, followed by the 55- to 64-year age-group, which was statistically significantly for both of these groups compared to all other groups.
The most frequently cited reason for changing overall wine consumption in the previous 12 months was health (38.6%), and an additional 5.7% of females cited pregnancy as an important reason. A similar percentage of males and females reported health as a reason. Health was only cited as a reason for increasing overall wine consumption by 15- to 24-year-olds, 25- to 54-year-olds, and light–moderate wine drinkers. With regard to 15- to 24-year-olds, it has been previously shown that positive expectancies play a key role in their alcohol-drinking behaviors. For example, as people age through adolescence and into young adulthood, they increasingly expect benefits from consuming alcohol and become less convinced of the risks.26,27 Health was cited equally by all age-groups as a reason for decreasing their overall wine consumption. It was also the strongest identified reason by heavier wine drinkers (five or more drinks/day) and those who drank wine ≥5 days/week for decreasing their overall wine consumption, which is consistent with that cited in the AIHW 2010 NDSHS as the main reason for this group decreasing overall alcohol consumption.18 The reduction in heavy wine consumption related to health may reflect medical practitioner interventions,28–32 interventions by family and friends, or simply the continuous media campaigns by nongovernment organizations.
Another frequently cited reason for changing overall wine consumption was family/friends (16.9%), and again a similar percentage of males and females reported this as a reason. All age-groups reported family/friends as the main reason for increasing their overall wine consumption. This is consistent with the published literature for increasing alcohol consumption.33,34 In contrast, family/friends were a more important reason for those aged 25–54 years for decreasing overall wine consumption compared with the other age-groups. Unexpectedly, as this was not observed in the prestudy survey, “other” was cited by 37.7% of respondents. When prompted, other reasons for changing wine consumption included changes in circumstances and social life, as well as weather and changes in own taste.
Price was cited by 3.9% of respondents as a reason for changing their wine consumption, and was cited equally by men and women. Notably not for wine consumption per se, this percentage is less than that cited in the AIHW 2010 NDSHS, where 6.9% of all alcohol consumers cited price as a reason for decreasing their alcohol consumption. The limited number of studies in the published literature suggest that older adults are generally more alcohol price-sensitive than younger adults,35,36 which could be not concluded from this study for wine. Only 6% of those aged 55–64 years gave price as a reason for increasing their overall wine consumption, while 5% of this group gave it as a reason for decreasing consumption, which is similar to those aged 65 years and over. None of those aged 65 years and over gave price as a reason for increasing their wine consumption. This is consistent with the published literature, which suggests that the most common reasons for decreasing alcohol consumption were health and fewer social occasions.34,37 A study of Finnish adults aged 65 years showed “medicinal purposes” cited by 20.1% as a reason for increasing alcohol consumption.38 Conversely, more social occasions and fewer responsibilities were the most common reasons for increasing alcohol consumption by older adults.34,37–39 The published literature is conflicted as to whether price may be important for drinking participation by youth and young adults.40–48 No 15- to 24-year-olds in this study cited price as a reason for decreasing their wine consumption.
It has also been suggested in the published literature that regular and episodic heavy drinkers respond minimally if at all to the changing price of alcoholic beverages, regardless of gender or age.49,50 This suggestion was supported by the finding of this study for wine. This study found that although heavy consumers had mainly maintained (43.1%) or decreased (44.5%) their consumption over the previous 12 months, health (46.3%) was cited as the most important reason for change, while price was much less frequently given as a reason (5.6%). Five percent of those drinking three to four standard drinks of wine per drinking occasion and 7.6% of those drinking five or more standard drinks gave price as a reason for increasing their consumption. Paradoxically, approximately 8% of those drinking three to four standard drinks and 5.1% of those drinking five or more standard drinks gave price as a reason for decreasing their wine consumption. It was not able to be determined, however, whether respondents decreased the consumption of all alcoholic beverages or only their wine consumption. These percentages are lower than those cited in the AIHW 2010 NDSHS as a reason for decreasing the consumption of alcoholic beverages in the aforementioned low-risk drinking categories defined by the NHMRC in 2009.5,18
The AIHW 2013 NDSHS also found that the most supported policy measure to reduce alcohol-related harm was to establish more severe penalties for drink/drunk driving (85%), followed by stricter enforcement of the law against supplying to minors (84%), and increasing the prices of alcoholic beverages was the least-supported policy measure (28%).17
The robustness of the survey methodology can be considered a strength in this study, due to the large representative statewide samples used. The results could be biased, however, due to the moderately acceptable response rates (57.6%), which is a trend in many population surveys interstate and overseas. The decline in altruism (civic duty), increasingly inaccessible buildings (eg, locked gates), busy lifestyles, and an increase in the need for privacy and confidentiality have contributed to decreasing participation in all types of surveys, including face-to-face modes.51
Weaknesses of this study include the self-reported nature of the data collection, although prompt cards were added for clarification and standardization, and that the data were not age-standardized. Also, minimal additional information was recorded when “other” was cited by respondents as a reason for changing wine consumption. Furthermore, respondents were not asked how much they had changed their consumption, but were left to their own interpretation of increase or decrease. The study did not include information on the relationship between wine and food consumption either, ie, whether wine was consumed with or without food, which can mitigate blood-alcohol content and related adverse effects. Nevertheless, this study provides insights on how and the reasons individuals change their wine consumption over the life course, and may provide guidance on tailored intervention strategies to reduce excessive wine consumption.
Conclusion
In this representative population of South Australians, over the previous 12 months, the consumption of wine was more influenced by health than by other factors. The wine consumption of previously identified at-risk groups for both short- and long-term harms, ie, youth and older adults, as well as excessive and heavy drinkers, was most influenced by health, family and friends, and employment, for example, before price. These findings are also consistent with those found in the AIHW 2010 and 2013 NDSHS.17,18
Acknowledgment
Research leading to this publication was supported in part by the National Wine Foundation, Australia. The funder had no role in study design, data collection, data analysis, data interpretation, preparation of the manuscript, or decision to publish.
Disclosure
The authors report no conflicts of interest in this work.
References
Hingson RW, Heeren T, Winter MR. Age at drinking onset and alcohol dependence: age at onset, duration, and severity. Arch Pediatr Adolescent Med. 2006;160:739–746. | ||
Han B, Gfroerer JC, Colliver JD, Penne MA. Substance use disorder among older adults in the United States in 2020. Addiction. 2009;104:88–96. | ||
World Health Organization. Global Status Report on Alcohol and Health. Geneva: WHO; 2011. | ||
World Health Organization. Global Strategy to Reduce the Harmful Use of Alcohol. Geneva: WHO; 2010. | ||
National Health and Medical Research Council. Australian Guidelines to Reduce Health Risks from Drinking Alcohol. Canberra: Commonwealth of Australia; 2009. | ||
National Institute on Alcohol Abuse and Alcoholism. Drinking levels defined. 2015. Available from: http://www.niaaa.nih.gov/alcohol-health/overview-alcohol-consumption/moderate-binge-drinking. Accessed February 4, 2017. | ||
Fillmore KM, Hartka E, Johnstone BM, Leino EV, Motoyoshi M, Temple MT. A meta-analysis of life course variation in drinking. Br J Addict. 1991;86:1221–1267. | ||
Stall R. Change and stability in quantity and frequency of alcohol use among aging males: a 19-year follow-up study. Br J Addict. 1986;81:537–544. | ||
Temple MT, Leino EV. Long-term outcomes of drinking: a 20-year longitudinal study of men. Br J Addict. 1989;84:889–899. | ||
Molgaard CA, Nakamura CM, Stanford EP, Peddecord KM, Morton DJ. Prevalence of alcohol consumption among older persons. J Community Health. 1990;15:239–251. | ||
Grant BF. Prevalence and correlates of alcohol use and DSM-IV alcohol dependence in the United States: results of the National Longitudinal Alcohol Epidemiologic Survey. J Stud Alcohol. 1997;58:464–473. | ||
Britton A, Ben-Shlomo Y, Benzeval M, Kuh D, Bell S. Life course trajectories of alcohol consumption in the United Kingdom using longitudinal data from nine cohort studies. BMC Med. 2015;13:47. | ||
Cooper ML. Motivations for alcohol use among adolescents: development and validation of a four-factor model. Psychol Assess. 1994;6:117–128. | ||
Wilson GB, Kaner EF, Crosland A, Ling J, McCabe K, Haighton CA. A qualitative study of alcohol, health and identities among UK adults in later life. PLoS One. 2013;8:e71792. | ||
Foster DW. Drinking identity as a mediator of the relationship between drinking motives and weekly alcohol consumption among heavy drinking undergraduate students. Addict Behav. 2014;39:1811–1815. | ||
Foster DW, Neighbors C, Prokhorov A. Drinking motives as moderators of the effect of ambivalence on drinking and alcohol-related problems. Addict Behav. 2014;39:133–139. | ||
Australian Institute of Health and Welfare. National Drug Strategy Household Survey: Detailed Report – 2013. Canberra: AIHW; 2014. | ||
Australian Institute of Health and Welfare. National Drug Strategy Household Survey: Detailed Report – 2010. Canberra: AIHW; 2011. | ||
Taylor A, Dal Grande E, Wilson D. The South Australian Health Omnibus Survey 15 years on: has public health benefited? Pub Health Bull. 2006;3:30–32. | ||
Wilson D, Wakefield MA, Taylor A. The South Australian Health Omnibus Survey. Health Promot J Aust. 1992;2:47–49. | ||
Australian Bureau of Statistics. 6401.0 Consumer Price Index, Australia, 2012–2013. Available from: http://www.ausstats.abs.gov.au/ausstats/meisubs.nsf/0/686E95DC92F3C1F3CA257BB100125AE0/$File/64010_jun%202013.pdf. Accessed January 31, 2015. | ||
Australian Bureau of Statistics. 6401.0 Consumer Price Index, Australia, Sep 2013. Available from: http://www.abs.gov.au/AUSSTATS/[email protected]/Lookup/6401.0Main+Features1Sep%202013. Accessed January 31, 2014. | ||
Selvanathan EA, Selvanathan S. Economic and demographic factors in Australian alcohol demand. Appl Econ. 2004;36:2405–2417. | ||
Kerr WC, Fillmore KM, Bostrom A. Stability of alcohol consumption over time: evidence from three longitudinal surveys from the United States. J Stud Alcohol. 2002;63:325–333. | ||
US Centers for Diseases Control and Prevention. Fact sheets: binge drinking. 2014. Available from: http://www.cdc.gov/alcohol/fact-sheets/binge-drinking.htm. Accessed February 4, 2017. | ||
Schulenberg JE, Maggs JL. A developmental perspective on alcohol use and heavy drinking during adolescence and the transition to young adulthood. J Stud Alcohol Suppl. 2002:54–70. | ||
Smith GT, Goldman MS, Greenbaum PE, Christiansen BA. Expectancy for social facilitation from drinking: the divergent paths of high-expectancy and low-expectancy adolescents. J Abnorm Psychol. 1995;104:32–40. | ||
Bien TH, Miller WR, Tonigan JS. Brief interventions for alcohol problems: a review. Addiction. 1993;88:315–336. | ||
Ockene JK, Adams A, Hurley TG, Wheeler EV, Hebert JR. Brief physician- and nurse practitioner-delivered counseling for high-risk drinkers: does it work? Arch Intern Med. 1999;159:2198–2205. | ||
Curry SJ, Ludman EJ, Grothaus LC, Donovan D, Kim E. A randomized trial of brief primary-care based intervention for reducing at-risk drinking practices. Health Psychol. 2003;22:156–165. | ||
Whitlock EP, Polen MR, Green CA, Orleans T, Klein J. Behavioral counseling interventions in primary care to reduce risky/harmful alcohol use by adults: a summary of the evidence for the U.S. Preventive Services Task Force. Ann Intern Med. 2004;140:557–568. | ||
Jonas DE, Garbutt JC, Amick HR, et al. Behavioral counseling after screening for alcohol misuse in primary care: a systematic review and meta-analysis for the U.S. Preventive Services Task Force. Ann Intern Med. 2012;157:645–654. | ||
Kuntsche E, Knibbe R, Gmel G, Engels R. Why do young people drink? A review of drinking motives. Clin Psychol Rev. 2005;25:841–861. | ||
Britton A, Bell S. Reasons why people change their alcohol consumption in later life: findings from the Whitehall II cohort study. PLoS One. 2015;10:e0119421. | ||
Dave D, Saffer J. Alcohol demand and risk preference. J Econ Psychol. 2008;29:810–831. | ||
Ayyagari P, Deb P, Fletcher J, Gallo W, Sindelar JL. Understanding heterogeneity in price elasticities in the demand for alcohol for older individuals. Health Econ. 2013;22:89–105. | ||
Khan N, Wilkinson TJ, Keeling S. Reasons for changing alcohol use among older people in New Zealand. Australas J Ageing. 2006;25:97–100. | ||
Immonen S, Valvanne J, Pitkälä KH. Older adults’ own reasoning for their alcohol consumption. Int J Geriatr Psychiatry. 2011;26:1169–1176. | ||
Goldstein MZ, Pataki A, Webb MT. Alcoholism among elderly persons. Psychiatr Serv. 1996;47:941–943. | ||
Stockwell T, Lang E, Rydon P. High risk drinking settings: the association of serving and promotional practices with harmful drinking. Addiction. 1993;88:1519–1526. | ||
Chaloupka FJ, Wechsler H. Binge drinking in college: the impact of price, availability and alcohol control problems. Contemp Econ Probl. 1996;14:112–124. | ||
Cook PJ, Moore MJ. Environment and persistence in youthful drinking. In: Gruber J, editor. Risky Behavior Among Youths: An Economic Analysis. Chicago: University of Chicago Press; 2001:375–437. | ||
Gius MP. The effect of taxes on alcoholic consumption: an individual level of analysis with a correction for aggregate public policy variables. Penn Econ Rev. 2002;11:76–93. | ||
Clapp JD, Lange J, Min JW, Shillington A, Johnson M, Voas R. Two studies examining environmental predictors of heavy drinking by college students. Prev Sci. 2003;4:99–108. | ||
Jamison J, Myers LB. Peer-group and price influence students drinking along with planned behaviour. Alcohol Alcohol. 2008;43:492–497. | ||
O’Mara RJ, Thombs DL, Wagenaar AC, et al. Alcohol price and intoxication in college bars. Alcohol Clin Exp Res. 2009;33:1973–1980. | ||
Thombs DL, O’Mara R, Dodd VJ, et al. A field study of bar-sponsored drink specials and their associations with patron intoxication. J Stud Alcohol Drugs. 2009;70:206–214. | ||
Wagoner KG, Blocker J, McCoy TP, Sutfin EL, Champion H, Wolfson M. Free alcohol use and consequences: gender differences among undergraduates. Am J Prev Med. 2012;36:446–458. | ||
Nelson JP. Does heavy drinking by adults respond to higher alcohol prices and taxes? A survey and assessment. 2013. Available from: http://ssrn.com/abstract=2230649. Accessed February 4, 2017. | ||
Nelson JP. Gender differences in alcohol demand: a systematic review of the role of prices and taxes. Health Econ. 2014;23:1260–1280. | ||
Massey DS, Tourangeau R. Introduction: new challenges to social measurement. Ann Am Acad Pol Soc Sci. 2013;645:6–22. |
 © 2017 The Author(s). This work is published and licensed by Dove Medical Press Limited. The
full terms of this license are available at https://www.dovepress.com/terms
and incorporate the Creative Commons Attribution
- Non Commercial (unported, 3.0) License.
By accessing the work you hereby accept the Terms. Non-commercial uses of the work are permitted
without any further permission from Dove Medical Press Limited, provided the work is properly
attributed. For permission for commercial use of this work, please see paragraphs 4.2 and 5 of our Terms.
© 2017 The Author(s). This work is published and licensed by Dove Medical Press Limited. The
full terms of this license are available at https://www.dovepress.com/terms
and incorporate the Creative Commons Attribution
- Non Commercial (unported, 3.0) License.
By accessing the work you hereby accept the Terms. Non-commercial uses of the work are permitted
without any further permission from Dove Medical Press Limited, provided the work is properly
attributed. For permission for commercial use of this work, please see paragraphs 4.2 and 5 of our Terms.