Back to Journals » Nature and Science of Sleep » Volume 13
Changes in Subjective Motivation and Effort During Sleep Restriction Moderate Interindividual Differences in Attentional Performance in Healthy Young Men
Authors Mathew GM ![]() , Strayer SM, Bailey DS
, Strayer SM, Bailey DS ![]() , Buzzell K, Ness KM, Schade MM, Nahmod NG, Buxton OM, Chang AM
, Buzzell K, Ness KM, Schade MM, Nahmod NG, Buxton OM, Chang AM
Received 4 December 2020
Accepted for publication 13 April 2021
Published 14 July 2021 Volume 2021:13 Pages 1117—1136
DOI https://doi.org/10.2147/NSS.S294409
Checked for plagiarism Yes
Review by Single anonymous peer review
Peer reviewer comments 2
Editor who approved publication: Prof. Dr. Ahmed BaHammam
Gina Marie Mathew,1 Stephen M Strayer,1 David S Bailey,1 Katherine Buzzell,1 Kelly M Ness,1 Margeaux M Schade,1 Nicole G Nahmod,1 Orfeu M Buxton,1 Anne-Marie Chang1,2
1Department of Biobehavioral Health, College of Health and Human Development, Pennsylvania State University, University Park, PA, USA; 2College of Nursing, Pennsylvania State University, University Park, PA, USA
Correspondence: Gina Marie Mathew
Department of Biobehavioral Health, College of Health and Human Development, Pennsylvania State University, 219 Biobehavioral Health Building, University Park, PA, 16802, USA
Tel +1 (814) 863-7256
Email [email protected]
Purpose: The effects of sleep restriction on subjective alertness, motivation, and effort vary among individuals and may explain interindividual differences in attention during sleep restriction. We investigated whether individuals with a greater decrease in subjective alertness or motivation, or a greater increase in subjective effort (versus other participants), demonstrated poorer attention when sleep restricted.
Participants and Methods: Fifteen healthy men (M±SD, 22.3± 2.8 years) completed a study with three nights of 10-hour time in bed (baseline), five nights of 5-hour time in bed (sleep restriction), and two nights of 10-hour time in bed (recovery). Participants completed a 10-minute psychomotor vigilance task (PVT) of sustained attention and rated alertness, motivation, and effort every two hours during wake (range: 3– 9 administrations on a given day). Analyses examined performance across the study (first two days excluded) moderated by per-participant change in subjective alertness, motivation, or effort from baseline to sleep restriction. For significant interactions, we investigated the effect of study day2 (day*day) on the outcome at low (mean− 1 SD) and high (mean+1 SD) levels of the moderator (N = 15, all analyses).
Results: False starts increased across sleep restriction in participants who reported lower (mean− 1 SD) but not preserved (mean+1 SD) motivation during sleep restriction. Lapses increased across sleep restriction regardless of change in subjective motivation, with a more pronounced increase in participants who reported lower versus preserved motivation. Lapses increased across sleep restriction in participants who reported higher (mean+1 SD) but not preserved (mean− 1 SD) effort during sleep restriction. Change in subjective alertness did not moderate the effects of sleep restriction on attention.
Conclusion: Vigilance declines during sleep restriction regardless of change in subjective alertness or motivation, but individuals with reduced motivation exhibit poorer inhibition. Individuals with preserved subjective alertness still perform poorly during sleep restriction, while those reporting additional effort demonstrate impaired vigilance.
Keywords: sleep restriction, attention, interindividual differences, alertness, motivation, effort
Plain Language Summary
Sleep loss can impair performance. However, not all individuals demonstrate performance impairment when sleep deprived. The negative effects of short sleep on performance may be less severe if individuals feel alert and motivated, or if they apply more effort to compensate. We examined whether a person’s reported alertness, motivation, or effort modified the effects of sleep loss on performance.
We found that individuals who reported lower motivation during five days of short sleep (sleep restriction) responded prematurely more often on a performance task versus when they had full sleep, demonstrating problems with inhibition. However, individuals who reported the same motivation when they were sleep restricted as when well-rested showed no change in inhibition. Both those who reported reduced and preserved motivation demonstrated more instances of slower speed during sleep restriction, and the slowest speeds were observed in those with reduced motivation. Furthermore, individuals who reported applying more effort when they were sleep restricted responded more slowly during sleep restriction, whereas those who reported no change in effort demonstrated maintained speed. Crucially, no matter how alert someone reported feeling, sleep restriction impaired performance.
These findings suggest that individuals are more likely to demonstrate poor inhibition if they feel less motivated when sleep restricted. Additionally, individuals who report no change in alertness or who report applying greater effort during sleep restriction still demonstrate problems with attention. It is important to understand these effects because poor inhibition may lead to impulsive decisions, and problems with attention may worsen performance in day-to-day life.
Introduction
Adequate sleep is essential for optimal health and wellbeing.1–3 The American Academy of Sleep Medicine and the Sleep Research Society recommend adults sleep seven or more hours per night.4 However, about 35% of American adults report obtaining fewer than seven hours of sleep on an average night.5 Lack of sufficient sleep is associated with impaired performance, resulting in consequences ranging from reductions in workplace productivity6 to increased risk for motor vehicle accidents.7,8 Therefore, millions of American adults may be susceptible to the negative consequences of impaired performance associated with insufficient sleep.
Experimental studies corroborate the negative impact of insufficient sleep on cognitive performance.9–16 Several days of experimentally induced short sleep (3 to 5 hours per night) result in reduced vigilance, or the ability to sustain attention to relevant stimuli.17 Vigilance decrements may manifest as slower reaction time (RT) and more lapses of attention on the psychomotor vigilance task (PVT), an objective measure of alertness.18 Sleep-restricted individuals exhibit slower RT and more lapses (RTs ≥500 ms) on the PVT,9–16 with lapses rising as soon as after the first night of insufficient sleep.12 False starts (responses before a stimulus appears or RTs <100 ms, as minimum human RT tends to be at least 100 ms19) are errors of commission that suggest lack of inhibitory control20 and increased impulsivity.21 False starts also increase during sleep loss.22,23
There is wide phenotypic variability in the vulnerability to slower RT following sleep loss, with some individuals exhibiting less performance impairment compared to others.24,25 Changes in subjective sleepiness and PVT lapses demonstrate progressively increasing standard deviations over time during sleep loss.24,26 Interindividual phenotypic vulnerability to sleep loss predicts 58–68% of overall variance in lapses on the PVT.15,25,27 False starts during total sleep deprivation also demonstrate large phenotypic variability28 and a progressively increasing standard error of the mean.26 Therefore, while false starts and lapses are more numerous following sleep loss, there is often greater variability between individuals after sleep loss compared to full rest.
Such interindividual differences may be explained, in part, by differences in the effects of sleep loss on subjective alertness. Those more vulnerable to performance decrements during sleep restriction report lower alertness compared to others exhibiting less impairment.29,30 Given that individuals reporting lower alertness demonstrate slower RT31–33 and more false starts on the PVT,33 changes in subjective alertness may be an important marker of interindividual differences in fatigue and performance impairment during the accumulation of wakefulness that occurs across chronic sleep restriction.
Subjective motivation, which demonstrates a positive relationship with subjective alertness,34 may also explain interindividual differences in performance after sleep loss.35 For example, intrinsic motivation is associated with greater inhibitory control on a Go/No-Go task.36 Studies that have manipulated extrinsic motivation have demonstrated subsequent changes in performance. Introduction of monetary incentives results in greater subjective motivation and greater accuracy on sustained attention37 and target detection38 tasks, and participants had faster RT on a task that produced greater subjective motivation versus a less motivating RT task.39 Individuals with less of a decrease in subjective motivation during sleep loss may therefore demonstrate fewer performance deficits compared to others reporting a greater reduction in motivation.
Unlike subjective alertness and motivation, subjective effort may be a poor indicator of interindividual differences in performance after sleep loss. While subjective alertness and motivation and PVT performance decrease on average across sleep loss, subjective effort concurrently increases.40–42 Participants who experience reduced alertness and motivation when sleep deprived may feel as though they are exerting greater effort to compensate for limitations in capacity to perform.43 However, subjective effort is not correlated with performance during total sleep deprivation,40,44 which may indicate that participants who report exerting increased effort would still perform poorly after sleep loss. To our knowledge, no study has examined whether interindividual differences in the changes in subjective alertness, motivation, and effort during sleep restriction explain performance on the PVT, a behavioral assay with high sensitivity to sleep loss.9,15
The current study examined whether changes in subjective alertness, motivation, and effort during sleep restriction would moderate interindividual associations between sleep restriction and performance on the PVT. We hypothesized significant interactions between changes in both subjective alertness and motivation with sleep restriction on PVT outcomes (false starts, lapses, and response speed). Specifically, participants reporting greater reductions in subjective alertness and motivation during sleep restriction (compared to sleep-restricted participants with relatively preserved alertness and motivation) would exhibit more impaired performance during sleep restriction (more false starts and lapses and slower response speed). In contrast, those with more preserved levels of subjective alertness and motivation during sleep restriction would demonstrate less performance impairment. Finally, based on research reporting no association between subjective effort and performance after sleep loss,40,44 we hypothesized that those reporting more effort during sleep restriction would not perform any better than sleep-restricted participants reporting preserved subjective effort.
Materials and Methods
Participants
We recruited males between the ages of 20 and 35. Females were excluded due to the effects of the female menstrual cycle on circadian rhythms,45 and those over 35 were excluded due to potential age-related changes in sleep, including decreased deep sleep and poorer sleep quality with advancing age.46
Procedure
Recruitment
The study protocol was approved by the Institutional Review Board of The Pennsylvania State University, and all procedures conformed to the principles established by the Declaration of Helsinki. All participants provided written informed consent for both screening and in-lab procedures and were compensated for participation in the study.
Participants were recruited through posted flyers, advertisements, and research websites. Interested individuals completed a secure online pre-screening questionnaire (Qualtrics, Seattle, WA) and eligible individuals were contacted by study staff.
Screening
If an individual met the inclusion criteria as determined by the pre-screening, they were invited to in-person screening visits to further verify eligibility, confirm identity, age, and gender through government-issued identification, complete questionnaires, and receive an actigraphy device. A Clinical Research Center clinician reviewed participants’ medical histories and conducted physical exams. A clinical psychologist evaluated psychiatric and psychological suitability via structured clinical interview.
Individuals were excluded for tobacco or drug use (confirmed by urine toxicology), excessive alcohol consumption, prescription medication use, chronic medical disorders, hearing or vision impairment, neurological or sleep disorders, night or shift work within the previous three years, travel across >2 time zones within the previous 3 months (verified through comprehensive history and physical exam, questionnaire, and/or interview with clinical psychologist; see below). Other exclusion criteria were waist circumference >102 cm, body mass index (BMI) ≤18 kg/m2, seated systolic blood pressure >130 mmHg or diastolic blood pressure >85 mmHg, HbA1c ≥5.7%, HDL cholesterol <40 mg/dl, LDL cholesterol ≥145 mg/dl, fasting plasma triglycerides ≥150 mg/dl, or fasting glucose >100 mg/dl, verified by physical exam and laboratory tests.
Presence of sleep disorder was assessed both at the initial pre-screening survey through the question “Do you have any problems with your sleep?” and through the Sleep Disorders Questionnaire (SDQ)47 at a screening visit. Any indication of a sleep problem (ie, “yes” on pre-screening survey or “usually/always” experiencing a sleep problem on the SDQ) was grounds for exclusion (no participants who answered the SDQ in the current study were excluded for having a sleep problem). During a screening visit, participants completed questionnaires to assess habitual sleep patterns and sleep timing, including the Morningness-Eveningness Questionnaire (MEQ),48 and were provided a wrist-worn accelerometer with off-wrist detection (Actiwatch Spectrum; Philips-Respironics, Murrysville, PA) to wear for a week to assess habitual sleep patterns. The participant was instructed to continue to wear the wrist-worn accelerometer during the pre-study monitoring period and during the in-lab study.
Psychological illness was assessed initially by the pre-screening questionnaire, which asked if the potential participant had any current medical illness or problem or was currently taking any medications. During screening, potential participants answered whether they were ever under the care of a psychiatrist, psychologist, or counselor, and completed a questionnaire assessing mood (eg, depression and anxiety symptoms). During the structured in-person mental health interview, the clinical psychologist assessed whether the participant was psychologically fit for the study by both reviewing the completed questionnaires and asking questions regarding the participant’s psychological and social wellbeing, history of violence, mood, substance use, problems with concentration, or psychotic symptoms. The psychologist asked probing questions about how the participant would handle the potential stress they may experience in the study, including the lack of sleep, the loss of autonomy, the lack of in-person contact with friends and family, the frequent cognitive testing, and the potential boredom experienced in the lab. The clinical psychologist was also available should the study team have concerns about a participant’s mental state during the study. Only participants who passed all screening visits, including the psychologist’s interview, were invited to participate in the 11-day in-lab study.
Study Protocol
Pre-study sleep monitoring was conducted to ensure all participants were sleep replete prior to entry to the in-lab portion. Participants were instructed to spend 10 hours in bed from 22:00 to 08:00 (±1 hour) for at least one week prior to the in-lab stay, verified by actigraphy, time-stamped call-ins at bedtime and wake time, and sleep/wake logs. The sleep schedule during the monitoring period was imposed to allow the participants to become accustomed to the in-lab sleep schedule during the baseline nights of the in-lab stay, where time in bed was also from 22:00 to 08:00. The ± 1 hour cushion was added to accommodate differences in habitual sleep timing. During this period, participants were instructed to discontinue alcoholic beverages, caffeine, and over-the-counter medications.
The in-lab study took place across 10 nights (11 days). Participants were admitted to the Clinical Research Center at approximately 11:00 on admission day to a private, windowless room under constant (artificial) light levels (<100 lux in the angle of gaze during wake; complete dark at 0 lux during scheduled sleep) and temperature conditions (20°-22°C). Participants remained in the room until approximately 16:00 on the last in-lab day. The private room contained a single bed, a desk for administration of cognitive batteries, and a bathroom with a shower. Participants were not permitted to nap, sit, or recline in bed during scheduled wake times and were monitored by research assistants to confirm adherence. Light-emitting personal devices such as mobile phones and laptop computers were removed 2 hours before scheduled bedtime and were returned at least 2 hours after scheduled wake time to limit exposure to the alerting effects of blue light near the sleep episode.49
The protocol consisted of admission day, three baseline nights (the first baseline night was the habituation night) with 10 hours time in bed (TIB), five sleep restriction nights with 5 hours TIB, and then two recovery nights with 10 hours TIB. In both baseline and recovery conditions, bedtime was 22:00 and wake time was 08:00. During sleep restriction, bedtime was 00:30 and wake time was 05:30.
Approximately every two hours during wake time (except when other scheduled study procedures were occurring), participants completed the validated Joggle® Research cognitive battery,50 which lasted about 22 minutes, and a survey immediately afterward. See Figure 1 for a depiction of the 11-day study protocol and schedule of cognitive batteries and surveys.
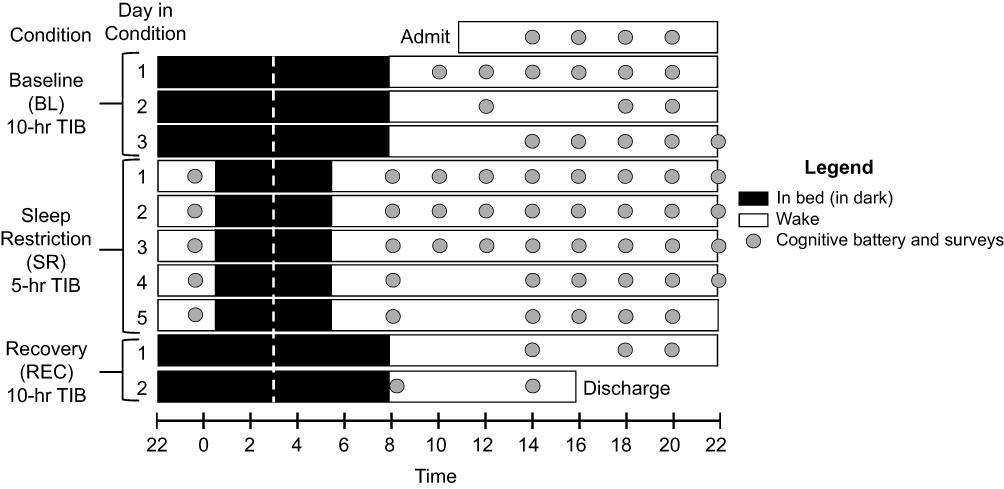 |
Figure 1 Depiction of 11-day (10-night) in-lab study protocol. Black bars represent time in bed (TIB) in dark conditions; white bars represent wake. Baseline (BL) consisted of three 10-hour TIB periods from 22:00 to 08:00. Following BL, participants were restricted to 5 hours of TIB for 5 nights from 00:30 to 05:30 (SR), followed by two 10-hour TIB recovery (REC) nights from 22:00 to 08:00. All sleep periods were centered at 03:00 to minimize circadian misalignment (white dotted line). Approximately every two hours during wake, participants completed the 20-minute cognitive battery (gray dots), including the 10-minute PVT, followed immediately by self-report of alertness, motivation, and effort. |
During the study, participants were permitted to engage in activities of their choice within their private room, provided no study procedures were scheduled at that time. Typical activities included reading, completing puzzles, light stretching, and browsing the internet. Participants did not interact in person with individuals other than research assistants and staff at the Clinical Research Center, but were able to remain in contact with friends and family remotely via telephone calls and messaging.
Participants consumed three meals per day (breakfast at 09:05, lunch at 12:05, and dinner at 18:05). Meals did not contain caffeine or alcohol (see Ness et al51 for further details).
Measures
Actigraphy
Actigraphy data were downloaded with Philips Actiware software (versions 6.0.4. and 6.0.9.). At least two independent scorers (blinded to each other) determined “day” cut-point times, validity of days, and set sleep intervals using a previously validated algorithm,52 without using information from the sleep/wake log. First, scorers reviewed recordings for participant compliance, ensuring the device was worn daily, except for permitted periods of removal when the watch could be damaged, such as during contact sports. The scorers adjudicated each recording for inter-rater agreement by verifying number of valid days, cut point, number of sleep intervals, and differences greater than 15 minutes in duration and wake after sleep onset for each sleep interval. Specifically, trained scorers determined sleep intervals using a decrease in activity levels and the aid of light levels for sleep onset and sleep offset,53 and a nighttime sleep interval was split into two intervals (main sleep and nap) if there was an awakening ≥1 hour during this interval. A sleep actigraphy day was determined invalid and no sleep interval was set if there were ≥4 total hours of off-wrist time, except the first and last day (device should have been worn at least 2 hours before sleep onset on the first day), constant false activity due to battery failure, data unable to be recovered, or an off-wrist period of ≥60 minutes within 10 minutes of the scored beginning or end of the main sleep period for that day. Measures of interest calculated by actigraphy included sleep onset, sleep midpoint, sleep offset, total sleep time (TST), and sleep maintenance efficiency for the main nighttime sleep interval.
Polysomnography
In-lab sleep was measured using both wrist actigraphy and through polysomnography (PSG; Lifelines TrackIt, Mk3, Lifelines, Ltd., St. Louis, MO; Polysmith, Neurotronics, Inc./Nihon Kohden, Irvine, CA). Electroencephalographic (EEG) electrode placement consistent with American Academy of Sleep Medicine (AASM) recommendations54,55 was used. Ground was between Cz and Pz and exploratory electrodes were placed at F3, F4, C3, C4, O1, and O2, referenced to the contralateral mastoid. Electrooculography (O1 and O2), electromyography (chin EMG at either the recommended mentalis and 2 bilateral sub-mentalis sites or at the alternative 2 bilateral masseter sites), and electrocardiography (2 EKG leads) were also included in the monitoring setup. EEG data were sampled at 200 Hz, band-pass filtered at 35–0.3 Hz, viewed at a 7 uV/mm sensitivity, and staged in 30-second epochs by a registered polysomnographic technologist according to AASM standards.54,55 Impedances were maintained below 10 kΩ. Measures of interest included TST, sleep maintenance efficiency, and minutes and percent of TST of the following: non-rapid eye movement stage 1 (N1), non-rapid eye movement stage 2 (N2), non-rapid eye movement stage 3 (N3), and rapid eye movement (REM).
Per participant, nine nights were considered for inclusion in analyses (two baseline nights as the first night was excluded, five sleep restriction nights, and two recovery nights), for a total of 135 (9*15 participants) considered nights. Almost all study nights had either no missing data or were entire recording failures (due to monitor disconnection that recorded non-biologic artifact like 60 Hz, or recording error non-biologic artifacts like calibration signal throughout). Nights that were entire recording failures (n = 14 out of all nights considered) were excluded. Some recorded nights (n = 38 out of all nights considered) had some amount of missing data (ie, recorded nonbiologic artifact like 60 Hz, not including movement-type biologic artifacts) between 0% and 100% (range: 0.1–29.6%) that was substantial enough in percentage of the sleep opportunity to risk distortion of calculated sleep metrics. On the occasion where these missing data comprised ≥5% (with each night rounded to the nearest percentage point) of a recorded sleep opportunity interval (lights-off to lights-on, recorded by study staff), we elected to exclude the night (n = 3) from analyses. In total, n = 17 out of 135 nights considered were excluded from current analyses.
Psychomotor Vigilance Task (PVT)
Performance was assessed with the PVT.56 The participants completed each PVT seated at the same desk on a touchscreen tablet, angled at approximately 120° and 32 cm from the desk edge. All eight Joggle® tasks were administered in sequence, with a 10-minute PVT (modified from the 3-minute task included with the standard Joggle® battery) administered last. During the PVT, the participant fixated on an empty red square centered on a black screen and was instructed to tap the screen as quickly as possible when a counter appeared (counting RT displayed on the screen in ms), while avoiding tapping prematurely. Upon tapping, the counter stopped, displaying the achieved RT in ms. Participants were informed when they tapped the screen before the counter appeared; the red square turned yellow and the words “false start” appeared immediately underneath. Random interstimulus intervals ranged from 2 to 10 seconds. Participants were continuously monitored to ensure adherence and to document test validity. Though participants were encouraged to respond as quickly and accurately as possible, no external incentives (eg, monetary compensation) were provided based on performance. Following the 10-minute task, the participant was presented with a graph of their performance compared to previous administrations (part of the standard Joggle® Research battery administration), with scores ranging from 0 (worst performance) to 1000 (best performance). A PVT was deemed invalid and removed from analyses with listwise deletion in the rare event of an external distraction (eg, room door opened) or technical error (eg, program crashed).
Metrics examined from the PVT were false starts, lapses, and response speed. Responses that occurred when a participant tapped the screen either before the counter appeared or RTs <100 ms were considered false starts. RTs ≥500 ms were deemed lapses.9–16 The sums of false starts and lapses per 10-minute PVT were computed separately. Response speed is more sensitive to the effects of sleep loss than raw RT22 and was calculated as 1/mean RT (per 10-minute PVT) in seconds. Similar to previous literature,22,23,57 we categorized lapses as “valid” RTs and included them in our measure of response speed, but not false starts.
Other tasks administered before the PVT included in the Joggle® Research cognitive battery50 (not analyzed here) were, in order, the Motor Praxis Test of sensorimotor speed58 (averaging 0.5 minutes), the Visual Object Learning Task59 (averaging 1.7 minutes) and Fractal 2-Back60 of visual working memory (averaging 1.9 minutes), the Abstract Matching61 task of abstraction and flexibility (averaging 2.4 minutes), the Line Orientation Task62 of visuospatial orientation processing (averaging 2.1 minutes), the Digit Symbol Substitution Task63 of processing speed and visual tracking (averaging 1.6 minutes), and the Balloon Analog Risk Task64 of risk-related decision making (averaging 2.3 minutes).
Report of Alertness, Motivation, and Effort
Subjective alertness, motivation, and effort were assessed immediately following the cognitive battery through a series of self-administered surveys on a secure website (Research Electronic Data Capture, REDCap,65 versions 6.10.11 through 8.1.16). Subjective alertness and motivation levels were assessed through visual analog scales. Participants indicated on a slider scale (values hidden) their level of alertness from “sleepy” (0) to “alert” (100), and motivation from “motivated” (0) to “unmotivated” (100). The motivation response was reverse-scored such that 0 indicated “unmotivated,” and 100 indicated “motivated.” Subjective effort was assessed with the Performance Evaluation and Effort Scale (PEERS).66 Participants were presented with the prompt, “The effort I had to expend to achieve [my] level of performance [during the Joggle test] was … ” and chose from the following options: “Very little effort” (1); “A moderate amount of effort” (2); “Quite a lot of effort” (3); or “An extreme amount of effort” (4).
Changes in Subjective Alertness, Motivation, and Effort
The difference in subjective alertness, motivation, or effort levels between the last day of baseline and the mean across all five days of sleep restriction was used to characterize changes induced by sleep restriction for each of the three measures separately (see Equation 1). We used the mean across sleep restriction rather than the final sleep restriction day because it was unknown whether the impact of sleep restriction on the subjective measures would be maximal at the end of sleep restriction (in particular, for subjective motivation and effort). First, the mean level across all administrations on the last baseline day (succeeding the third baseline night; first two days excluded) was computed (one baseline mean value for each measure) per participant. Mean levels were computed per day of sleep restriction (five daily means total for each of the three measures) and the mean of those five values was the sleep restriction mean per participant. Change in subjective alertness, motivation, or effort was computed as sleep restriction mean – baseline mean, per participant, and captured between-participant variation in the change in subjective alertness, motivation, or effort from baseline to sleep restriction.
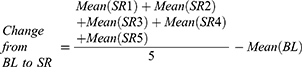
Equation 1. Calculation of change in subjective alertness, motivation, or effort from baseline (BL) to sleep restriction (SR) per participant. Note: BL above includes the last baseline day (succeeding the third baseline night) only, with the first two baseline days excluded.
Statistical Analyses
Analyses were conducted in SAS 9.4 (SAS Institute Inc., Cary, NC). To examine potential practice improvement across baseline, we analyzed the trajectory of performance for each cognitive outcome across the three baseline days in linear mixed models. Performance significantly improved across baseline on false starts; specifically, false starts were significantly fewer on the second (p = .015) and third (p = .027) baseline day compared to the first baseline day (see Table S1 for descriptives and comparisons of performance across baseline days). Therefore, participants’ performance on false starts, a key metric of interest, was optimal on the last day of baseline compared to the previous two days. Due to practice effects across multiple administrations of the cognitive tasks50 potentially obscuring the impact of sleep restriction on performance, we used the last baseline day (following 10-hour TIB sleep period 3) as the reference point for analyses of subjective measures and PVT outcomes.
Unless mentioned otherwise, all analyses were mixed models with a random intercept for participants, maximum likelihood estimation, and spatial power covariance structure, SP(POW), which takes into account that repeated measurements of a singular variable (subjective or cognitive measures) may not always be evenly spaced.67 Outliers (>|3| standard deviations, SDs, from mean) were removed from all analyses. All outcomes had skew < |3| and kurtosis < |10|. Alpha < .05 (two-sided) was deemed statistically significant.
Analyses of Sleep Measures
The changes in sleep onset, midpoint, offset, TST, and sleep maintenance efficiency among habitual, pre-study, and in-lab baseline conditions as measured with actigraphy were analyzed with mixed models with a fixed effect of condition (night 1 of baseline, the habituation night, was excluded due to the first night effect).68 A significant effect of condition was followed with analyses of each pairwise comparison (pre-study to habitual, baseline to pre-study, and baseline to habitual), corrected with Tukey’s Honestly Significant Difference (HSD) test. Similarly, the changes in TST, sleep maintenance efficiency, and minutes and percent of TST spent in N1, N2, N3, and REM among the in-lab baseline, sleep restriction, and recovery conditions as measured with PSG were analyzed.
Change in Subjective Alertness, Motivation, and Effort Across Study
The changes in subjective alertness, motivation, and effort across the days of the study were analyzed. For each measure, the best fitting out of three models was selected as the final model, determined by change in −2 log likelihood (−2LL). As −2LL follows a chi-square distribution, the subsequent model was selected as a better fit if the difference between the −2LL of adjacent models exceeded the critical chi-square value. The first model included study day (the last baseline day, five sleep restriction days, and two recovery days) as a linear predictor of subjective alertness, motivation, or effort; the second model examined the potential (polynomial) quadratic trajectory of day2 across days (added term day*day); and the third model added time of day of self-report of alertness, motivation, and effort. Similar to previous sleep restriction literature,9,12,15 we chose to model these measures as a function of day or day2 rather than condition because the effects of sleep restriction on performance may accumulate over several days. Though the predictor in these analyses was day or day2, each data point (ie, each survey administration) was included in the analyses, rather than the mean across each day. Supplementary analyses (also linear mixed models) examined the effect of time into sleep restriction (in hours, beginning at 05:30 on the day succeeding the first sleep restriction night) on the self-report and cognitive measures. Any significant trajectory for day or day2 was followed with an analysis comparing levels of subjective alertness, motivation, or effort reported during each sleep restriction (5) or recovery (2) day to the baseline reference day. To determine whether the three subjective measures varied within individuals across the protocol, we additionally examined the intraclass correlation coefficients (ICCs) for each: random effect variance/total variance.69
Associations Among Subjective Alertness, Motivation, and Effort
Linear mixed model analyses were conducted with subjective alertness predicting subjective motivation, subjective alertness predicting subjective effort, and subjective motivation predicting subjective effort, collapsed across the entire study. The within-person association between the predictor and the outcome was disaggregated by person-mean centering the variable used as the predictor (subjective alertness or motivation) across all time points and all days (ie, value at given time point minus person’s overall mean).70 The person-mean centered predictor represented the person’s individual deviation from their own mean. The between-person association was represented by each participant’s mean across all time points and all days. For each analysis, the best fitting out of two models was selected as the final model. The first model included the person-mean centered predictor and the person mean of the predictor, and the second model added time of day of self-report of alertness, motivation, and effort.
We additionally assessed between-person Pearson’s bivariate correlations among the changes in subjective alertness, motivation, and effort from baseline to sleep restriction (eg, whether participants with a greater change in subjective alertness from baseline to sleep restriction also demonstrated a greater change in subjective motivation).
Interactions Between Change in Subjective Alertness, Motivation, or Effort and Sleep Restriction on Attentional Performance
We examined whether the change in subjective alertness, motivation, or effort from baseline to sleep restriction moderated PVT performance across the study. For each PVT outcome (false starts, lapses, and response speed), the best fitting out of three models was selected as the final model. The first model included day, change, and their interaction (day*change); the second model added the quadratic trajectory (added terms day*day and day*day*change), and the third model added time of day of PVT administration. Similar to the subjective measures, each cognitive task administration was included in the analyses, rather than the mean across each day.
For significant interactions, as each moderator was continuous, we investigated the effect of day or day2 on the PVT outcome at low (1 SD below the mean) and high (1 SD above the mean) levels of the moderator. To obtain these effects, the moderator was centered at 1 SD below and at 1 SD above the mean. The analyses were re-run with the SD-centered moderator,71 again with all 15 participants in the model. The effect of day or day2 at 1 SD below or above the mean of the moderator is represented by the effect in a model with the moderator centered at 1 SD below or above the mean. For example, if an interaction between day or day2 and change in subjective alertness was significant, the same analysis was conducted twice more: once with change in subjective alertness centered at 1 SD below the mean, and once with change in subjective alertness centered at 1 SD above the mean. The effect of day or day2 in each re-run analysis indicated the effect at 1 SD below or above the mean of change in subjective alertness. If the interaction was not significant, the analysis was re-run with the moderator centered around its mean, with the effect of day or day2 indicating the effect at the mean of the moderator. If the effect of day or day2 was significant in any analysis, subsequent analyses compared performance on each sleep restriction and recovery day to the baseline reference day.
Results
Demographic Information
The final sample to complete the 11-day in-lab protocol consisted of 15 healthy males, (mean ± SD) age = 22.3 ± 2.8 years, BMI = 24.7 ± 3.0 kg/m2, with an ethnoracial composition of 60% White/Caucasian (n = 9), 20% Black/African American (n = 3), and 20% Asian (n = 3). Though 17 participants were invited to participate in the study, two individuals discontinued participation during the in-lab study and were not included in analyses, leaving N = 15. The average MEQ score for participants was 52.07 (SD = 8.92), with a range of 36 (moderate evening) to 69 (moderate morning). Therefore, none of the participants had an extreme morning or evening preference.
Sleep During Habitual, Pre-Study, and Baseline Conditions (Actigraphy)
All measures examined from actigraphy (sleep onset, midpoint, offset, TST, and maintenance efficiency) differed significantly among habitual, pre-study, and baseline (first night, the habituation night, was excluded) conditions (all p < .001; see Table 1). Sleep timing (onset, midpoint, and offset) became significantly earlier from both habitual to pre-study (onset and midpoint: p < .001; offset: p = .012) and from pre-study to baseline conditions (onset and midpoint: p < .001; offset: p = .007). Additionally, TST increased from habitual to pre-study by 0.84 hours (p < .001), but not from pre-study to baseline (p = .160). Sleep maintenance efficiency decreased by 1.37% (ie, from 88.39% to 87.02%) from habitual to pre-study (p = .020), potentially due to the increased TIB, but significantly increased by 2.92% (ie, from 87.02% to 89.94%) from pre-study to baseline (p = .001) and was not significantly different between habitual and baseline (p = .119). Therefore, the imposed 10-hour pre-study TIB successfully adapted participants to the baseline in-lab sleep schedule and aided sleep repletion prior to entry into the in-lab study. Sleep maintenance efficiency initially decreased during the pre-study sleep monitoring, but rebounded to habitual levels during the baseline condition.
 |
Table 1 Sleep Timing, Total Sleep Time, and Sleep Quality Among Habitual, Pre-Study Monitoring, and in-Lab Baseline Nights, Measured with Actigraphy (N = 15) |
Sleep During in-Lab Baseline, Sleep Restriction, and Recovery Conditions (PSG)
As measured with PSG, we confirmed that a significant difference in TST among conditions was accomplished by the sleep restriction protocol design (p < .001). In pairwise comparisons, TST was shorter during sleep restriction compared to baseline (p < .001) and longer during recovery compared to both baseline (p = .003) and sleep restriction (p < .001). Sleep maintenance efficiency, N1 minutes and percent of TST, N2 minutes and percent of TST, N3 percent of TST (but not minutes), and REM minutes and percent of TST also significantly differed among conditions (all p < .001 for overall condition effect; see Table S2 for pairwise comparisons).
Trajectories of Subjective Alertness, Motivation, and Effort
Subjective alertness (Figure 2A), motivation (Figure 2B), and effort (Figure 2C) changed significantly across the study (ie, baseline reference day, five sleep restriction days, and two recovery days) in mixed models with day2 (the quadratic trajectory for study day) as the predictor (b [95% CI, confidence interval]: alertness, 1.95 [1.60, 2.30]; motivation, 0.93 [0.65, 1.20]; effort, −0.02 [−0.03, −0.01]; all p < .001). On average, participants reported lower alertness on each day of sleep restriction compared to baseline (ie, the last baseline day, succeeding the third sleep period; all p < .001). Subjective motivation was lower on days 2 through 5 of sleep restriction compared to baseline (p < .001 to p = .003). Participants reported higher effort on days 3 (p < .001) and 4 (p = .007) of sleep restriction compared to baseline. Neither subjective alertness, motivation, nor effort were significantly different during either recovery day compared to baseline. Additionally, none of the measures significantly changed across the three baseline days (see Table S1). The ICCs were as follows: alertness, 0.19 (poor reliability); motivation, 0.62 (moderate reliability); effort, 0.35 (poor reliability). Therefore, all three measures varied within individuals across the study.
 |
Figure 2 Subjective alertness, motivation, and effort across study. Mean subjective alertness (panel A), motivation (panel B), and effort (panel C) are displayed across the in-lab study. The range for subjective alertness and motivation was 0 (low) to 100 (high); the range for subjective effort was 1 (low) to 4 (high). Significance levels for comparisons in subjective alertness, motivation, or effort to the baseline reference point (day succeeding third baseline night; BL) during sleep restriction (SR) or recovery (REC) day are denoted as follows: **p < .01, ***p < .001, two-tailed. Subjective alertness and motivation models included time of day of self-report. Error bars depict standard error of the mean (SEM). Values are estimated marginal means from linear mixed models. |
Associations Among Subjective Alertness, Motivation, and Effort
Subjective alertness positively predicted subjective motivation both within (0.34 [0.29, 0.39], p < .001; Figure 3A) and between (1.21 [0.46, 1.97], p = .002) persons across the study in mixed models. When participants reported being more alert than usual, they also reported being more motivated than usual, and participants who generally reported being more alert, compared to others who were generally less alert, also reported being more motivated. Subjective alertness also negatively predicted subjective effort within persons (−0.008 [−0.010, −0.006], p < .001; Figure 3B); when participants reported being less alert than usual, they also reported applying more effort. Subjective alertness did not predict subjective effort between persons (p = .112), and subjective motivation did not predict subjective effort within (p = .069) or between (p = .084) persons. The changes in subjective alertness, motivation, and effort from baseline to sleep restriction per participant are displayed in Figure 4. There were no significant between-person correlations among any of the three measures (change in alertness and in motivation, r = −0.24, p = .384; change in alertness and in effort, r = −0.26, p = .341; change in motivation and in effort, r = 0.01, p = .985). Therefore, changes in subjective alertness, motivation, and effort were independent constructs.
 |
Figure 3 Within-person associations of subjective alertness with motivation and effort. Subjective motivation (panel A) and effort (panel B) were predicted within persons from subjective alertness during the in-lab study (last baseline day, five sleep restriction days, and two recovery days). The range for subjective alertness and motivation was 0 (low) to 100 (high); the range for subjective effort was 1 (low) to 4 (high). The model predicting subjective motivation from alertness included time of day of self-report of motivation. Shaded areas indicate the 95% confidence interval of the predicted line. |
 |
Figure 4 Difference in subjective alertness, motivation, and effort during sleep restriction (SR) versus baseline (BL). Changes in subjective alertness (panel A), motivation (panel B), and effort (panel C) for each individual participant are displayed from the baseline reference point (day succeeding third baseline night; BL) to the mean across all sleep restriction (SR) days (see Equation 1 for calculation of change in subjective alertness, motivation, or effort). A negative value indicates the level decreased from BL to SR; a positive value indicates the level increased; 0 indicates the level remained the same. The range for subjective alertness and motivation was 0 (low) to 100 (high); the range for subjective effort was 1 (low) to 4 (high). |
Interactions Between Change in Subjective Alertness, Motivation, or Effort and Sleep Restriction on Attentional Performance
See Table 2 for interactions between change from baseline to sleep restriction in subjective alertness, motivation, or effort and day2 on PVT performance. For significant interactions, the effect of day2 on each PVT outcome is shown at low (1 SD below mean) and high (1 SD above mean) levels of the moderator; for non-significant interactions, the effect at the mean of the moderator is shown (N = 15 in all analyses; see Statistical Analyses). Comparisons of performance on each sleep restriction and recovery day to the baseline reference day are shown in Table S3. Results of analyses examining the effect of time into sleep restriction (in hours) on subjective and cognitive measures are in Table S4. Out of all PVT administrations, 4.9% were deemed invalid and removed from all analyses.
 |
Table 2 Interactions Between in-Lab Day and Changes in Subjective Alertness, Motivation, and Effort from Baseline to Sleep Restriction on Psychomotor Vigilance Task (PVT) Performance (N = 15) |
Change in Subjective Alertness from Baseline to Sleep Restriction
There were no interactions between change in subjective alertness from baseline to sleep restriction and day2 on any PVT outcome (false starts: p = .624; lapses: p = .375; response speed: p = .563). At the mean level of change in subjective alertness, false starts (p = .004), lapses (p < .001), and response speed (p < .001) changed significantly across the study in quadratic trajectories. Compared to baseline, false starts were higher on days 2 through 5 of sleep restriction (p = .008 to p = .039). Lapses were higher from day 2 of sleep restriction through the first recovery day (p < .001 to p = .015). Response speed was slower from day 1 of sleep restriction through the first recovery day (p < .001 to p = .024).
Change in Subjective Motivation from Baseline to Sleep Restriction
There were significant interactions between the change in subjective motivation from baseline to sleep restriction and day2 on false starts (p < .001) and lapses (p = .016). In those reporting a greater decrease in motivation from baseline to sleep restriction (ie, at 1 SD below the mean of change in motivation) versus those with comparatively preserved subjective motivation (ie, at 1 SD above the mean of change in motivation), false starts changed significantly across the study in a quadratic trajectory (p < .001) but did not change in those with more preserved subjective motivation (p = .665; Figure 5A). In those reporting a greater decrease in motivation, false starts were higher on days 2 through 5 of sleep restriction (p < .001 to p = .027) compared to baseline. Lapses changed significantly across the study in both those reporting a greater decrease in motivation (p < .001) and in those with more preserved subjective motivation (p = .020; Figure 5B) in quadratic trajectories. In those reporting a greater decrease in motivation, lapses were higher on days 2 through 5 of sleep restriction (p < .001 to p = .006) compared to baseline. In those reporting more preserved motivation, lapses were higher only on day 3 of sleep restriction (p = .010). There was no interaction between change in subjective motivation and day2 on response speed (p = .663), which changed significantly across the study in a quadratic trajectory at the mean level of change in subjective motivation (p < .001). At the mean, response speed was slower from day 1 of sleep restriction through the first recovery day (p < .001 to p = .024) compared to baseline.
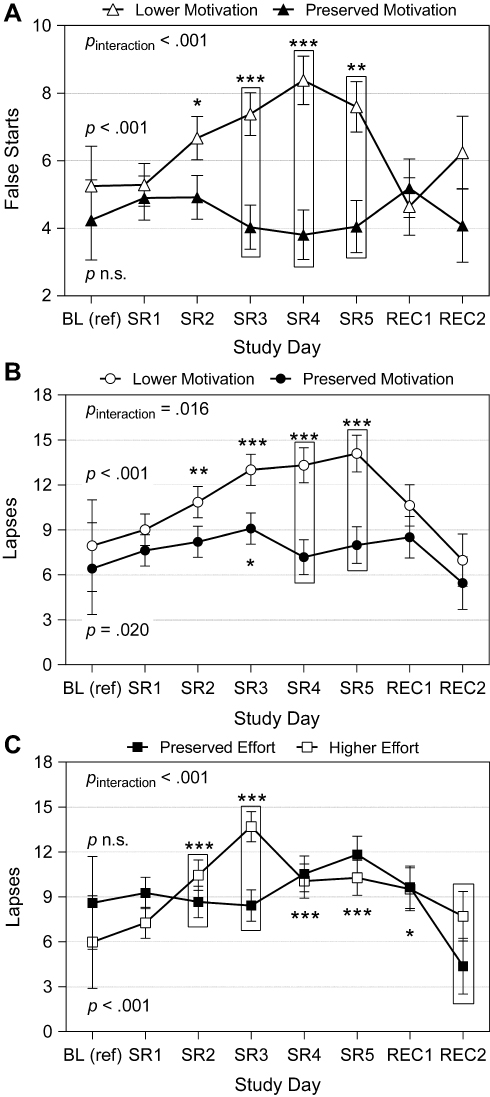 |
Figure 5 Attentional performance across in-lab study by change in subjective motivation or effort. Depicted are the number of false starts (reaction times < 100 ms) or lapses (reaction times ≥ 500 ms) per 10-minute psychomotor vigilance task (PVT) administration, moderated by the change in subjective motivation or effort per participant from the baseline reference point (day succeeding third baseline night; BL) through sleep restriction (SR; mean across all 5 days). (A) Represents false starts by change in subjective motivation; (B) Represents lapses by change in subjective motivation; (C) Represents lapses by change in subjective effort. See Equation 1 for calculation of change values and Figure 4 for depiction of change value per participant. “Lower motivation” and “preserved effort” estimates were obtained by re-centering the moderator (change in subjective motivation or effort from BL to SR, for each participant) at 1 standard deviation (SD) below the mean. “Preserved motivation” and “higher effort” estimates were obtained by re-centering the moderator at 1 SD above the mean (N = 15 in all analyses; refer to Statistical Analyses). Significance levels for comparisons to BL in false starts or lapses during given SR or recovery (REC) day, separated by level of change in subjective motivation or effort, are denoted as follows: *p < .05, **p < .01, ***p < .001. Comparisons to BL were not completed for false starts at “Preserved motivation” level (mean of motivation change + 1 SD, panel A; closed triangles) or for lapses at “Preserved effort” level (mean of effort change − 1 SD, panel C; closed squares) due to a lack of significant change across study at that level of change (see Table 2). All models included time of day of PVT administration. Error bars depict standard error of the mean (SEM). Values are estimated marginal means from linear mixed modeling. |
Change in Effort from Baseline to Sleep Restriction
There was a significant interaction between change in subjective effort from baseline to sleep restriction and day2 on lapses (p < .001; Figure 5C). In those reporting more preserved effort from baseline to sleep restriction (ie, at 1 SD below the mean of change in effort), lapses did not change across the study (p = .175). In those reporting a greater increase in effort (ie, at 1 SD above the mean of change in effort), lapses changed significantly across the study in a quadratic trajectory (p < .001). Lapses were higher on day 2 of sleep restriction through the first recovery day (p < .001 to p = .013) compared to baseline in those reporting a greater increase in effort. There was no interaction between change in subjective effort and day2 on false starts (p = .713) or response speed (p = .207), which both changed significantly across the study at the mean level of change in subjective effort in quadratic trajectories (false starts, p = .004; response speed, p < .001). At the mean, false starts were higher on days 2 through 5 of sleep restriction (p = .008 to p = .039) and response speed was slower from day 1 of sleep restriction through the first recovery day (p < .001 to p = .028) compared to baseline.
Discussion
The current study examined whether changes in subjective alertness, motivation, and effort across five nights of sleep restriction and two recovery nights moderated performance on the PVT. During sleep restriction, subjective alertness and motivation decreased, while subjective effort increased; all three measures rebounded to baseline levels after one recovery night. Furthermore, participants with a greater reduction in subjective motivation made more false starts (a marker of impaired inhibition) and lapses (a marker of degraded vigilant attention) during sleep restriction, while participants with relatively preserved subjective motivation demonstrated no change in false starts and a less pronounced increase in lapses. Those reporting more effort during sleep restriction demonstrated more lapses across sleep restriction, whereas participants with preserved subjective effort did not demonstrate a change in lapses with sleep restriction. PVT performance during sleep restriction was not moderated by change in subjective alertness. These results suggest that individuals with less of a decrease in subjective motivation after sleep restriction may be resistant to the negative effects of sleep restriction on inhibitory control and less susceptible to lapses of attention. However, individuals exerting greater subjective effort or with preserved subjective alertness during sleep restriction may still be susceptible to vigilance decrements.
The findings that individuals with a greater decrease in subjective motivation made more false starts during sleep restriction, but that lapses rose both in those with lower subjective motivation and (to a lesser extent) in those with preserved subjective motivation, suggest differences between the underlying propensity to commit more errors of omission (lapses) versus errors of commission (false starts) during sleep loss. As sleep loss generally increases impulsive behavior72 (though other research suggests no impact; see73), those with lower levels of subjective motivation during sleep restriction may be more likely to behave impulsively and commit more false starts. These individuals could therefore have difficulty overcoming the desire to tap the screen prematurely during a low-arousal, monotonous task. Subjective motivation tends to decline after sleep loss, particularly for tasks of sustained attention.40 Our results suggest interindividual differences in changes in subjective motivation that may explain differences among individuals in the susceptibility to commit false starts during sleep restriction. Our findings align with previous research demonstrating that monetary incentives failed to shorten RT on a sustained attention task but succeeded at improving accuracy.37 Similarly, greater subjective motivation on an anti-saccade task was associated with fewer errors but not a difference in RT.74 Present findings regarding false starts recorded on a touchscreen device may not translate to PVTs requiring a keypress response, as lapses and false starts are highly correlated on a keypress but not a touchscreen PVT, and false starts across the two platforms are only moderately correlated.75
In contrast to false starts, lapses and slower response speed during sleep loss reflect reduced objective behavioral alertness, possibly due to “state instability,” or variability in attention capacity resulting in part from rising homeostatic sleep pressure.26 Individuals with preserved subjective motivation, then, may demonstrate a less pronounced decrease in vigilance after sleep restriction compared to those with a greater decrease in subjective motivation. However, those with preserved subjective motivation still demonstrated more lapses of attention during sleep restriction compared to baseline, though they demonstrated no change in false starts. A more parsimonious explanation for the lack of change in false starts during sleep restriction in those with preserved subjective motivation is that participants were alerted whenever they registered responses before the millisecond counter appeared (though not for responses between 0 and 100 ms, also categorized as false starts). In contrast, participants were not explicitly alerted when lapses occurred even though they were continuously informed of their RT. It is possible that participants with increased subjective motivation used the feedback about premature responses to prevent making more false starts. Additionally, participants were presented after the task with a score comparing their performance to previous administrations, which could be intrinsically motivating. In one study, participants had shorter RT and reported greater motivation during an RT task incorporating feedback (displaying mean, shortest, and longest RTs after each trial block) compared to one with no feedback.39 Future research may determine whether incorporating feedback about long RTs can affect subsequent lapses after sleep loss in participants with preserved subjective motivation.
Individuals who are more resistant to the effects of sleep loss may naturally perform better and therefore need to apply less effort to perform well, whereas individuals more susceptible to the effects of sleep loss may apply more effort to compensate but are unable to overcome the impairment. In the current study, individuals reporting a greater increase in effort, versus others with relatively preserved subjective effort, made more lapses during sleep restriction that persisted into the first recovery day, potentially reflecting a reduced capacity to perform optimally under conditions of sleep loss. Some individuals may have to apply greater effort to remain awake and perform optimally as homeostatic sleep pressure increases, and certain individuals may have more accumulation of sleep pressure during sleep restriction due to greater sleep need. Such reduced capacity to perform may have physiological underpinnings, such as the accumulation of homeostatic sleep pressure during excess wake.76 Individuals who reported greater elevations in effort in the current study may have had incomplete dissipation of sleep pressure (defined as the dissipation of slow-wave activity during early sleep) during the first night of recovery sleep, resulting in a sustained elevation of lapses the next day. Notably, sleep pressure demonstrates trait-like differences among individuals.77,78 Participants experiencing greater sensitivity to the effects of rising homeostatic sleep pressure79 on performance may have correspondingly increased their effort to compensate for these performance limitations, but were unsuccessful as evidenced by elevated lapses. Previous research demonstrated a high correlation between false starts and lapses across 88 hours of total sleep deprivation, with the authors hypothesizing that participants attempted to compensate for lapses by increasing responses (a measure of objective effort) and, consequently, committing more false starts.26 Based on these previous findings, it would be expected that individuals reporting greater effort in the current study would commit more false starts during sleep restriction versus those with preserved effort; however, false starts increased regardless of changes in subjective effort. Accordingly, objective and subjective measures of effort during sleep restriction may be separate constructs. Future research may compare objective and subjective measures of effort during several days of sleep restriction and their associations with performance.
Our findings demonstrate that interindividual differences in the changes in subjective motivation and effort moderate the impact of sleep restriction on attentional performance. We cannot, however, conclude from the current study that reduced subjective motivation or elevated effort caused the poorer performance in these individuals. The present study did not manipulate subjective motivation or effort; thus, causation cannot be established. Rather, our results suggest potential trait-like differences among individuals in changes in subjective motivation and effort during sleep restriction that may distinguish vulnerability to poorer attentional performance between persons. Given the correlation between greater subjective motivation and better performance,37–39 it is plausible that more preserved subjective motivation prevented performance decrements in certain individuals. However, it is unlikely that increasing effort caused the increase in lapses exhibited by individuals who reported greater elevations in effort during sleep restriction.
Our findings corroborate the notion that subjective alertness is not a suitable marker for objective performance deficits during sleep restriction. Regardless of changes in subjective alertness during sleep loss, false starts and lapses increased and response speed decreased during sleep restriction, in line with previous research.9–15 Therefore, participants who reported more preserved alertness were just as likely to make false starts and lapses and exhibit slower response speed as their less-alert counterparts. While lapses increase linearly across sleep restriction,9,15 subjective alertness either does not decrease across days of sleep restriction9 or decreases at a slower rate than the increase in lapses,15 indicating a mismatch between subjective and objective measures of alertness during sleep loss. Research regarding the relationship between subjective alertness and false starts during sleep restriction is more limited, but our study suggests that, similar to impaired vigilance, preserved subjective alertness may be insufficient to maintain inhibitory control during sleep loss. The misalignment between subjective alertness and objective performance may be implicated in some instances of motor vehicle crashes induced by drowsy driving.7,8 Certain individuals, when sleep-deprived, may feel subjectively alert and could overestimate their ability to perform well in their sleep-deprived state.
The present results suggest that changes in subjective motivation and effort during sleep restriction can distinguish interindividual differences in dichotomous lapses of attention (≥500 ms) but not the continuous metric of response speed. Lapses may be due to a loss of task-oriented attention that occurs, in part, due to less subjective alertness and more fatigue.80 Though changes in subjective motivation and effort moderated the effects of sleep restriction on lapses, we did not find any interaction for response speed, perhaps because lapses of attention are fundamentally distinct from RTs that fall within the “normal” range (typically defined as 100–500 ms).80
The current study had some limitations. The sample size was somewhat small, and future studies would benefit from a larger number of participants. Only young males were recruited, limiting the generalizability of the present study. Future studies should examine whether these findings are applicable to females and/or older adults. All participants experienced the same study protocol in order: baseline, sleep restriction, and recovery, resulting in the potential for order effects on cognitive performance. However, a substantial practice effect for the task used in the current study is unlikely. The PVT requires fewer than 5 administrations before maximal performance on lapses and response speed is reached,50 and we excluded the admission day and the first two days of baseline from statistical analyses due to the improvement in false starts observed during baseline. We also used self-report for the measures of alertness, motivation, and effort in the current study, which may be subject to bias and variations in interpretation among participants, or may differ from more objective measures.81 For example, decisions requiring more effort decline after total sleep deprivation.82,83 Furthermore, the graph providing performance feedback displayed after each Joggle® task administration may have served as a motivating factor for performance. Lastly, we assessed these subjective measures after PVT administration; it is possible that subjective alertness, motivation, and effort were affected by the 10-minute low-arousal task, particularly during sleep restriction.
Conclusion
The findings from the current study bear implications for situations where unimpaired vigilance is vital for optimal functioning in the real world. Performance on the PVT is analogous to performance while operating motor vehicles84 and engaging in certain athletic activities.85 Our findings indicate that even among individuals with more preserved subjective motivation, lapses (analogous to braking too late)86 are more prevalent during sleep restriction. The present study also suggests that those with less motivation to perform during sleep loss will be more likely to demonstrate poor inhibitory control, which may lead to more impulsive decision making.87 Furthermore, our results suggest that those who have preserved subjective alertness or report greater effort during sleep restriction still demonstrate attention deficits, which impair daily functioning.1 Millions of adults therefore may be susceptible to impaired performance resulting from insufficient sleep, particularly those experiencing reduced subjective motivation and/or elevated effort after sleep loss.
Abbreviations
AASM, American Academy of Sleep Medicine; BL, baseline; BMI, body mass index; CI, confidence interval; EEG, electroencephalography; EKG, electrocardiography; EMG, electromyography; HbA1c, hemoglobin A1c; HDL, high-density lipoprotein; HSD, Honestly Significant Difference; ICC, intraclass correlation coefficient; LDL, low-density lipoprotein; MEQ, Morningness-Eveningness Questionnaire; M, mean; N1, non-rapid eye movement stage 1 sleep; N2, non-rapid eye movement stage 2 sleep; N3, non-rapid eye movement stage 3 sleep; PEERS, Performance Evaluation and Effort Scale; PSG, polysomnography; PVT, psychomotor vigilance task; REC, recovery; REM, rapid eye movement sleep; RT, reaction time; SD, standard deviation; SDQ, Sleep Disorders Questionnaire; SEM, standard error of the mean; SP(POW), spatial power; SR, sleep restriction; TIB, time in bed; TST, total sleep time.
Data Sharing Statement
The data that support the findings of this study are available on request, due to privacy or other restrictions, through co-author and PI Dr. Anne-Marie Chang ([email protected]).
Ethics Approval and Informed Consent
The Office for Research Protections (Institutional Review Board, IRB) at the Pennsylvania State University reviewed and approved this study (#1903).
Acknowledgments
We would like to thank the individuals who participated in the 11-day in-lab study. We also thank the staff of the Clinical Research Center, study collaborators, and research assistants working in the laboratory. Current address for David Scott Bailey: College of Medicine, Penn State Milton S. Hershey Medical Center, Hershey PA, USA. Current address for Katherine Buzzell: Department of Nursing, College of Public Health, Temple University, Philadelphia, PA, USA. Current address for Kelly M. Ness: Department of Medicine, Division of Metabolism, Endocrinology, and Nutrition, University of Washington, Seattle WA, USA. Current address for Nicole G. Nahmod: Department of Medical Science, Arcadia University, College of Health Sciences, Glenside, PA, USA.
Author Contributions
All authors made a significant contribution to the work reported, whether that is in the conception, study design, execution, acquisition of data, analysis and interpretation, or in all these areas; took part in drafting, revising or critically reviewing the article; gave final approval of the version to be published; have agreed on the journal to which the article has been submitted; and agree to be accountable for all aspects of the work.
Funding
This study was supported by the Clinical and Translational Science Institute (PI: A-M.C.) and by funds from the College of Health and Human Development at the Pennsylvania State University (to A-M.C. and O.M.B.). The Research Electronic Data Capture (REDCap) survey platform and the Clinical Research Center are supported by the National Center for Advancing Translational Sciences, National Institutes of Health, through grants UL1 TR002014 and UL1 TR00045. The content is solely the responsibility of the authors and does not necessarily represent the official views of the NIH.
Disclosure
None of the authors have conflicts of interests related to the material presented. Outside of the current work, O.M.B. received subcontract grants to Pennsylvania State University from Proactive Life (formerly Mobile Sleep Technologies) doing business as SleepSpace (National Science Foundation grant #1,622,766 and NIH/National Institute on Aging Small Business Innovation Research Program R43AG056250, R44 AG056250), honoraria/travel support for lectures from Boston University, Boston College, Tufts School of Dental Medicine, Harvard Chan School of Public Health, New York University, and Allstate®, consulting fees from Sleep Number, and an honorarium for his role as the Editor-in-Chief of Sleep Health (sleephealthjournal.org).
References
1. Orzeł-Gryglewska J. Consequences of sleep deprivation. Int J Occup Med Environ Health. 2010;23(1):95–114. doi:10.2478/v10001-010-0004-9
2. Strine TW, Chapman DP. Associations of frequent sleep insufficiency with health-related quality of life and health behaviors. Sleep Med. 2005;6(1):23–27. doi:10.1016/j.sleep.2004.06.003
3. Itani O, Jike M, Watanabe N, Kaneita Y. Short sleep duration and health outcomes: a systematic review, meta-analysis, and meta-regression. Sleep Med. 2017;32:246–256. doi:10.1016/j.sleep.2016.08.006
4. Watson NF, Badr MS, Belenky G, et al. Recommended amount of sleep for a healthy adult: a joint consensus statement of the American Academy of Sleep Medicine and Sleep Research Society. Sleep. 2015;38(6):843–844. doi:10.5665/sleep.4716
5. Liu Y, Wheaton AG, Chapman DP, Cunningham TJ, Lu H, Croft JB. Prevalence of healthy sleep duration among adults — United States, 2014. Morb Mortal Wkly Rep. 2016;65(6):137–141. doi:10.15585/mmwr.mm6506a1
6. National Sleep Foundation. Sleep in America Poll. National Sleep Foundation; 2008.
7. Miyata S, Noda A, Ozaki N, et al. Insufficient sleep impairs driving performance and cognitive function. Neurosci Lett. 2010;469(2):229–233. doi:10.1016/j.neulet.2009.12.001
8. Pack AI, Maislin G, Staley B, et al. Impaired performance in commercial drivers. Am J Respir Crit Care Med. 2006;174(4):446–454. doi:10.1164/rccm.200408-1146OC
9. Belenky G, Wesensten NJ, Thorne DR, et al. Patterns of performance degradation and restoration during sleep restriction and subsequent recovery: a sleep dose-response study. J Sleep Res. 2003;12(1):1–12. doi:10.1046/j.1365-2869.2003.00337.x
10. Cote KA, Milner CE, Smith BA, et al. CNS arousal and neurobehavioral performance in a short-term sleep restriction paradigm. J Sleep Res. 2009;18(3):291–303. doi:10.1111/j.1365-2869.2008.00733.x
11. Cote KA, Milner CE, Osip SL, Baker ML, Cuthbert BP. Physiological arousal and attention during a week of continuous sleep restriction. Physiol Behav. 2008;95(3):353–364. doi:10.1016/j.physbeh.2008.06.016
12. Dinges JDF, Pack F, Williams K, et al. Cumulative sleepiness, mood disturbance, and psychomotor vigilance performance decrements during a week of sleep restricted to 4–5 hours per night. Sleep. 1997;20(4):267–277.
13. Haavisto M-L, Porkka-Heiskanen T, Hublin C, et al. Sleep restriction for the duration of a work week impairs multitasking performance. J Sleep Res. 2010;19(3):444–454. doi:10.1111/j.1365-2869.2010.00823.x
14. Rabat A, Gomez-Merino D, Roca-Paixao L, et al. Differential kinetics in alteration and recovery of cognitive processes from a chronic sleep restriction in young healthy men. Front Behav Neurosci. 2016;10:1–18. doi:10.3389/fnbeh.2016.00095
15. Van Dongen HPA, Maislin G, Mullington JM, Dinges DF. The cumulative cost of additional wakefulness: dose-response effects on neurobehavioral functions and sleep physiology from chronic sleep restriction and total sleep deprivation. Sleep. 2003;26(2):117–126. doi:10.1093/sleep/26.2.117
16. Buxton OM, Pavlova M, Reid EW, Wang W, Simonson DC, Adler GK. Sleep restriction for 1 week reduces insulin sensitivity in healthy men. Diabetes. 2010;59(9):2126–2133. doi:10.2337/db09-0699
17. Corsi-Cabrera M, Arce C, Ramos J, Lorenzo I, Guevara MA. Time course of reaction time and EEG while performing a vigilance task during total sleep deprivation. Sleep. 1996;19(7):563–569. doi:10.1093/sleep/19.7.563
18. Warm JS, Parasuraman R, Matthews G. Vigilance requires hard mental work and is stressful. Hum Factors. 2008;50(3):433–441. doi:10.1518/001872008X312152
19. Collet C. Strategic aspects of reaction time in world-class sprinters. Percept Mot Skills. 1999;88(1):65–75. doi:10.2466/pms.1999.88.1.65
20. Robertson IH, Garavan H. Vigilant attention. In: Gazzaniga MS, editor. The Cognitive Neurosciences.
21. Weafer J, Baggott MJ, de Wit H. Test–retest reliability of behavioral measures of impulsive choice, impulsive action, and inattention. Exp Clin Psychopharmacol. 2013;21(6):475–481. doi:10.1037/a0033659
22. Basner M, Mcguire S, Goel N, Rao H, Dinges DF. A new likelihood ratio metric for the psychomotor vigilance test and its sensitivity to sleep loss. J Sleep Res. 2015;24(6):702–713. doi:10.1111/jsr.12322
23. Grant DA, Honn KA, Layton ME, Riedy SM, Van Dongen HPA. 3-minute smartphone-based and tablet-based psychomotor vigilance tests for the assessment of reduced alertness due to sleep deprivation. Behav Res Methods. 2017;49(3):1020–1029. doi:10.3758/s13428-016-0763-8
24. Van Dongen HPA, Baynard MD, Maislin G, Dinges DF. Systematic interindividual differences in neurobehavioral impairment from sleep loss: evidence of trait-like differential vulnerability. Sleep. 2004;27(3):423–433.
25. Van Dongen HPA, Maislin G, Dinges DF. Dealing with inter-individual differences in the temporal dynamics of fatigue and performance: importance and techniques. Aviat Space Environ Med. 2004;75(3 Suppl):A147–A154.
26. Doran SM, Van Dongen HP, Dinges DF. Sustained attention performance during sleep deprivation: evidence of state instability. Arch Ital Biol. 2001;139(3):253–267.
27. Van Dongen HPA, Dijkman MV, Maislin G, Dinges DF. Phenotypic aspect of vigilance decrement during sleep deprivation. Physiologist. 1999;42:A–5.
28. Yamazaki EM, Goel N. Robust stability of trait-like vulnerability or resilience to common types of sleep deprivation in a large sample of adults. Sleep. 2019;40:1–30.
29. Lo JC, Groeger JA, Santhi N, et al. Effects of partial and acute total sleep deprivation on performance across cognitive domains, individuals and circadian phase. PLoS One. 2012;7(9):e45987. doi:10.1371/journal.pone.0045987
30. Sletten TL, Segal AY, Flynn-Evans EE, Lockley SW, Rajaratnam SMW. Inter-individual differences in neurobehavioural impairment following sleep restriction are associated with circadian rhythm phase. PLoS One. 2015;10(6):1–16. doi:10.1371/journal.pone.0128273
31. De Gennaro L, Ferrara M, Curcio G, Bertini M. Visual search performance across 40 h of continuous wakefulness: measures of speed and accuracy and relation with oculomotor performance. Physiol Behav. 2001;74(1–2):197–204. doi:10.1016/S0031-9384(01)00551-0
32. Monk T, Buysse D, Reynolds III C, et al. Circadian rhythms in human performance and mood under constant conditions. J Sleep Res. 1997;6(1):9–18. doi:10.1046/j.1365-2869.1997.00023.x
33. Shattuck NL, Matsangas P. Psychomotor vigilance performance predicted by Epworth sleepiness scale scores in an operational setting with the United States Navy. J Sleep Res. 2015;24(2):174–180. doi:10.1111/jsr.12243
34. Axelsson J, Ingre M, Kecklund G, Lekander M, Wright KP, Sundelin T. Sleepiness as motivation: a potential mechanism for how sleep deprivation affects behavior. Sleep. 2020;43(6):1–6. doi:10.1093/sleep/zsz291
35. Hull JT, Wright KP, Czeisler CA. The influence of subjective alertness and motivation on human performance independent of circadian and homeostatic regulation. J Biol Rhythms. 2003;18(4):329–338. doi:10.1177/0748730403253584
36. Chuah YML, Venkatraman V, Dinges DF, Chee MWL. The neural basis of interindividual variability in inhibitory efficiency after sleep deprivation. J Neurosci. 2006;26(27):7156–7162. doi:10.1523/JNEUROSCI.0906-06.2006
37. Reteig LC, van den Brink RL, Prinssen S, Cohen MX, Slagter HA. Sustaining attention for a prolonged period of time increases temporal variability in cortical responses. Cortex. 2019;117:16–32. doi:10.1016/j.cortex.2019.02.016
38. Ong M, Russell PN, Helton WS. Frontal cerebral oxygen response as an indicator of initial attention effort during perceptual learning. Exp Brain Res. 2013;229(4):571–578. doi:10.1007/s00221-013-3619-9
39. Eckner JT, Chandran S, Richardson JK. Investigating the role of feedback and motivation in clinical reaction time assessment. PM&R. 2011;3(12):1092–1097. doi:10.1016/j.pmrj.2011.04.022
40. Odle-Dusseau HN, Bradley JL, Pilcher JJ. Subjective perceptions of the effects of sustained performance under sleep-deprivation conditions. Chronobiol Int. 2010;27(2):318–333. doi:10.3109/07420520903502226
41. Hsieh S, Li T-H, Tsai -L-L. Impact of monetary incentives on cognitive performance and error monitoring following sleep deprivation. Sleep. 2010;33(4):499–507. doi:10.1093/sleep/33.4.499
42. Hockey GRJ, Wastell DG, Sauer J. Effects of sleep deprivation and user interface on complex performance: a multilevel analysis of compensatory control. Hum Factors. 1998;40(2):233–253. doi:10.1518/001872098779480479
43. Engle-Friedman M. The effects of sleep loss on capacity and effort. Sleep Sci. 2014;7(4):213–224. doi:10.1016/j.slsci.2014.11.001
44. Murphy TI, Richard M, Masaki H, Segalowitz SJ. The effect of sleepiness on performance monitoring: I know what I am doing, but do I care? J Sleep Res. 2006;15(1):15–21. doi:10.1111/j.1365-2869.2006.00503.x
45. Baker FC, Driver HS. Circadian rhythms, sleep, and the menstrual cycle. Sleep Med. 2007;8(6):613–622. doi:10.1016/j.sleep.2006.09.011
46. Mander BA, Winer JR, Walker MP. Sleep and human aging. Neuron. 2017;94(1):19–36. doi:10.1016/j.neuron.2017.02.004
47. Douglass AB, Bomstein R, Nino-Murcia G, et al. The sleep disorders questionnaire I: creation and multivariate structure of SDQ. Sleep. 1994;17(2):160–167. doi:10.1093/sleep/17.2.160
48. Horne JA, Östberg O. A self-assessment questionnaire to determine morningness-eveningness in human circadian rhythms. Int J Chronobiol. 1976;4(2):97–110.
49. Figueiro MG, Bierman A, Plitnick B, Rea MS. Preliminary evidence that both blue and red light can induce alertness at night. BMC Neurosci. 2009;10:1–11. doi:10.1186/1471-2202-10-105
50. Basner M, Savitt A, Moore TM, et al. Development and validation of the cognition test battery for spaceflight. Aerosp Med Hum Perform. 2015;86(11):942–952. doi:10.3357/AMHP.4343.2015
51. Ness KM, Strayer SM, Nahmod NG, et al. Four nights of sleep restriction suppress the postprandial lipemic response and decrease satiety. J Lipid Res. 2019;60(11):1935–1945. doi:10.1194/jlr.P094375
52. Marino M, Li Y, Rueschman MN, et al. Measuring sleep: accuracy, sensitivity, and specificity of wrist actigraphy compared to polysomnography. Sleep. 2013;36(11):1747–1755. doi:10.5665/sleep.3142
53. Buxton OM, Lee S, Beverly C, et al. Work-family conflict and employee sleep: evidence from IT workers in the Work, Family and Health Study. Sleep. 2016;39(10):1911–1918. doi:10.5665/sleep.6172
54. Berry RB, Brooks R, Gamaldo CE, et al. The AASM Manual for the Scoring of Sleep and Associated Events: Rules, Terminology, and Technical Specifications, Version 2.2. American Academy of Sleep Medicine; 2015.
55. Berry RB, Brooks R, Gamaldo C, et al. AASM scoring manual updates for 2017 (Version 2.4). J Clin Sleep Med. 2017;13(05):665–666. doi:10.5664/jcsm.6576
56. Dinges DF, Powell JW. Microcomputer analyses of performance on a portable, simple visual RT task during sustained operations. Behav Res Methods Instrum Comput. 1985;17(6):652–655. doi:10.3758/BF03200977
57. Basner M, Dinges DF. Maximizing sensitivity of the psychomotor vigilance test (PVT) to sleep loss. Sleep. 2011;34(5):581–591. doi:10.1093/sleep/34.5.581
58. Gur R, Ragland J, Moberg PJ, et al. Computerized neurocognitive scanning: i. methodology and validation in healthy people. Neuropsychopharmacology. 2001;25(5):766–776. doi:10.1016/S0893-133X(01)00278-0
59. Glahn DC, Gur RC, Ragland JD, Censits DM, Gur RE. Reliability, performance characteristics, construct validity, and an initial clinical application of a Visual Object Learning Test (VOLT). Neuropsychology. 1997;11(4):602–612. doi:10.1037/0894-4105.11.4.602
60. Ragland JD, Turetsky BI, Gur RC, et al. Working memory for complex figures: an fMRI comparison of letter and fractal n-back tasks. Neuropsychology. 2002;16(3):370–379. doi:10.1037/0894-4105.16.3.370
61. Glahn DC, Cannon TD, Gur RE, Ragland JD, Gur RC. Working memory constrains abstraction in schizophrenia. Biol Psychiatry. 2000;47(1):34–42. doi:10.1016/S0006-3223(99)00187-0
62. Moore TM, Scott JC, Reise SP, et al. Development of an abbreviated form of the Penn line orientation test using large samples and computerized adaptive test simulation.. Psychol Assess. 2015;27(3):955–964. doi:10.1037/pas0000102
63. Usui N, Haji T, Maruyama M, et al. Cortical areas related to performance of WAIS digit symbol test: a functional imaging study. Neurosci Lett. 2009;463(1):1–5. doi:10.1016/j.neulet.2009.07.048
64. Lejuez CW, Read JP, Kahler CW, et al. Evaluation of a behavioral measure of risk taking: the Balloon Analogue Risk Task (BART). J Exp Psychol Appl. 2002;8(2):75–84. doi:10.1037/1076-898X.8.2.75
65. Harris PA, Taylor R, Thielke R, Payne J, Gonzalez N, Conde JG. Research electronic data capture (REDCap)—a metadata-driven methodology and workflow process for providing translational research informatics support. J Biomed Inform. 2009;42(2):377–381. doi:10.1016/j.jbi.2008.08.010
66. Dinges D, Kribbs N, Steinberg K, Powell J. Do we lose the willingness to perform during sleep deprivation? [abstract]. Sleep Res. 1992;21:318.
67. Liu X. Patterns of Residual Covariance Structure. 2016. Chapter 5, Methods and Applications of Longitudinal Data Analysis. Higher Education Press, San Diego, CA.
68. Agnew HW, Webb WB, Williams RL. The first night effect: an EEG Study of Sleep. Psychophysiology. 1966;2(3):263–266. doi:10.1111/j.1469-8986.1966.tb02650.x
69. Koo TK, Li MY. A guideline of selecting and reporting intraclass correlation coefficients for reliability research. J Chiropr Med. 2016;15(2):155–163. doi:10.1016/j.jcm.2016.02.012
70. Hoffman L, Stawski RS. Persons as contexts: evaluating between-person and within-person effects in longitudinal analysis. Res Hum Dev. 2009;6(2–3):97–120. doi:10.1080/15427600902911189
71. Aiken LS, West SG. Multiple Regression: Testing and Interpreting Interactions. Sage Publications, Inc.; 1991.
72. Demos KE, Hart CN, Sweet LH, et al. Partial sleep deprivation impacts impulsive action but not impulsive decision-making. Physiol Behav. 2016;164:214–219. doi:10.1016/j.physbeh.2016.06.003
73. Acheson A, Richards JB, de Wit H. Effects of sleep deprivation on impulsive behaviors in men and women. Physiol Behav. 2007;91(5):579–587. doi:10.1016/j.physbeh.2007.03.020
74. Kelly CL, Crawford TJ, Gowen E, Richardson K, Sünram-Lea SI. A temporary deficiency in self-control: can heightened motivation overcome this effect? Psychophysiology. 2017;54(5):773–779. doi:10.1111/psyp.12832
75. Honn KA, Riedy SM, Grant DA. Validation of a portable, touch-screen psychomotor vigilance test. Aerosp Med Hum Perform. 2015;86(5):428–434. doi:10.3357/AMHP.4165.2015
76. Maric A, Lustenberger C, Werth E, Baumann CR, Poryazova R, Huber R. Intraindividual increase of homeostatic sleep pressure across acute and chronic sleep loss: a high-density EEG study. Sleep. 2017;40(9):1–9.
77. Rusterholz T, Tarokh L, Van Dongen HPA, Achermann P. Interindividual differences in the dynamics of the homeostatic process are trait-like and distinct for sleep versus wakefulness. J Sleep Res. 2017;26(2):171–178. doi:10.1111/jsr.12483
78. Viola AU, Archer SN, James LM, et al. PER3 polymorphism predicts sleep structure and waking performance. Curr Biol. 2007;17(7):613–618. doi:10.1016/j.cub.2007.01.073
79. Fulcher BD, Phillips AJK, Robinson PA. Quantitative physiologically based modeling of subjective fatigue during sleep deprivation. J Theor Biol. 2010;264(2):407–419. doi:10.1016/j.jtbi.2010.02.028
80. Jones RD, Poudel GR, Innes CRH, et al. Lapses of responsiveness: characteristics, detection, and underlying mechanisms.
81. Paulhus DL. Measurement and control of response bias. In: Robinson JP, Shaver PR, Wrightsman LS, editors. Measures of Personality and Social Psychological Attitudes. Academic Press; 1991:17–59.
82. Engle-Friedman M, Mathew GM, Martinova A, Armstrong F, Konstantinov V. The role of sleep deprivation and fatigue in the perception of task difficulty and use of heuristics. Sleep Sci. 2018;11(2):74–84. doi:10.5935/1984-0063.20180016
83. Massar SAA, Lim J, Sasmita K, Chee MWL. Sleep deprivation increases the costs of attentional effort: performance, preference and pupil size. Neuropsychologia. 2019;123(February 2018):169–177. doi:10.1016/j.neuropsychologia.2018.03.032
84. McManus B, Heaton K, Stavrinos D. Commercial motor vehicle driving performance: an examination of attentional resources and control using a driving simulator. J Exp Psychol Appl. 2017;23(2):191–203. doi:10.1037/xap0000120
85. Ballester R, Huertas F, Pablos-Abella C, Llorens F, Pesce C. Chronic participation in externally paced, but not self-paced sports is associated with the modulation of domain-general cognition. Eur J Sport Sci. 2019;19(8):1110–1119. doi:10.1080/17461391.2019.1580318
86. Dorrian J, Roach GD, Fletcher A, Dawson D. Simulated train driving: fatigue, self-awareness and cognitive disengagement. Appl Ergon. 2007;38(2):155–166. doi:10.1016/j.apergo.2006.03.006
87. Portugal ACA, Afonso AS
 © 2021 The Author(s). This work is published and licensed by Dove Medical Press Limited. The
full terms of this license are available at https://www.dovepress.com/terms
and incorporate the Creative Commons Attribution
- Non Commercial (unported, 3.0) License.
By accessing the work you hereby accept the Terms. Non-commercial uses of the work are permitted
without any further permission from Dove Medical Press Limited, provided the work is properly
attributed. For permission for commercial use of this work, please see paragraphs 4.2 and 5 of our Terms.
© 2021 The Author(s). This work is published and licensed by Dove Medical Press Limited. The
full terms of this license are available at https://www.dovepress.com/terms
and incorporate the Creative Commons Attribution
- Non Commercial (unported, 3.0) License.
By accessing the work you hereby accept the Terms. Non-commercial uses of the work are permitted
without any further permission from Dove Medical Press Limited, provided the work is properly
attributed. For permission for commercial use of this work, please see paragraphs 4.2 and 5 of our Terms.