Back to Journals » Eye and Brain » Volume 15
Changes in Ocular Biomarkers from Normal Cognitive Aging to Alzheimer’s Disease: A Pilot Study
Authors Chaitanuwong P ![]() , Jariyakosol S
, Jariyakosol S ![]() , Apinyawasisuk S, Hirunwiwatkul P
, Apinyawasisuk S, Hirunwiwatkul P ![]() , Lawanlattanagul H, Hemrungrojn S, Chongpison Y
, Lawanlattanagul H, Hemrungrojn S, Chongpison Y
Received 30 September 2022
Accepted for publication 16 February 2023
Published 1 March 2023 Volume 2023:15 Pages 15—23
DOI https://doi.org/10.2147/EB.S391608
Checked for plagiarism Yes
Review by Single anonymous peer review
Peer reviewer comments 3
Editor who approved publication: Professor Margaret Wong-Riley
Pareena Chaitanuwong,1,2 Supharat Jariyakosol,3,4 Supanut Apinyawasisuk,3,4 Parima Hirunwiwatkul,3,4 Hathairat Lawanlattanagul,3,4 Solaphat Hemrungrojn,5,6 Yuda Chongpison7
1Ophthalmology Department, Rajavithi Hospital, Ministry of Public Health, Bangkok, Thailand; 2Department of Ophthalmology, Faculty of Medicine, Rangsit University, Bangkok, Thailand; 3Department of Ophthalmology, Faculty of Medicine, Chulalongkorn University, Bangkok, Thailand; 4Ophthalmology Department, King Chulalongkorn Memorial Hospital, Thai Red Cross Society, Bangkok, Thailand; 5Department of Psychiatry, Faculty of Medicine, Chulalongkorn University, Bangkok, Thailand; 6Cognitive Fitness and Biopsychiatry Technology Research Unit, Faculty of Medicine, Chulalongkorn University, Bangkok, Thailand; 7Biostatistics Excellence Center, Research Affairs, Faculty of Medicine, Chulalongkorn University, Bangkok, Thailand
Correspondence: Supharat Jariyakosol, Department of Ophthalmology, Faculty of Medicine, Chulalongkorn University, 1873 Rama IV Road, Pathumwan, Bangkok, 10330, Thailand, Email [email protected]
Purpose: To identify ophthalmic findings in Alzheimer’s type dementia (ATD) compared to normal subjects.
Patients and Methods: This comparative descriptive study included participants from the institution’s cognitive fitness center. Complete ophthalmic examinations were performed. Optical coherence tomography (OCT) and OCT angiography (OCTA) were used to analyze retinal thickness and vascular density. The Ocular Surface Disease Index (OSDI) score and tear breakup time (TBUT) were used to assess dry eye. The blink rate was counted by a well-trained observer. Cognitive function was evaluated using the Thai Mental State Examination (TMSE) score. Correlation analysis was performed to compare OCT, OCTA parameters, and TMSE.
Results: We included 24 ATD patients and 39 normal participants as a control group by age and sex-matched. The prevalence of dry eye using the Asia Dry Eye Society criteria was 15% and 13% in normal and ATD patients, respectively. The differences in OSDI scores, TBUT, and blink rate between the two groups were not statistically significant. The parafoveal and perifoveal macular thickness of the ATD group were significantly lower than that of the control group (p< 0.01). All parameters of the vessel density of the ATD group were significantly lower than in the control group, including the whole macular vessel density (p< 0.01), optic disc vessel density at the nerve head level (p< 0.01), and optic disc vessel density at the radial peripapillary capillary level (p< 0.05). After age adjustment, there were no statistically significant differences in all the OCT and OCTA parameters. There was a positive correlation between retinal thickness and vessel density in the macular and optic disc region and TMSE scores.
Conclusion: Perifoveal and parafoveal retinal thickness might be more sensitive than peripapillary RNFL thickness to detect neurodegenerative changes in patients with ATD. Macular thickness and vessel density reduction were also positively correlated with cognitive decline.
Keywords: Alzheimer, OCT, OCTA, TMSE, dry eye
Introduction
According to WHO data published in 2022, there are estimated to be more than 55 million people with dementia worldwide. The prevalence of dementia was 2.35 to 3.1% in Thailand,1 however, the actual number of cases is likely to be higher due to underdiagnosis and lack of accessibility to healthcare in some areas. Alzheimer’s type dementia (ATD) is the most common type of dementia affecting elderly adults.1,2 ATD is characterized by a specific pathological change in the brain, which are amyloid-beta protein (Aβ) deposits and neurofibrillary tangles (NFT) producing local inflammation and ganglion cell degeneration. Patients with ATD suffer from a spectrum of cognitive and neuropsychiatric symptoms including severe memory loss, behavioral changes, disorientation, visual impairments, sleep disturbances, difficulty walking and swallowing, and alteration of self-consciousness.
An ATD diagnosis is made based on clinical presentations by an experienced neurologist or neuropsychiatrist and confirmed only by a postmortem brain biopsy.3 At the moment, non-invasive procedures that assist in the diagnosis of ATD have been gaining interest as novel diagnostic tools. Retinal blood vessels and nerve fibers are one of the most visualizable parts of the central nervous system and have been found to be associated with various neurological disorders such as multiple sclerosis and stroke.4–6
Previous studies on ATD patients have demonstrated retinal pathology including loss of retinal ganglion cells, atrophy of retinal nerve fiber layer, thinning of macular ganglion cells, optic nerve axonal degeneration, and decreased retinal vascular density.3,7 Optical coherence tomography (OCT) and optical coherence tomography angiography (OCTA) are non-invasive imaging technologies that have been widely used to evaluate retinal parameters. To the authors’ knowledge, there has been no study investigating retinal parameters in Thai ATD patients. This study aimed to evaluate various ocular parameters, especially retinal thickness and retinal vascular density, in patients with ATD compared to normal subjects. We also investigated the correlation between ocular parameters and mental state examination results; the Thai Mental State Examination (TMSE) score. Moreover, to the best of our knowledge, our study might be the first report investigating the prevalence of dry eye in ATD patients.
Materials and Methods
This comparative descriptive study was approved by the Faculty of Medicine, Chulalongkorn University’s institutional review board, and the study was conducted and performed in accordance with the ethical standards set out in the Declaration of Helsinki. Informed consent was obtained from all patients. We recruited the participants with ATD who visited the Cognitive Fitness Center, King Chulalongkorn Memorial Hospital, Bangkok, Thailand into the ATD group and age- and sex-matched healthy participants who had normal cognitive status into the control group.
The diagnosis of ATD was made using the 2011 Alzheimer’s disease diagnostic guideline of the National Institutes of Health and the Alzheimer’s Association. All participants in both the ATD and the control group underwent comprehensive examinations including a complete neurological examination, the Thai Mental State Examination (TMSE), which is a Thai version of the Mini-Mental State Examination (MMSE) developed in 1993 (Supplementary File 1).8 Brain magnetic resonance imaging (MRI) was performed in all participants in the ATD group to exclude other neurological disorders. All neuropsychiatric and neurologic evaluations were performed by a single experienced neuropsychiatrist (SH).
Participants in both groups received a complete ophthalmic examination including best-corrected visual acuity (BCVA), intraocular pressure (IOP), blink rate (times per minute), anterior and posterior segment examination using slit lamp biomicroscopy, tear breakup time (TBUT), ocular surface evaluation using the Ocular Surface Disease Index (OSDI), and axial length measurement using optical biometry (IOLMaster 500, Carl Zeiss AG, Oberkochen, Germany). We used the criteria of the Asia Dry Eye Society (ADES) to diagnose dry eye.9
Demographic and clinical data, including medical conditions, were recorded. The exclusion criteria for both groups were: BCVA < 20/200; refractive error > ±4.00 D spherical equivalent; axial length < 22 mm and > 26 mm; IOP >22 mmHg; pre-existing macular pathologies such as age-related macular degeneration, epiretinal membrane or macular hole; other retinopathies such as retinal vascular occlusion or retinal dystrophy; pre-existing ocular diseases such as glaucoma, optic neuropathy or uveitis; previous intraocular surgery within 12 months before enrollment except for uncomplicated cataract surgery; history of ocular trauma; current smoker; and presence of other neurological or psychiatric disorders, including other types of dementia.
OCT and OCTA Measurements
The imaging of all participants in both groups was obtained by a single operator using Optovue and Angiovue OCTA machine (Optovue Inc., Fremont, California, USA, Software Version 2016) with a scan rate of 70,000 A-scans per second. A volumetric scan of 304×304 A-scans at 70,000 A-scans/s within 3 s was used for a 3×3 mm picture and 400×400 A-lines was used for a 6×6 mm picture. A minimum signal strength of 60 was required as a qualified scan to be included in the analysis. The vascular structures were evaluated using 6×6 mm OCTA angiogram software. Full-thickness retinal scans around the macula and optic disc were automatically segmented into the superficial and deep inner retinal vascular plexuses and outer retina. OCTA segmentation demonstrates the projection of the vasculature in the superficial and deep inner retina (Figure 1). The vascular density in superficial retinal vascular zone of macular and optic disc area was calculated automatically by this software. The densities of optic nerve head (ONH) vessels were determined from the “nerve head segment” (which extends from the internal limiting membrane to 150 μm below) to the “radial peripapillary capillary (RPC) segment” (which extends from the internal limiting membrane to the RNFL).
 |
Figure 1 (A and B) represent optical coherence tomography angiography (OCTA) of optic disc and macular region respectively in Alzheimer’s type dementia (ATD) patient. (C and D) represent OCTA of optic disc and macular region in normal participant. In ATD eye, as shown, vessel density at optic nerve and macula was lower compared to normal eye. |
Statistics
Statistical analysis was performed using Stata 17 (StataCorp. 2021. Stata Statistical Software: Release 17. College Station, TX: StataCorp LLC.).10 The right eye of each participant was selected for the analyses. The normality assumption for the independent variables was checked with the normality plots test. To compare the groups, the independent t-test and the Mann–Whitney U-test were applied. Variables that were consistent with the normality assumption were subjected to the independent t-test, while those that did not meet the normality assumption were subjected to the Mann–Whitney U-test. The correlation analysis between the ophthalmic evaluation and the TMSE score was estimated using Spearman correlation. To control for age as a confounding factor, linear regression was used to compare the OCT and OCTA parameters between the groups.
Results
Demographic Data and Ocular Parameters
We included 24 ATD patients and 39 normal participants as a control group. Demographic data and ocular parameters were not statistically different between the two groups. The mean TMSE score in the ATD group was significantly lower than in the control group (p<0.001). The prevalence of dry eye using the ADES criteria was 15% and 13% in normal and ATD patients, respectively. The OSDI score for the control group was statistically higher. There were no statistically significant differences in tear breakup time (TBUT) or blink rate between the two groups (Table 1).
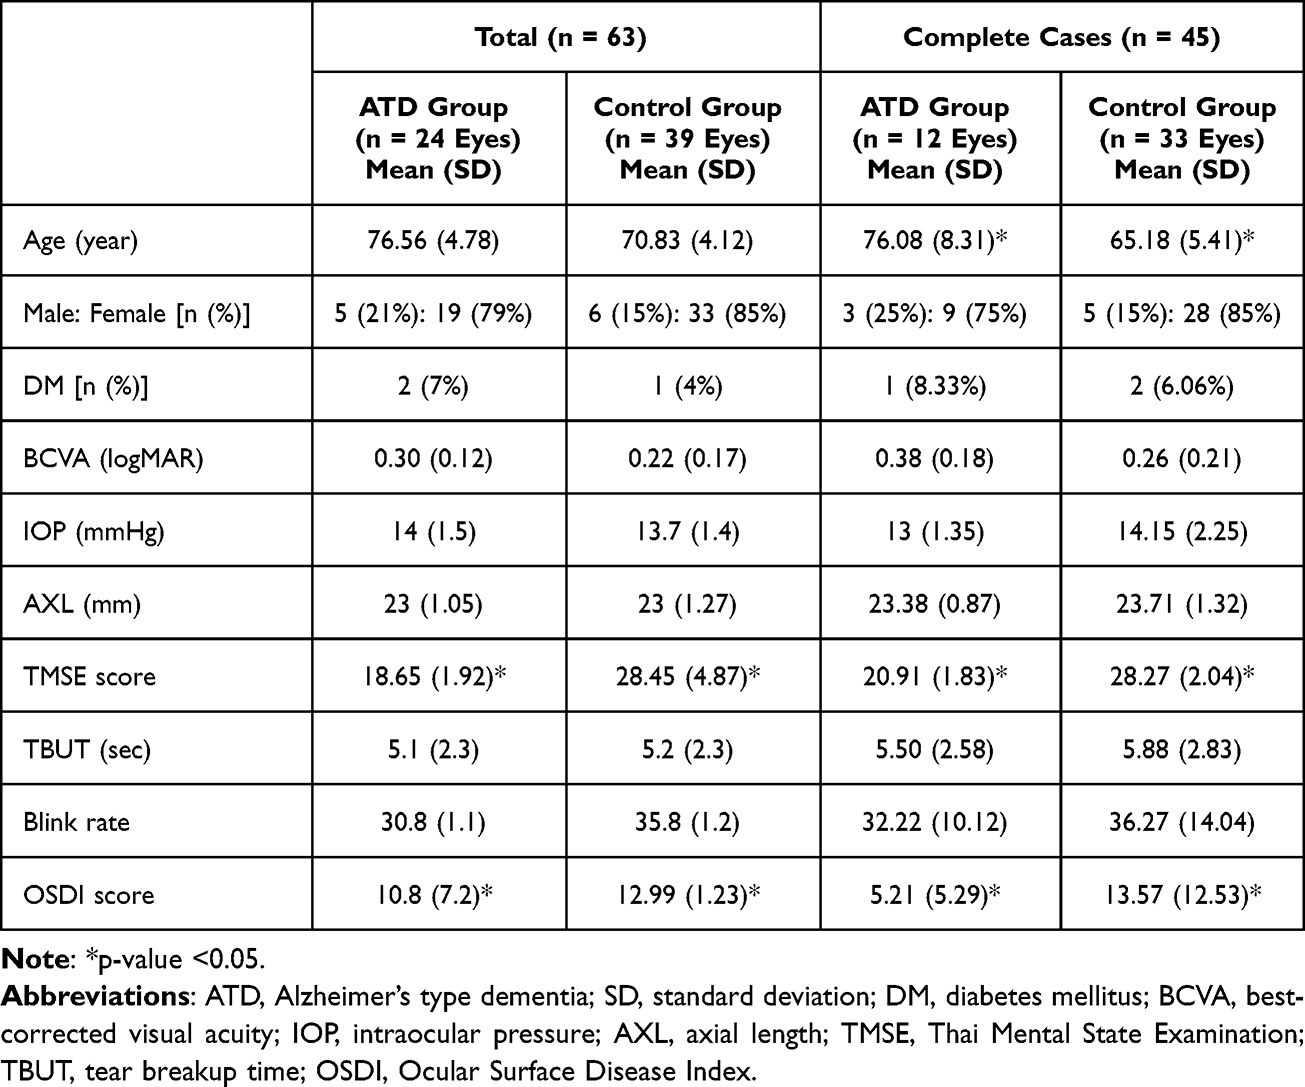 |
Table 1 Patient Demographic, Ocular Parameters, and TMSE Score in the ATD Group Compared to the Normal Control Group in All Participants, and Analysis Set |
Among 63 participants, 45 (33 from the control group and 12 from ATD group) had complete OCT and OCTA data with sufficient quality images and were included in the analyses. The ATD group had a significantly higher mean age than the control group. The TMSE score in the ATD group was significantly lower than in the control group (p<0.001). The OSDI score was statistically higher in the control group. Other demographic and ocular parameters showed no statistically significant difference (Table 1).
OCT and OCTA Parameters
Parafoveal macular thickness and volume in the inferior and nasal quadrants were significantly lower in the ATD group. Perifoveal macular thickness and volume in all quadrants were significantly lower in the ATD group (p<0.02). Peripapillary RNFL thickness, foveal thickness and volume were lower in the ATD group, but the difference was not statistically significant (p>0.05, p=0.06 correspondingly) (Table 2).
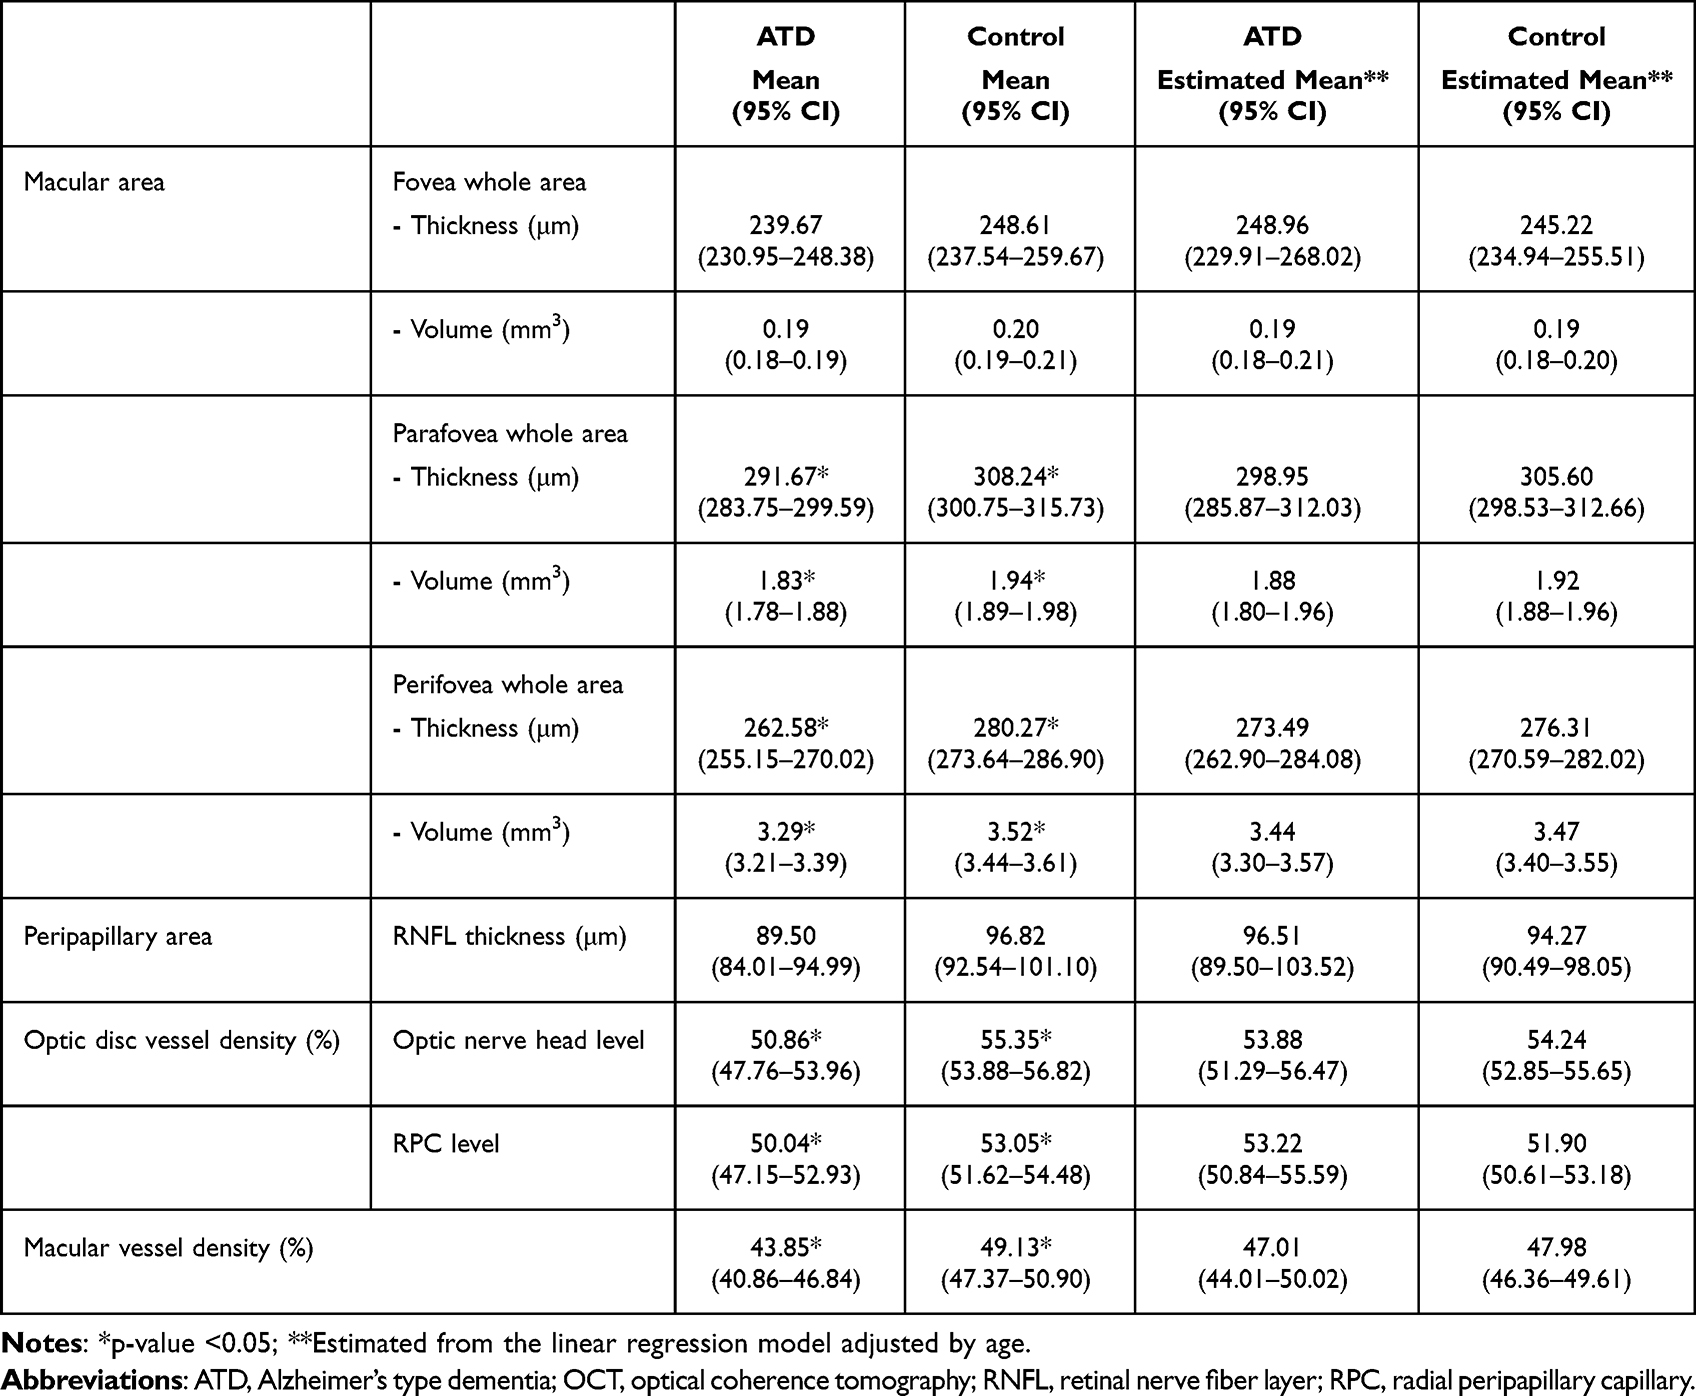 |
Table 2 OCT and OCTA Parameters in the ATD and Normal Group |
All vessel density parameters in the ATD group were significantly lower, including the whole macular vessel density (p<0.01), optic disc vessel density at the nerve head level (p<0.05), and optic disc vessel density at the radial peripapillary capillary (RPC) level (p<0.05) (Table 2). In the optic disc area, the most significant difference in vessel density was found in the inferior and nasal quadrants. In the macular area, the difference of vessel density was significant in all quadrants.
After adjusting for age, there were no statistically significant differences in all parameters of OCT and OCTA, indicating that an independent age effect cannot be excluded.
Correlation Between the TMSE Score and OCT, OCTA Parameters
All OCT and OCTA parameters had a statistically significant positive correlation with the TMSE score. Among the OCT parameters, the thickness of the macula in parafoveal and perifoveal areas, and RNFL thickness moderately correlated with the TMSE score; while foveal thickness had a weak correlation with the TMSE score (foveal thickness r = 0.20, p = 0.037; parafoveal thickness r = 0.42, p = 0.01; perifoveal thickness r = 0.43, p = 0.002; RNFL thickness r = 0.39, p = 0.003). (Figure 2) For the OCTA parameters, vessel density in the macular area had the strongest correlation (r = 0.49, p = 0.001), followed by the peripapillary optic nerve head level (r = 0.46, p = 0.005) and the RPC level (r = 0.41, p = 0.01) (Figure 3).
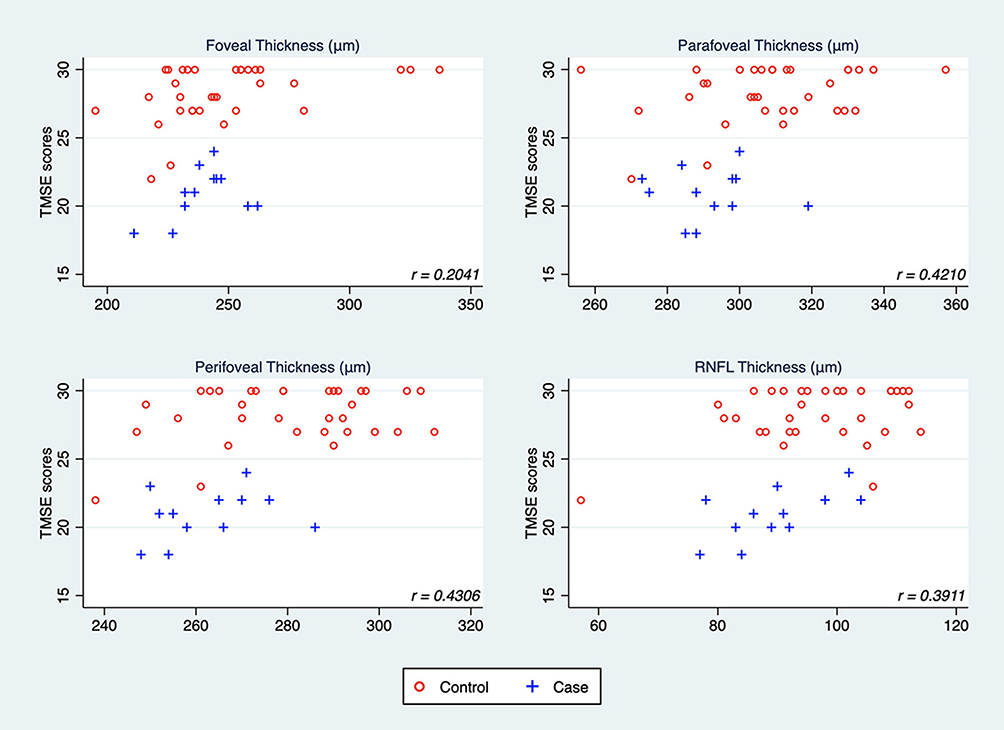 |
Figure 2 Scatter plot showed distribution between the Thai Mental State Examination (TMSE) score and the thickness of macular area and retinal nerve fiber layer (RNFL). (r: Spearman’s rank correlation coefficient). |
 |
Figure 3 Scatter plot showed distribution between the Thai Mental State Examination (TMSE) score and the optical coherence tomography angiography value in peripapillary area and macula. (r: Spearman’s rank correlation coefficient). |
Discussion
Consistent with the results of previous studies,11–16 the study revealed that the participants in the ATD group had significantly less thickness and volume of the perifoveal and parafoveal retina. On the contrary, the foveal retinal thickness was not significantly different between groups. These findings suggest that perifoveal and parafoveal areas might be more sensitive to neurodegenerative changes in ATD patients than foveal area. Retinal ganglion cell density in perifoveal and parafoveal areas is higher than in foveal area. Thus, a neurodegeneration process resulting in ganglion cells’ axonal loss might have more effect on the thickness of perifoveal and parafoveal retina than on the thickness of foveal area. The findings emphasize the importance of perifoveal and parafoveal areas, rather than foveal center to detect early axonal loss related to neurodegenerative change. Retinal vascular density decreased significantly in both peripapillary and macular regions of the ATD group. This indicates that the retinal vascular density might be more sensitive to neurodegenerative change than the retinal thickness and volume. We propose the thickness of the perifoveal and parafoveal retina, and the vascular density of the retina, as an indicator for the early detection of ATD. However, some OCT and OCTA parameters were unobtainable in some participants during the data collection process, resulting in a significant difference in mean age between the two groups after excluding an incomplete data set. Several studies have reported a significantly decreased in macular thickness and vessel density with age.17,18 After adjusting for age, there were no significant differences in all parameters. This indicates that age is a very important factor affecting retinal thickness and vascular density. There have been several studies reporting no significant difference in these parameters between ATD patients and normal control.19–21
We discovered a significant positive correlation between cognitive performance and retinal thickness and vessel density over macular and optic disc region. There has been a study reporting a correlation between cognitive function, using the Mini-Mental State Examination (MMSE) and OCT parameters in the macular region.22 The other study also reported a positive correlation between peripapillary RPC vessel density and the Montreal Cognitive Assessment (MoCA) scores.23 The result of our study agrees with previous studies, which revealed a weak to moderate correlation between cognitive scores and OCT and OCTA parameters. However, we found that retinal thickness in the macular region, especially in the perifoveal area, and also macular vessel density demonstrated a higher correlation with TMSE than in the optic disc region. The findings are supporting evidence for our aforementioned proposal to detect an early neurodegenerative change in the perifoveal and parafoveal retina than in the foveal and peripapillary area.
In our study, we found no statistically significant differences in general ocular examination between groups, including best-corrected visual acuity, intraocular pressure, axial length, blink rate, and tear breakup time. The blink rate and TBUT were lower in the ATD group, which is comparable to other studies.24 However, there was no statistically significant difference. Interestingly, the OSDI score in the control group was significantly higher than in the ATD group despite the fact that other objective tests for dry eye were not significantly different. This reflects a discordance between the subjective and objective evaluation of dry eye. We hypothesized that the ATD group has decreased corneal nerve fibers and tends to be less sensitive to dry eye symptoms, resulting in an underrated OSDI score.25
The study has some limitations. First, we included a small number of participants into the analysis because some of the main parameters were unobtainable in both ATD and control group due to poor cooperation and ocular media opacity related to participants’ advanced age. The limitation led to a significant difference in age between groups, which is the most important confounder affecting the main outcomes. Second, we did not access the choroidal thickness due to the limitation of the device. Therefore, we propose a further study including more participants, and using an OCTA device that is able to access the choroidal vasculature in order to explore whether there is any vascular change in the choroid in addition to the retinal thickness and vascular changes. The other potential limitation included that we did not collect visual field test results and some other clinical parameters, as well as genetic information, which might affect our results.26 In addition, we suggest a future study including participants with mild cognitive impairment to investigate whether the correlation between OCT and OCTA parameters and TMSE is still demonstrable. This will be very helpful in detecting the early change before the patient has ATD and will allow the physician to provide preventive intervention.
Conclusion
Perifoveal and parafoveal retinal thickness might be more sensitive than peripapillary RNFL thickness to detect a neurodegenerative change in ATD patients and could be used to detect a neurodegenerative change in ATD. Macular thickness and vessel density reduction were also positively correlated with cognitive decline.
Disclosure
The authors report no conflicts of interest in this work.
References
1. Dharmasaroja PA, Assanasen J, Pongpakdee S, et al. Etiology of dementia in Thai patients. Dement Geriatr Cogn Dis Extra. 2021;11(1):64–70. doi:10.1159/000515676
2. Patterson C. Adi - World Alzheimer report 2018. Alzheimer’s Disease International (ADI); 2018. Available from: https://www.alzint.org/resource/world-alzheimer-report-2018/.
3. Lim JK, Li QX, He Z, et al. The eye as a biomarker for Alzheimer’s disease. Front Neurosci. 2016;10:536.
4. Archibald NK, Clarke MP, Mosimann UP. The retina in Parkinson’s disease. Brain J Neurol. 2009;132:1128–1145.
5. Calabresi PA, Balcer LJ. Retinal pathology in multiple sclerosis: insight into the mechanisms of neuronal pathology. Brain J Neurol. 2010;133:1575–1577.
6. Ong YT, De Silva DA, Cheung CY, et al. Microvascular structure and network in the retina of patients with ischemic stroke. Stroke J Cereb Circ. 2013;44:2121–2127.
7. Hart NJ, Koronyo Y, Black KL, Koronyo-Hamaoui M. Ocular indicators of Alzheimer’s: exploring disease in the retina. Acta Neuropathol. 2016;132(6):767–787.
8. Train the Brain Forum Committee. Thai mental state examination (TMSE). Siriraj Hosp Gaz. 1993;45:661–674.
9. Tsubota K, Yokoi N, Shimazaki J, et al. New perspectives on dry eye definition and diagnosis: a consensus report by the Asia Dry Eye Society. Ocul Surf. 2017;15(1):65–76.
10. StataCorp. Stata Statistical Software: Release 17. College Station, TX: StataCorp LLC; 2021.
11. Chan VT, Sun Z, Tang S, et al. Spectral-domain OCT measurements in Alzheimer’s disease: a systematic review and meta-analysis. Ophthalmology. 2019;126(4):497–510.
12. Garcia-Martin ES, Rojas B, Ramirez AI, et al. Macular thickness as a potential biomarker of mild Alzheimer’s disease. Ophthalmology. 2014;121(5):1149–1151.
13. Lahme L, Esser EL, Mihailovic N, et al. Evaluation of ocular perfusion in Alzheimer’s disease using optical coherence tomography angiography. J Alzheimers Dis. 2018;66(4):1745–1752.
14. Wang X, Zhao Q, Tao R, et al. Decreased retinal vascular density in Alzheimer’s disease (AD) and mild cognitive impairment (MCI): an optical coherence tomography angiography (OCTA) study. Front Aging Neurosci. 2021;12:572484.
15. Yoon SP, Thompson AC, Polascik BW, et al. Correlation of OCTA and volumetric MRI in mild cognitive impairment and Alzheimer’s disease. Ophthalmic Surg Lasers Imaging Retina. 2019;50(11):709–718.
16. Yan Y, Wu X, Wang X, et al. The retinal vessel density can reflect cognitive function in patients with Alzheimer’s disease: evidence from optical coherence tomography angiography. J Alzheimers Dis. 2021;79(3):1307–1316.
17. Chauhan BC, Vianna JR, Sharpe GP, et al. Differential effects of aging in the macular retinal layers, neuroretinal rim, and peripapillary retinal nerve fiber layer. Ophthalmology. 2020;127(2):177–185.
18. Yoshikawa Y, Shoji T, Kanno J, et al. Examination of age-related retinal vascular changes in the macula using optical coherence tomography angiography of the eyes after cataract surgery. Clin Ophthalmol. 2021;15:3687.
19. Robbins CB, Grewal DS, Soundararajan S, et al. Radial peripapillary capillary network microvascular changes in Alzheimer’s disease, mild cognitive impairment, and cognitively healthy controls. Alzheimers Dementia. 2021;17:e050969.
20. Van De Kreeke JA, Nguyen HT, Konijnenberg E, et al. Optical coherence tomography angiography in preclinical Alzheimer’s disease. Br J Ophthalmol. 2020;104(2):157–161.
21. Shin JY, Choi EY, Kim M, Lee HK, Byeon SH. Changes in retinal microvasculature and retinal layer thickness in association with apolipoprotein E genotype in Alzheimer’s disease. Sci Rep. 2021;11(1):1–7.
22. Cunha LP, Lopes LC, Costa-Cunha LV, et al. Macular thickness measurements with frequency domain-OCT for quantification of retinal neural loss and its correlation with cognitive impairment in Alzheimer’s disease. PLoS One. 2016;11(4):e0153830.
23. Zhang YS, Zhou N, Knoll BM, et al. Parafoveal vessel loss and correlation between peripapillary vessel density and cognitive performance in amnestic mild cognitive impairment and early Alzheimer’s Disease on optical coherence tomography angiography. PLoS One. 2019;14(4):e0214685.
24. D’Antonio F, Bartolo MI, Ferrazzano G, et al. Blink rate study in patients with Alzheimer’s disease, mild cognitive impairment and subjective cognitive decline. Curr Alzheimer Res. 2021;18(14):1104–1110.
25. Ponirakis G, Al Hamad H, Sankaranarayanan A, et al. Association of corneal nerve fiber measures with cognitive function in dementia. Ann Clin Transl Neurol. 2019;6(4):689–697.
26. Shin JY, Choi EY, Kim M, Lee HK, Byeon SH. Changes in retinal microvasculature and retinal layer thickness in association with apolipoprotein E genotype in Alzheimer’s disease. Sci Rep. 2021;11(1):1847.
 © 2023 The Author(s). This work is published and licensed by Dove Medical Press Limited. The
full terms of this license are available at https://www.dovepress.com/terms
and incorporate the Creative Commons Attribution
- Non Commercial (unported, 3.0) License.
By accessing the work you hereby accept the Terms. Non-commercial uses of the work are permitted
without any further permission from Dove Medical Press Limited, provided the work is properly
attributed. For permission for commercial use of this work, please see paragraphs 4.2 and 5 of our Terms.
© 2023 The Author(s). This work is published and licensed by Dove Medical Press Limited. The
full terms of this license are available at https://www.dovepress.com/terms
and incorporate the Creative Commons Attribution
- Non Commercial (unported, 3.0) License.
By accessing the work you hereby accept the Terms. Non-commercial uses of the work are permitted
without any further permission from Dove Medical Press Limited, provided the work is properly
attributed. For permission for commercial use of this work, please see paragraphs 4.2 and 5 of our Terms.
Recommended articles
Vision-Related Quality of Life and Association Between Retinal Parameters in Patients with Non-Arteritic Anterior Ischemic Optic Neuropathy
Su Y, Bai G, Tian H, Zhang S, Liu Y, Zhang G, Liu L, Chen K
International Journal of General Medicine 2022, 15:5173-5179
Published Date: 24 May 2022
Structural-Functional Correlation in Non-Arteritic Acute Ischemic Optic Neuropathy
Wei J, Zhang L, Wang H, Wang Q, Jia W, Wang R, Wang R, Cui Z
Eye and Brain 2025, 17:13-25
Published Date: 3 May 2025
Longitudinal Choriocapillaris and Retinal Vascular Flow Changes on OCTA with Progression to Advanced AMD
Johari Moghadam MM, Montazeri F, Feldman S, Lee SC, Yiu G, Moshiri A, Emami-Naeini P, Moussa K, Park SS
Clinical Ophthalmology 2025, 19:4651-4662
Published Date: 13 December 2025