")
Back to Journals » Vascular Health and Risk Management » Volume 10
Changes in body weight after 24 weeks of vildagliptin therapy as a function of fasting glucose levels in patients with type 2 diabetes
Authors Blüher M, Schweizer A, Bader G, Foley JE
Received 1 September 2014
Accepted for publication 2 October 2014
Published 20 November 2014 Volume 2014:10 Pages 661—664
DOI https://doi.org/10.2147/VHRM.S73608
Checked for plagiarism Yes
Review by Single anonymous peer review
Peer reviewer comments 3
Editor who approved publication: Dr Daniel Duprez
Matthias Blüher,1 Anja Schweizer,2 Giovanni Bader,2 James E Foley3
1Department of Medicine, University of Leipzig, Leipzig, Germany; 2Novartis Pharma AG, Basel, Switzerland; 3Novartis Pharmaceuticals Corporation, East Hanover, NJ, USA
Background: In order to test the hypothesis that the degree of weight change with the dipeptidyl peptidase-4 inhibitor vildagliptin is dependent on the level of glycemic control at baseline, the weight changes from pooled monotherapy studies after 24 weeks of therapy with vildagliptin were assessed versus the fasting plasma glucose (FPG) levels at baseline.
Methods: Data were pooled from eight clinical monotherapy trials including 2,340 previously drug-naïve patients with type 2 diabetes mellitus who received vildagliptin monotherapy (50 mg once daily [n=359] or 50 mg twice daily [n=1,981]). The trials were all randomized, double-blind, controlled clinical trials with a prespecified week 24 study visit.
Results: Linear regression analysis of weight change after 24 weeks relative to baseline FPG showed an intercept of −2.259 kg (95% confidence interval −2.86, −1.66; P<0.0001) and a positive slope of 0.1552 kg (95% confidence interval 0.10–0.21; P<0.0001). Neutral caloric balance (no weight change) was observed at a FPG of 14.6 mmol/L (263 mg/dL). Baseline FPG values below and above this threshold were associated with weight loss and weight gain, respectively. For instance, from this analysis, a baseline FPG of 8 mmol/L (144 mg/dL) predicts a weight loss of 1 kg.
Conclusion: The present analysis showed that treatment with vildagliptin results in a negative caloric balance when glucose levels are below the renal threshold at baseline.
Keywords: dipeptidyl peptidase-4 inhibitor, glucagon-like peptide-1, renal threshold, sodium-glucose cotransporter-2 inhibitor, hyperglycemia
Introduction
Weight gain and its associated adipose tissue dysfunction are linked with the development of type 2 diabetes (T2DM).1 Further, therapies to reduce the hyperglycemia associated with the treatment of T2DM are often limited by weight gain. Insulin, glinides, and sulfonylureas lead to weight gain at least in part likely resulting from defensive eating to avoid hypoglycemia.2 When patients with T2DM have glucose levels above the renal threshold (ie, the level of glucose above which sodium-glucose cotransporters [SGLTs] 1 and 2 in the kidneys fail to reabsorb all the glucose), there is loss of glucose in the urine. Fewer calories are being lost in the urine to the extent that any therapy reduces glucose levels from above the renal threshold to below the renal threshold. Thus, all other energy consumption and expenditure parameters being equal, there should be weight gain with such therapies;2 we characterize this here as the caloric penalty associated with better glycemic control.
Dipeptidyl peptidase-4 (DPP-4) inhibitors are characterized as being weight neutral based upon clinical trial data,2 where in most cases, the trials were done in patients who were at glycemic levels above the renal threshold; therapy resulted in reduction in glucose levels to below the renal threshold, such that fewer calories were lost in urine. The expected weight gain due to this caloric penalty is apparently compensated for by the extra-pancreatic actions of glucagon-like peptide-1 (GLP-1) that reduce extraction of calories from the gut and increase energy expenditure.2 GLP-1 agonists are characterized as being associated with weight loss despite this caloric penalty due to an additional extra-pancreatic effect to increase satiety.2 Most recently, SGLT-2 inhibitors, which reduce weight by increasing the amount of glucose lost in the urine, have been introduced.3,4 Unlike other therapies to reduce glucose levels, there is no caloric penalty with SGLT-2 inhibitors. Thus, treatment from levels of glycemia well above the renal threshold to levels below the renal threshold is expected to lead to a notable difference in weight loss between SGLT-2 inhibitors and other therapies.3,4 In many cases, however, therapy is actually initiated from lower levels of glycemia where there is no caloric penalty associated with better glycemic control for other therapies, for example, DPP-4 inhibitors. From such levels of glycemia there appears to be modest weight loss with the DPP-4 inhibitor vildagliptin as predicted based on its mechanism of action.2
In order to test the hypothesis that the degree of weight change with vildagliptin is dependent on the levels of glycemic control at baseline, the weight changes from pooled monotherapy studies after 24 weeks of therapy with vildagliptin were assessed versus the fasting plasma glucose (FPG) levels at baseline.
Materials and methods
Patients and study design
Data were pooled from eight clinical monotherapy trials (studies one to three, five, nine, 12–14 enumerated in Table 1 from a review by Dejager et al5) with 2,340 previously drug-naïve patients with T2DM who received vildagliptin monotherapy (50 mg once daily [n=359] or 50 mg twice daily [n=1,981]). The trials were all randomized, double-blind, controlled clinical trials with a prespecified week 24 study visit.
Study assessments and data analysis
FPG and body weight were assessed regularly in each study. FPG was measured in a central laboratory; body weight was measured in indoor clothing, but without shoes. Body weight assessed at baseline and week 24, and FPG values measured at baseline were used for the analysis. The data analysis was based on the safety set of each study (defined as all randomized patients who received at least a single dose of study medication), including only patients who had baseline FPG and body weight as well as week 24 body weight measurements.
The total number of patients along with demographic and clinical characteristics are presented. Linear regression analysis was performed to analyze the body weight changes from baseline to week 24 as a function of baseline FPG.
Ethics and good clinical practice
All studies included were conducted in accordance with the Declaration of Helsinki and International Conference on Harmonization/Good Clinical Practice guidelines. The study protocols were approved by an independent ethics committee/institutional review board at each site and all patients provided written informed consent.
Results
Patients included in the analysis had a mean ± standard deviation age of 54.5±11.2 years, 55.5% were men, and the mean duration of T2DM was 2.1±3.3 years. The mean glycated hemoglobin (HbA1c) of the included patients was 8.4%±1.1% (68.3±12.5 mmol/mol), mean FPG was 9.9±2.6 mmol/L (178±47 mg/dL), and mean weight and body mass index were 86.6±18.7 kg and 30.9±5.5 kg/m2, respectively.
The mean weight loss for the study population was −0.72±0.08 kg (P<0.0001). Simple linear regression analysis of weight change after 24 weeks relative to baseline FPG showed an intercept of −2.259 kg (95% confidence interval [CI] −2.86, −1.66; P<0.0001) and a positive slope of 0.1552 kg (95% CI 0.10, 0.21; P<0.0001) (Figure 1). This estimate was confirmed in a multiple regression model with FPG at baseline, age, sex and weight at baseline as covariates (data not shown). The assumption of linearity was verified by plotting the predictor (FPG at baseline) versus residuals. Neutral caloric balance (no weight change) was observed at a FPG of 14.6 mmol/L (263 mg/dL). Baseline FPG values below and above this threshold were associated with weight loss and weight gain, respectively. For instance, it can be extrapolated from Figure 1 that a baseline FPG of 8 mmol/L (144 mg/dL) predicts a weight loss of 1 kg. There were only 180 observations where baseline FPG was above 14 mmol/L (252 mg/dL), ie, the patients were presumably above the renal threshold 24 hours a day; it is likely that the slope flattens above this level, but there are too few observations to reliably confirm this point. Interestingly, when the change in weight/change in FPG was plotted versus the baseline FPG, there was an intercept of 3.398 kg/mmol/L (95% CI 1.52, 5.28; P<0.0001) and a negative slope of 0.2415 kg/mmol/L (95% CI −0.42, −0.06; P<0.01). This relationship was not linear, however, when patients with baseline FPG values below 8 mmol/L were compared with those ≥8 mmol/L, the average change in weight/change in FPG was >2.5 times greater below 8 mmol/L than above 8 mmol/L.
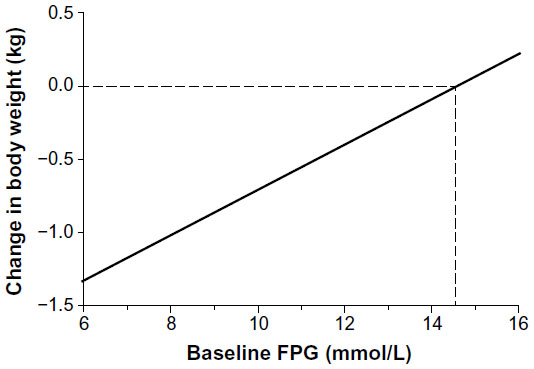 | Figure 1 Change in weight as a function of baseline FPG in patients with type 2 diabetes mellitus after 24 weeks of treatment with vildagliptin. |
The intercept and slope were similar when the 50 mg twice daily application (n=1,981; intercept −2.0917 [95% CI −2.76, −1.42]; P<0.0001; slope 0.1439 [95% CI 0.08, 0.21]; P<0.0001) was analyzed separately. In addition, a similar relationship to that shown between weight change and baseline FPG was also found for weight change and baseline HbA1c, with an intercept of −3.9483 kg (95% CI −5.13, −2.76; P<0.0001) and a positive slope of 0.3829 (95% CI 0.24, 0.52; P<0.0001).
Discussion
The present analysis shows that treatment with vildagliptin results in a negative caloric balance when glucose levels are below the renal threshold at baseline. Presumably extra-pancreatic effects of vildagliptin to reduce fat absorption (secondary to a reduction in ApoB 48 secretion from the gut6) and to increase energy expenditure during meals (due to increased fat mobilization and oxidation7) explain this negative caloric balance when the calorie penalty is not a factor.2
There is no reason why such an analysis would not also be applicable to all other therapies except SGLT-2 inhibitors. For instance, the 2.1 kg weight loss with metformin seen in the Diabetes Prevention Program study, where the FPG was <6 mmol/L, is expected to result in less weight loss in patients with glycemic levels above the renal threshold at baseline.8 Another example would be GLP-1 agonists, which should also be associated with greater weight loss from below the renal threshold than from above the renal threshold. Therapies that are associated with increased hypoglycemia at glucose levels near to goal, such as insulin, glinides, or sulfonylureas, are associated with defensive eating to avoid hypoglycemia, and this may explain why they continue to be associated with weight gain when therapy with these drugs is initiated at glycemic levels below the renal threshold.2 In contrast, there is no caloric penalty with SGLT-2 inhibitors, and thus weight differences between SGLT-2 inhibitors and other hypoglycemic therapies may be more similar at lower baseline glycemic levels from which therapy is often initiated.
In the clinical decision-making process of which antidiabetic treatment to choose, potential weight loss is a major consideration. However, are average weight loss data from clinical trials really valuable for personalized decision-making? The large standard deviation of the overall change in weight seen here with vildagliptin indicates that there is a great deal more variation in weight than seen with glucose parameters such as HbA1c and FPG; individuals are gaining or losing weight over a large range. Very similar standard deviations have been reported for both GLP-1 agonists9 and SGLT-2 inhibitors.10 These large variations in body weight in patients with T2DM may be much more influenced by factors like behavior, nutrition, age, sex, and/or initial body mass index than by the antidiabetic treatment strategy. From the trials included in our analyses, it was not possible to identify reliable predictors of weight loss beyond the renal threshold effects, because most of the nondrug-related factors determining body weight changes have not been systematically studied. In any case, in clinical practice, the differences in weight loss and in any weight-related benefits among DPP-4 inhibitors, GLP-1 agonists, and SGLT-2 inhibitors may not be as large or predictable as those suggested by the mean weight losses reported in clinical trials. The question is whether they are large or predictable enough to offset any differences among these drugs in terms of patient convenience, physician time, and general tolerability.
Acknowledgments
The authors gratefully acknowledge the investigators and patients participating in all the studies included in this analysis and Sanchika Agarwal (Novartis Healthcare Private Limited, India) for technical help with submission of the manuscript.
Author contributions
All authors had full access to all data and take responsibility for the integrity of the data and accuracy of analyses. All authors provided input to the analytical approach, interpretation of data, preparation, revision, and final approval of the manuscript.
Disclosure
MB has received honoraria for speaking engagements, served on advisory boards for Novartis Pharma AG, and has also received honoraria for lecturing or participation in advisory boards from Novo Nordisk, Eli Lilly, AstraZeneca, Sanofi, Boehringer-Ingelheim, MSD, Bristol-Myers Squibb, and Berlin Chemie. GB, AS, and JEF are employees of Novartis Pharma AG, and AS and JEF own shares in Novartis Pharma AG. All studies from which data were compiled for the present analysis were funded by Novartis Pharma AG.
References
Blüher M. Adipose tissue dysfunction contributes to obesity related metabolic diseases. Best Pract Res Clin Endocrinol Metab. 2013;27(2):163–177. | |
Foley JE, Jordan J. Overall weight neutrality associated with the DPP-4 inhibitor vildagliptin: mechanistic basis and clinical experience. Vasc Health Risk Manag. 2010;6:541–548. | |
Ferrannini E, Ramos SJ, Salsali A, Tang W, List JF. Dapagliflozin monotherapy in type 2 diabetic patients with inadequate glycemic control by diet and exercise: a randomized, double-blind, placebo-controlled, phase 3 trial. Diabetes Care. 2010;33(10):2217–2224. | |
Stenlöf K, Cefalu WT, Kim KA, et al. Efficacy and safety of canagliflozin monotherapy in subjects with type 2 diabetes mellitus inadequately controlled with diet and exercise. Diabetes Obes Metab. 2013;15(4):372–382. | |
Dejager S, Schweizer A, Foley JE. Evidence to support the use of vildagliptin monotherapy in the treatment of type 2 diabetes mellitus. Vasc Health Risk Manag. 2012;8:339–348. | |
Matikainen M, Mänttäri S, Schweizer A, et al. Vildagliptin therapy reduces postprandial intestinal triglyceride-rich lipoprotein particles in patients with type 2 diabetes. Diabetologia. 2006;49(9):2049–2057. | |
Boschmann M, Engeli S, Budziarek P, et al. Dipeptidyl-peptidase-IV inhibition augments postprandial lipid mobilization and oxidation in type 2 diabetic patients. J Clin Endocrinol Metab. 2009;94(3):846–852. | |
Knowler WC, Barrett-Connor E, Fowler SE, et al. Reduction in the incidence of type 2 diabetes with lifestyle intervention or metformin. N Engl J Med. 2002;346(6):393–403. | |
DeFronzo RA, Ratner RE, Han J, Kim DD, Fineman MS, Baron AD. Effects of exenatide (exendin-4) on glycemic control and weight over 30 weeks in metformin-treated patients with type 2 diabetes. Diabetes Care. 2005;28(5):1092–1100. | |
EMA/374133/2013 Committee for Medicinal Products for Human Use. Assessment report. Canagliflozin Procedure No EMEA/H/C/002649/0000 (2013; page 50). Available from: http://www.ema.europa.eu/docs/en_GB/document_library/EPAR_-_Public_assessment_report/human/002649/WC500156457.pdf. Accessed August 27, 2014. |
 © 2014 The Author(s). This work is published and licensed by Dove Medical Press Limited. The
full terms of this license are available at https://www.dovepress.com/terms.php
and incorporate the Creative Commons Attribution
- Non Commercial (unported, v3.0) License.
By accessing the work you hereby accept the Terms. Non-commercial uses of the work are permitted
without any further permission from Dove Medical Press Limited, provided the work is properly
attributed. For permission for commercial use of this work, please see paragraphs 4.2 and 5 of our Terms.
© 2014 The Author(s). This work is published and licensed by Dove Medical Press Limited. The
full terms of this license are available at https://www.dovepress.com/terms.php
and incorporate the Creative Commons Attribution
- Non Commercial (unported, v3.0) License.
By accessing the work you hereby accept the Terms. Non-commercial uses of the work are permitted
without any further permission from Dove Medical Press Limited, provided the work is properly
attributed. For permission for commercial use of this work, please see paragraphs 4.2 and 5 of our Terms.