")
Back to Journals » Nature and Science of Sleep » Volume 14
Changed Cerebral White Matter Structural Network Topological Characters and Its Correlation with Cognitive Behavioral Abnormalities in Narcolepsy Type 1
Authors Ni K, Liu Y, Zhu X, Tan H, Zeng Y, Guo Q, Xiao L, Yu B
Received 11 October 2021
Accepted for publication 19 January 2022
Published 2 February 2022 Volume 2022:14 Pages 165—173
DOI https://doi.org/10.2147/NSS.S336967
Checked for plagiarism Yes
Review by Single anonymous peer review
Peer reviewer comments 2
Editor who approved publication: Prof. Dr. Ahmed BaHammam
Kunlin Ni,1,* Yishu Liu,2,* Xiaoyu Zhu,1 Huiwen Tan,2 Yin Zeng,2 Qiyong Guo,1 Li Xiao,2,3 Bing Yu1
1Department of Radiology, Shengjing Hospital of China Medical University, Shenyang, 110004, People’s Republic of China; 2Department of Pulmonary and Critical Care Medicine, Shengjing Hospital of China Medical University, Shenyang, 110004, People’s Republic of China; 3Sleep Medicine Center, Shengjing Hospital of China Medical University, Shenyang, 110004, People’s Republic of China
*These authors contributed equally to this work
Correspondence: Bing Yu
Department of Radiology, Shengjing Hospital of China Medical University, Shenyang, 110004, People’s Republic of China
, Tel +86-24-96615-73266
, Fax +86-24-23929902
, Email [email protected]; Li Xiao
Department of Pulmonary and Critical Care Medicine, Shengjing Hospital of China Medical University, Shenyang, 110004, People’s Republic of China
, Tel +86-24-96615-61713
, Fax +86-24-22780097
, Email [email protected]
Objective: In the current study we investigated topological abnormalities of the cerebral white matter networks in narcolepsy type 1 (NT1) patients and its relationship with their cognitive abnormalities using diffusion tensor imaging (DTI) technology.
Methods: DTI and the Beijing version of the Montreal Cognitive Assessment (MoCA-BJ) were applied to 30 NT1 patients and 30 age-matched healthy controls. DTI studies were also carried using the 3T MRI system. Next, DTI data was used to establish a cerebral white matter network for all subjects and graph theory was applied to analyze the topological characteristics of the white matter structural network. Topographical parameters (such as local efficiency (Eloc), global efficiency (Eglob) and small-world (σ)) between NT1 patients and controls were then compared. The correlation between MoCA-BJ scores and topological parameters was also analyzed.
Results: MoCA-BJ scores in NT1 patients were lower than those in the healthy controls. Compared with healthy controls, the global efficiency of the white matter network and attributes of the small world network were significantly reduced in NT1 patients. Finally, the global efficiency of the white matter structural network was related to the MoCA-BJ score of NT1 patients.
Conclusion: The abnormal topological characteristics of the white matter structural network in NT1 patients may be associated with their cognitive impairment.
Keywords: cognitive dysfunction, graph theory analysis, narcolepsy type 1, diffusion tensor imaging, montreal cognitive assessment Beijing edition
Introduction
Narcolepsy type 1 (NT1), characterized by irresistible daytime sleepiness, sleep paralysis and nocturnal sleep disturbances, cataplexy, and sleep hallucinations,1 is a chronic neurological disease. NT1 patients usually exhibit weakness, seizures, and significant abnormal concentrations of the neuropeptide orexin A in the cerebrospinal fluid due to large loss of neurons that produce hypothalamic orexin.2
In recent years, multiple psychiatric studies on NT1 patients have confirmed that the disease has cognitive diversity, including subjective perception attention deficits,3 abnormal emotional learning,4 lack of ability to activate attention and stimulate related areas,5 and lack of selectivity or perseverance in decision making.6 Sleepiness increases the risk of cognitive impairment.7 In contrast to severe cognitive impairment, common cognitive impairments mainly include mild cognitive impairment (MCI) and dementia. The term MCI is generally used to refer to a transitional state between normal cognitive function and clinically probable Alzheimer’s disease (AD).8 Cognitive impairment is a potentially significant diagnosis. It is regarded as a prodrome of dementia, involving greater forgetfulness than one would expect for their age, yet retaining all or most of the day-to-day independence and not meeting criteria for clinically probable dementia. Overall, 6% to 15% of MCI patients will progress to dementia per year. Even though current drug treatments are not indicated for cognitive impairment, early diagnosis has benefits; the future care needs of the patients can be, to some degree, anticipated and arrangements can be made in good time, with the patient being involved in these decisions at a stage where their decision-making is relatively unimpaired.8 When individuals with MCI are followed over time, some progress to AD and other dementia types, but some individuals are stable or even recover.9 Many diseases can be accompanied by cognitive impairment, such as AD, Huntington’s disease, Wilson's disease, idiopathic rapid eye movement sleep behavior disorder, epilepsy, and hereditary spastic paraplegia.10–12
In the past decade, a series of neuroimaging studies have been conducted to study the neural mechanism of cognitive impairment related to NT1 disorders. They revealed significant abnormalities in several brain areas, including the amygdala, hippocampus,13–17 thalamus, hypothalamus, cerebellar hemispheres, anterior medial temporal white matter (WM), and corpus callosum.18–20 In addition, functional studies have also revealed impaired and abnormal functional connections in the executive attention network21–23 of patients with NT1.24 Previous studies have reported that alterations in brain topology and connectivity of some cerebral regions in NT1 patients were related to somnolence, impulsive behavior, and depression.25
In 1994, Basser et al26 first reported diffusion tensor imaging (DTI) technology, which could noninvasively detect the anisotropy of water molecules in different tissues in the body to quantitatively evaluate cytoarchitecture. DTI technology has been shown to be a powerful tool to investigate the integrity of WM structural connectivity. Whole-brain WM connectivity can then be reconstructed from the WM structural network and be further analyzed by graph theoretical methods.
The theoretical graphic method has been widely regarded as an effective method for assessing the whole-brain WM structural network constructed using DTI technology.27 The WM structural network analysis method based on graph theory has revealed several topological characteristics of the network, such as local efficiency (Eloc), global efficiency (Eglob), and small-world (σ), and proved the relationship between development and intelligence and these topological measures.28,29 Furthermore, changes in the WM network topology are indicators of various illnesses (such as head injury, stroke, Parkinson’s disease, epilepsy, and schizophrenia) and can be used in the assessment of cognitive dysfunction;30–35 however, few neuroimaging studies have been used to evaluate the overall topological feature of neural networks throughout the brain, particularly the WM networks in NT1 patients.
The purpose of this study was to use the noninvasive synchronized DTI to analyze the characteristic changes in WM structural connections and explore the relationship between them and the neurobehavioral abnormalities of patients with NT1.
Materials and Methods
Objectives
Thirty-six right-handed patients (age, 10.0–27.0 years; male: female ratio, 21:15) diagnosed with NT1 disorder, as per the International Classification of Sleep Disorders (ICSD)-3,36 were recruited from the Sleep Medicine Center of Shengjing Hospital, China Medical University. Another 33 right-handed healthy controls (control group; age, 11.7–28.6 years; male: female ratio, 19:14) were recruited from the community. Nine participants that refused the PSG examination were subsequently excluded: six NT1 patients and three healthy controls. Ultimately, we analyzed data from 30 patients with NT1 disorders (64% male, age 22.8 ± 6.9 years) and 30 healthy controls (60% male, age 23.1 ± 3.9 years). According to the Declaration of Helsinki, all participants signed an informed form before participating in the experimental study. All participants under the age of 18 in this study obtained informed consent from their parents or legal guardians. This study was approved by the Ethics Committee of Shengjing Hospital, China Medical University.
The enrollment criteria for NT1 patients were as follows: sleep specialists diagnosed NT1 based on the ISCD-3 combined with a 3-month history of cataplexy and excessive daytime sleep. The final diagnosis was made based on the results of the multiple sleep latency test (MSLT) and night PSG. In N1 patients and healthy controls, the severity of sleepiness was measured by ESS. For ESS measurement, all subjects were asked to use a scale of 0 to 3 to illustrate the probability of falling asleep in eight different situations. The diagnosis of excessive daytime sleepiness was based on a total score > 10.36
The exclusion criteria for healthy controls and NT1 patients included: participants with other sleep disorders, brain abnormalities (infarct foci, tumors, or hemorrhages), current or past serious physical or neurological diseases, history of serious neurological or mental diseases in the immediate family, congenital genetic disorders, previous psychiatric or current illnesses like anxiety, substance abuse or depression, pregnant or breastfeeding women, received any hypnotics, antidepressants, antipsychotics, anticholinergics, memory enhancing drugs, antihistamines, central analgesics, central nervous system stimulants, CYP3A inducers, CYP3A inhibitors, sleep-improving Chinese Medicines or proprietary Chinese medicines, or any other insomnia therapy; people with a history of drug use or drug addiction or any lifestyle that interferes with the test process or may interfere with sleep, hyperthyroidism, a history of drug abuse in the past 2 years, those who had a positive urine sample, or the presence of contraindications on MRI examination were excluded.
The complete procedure, purpose, clinical importance, and precautions of the experiment were carefully explained to subjects before starting the MRI scan. In addition, each subject underwent a comprehensive neurological examination to rule out central nervous system and peripheral nervous system diseases, and all subjects signed an informed consent form.
The Beijing Version of MoCA (MoCA-BJ)
The MoCA-BJ37 has been widely used in mainland China for the screening of cognitive function.38 Huang et al37 validated the MoCA-BJ and found that it was an effective cognitive test to distinguish between NC, MCI, and mild and moderate AD among the Chinese population with various levels of education. Other studies have assessed the ability of the MoCA-BJ in the detection of cognitive impairment in a variety of diseases including AD, cerebral small vessel disease, and stroke.39,40 The test includes attention and computation (6 points), orientation (6 points), delayed recall (5 points), cognitive domains such as visual-spatial and executive ability (5 points), naming (3 points), language (3 points), and abstraction (2 points), with a total of 30 points and a required time of completion within 10 minutes. Subjects with a score of less than 26 points are considered to be cognitively impaired.
The sleepiness in MoCA-BJ test was assessed using the Stanford Sleepiness Scale (SSS).41 All participants filled out the scale twice before and after the test. Before and after the test, the average scores of NT1 patients were 1.8 (SD = 0.7) and 1.9 (SD = 1.0). Before and after the test, the average scores of the healthy controls were 1.2 (SD = 0.5) and 1.6 (SD = 0.8).
Epworth Sleepiness Score (ESS)
ESS was used to evaluate the degree of daytime sleepiness in healthy controls and N1 patients. For ESS assessment, all subjects were asked to use a scale of 0 to 3 to indicate the probability of falling asleep in eight different situations. If the total score exceeded 10, subjects were diagnosed with excessive daytime sleepiness.36
The Multiple Sleep Latency Test (MSLT)
The latency of MSLT is an objective test that measures the tendency to fall asleep under controlled conditions. It is based on the notion that sleep latency reflects underlying physiological sleepiness. The latency of MSLT consists of four to five naps taken 2 hours apart during the day, following a standardized procedure. The mean sleep latency for all naps is used as the measure of sleepiness.42
DTI Scan
All DTI images were collected using a Philips 3.0T superconducting MRI scanner (Philips Medical Systems, Best, The Netherlands) equipped with a 32-channel sensitivity encoding head coil for receiving signals. In order to rule out any apparent organic cerebral injury, all subjects underwent conventional axial T2WI scans. During the scan, the angular line was used as the baseline. After the scan, an experienced radiologist performed on-site analysis.
The DTI data were obtained by using a single spin-echo echo planar imaging sequence with the following scan parameters: TR = 8000 ms, TE = 90 ms, voxel size = 2 × 2 × 2 mm3, matrix size = 112 × 112, FOV = 224×224 mm, sensitivity encoding factor = 2, FA = 90°, number of scanning layers = 55, b-value = 800s/mm2, and diffusion sensitizing gradients = 32. The duration of the DTI scan for each subject was 7 minutes.
DTI Data Preprocessing
The preprocessing of the DTI data involved FSL 5.3 software. DTI data processing included correction of eddy currents and motion artifacts, estimation of the diffusion tensor, and FA calculation. First, the eddy current distortion and motion artifacts in the DTI data were corrected by applying the affine alignment of each diffusion-weighted image to the b = 0 image. After correction, the diffusion tensor elements were estimated, and following estimation, the reconstructed diffusion tensor matrix was diagonalized to obtain three values and three eigenvectors, after which the corresponding FA value of each voxel was calculated.
White Matter Structural Network Construction
In the current study, we defined all of the WM network nodes and edges using the following procedures.
Network Node and Edge Definition
The individual FA image in native space was co-registered to a T1-weighted structural image using an affine transformation for each participant. After co-registration, the single structural image was registered to the MNI template. Based on the two-stage combined transformation, an inverse warping transformation from the standard space to the local DTI space was obtained. The standard atlases in the MNI space were inversely warped back to the individual local space by applying this inverse transformation. Next, the inverse transformations were used to warp the automated anatomical labeling (AAL) atlas from the MNI space to the native DTI space. The discrete labeling values were preserved via the nearest-neighbor interpolation method. Using this procedure, 90 cortical and subcortical regions, each representing a node of the network, were obtained.
WM Tractography
Diffusion tensor tractography was performed using the fiber assignment by the continuous tracking method. All of the WM tracts in the DTI data were calculated by seeding each voxel with an FA greater than 0.2. If the track turned at an angle greater than 45 degrees or reached a voxel with an FA less than 0.2, it was terminated.
Graph Theory Analysis
Gretna, a graph-theoretical network analysis toolbox, was used to locate the completed preprocessed DTI data in order to build functional brain networks in each subject for each time period.33 Finally, according to the AAL markers,34 the whole brain was divided into 90 cortical and subcortical regions and the average time series of the 90 regions was extracted. Pearson’s correlation coefficient was used to calculate each pair of regions in the average time series of all 90 regions, the data was converted to z-values, and Fisher’s z-transformation was performed if the data were considered to have a normal distribution. According to the threshold range selected by the correlation matrix, a positive binary vector less connected generic network was constructed. After transformation, the z-scored correlation coefficient was assigned to each subject in the same sleep stage (Figure 1).
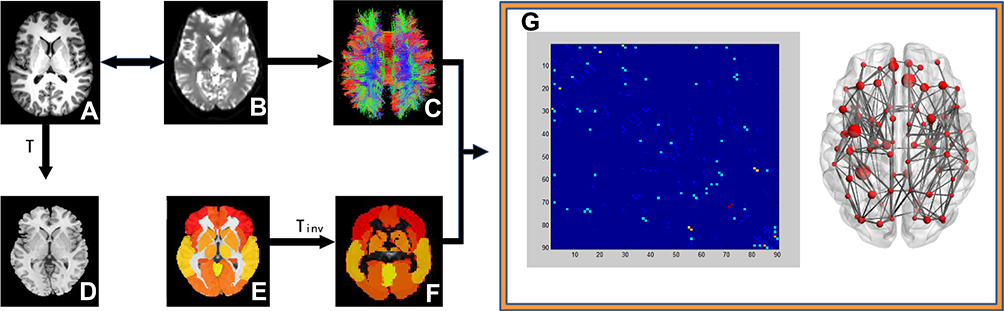 |
Figure 1 Construction of brain white matter network in the participant Construction of brain white matter (WM) network in the participants. An individual T1 image (A) was co-registered to the B0 image (B). For registration from the T1 image in the native DTI space to the MNI T1-weighted template in the MNI space (D), the transformation matrix was shown as T. The application of the inverse transformation (Tinv) to the AAL atlas in the MNI space (E) resulted in individual-specific parcellation in the native DTI space (F). The reconstruction of whole-brain WM fibers is shown in (C). The connection matrix and three-dimensional representation the of WM structural network are shown in (G). |
Topological metrics can be divided into Eloc, and Eglob (Eloc) and global efficiency (Eglob)43 and small-world network parameters.44 The graph-theoretical network analysis toolbox was used to evaluate the topological and organizational properties of the whole brain WM network.
Data Analysis
SPSS 17.0 software (SPSS, Inc., Chicago, IL, USA) was used to analyze cognitive, PSG, and demographic data. The normality hypothesis of continuous variables was tested using the Kolmogorov–Smirnov test. Descriptive statistical analysis was first carried out. We used the mean ± standard deviation to represent normally distributed continuous data, and used the median of the interquartile range to represent non-normally distributed data. The data included questionnaire scores and age. Based on the normality and homoscedasticity of variances of the variables, we used Mann–Whitney U-tests or t-tests to compare the NT1 patients and the healthy controls. Fisher’s exact test or the χ2 test was used to compare sex ratios between NT1 patients and healthy controls. The demographic characteristics of all subjects excluded from the study were also compared with the population included in the study. The Mann–Whitney U-test or t-test was used to compare functional network topological parameters and PSG data between the two groups. All brain network topology parameters were compared by using Bonferroni correction, and a p-value less than 0.016 was considered to be statistically significant. Spearman correlation analysis was used to investigate the relationship between brain network parameters and MoCA scores in NT1 patients, and P < 0.05 was considered to be statistically significant.
Results
The study included the demographics, imaging data, and MoCA-BJ scale scores of 60 participants (30 NT1 patients and 30 healthy controls).
Table 1 summarizes the demographics data of all participants. The age and sex of the two groups were matched. 30 NT1 disorder patients: 22.8 ± 6.9 years, 63% male; 30 healthy controls: 23.1 ± 3.9 years, 67% male. Before each patient performed the MOCA-BJ test, the SSS test was first performed. When the SSS result was less than 3, the MOCA-BJ test was performed to ensure that the subject was in a state of concentration during the cognitive assessment. The MoCA-BJ score of the NT1 patients was significantly lower than that of health controls (P < 0.05).
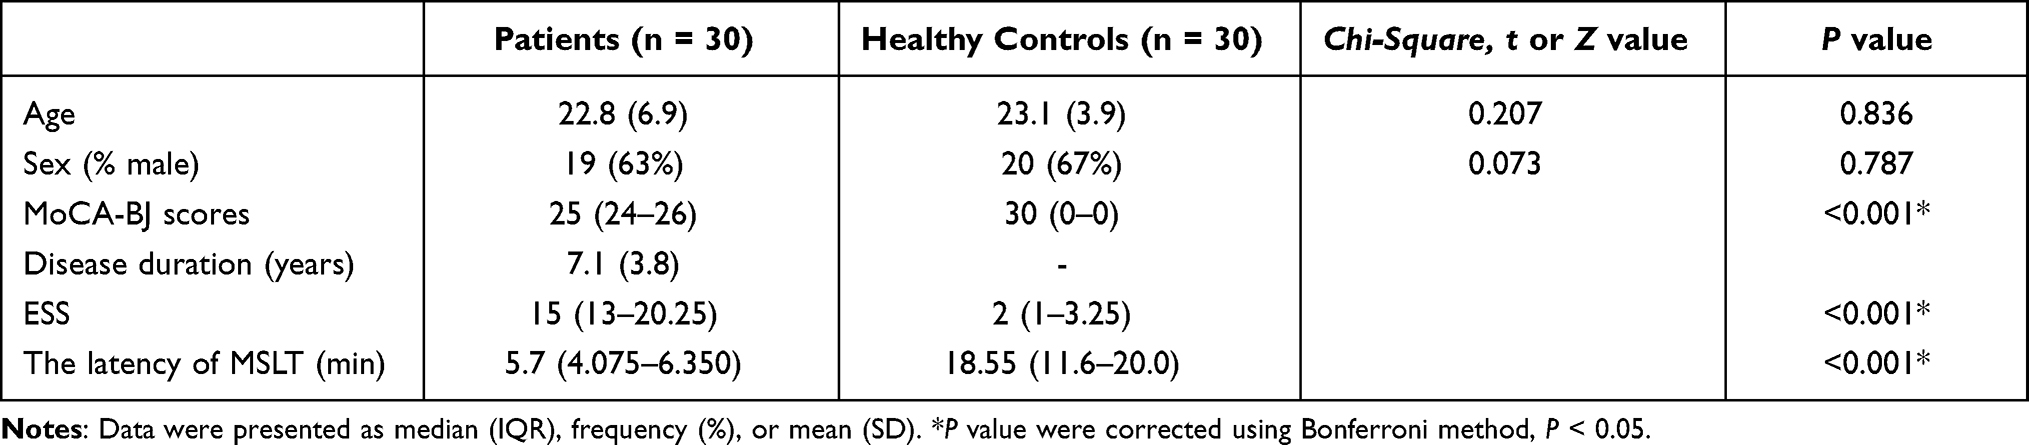 |
Table 1 Demographics Data of All Study Participants |
Compared with the healthy controls, the small-world attributes and Eglob of the NT1 patients decreased significantly (P < 0.016, Table 2). There was an obvious correlation between the MoCA-BJ score and Eglob of the whole brain WM structural network in NT1 patients (r = 0.519, P = 0.003, Figure 2B). In addition, the latency of MSLT of NT1 patients was significantly correlated with the Eglob of the whole brain WM structural network (r = 0.519, P = 0.003. Figure 2C).
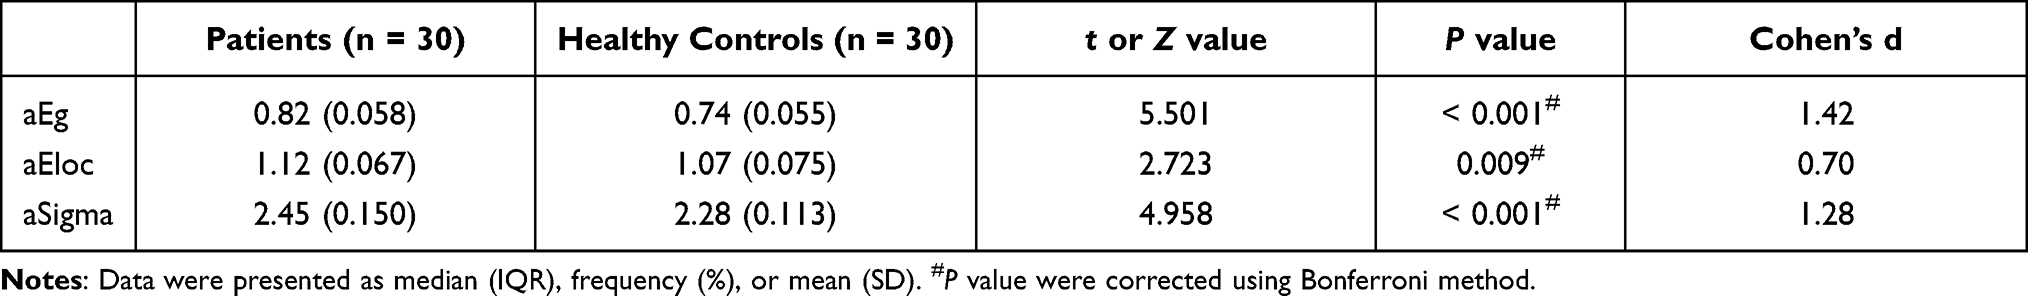 |
Table 2 Brain Structural Network Parameters in NT1 Patients and Healthy Controls |
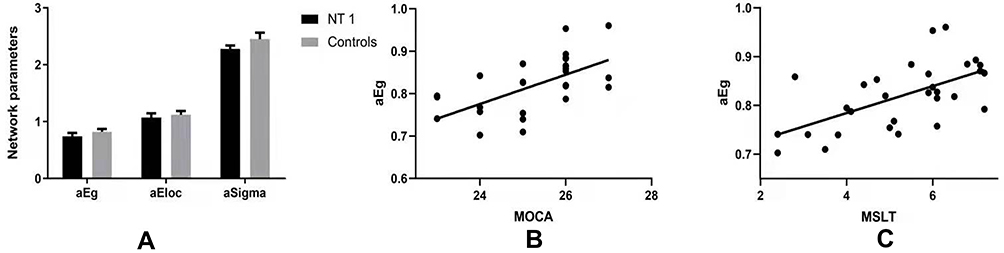 |
Figure 2 Relationship between the global efficiency of the whole brain white matter structural network and MoCA score in NT1 participants. (A) Compared with the healthy controls, NT1 patients had significantly lower Eglob and small-world attributes (Bonferroni correction, P < 0.05). (B) There was a significant correlation between the Eglob of the whole brain WM structural network, in N1 patients, and MoCA-BJ score in the stage N2 sleep. (C) There was a weak correlation between the Eglob of the whole brain WM structural network, in N1 patients, and the latency of MSLT in the stage N2 sleep. |
Discussion
In the current study, we found that the Eloc, Eglob, and small-world characteristics of the cerebral WM structure network of NT1 patients were lower than that of healthy controls. Our results also suggested that the Eglob of the WM network was correlated with the severity of cognitive impairment.
As it has been shown that the Eglob of brain networks was mainly affected by long-distance connections,29,45 we speculated that the Eglob reduction of WM networks may be caused by defects in long-distance connections and commissural WM fiber connections. Brain sensory-motor networks, such as the auditory, somatomotor, visual, dorsal attention, abdominal attention, default mode, frontal parietal, salient, and linguistic have been shown to elicit continuous neural activity.46 Indeed, abnormalities in the efficiency of the WM network topology may reduce the connectivity between the brain gray matter areas, as has been suggested for the salience and executive,22 default mode, sensory-motor, auditory, visual, and dorsal attention networks.47 The reduced interactions may result in the cognitive deficits in NT1 patients. Therefore, the inefficiency of the brain WM structure network in NT1 patients may cause a decline in information processing abilities, which may extend to cognitive impairment in the awake state.
The ESS is a simple, self-administered questionnaire which is shown to provide a measurement of the subject’s general level of daytime sleepiness.48 The ESS assesses the likelihood of falling asleep in eight different situations. Each situation represents a moment of inactivity, from lying down in the afternoon to resting in a traffic jam or sitting in a car in a traffic jam. However, under the above circumstances, it is difficult for patients with N1 disorder to complete the relevant assessment of MOCA-BJ, so we did not discuss the correlation between MOCA-BJ and ESS scores. Our study did not find a significant relationship between whole brain WM topological characters and ESS results, which may be due to the fact that several brain areas do not participate in the process of alternations during waking and sleeping. The topological characteristic within the sleep-related brain networks may have an obvious relationship between ESS data and topological characteristics. There was a weak correlation between the latency of MSLT and MOCA-BJ scores, and the related issue is reflected in the Supplementary Material.
Although the current study provides preliminary evidence of deficiencies in the brain WM structure of NT1 patients, there were still several limitations. First, the number of patients with NT1 disorder was very limited. It can be seen from Table 2 that the diagnostic power of this study was sufficient, however, in future studies we will increase the sample size. Second, the age distribution of NT1 patients was relatively large; therefore, we only measured the MoCA-BJ scores to evaluate cognitive abilities. Furthermore, the sleepiness assessments (ESS, SSS, and MoCa-BJ) in this study were derived from self-reports, and more objective methods are needed in the future. Finally, hypocretin-1 levels were not assesses in the current study and as NT1 is, in cases, directly related to cataplexy, future research should incorporate its testing.49
In summary, we found that the abnormal topological characteristics of the WM structural brain network in NT1 patients may be associated with their cognitive impairment.
Funding
This study was funded by the Key Research and Development Program Project Fund of Liaoning Province (2019JH8/10300006) and the 345 Talent Project of Shengjing Hospital of China Medical University.
Disclosure
All authors declare they have no competing interests.
References
1. Overeem S, Mignot E, van Dijk JG, Lammers GJ. Narcolepsy: clinical features, new pathophysiologic insights, and future perspectives. J Clin Neurophysiol. 2001;18(2):78–105. doi:10.1097/00004691-200103000-00002
2. Grimaldi D, Silvani A, Benarroch EE, Cortelli P. Orexin/hypocretin system and autonomic control: new insights and clinical correlations. Neurology. 2014;82(3):271–278. doi:10.1212/WNL.0000000000000045
3. Zamarian L, Högl B, Delazer M, et al. Subjective deficits of attention, cognition and depression in patients with narcolepsy. Sleep Med. 2015;16(1):45–51. doi:10.1016/j.sleep.2014.07.025
4. Ponz A, Khatami R, Poryazova R, et al. Reduced amygdala activity during aversive conditioning in human narcolepsy. Ann Neurol. 2010;67(3):394–398. doi:10.1002/ana.21881
5. Gool JK, van der Werf YD, Lammers GJ, Fronczek R. The sustained attention to response task shows lower cingulo-opercular and frontoparietal activity in people with narcolepsy type 1: an fMRI study on the neural regulation of attention. Brain Sci. 2020;10(7):419. doi:10.3390/brainsci10070419
6. Bayard S, Abril B, Yu H, Scholz S, Carlander B, Dauvilliers Y. Decision making in narcolepsy with cataplexy. Sleep. 2011;34(1):99–104. doi:10.1093/sleep/34.1.99
7. Rendón-Torres L, Sierra-Rojas I, Benavides-Guerrero C, Botello-Moreno Y, Guajardo-Balderas V, García-Perales L. Predictive factors of cognitive impairment in people over 60. Factores predictores del deterioro cognitivo en personas mayores de 60 años. Enferm Clin. 2021;31(2):91–98. doi:10.1016/j.enfcli.2020.10.026
8. Breton A, Casey D, Arnaoutoglou NA. Cognitive tests for the detection of mild cognitive impairment (MCI), the prodromal stage of dementia: meta-analysis of diagnostic accuracy studies. Int J Geriatr Psychiatry. 2019;34(2):233–242. doi:10.1002/gps.5016
9. Winblad B, Palmer K, Kivipelto M, et al. Mild cognitive impairment–beyond controversies, towards a consensus: report of the International working group on mild cognitive impairment. J Intern Med. 2004;256(3):240–246. doi:10.1111/j.1365-2796.2004.01380.x
10. Sasai T, Matsuura M, Inoue Y. Electroencephalographic findings related with mild cognitive impairment in idiopathic rapid eye movement sleep behavior disorder. Sleep. 2013;36(12):1893–1899. doi:10.5665/sleep.3224
11. Norman M, Wilson SJ, Baxendale S, et al. Addressing neuropsychological diagnostics in adults with epilepsy: introducing the international classification of cognitive disorders in epilepsy: the IC CODE initiative. Epilepsia Open. 2021;6(2):266–275. doi:10.1002/epi4.12478
12. Li C, Yan Q, Duan FJ, et al. Mild cognitive impairment in novel SPG11 mutation-related sporadic hereditary spastic paraplegia with thin corpus callosum: case series. BMC Neurol. 2021;21(1):12. doi:10.1186/s12883-020-02040-4
13. Joo EY, Kim SH, Kim ST, Hong SB. Hippocampal volume and memory in narcoleptics with cataplexy. Sleep Med. 2012;13(4):396–401. doi:10.1016/j.sleep.2011.09.017
14. Kim H, Suh S, Joo EY, Hong SB. Morphological alterations in amygdalo-hippocampal substructures in narcolepsy patients with cataplexy. Brain Imaging Behav. 2016;10(4):984–994. doi:10.1007/s11682-015-9450-0
15. Křečková M, Kemlink D, Šonka K, et al. Anterior hippocampus volume loss in narcolepsy with cataplexy. J Sleep Res. 2019;28(4):e12785. doi:10.1111/jsr.12785
16. Schwartz S, Ponz A, Poryazova R, et al. Abnormal activity in hypothalamus and amygdala during humour processing in human narcolepsy with cataplexy. Brain. 2008;131(Pt 2):514–522. doi:10.1093/brain/awm292
17. Joo EY, Jeon S, Lee M, et al. Analysis of cortical thickness in narcolepsy patients with cataplexy. Sleep. 2011;34(10):1357–1364. doi:10.5665/SLEEP.1278
18. Park YK, Kwon OH, Joo EY, et al. White matter alterations in narcolepsy patients with cataplexy: tract-based spatial statistics. J Sleep Res. 2016;25(2):181–189. doi:10.1111/jsr.12366
19. Tezer FI, Erdal A, Gumusyayla S, Has AC, Gocmen R, Oguz KK. Differences in diffusion tensor imaging changes between narcolepsy with and without cataplexy. Sleep Med. 2018;52:128–133. doi:10.1016/j.sleep.2018.08.022
20. Juvodden HT, Alnæs D, Lund MJ, et al. Widespread white matter changes in post-H1N1 patients with narcolepsy type 1 and first-degree relatives. Sleep. 2018;41(10):zsy145. doi:10.1093/sleep/zsy145
21. Rieger M, Mayer G, Gauggel S. Attention deficits in patients with narcolepsy. Sleep. 2003;26(1):36–43.
22. Xiao F, Lu C, Zhao D, et al. Independent component analysis and graph theoretical analysis in patients with narcolepsy. Neurosci Bull. 2019;35(4):743–755. doi:10.1007/s12264-018-0307-6
23. van Holst RJ, Janssen LK, van Mierlo P, et al. Enhanced food-related responses in the ventral medial prefrontal cortex in narcolepsy type [published correction appears in Sci Rep. 2019 Jun 14;9(1):8766]. Sci Rep. 2018;8(1):16391. doi:10.1038/s41598-018-34647-6
24. Ponz A, Khatami R, Poryazova R, et al. Abnormal activity in reward brain circuits in human narcolepsy with cataplexy. Ann Neurol. 2010;67(2):190–200. doi:10.1002/ana.21825
25. Fulong X, Spruyt K, Chao L, Dianjiang Z, Jun Z, Fang H. Resting-state brain network topological properties and the correlation with neuropsychological assessment in adolescent narcolepsy. Sleep. 2020;43(8):zsaa018. doi:10.1093/sleep/zsaa018
26. Basser PJ, Mattiello J, LeBihan D. MR diffusion tensor spectroscopy and imaging. Biophysical Journal. 1994;66(1):259–267. https://doi.org/10.1016/S0006-3495(94)80775-1
27. Caeyenberghs K, Leemans A, De Decker C, et al. Brain connectivity and postural control in young traumatic brain injury patients: a diffusion MRI based network analysis. Neuroimage Clin. 2012;1(1):106–115. doi:10.1016/j.nicl.2012.09.011
28. Malpas CB, Genc S, Saling MM, Velakoulis D, Desmond PM, O’Brien TJ. MRI correlates of general intelligence in neurotypical adults. J Clin Neurosci. 2016;24:128–134. doi:10.1016/j.jocn.2015.07.012
29. Zhao T, Cao M, Niu H, et al. Age-related changes in the topological organization of the white matter structural connectome across the human lifespan. Hum Brain Mapp. 2015;36(10):3777–3792. doi:10.1002/hbm.22877
30. Ballester-Plané J, Schmidt R, Laporta-Hoyos O, et al. Whole-brain structural connectivity in dyskinetic cerebral palsy and its association with motor and cognitive function. Hum Brain Mapp. 2017;38(9):4594–4612. doi:10.1002/hbm.23686
31. Shu N, Wang X, Bi Q, Zhao T, Han Y. Disrupted topologic efficiency of white matter structural connectome in individuals with subjective cognitive decline. Radiology. 2018;286(1):229–238. doi:10.1148/radiol.2017162696
32. Zheng Z, Shemmassian S, Wijekoon C, Kim W, Bookheimer SY, Pouratian N. DTI correlates of distinct cognitive impairments in Parkinson’s disease. Hum Brain Mapp. 2014;35(4):1325–1333. doi:10.1002/hbm.22256
33. Wang J, Wang X, Xia M, Liao X, Evans A, He Y. Corrigendum: GRETNA: a graph theoretical network analysis toolbox for imaging connectomics. Front Hum Neurosci. 2015;9:458. doi:10.3389/fnhum.2015.00458
34. Tzourio-Mazoyer N, Landeau B, Papathanassiou D, et al. Automated anatomical labeling of activations in SPM using a macroscopic anatomical parcellation of the MNI MRI single-subject brain. Neuroimage. 2002;15(1):273–289. doi:10.1006/nimg.2001.0978
35. Yao J, Liu X, Lu X, Xu C, Chen H, Zhang Y. Changes in white matter microstructure related to non-linguistic cognitive impairment in post-stroke aphasia. Neurol Res. 2020;42(8):640–648. doi:10.1080/01616412.2020.1795578
36. Billings ME, Rosen CL, Auckley D, et al. Psychometric performance and responsiveness of the functional outcomes of sleep questionnaire and sleep apnea quality of life instrument in a randomized trial: the HomePAP study. Sleep. 2014;37(12):2017–2024. doi:10.5665/sleep.4262
37. Huang L, Chen KL, Lin BY, et al. Chinese version of Montreal cognitive assessment basic for discrimination among different severities of Alzheimer’s disease. Neuropsychiatr Dis Treat. 2018;14:2133–2140. doi:10.2147/NDT.S174293
38. Lu J, Li D, Li F, et al. Montreal cognitive assessment in detecting cognitive impairment in Chinese elderly individuals: a population-based study. J Geriatr Psychiatry Neurol. 2011;24(4):184–190. doi:10.1177/0891988711422528
39. Nasreddine ZS, Phillips NA, Bédirian V, et al. The Montreal cognitive assessment, MoCA: a brief screening tool for mild cognitive impairment [published correction appears in J Am Geriatr Soc. 2019 Sep;67(9):1991]. J Am Geriatr Soc. 2005;53(4):695–699. doi:10.1111/j.1532-5415.2005.53221.x
40. Yu J, Li J, Huang X. The Beijing version of the Montreal cognitive assessment as a brief screening tool for mild cognitive impairment: a community-based study. BMC Psychiatry. 2012;12:156. doi:10.1186/1471-244X-12-156
41. Hoddes E, Zarcone V, Smythe H, Phillips R, Dement WC. Quantification of sleepiness: a new approach. Psychophysiology. 1973;10(4):431–436. doi:10.1111/j.1469-8986.1973.tb00801.x
42. Arand DL, Bonnet MH. The multiple sleep latency test. Handb Clin Neurol. 2019;160:393–403. doi:10.1016/B978-0-444-64032-1.00026-6
43. Achard S, Bullmore E. Efficiency and cost of economical brain functional networks. PLoS Comput Biol. 2007;3(2):e17. doi:10.1371/journal.pcbi.0030017
44. Rubinov M, Sporns O. Complex network measures of brain connectivity: uses and interpretations. Neuroimage. 2010;52(3):1059–1069. doi:10.1016/j.neuroimage.2009.10.003
45. Bai F, Shu N, Yuan Y, et al. Topologically convergent and divergent structural connectivity patterns between patients with remitted geriatric depression and amnestic mild cognitive impairment. J Neurosci. 2012;32(12):4307–4318. doi:10.1523/JNEUROSCI.5061-11.2012
46. Seitzman BA, Snyder AZ, Leuthardt EC, Shimony JS. The state of resting state networks. Top Magn Reson Imaging. 2019;28(4):189–196. doi:10.1097/RMR.0000000000000214
47. Drissi NM, Szakács A, Witt ST, et al. Corrigendum: altered brain microstate dynamics in adolescents with narcolepsy. Front Hum Neurosci. 2019;13:385. doi:10.3389/fnhum.2019.00385
48. Johns MW. A new method for measuring daytime sleepiness: the Epworth sleepiness scale. Sleep. 1991;14(6):540–545. doi:10.1093/sleep/14.6.540
49. Bassetti CLA, Adamantidis A, Burdakov D, et al. Narcolepsy - clinical spectrum, aetiopathophysiology, diagnosis and treatment. Nat Rev Neurol. 2019;15(9):519–539. doi:10.1038/s41582-019-0226-9
 © 2022 The Author(s). This work is published and licensed by Dove Medical Press Limited. The full terms of this license are available at https://www.dovepress.com/terms.php and incorporate the Creative Commons Attribution - Non Commercial (unported, v3.0) License.
By accessing the work you hereby accept the Terms. Non-commercial uses of the work are permitted without any further permission from Dove Medical Press Limited, provided the work is properly attributed. For permission for commercial use of this work, please see paragraphs 4.2 and 5 of our Terms.
© 2022 The Author(s). This work is published and licensed by Dove Medical Press Limited. The full terms of this license are available at https://www.dovepress.com/terms.php and incorporate the Creative Commons Attribution - Non Commercial (unported, v3.0) License.
By accessing the work you hereby accept the Terms. Non-commercial uses of the work are permitted without any further permission from Dove Medical Press Limited, provided the work is properly attributed. For permission for commercial use of this work, please see paragraphs 4.2 and 5 of our Terms.