Back to Journals » Pragmatic and Observational Research » Volume 12
Challenges and Pitfalls of Using Repeat Spirometry Recordings in Routine Primary Care Data to Measure FEV1 Decline in a COPD Population
Authors Whittaker HR, Kiddle SJ ![]() , Quint JK
, Quint JK ![]()
Received 12 May 2021
Accepted for publication 6 July 2021
Published 1 September 2021 Volume 2021:12 Pages 119—130
DOI https://doi.org/10.2147/POR.S319965
Checked for plagiarism Yes
Review by Single anonymous peer review
Peer reviewer comments 2
Editor who approved publication: Professor David Price
Hannah R Whittaker,1 Steven J Kiddle,2 Jennifer K Quint1
1National Heart and Lung Institute, Imperial College London, London, UK; 2MRC Biostatistics Unit, University of Cambridge, Cambridge, UK
Correspondence: Hannah R Whittaker Email [email protected]
Background: Electronic healthcare records (EHR) are increasingly used in epidemiological studies but are often viewed as lacking quality compared to randomised control trials and prospective cohorts. Studies of patients with chronic obstructive pulmonary disease (COPD) often use the rate of forced expiratory volume in 1 second (FEV1) decline as an outcome; however, its definition and robustness in EHR have not been investigated. We aimed to investigate how the rate of FEV1 decline differs by the criteria used in an EHR database.
Methods: Clinical Practice Research Datalink and Hospital Episode Statistics were used. Patient populations were defined using 8 sets of criteria around repeated FEV1 measurements. At a minimum, patients had a diagnosis of COPD, were ≥ 35 years old, were current or ex-smokers, and had data recorded from 2004. FEV1 measurements recorded during follow-up were identified. Thereafter, eight populations were defined based on criteria around: i) the exclusion of patients or individual measurements with potential measurement error; ii) minimum number of FEV1 measurements; iii) minimum time interval between measurements; iv) specific timing of measurements; v) minimum follow-up time; and vi) the use of linked data. For each population, the rate of FEV1 decline was estimated using mixed linear regression.
Results: For 7/8 patient populations, rates of FEV1 decline (age and sex adjusted) were similar and ranged from − 18.7mL/year (95% CI − 19.2 to − 18.2) to − 16.5mL/year (95% CI − 17.3 to − 15.7). Rates of FEV1 decline in populations that excluded patients with potential measurement error ranged from − 79.4mL/year (95% CI − 80.7 to − 78.2) to − 46.8mL/year (95% CI − 47.6 to − 46.0).
Conclusion: FEV1 decline remained similar in a COPD population regardless of number of FEV1 measurements, time intervals between measurements, follow-up period, exclusion of specific FEV1 measurements, and linkage to HES. However, exclusion of individuals with questionable data led to selection bias and faster rates of decline.
Keywords: electronic healthcare records, spirometry, COPD, lung function
Introduction
Electronic health care record (EHR) databases consist of data routinely collected as part of clinical care and are often used for healthcare research. Whilst EHR databases have many strengths, one concern is that data are not collected for the purpose of research and that when tests are undertaken, they are not done so at routine intervals as they would be in arandomised control trial (RCT), nor is the reason for a test being undertaken at that specific point in time always known.1 EHR databases differ from RCTs or prospective cohort studies, which have structured data collection where data are collected at specific times for research purposes, by specific healthcare technicians, with specific equipment following specific protocols. EHRs are becoming increasingly used in epidemiological research; however, they are often viewed as lacking quality.
In studies of people with chronic obstructive pulmonary disease (COPD), longitudinal spirometry measurements, such as forced expiratory volume in 1 second (FEV1), are often used to estimate lung function decline, a common marker of disease progression.2 Lung function decline is important as it is associated with quality of life, symptom burden, and mortality.3,4 Unlike RCTs and cohort studies, the sporadic nature of lung function measurements recorded in EHR can lead to greater apparent variation in lung function in COPD patients. This could be due to measurement error, the number of measurements over follow-up, time intervals between measurements, follow-up time, and the reason or time at which lung function measures are recorded by healthcare practitioners.
The Clinical Practice Research Datalink (CPRD) is a routinely collected EHR database of general practices in the UK and contains clinical patient information that is recorded at general practices during consultations. In this setting, spirometry measurements in COPD patients are performed by healthcare practitioners during visits to the general practice. The quality and outcomes framework (QOF) for COPD incentivises healthcare practitioners in general practice to perform spirometry every 15 months in COPD patients.5 A previous validation study of spirometry recordings in CPRD found that more than 96% of recordings had adequate quality whereby a valid interpretation could be made by a respiratory physician.6 Despite this, it is possible that other factors, such as timings of measurements, time intervals, and follow-up time, could lead to differences in longitudinal changes in lung function decline.
We aimed to investigate the rate of FEV1 decline and how variation in FEV1 differs by the criteria used to define the rate of FEV1 decline in CPRD, a routinely collected database. Specifically, we aimed to investigate how criteria around measurement error, the number of FEV1 measurements, timing of measurements, follow-up time, and use of additional linked databases may lead to differences in FEV1 decline estimates using CPRD. With the ever-growing use of EHR data for cohort studies and pragmatic trials, it is important to understand how robust EHR derived lung function decline is as an outcome.
Methods
Patient Eligibility Criteria
CPRD-GOLD (GOLD database of CPRD) was used and linked to a secondary care database, Hospital Episode Statistics (HES). CPRD contains clinical information on patients recorded at the general practices, such as diagnoses, prescriptions, consultation information, referrals, and tests performed (e.g., spirometry). HES contains information on secondary care processes for patients registered at general practices in England who are eligible for linkage with CPRD. In this study, COPD patients were identified using a validation definition of COPD in CPRD.7 COPD patients were identified if they had a clinical diagnosis of COPD, were over 35 years of age, and were smokers or ex-smokers. The start of follow-up (index date) was the first FEV1 measurement date after the following criteria were met: i) COPD diagnosis; ii) date of registration with current general practice; iii) date at which data recorded at a general practice were deemed to be of research quality (“up-to-standard”); iv) date at age 35; and v) after the implementation of QOF from the 1st January 2004. End of follow-up was the first date of the following: i) death date; ii) date at which the patient transferred to a non-CPRD GP; or iii) the 31st December 2017. Figure 1 describes the study design used to create this base population.
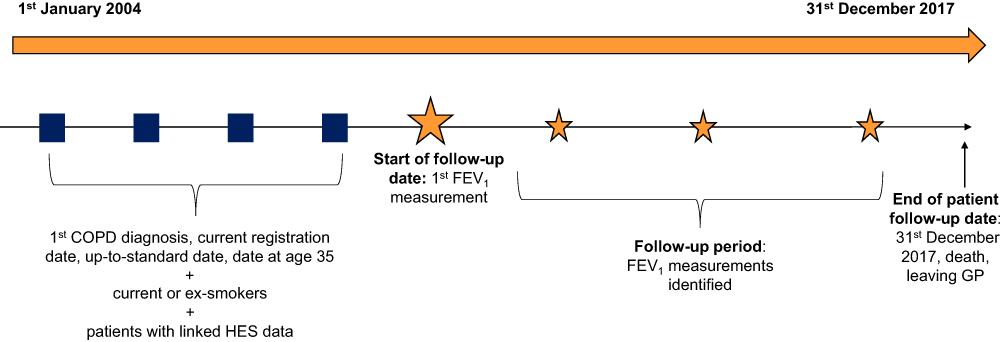 |
Figure 1 Study design. |
FEV1 Measurements
FEV1 measurements recorded between the index date and the end of follow-up were identified. FEV1 measurements were recorded in millilitres. Measurements recorded in litres were transformed to mL and measurements that were higher than 7 litres were excluded (94.8% of all measurements over follow-up were below 7 litres). A cut off 7 L was used based on the average total lung capacity for a healthy adult male. Whilst an FEV1 measurement of 7 L would be considered high in COPD patients, a distribution of FEV1 measurements was considered based off previous studies.8–10 A previous validation study of spirometry in CPRD GOLD found that of 96.5% of spirometry traces recorded at the general practice in COPD patients were of adequate quality where a respiratory clinician was able to make an interpretation.6 Of these, 27.9% were identified as post-bronchodilator FEV1, 7.2% were confirmed to be pre-bronchodilator FEV1, and for the remaining measurements it was unclear if the measurements were pre- or post-bronchodilator.
Patient Populations
In order to understand how the rate of FEV1 declines and its variation differs based on the criteria used to define longitudinal FEV1 decline, the following patient populations were created using specific criteria:
- patients with at least two FEV1 measurements at least six months apart (base population). A minimum period of six months was chosen in order to estimate medium-term lung function decline;
- patients in the base population excluding those who had an FEV1 greater than 10%, 20%, and 30% of their previous and subsequent FEV1 measurement. These measurements were regarded as potential measurement error, and patients were hence excluded;
- patients in the base population excluding individual FEV1 measurements that were greater than 10%, 20%, and 30% of the previous and subsequent FEV1 measurement. These measurements were regarded as potential measurement error and were hence excluded;
- patients in the base population excluding measurements that were within one week of an exacerbation of COPD (AECOPD) because AECOPD events are associated with decreased FEV1 both before and after an AECOPD;11
- patients with at least three or four FEV1 measurements, rather than two, of which at least two were at least six months apart (with no other time constraint on the other measurements). At least three and four measurements were chosen following a common number of measurements used in RCT and cohort studies;
- patients with at least two FEV1 measurements with at least six months or 1-year time intervals between all measurements. This was chosen following the nature of RCTs and cohort studies whereby spirometry measurements are recorded at regular intervals;
- patients in the base population with at least three years of follow-up following the maximum length of previous RCTs on lung function decline in COPD patients;12
- patients in the base population and patients meeting inclusion criteria but who did require HES linkage eligibility. Approximately 60% of CPRD-GOLD patients are eligible for HES linkage, which can restrict populations.
Figure 2 illustrates how each patient population was identified using spirometry measurements.
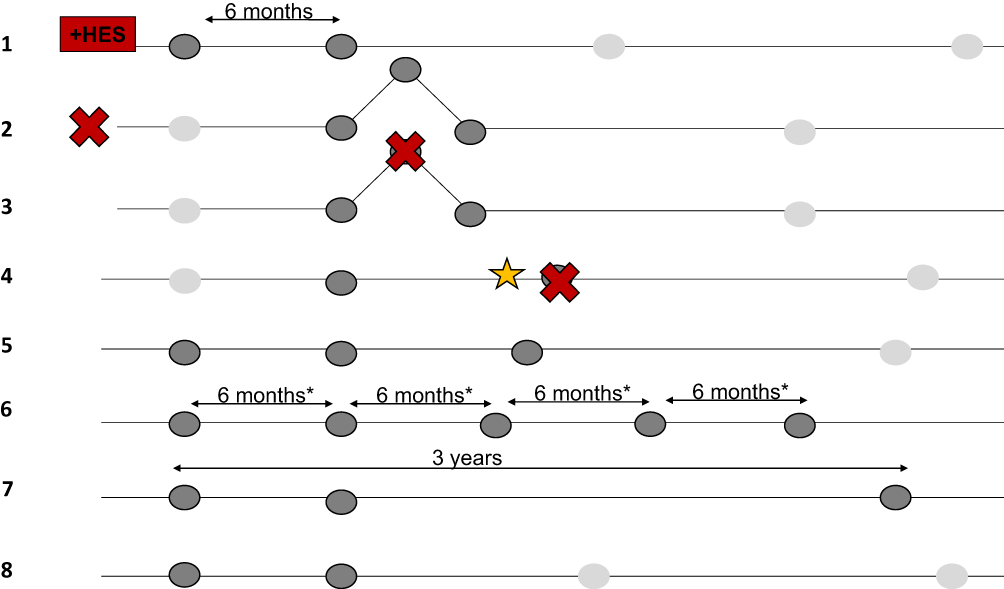 |
Figure 2 Patient populations. Notes: Patients with at least 2 FEV1 measurements at least 6 months apart with linked HES data; 2: Excluding patients with an FEV1 greater than 10%, 20%, or 30% of the previous FEV1; 3) Excluding measurements that are greater than 10, 20, 0r 30% of the previous FEV1 and subsequent FEV1; 4) Excluding measurements that are within 1 week of an AECOPD; 5) At least 3 (or 4) FEV1 measurements with at least 2 at least 6 months apart; 6) FEV1 measurements that are all at least 6 months (*or 1 year) apart; 7) At least 3 years of follow-up with at least 2 FEV1 measurements at least 6 months apart; 8) At least 2 FEV1 measurements at least 6 months apart (regardless of linked HES data). |
Statistical Analysis
Baseline patient characteristics were described for all patient populations using means (standard deviation [SD]), medians (interquartile range [IQR]), and proportions (%). Baseline characteristics included age, gender, the closest recorded smoking status (smokers or ex-smokers) to index date, the closest BMI (underweight, normal, overweight, obese using standard categories) and modified MRC dyspnoea (0–4) recorded three years prior or two years after index date, severity of obstruction using FEV1% predicted (FEV1>80% predicted, FEV1 50–80% predicted, FEV1 30–50% predicted, and FEV1<30% predicted calculated using patient’s first FEV1 measurement, height, and gender13), and AECOPD frequency and severity (none, 1 moderate and 0 severe, 2 moderate and 0 severe, ≥3 moderate and 0 severe, 1 severe and any moderate, and ≥2 severe and any moderate) in the year prior to index date. Moderate AECOPD were defined as GP treated AECOPD and severe AECOPD were defined as hospitalised AECOPD. In addition, the median number of FEV1 measurements (IQR and minimum/maximum number) and follow-up time were described for each population.
Mixed linear regression was used to estimate the rate of FEV1 decline in mL/year. Random effects included both random intercepts and random slopes allowing the intercept and rate of decline to vary by patients. Models included a non-adjusted crude model, a minimally adjusted model adjusted for age and gender, a non-adjusted crude model for patients with complete baseline covariates, and a fully adjusted model adjusted for age, gender, smoking status, BMI, mMRC, FEV1% predicted, and AECOPD frequency. Within patient variation in FEV1 (mL) was estimated from mixed linear models.
In addition, a ninth analysis population was used to describe the rate of FEV1 decline using linear regression rather than mixed linear regression to understand how clustering at the patient level influences the rate of FEV1 decline in the base population (population 1). Linear regression models included an unadjusted model, a minimally adjusted model, an unadjusted model for patients with complete baseline covariates, and a fully adjusted model adjusted for the same covariates as those used in the mixed linear regression model. Similarly, RCTs commonly use a baseline FEV1 measurement and a follow-up measurement to describe the change in FEV1 over time. This method was used to compare the rates of decline against those estimated using linear regression and mixed linear regression methods. This was calculated using patient’s first and last FEV1 over follow-up divided by the time between these two measurements (in years) to estimate rate of FEV1 decline in mL/year.
Results
The numbers of patients included in each population varied because of the different criteria for repeated FEV1 measurements. Population eight included the greatest number of patients (N=125,682) as it did not require linked HES data and population two included the fewest number of patients because patients were excluded if they had an FEV1 that was greater than 10% of their previous and subsequent FEV1 (N=29,058). Table 1 summarises baseline characteristics for all populations. Populations were similar in terms of age, gender, smoking status, BMI, mMRC, and AECOPD frequency. However, population two included fewer severely obstructed patients and more mild COPD patients (i.e., FEV1>80% predicted).
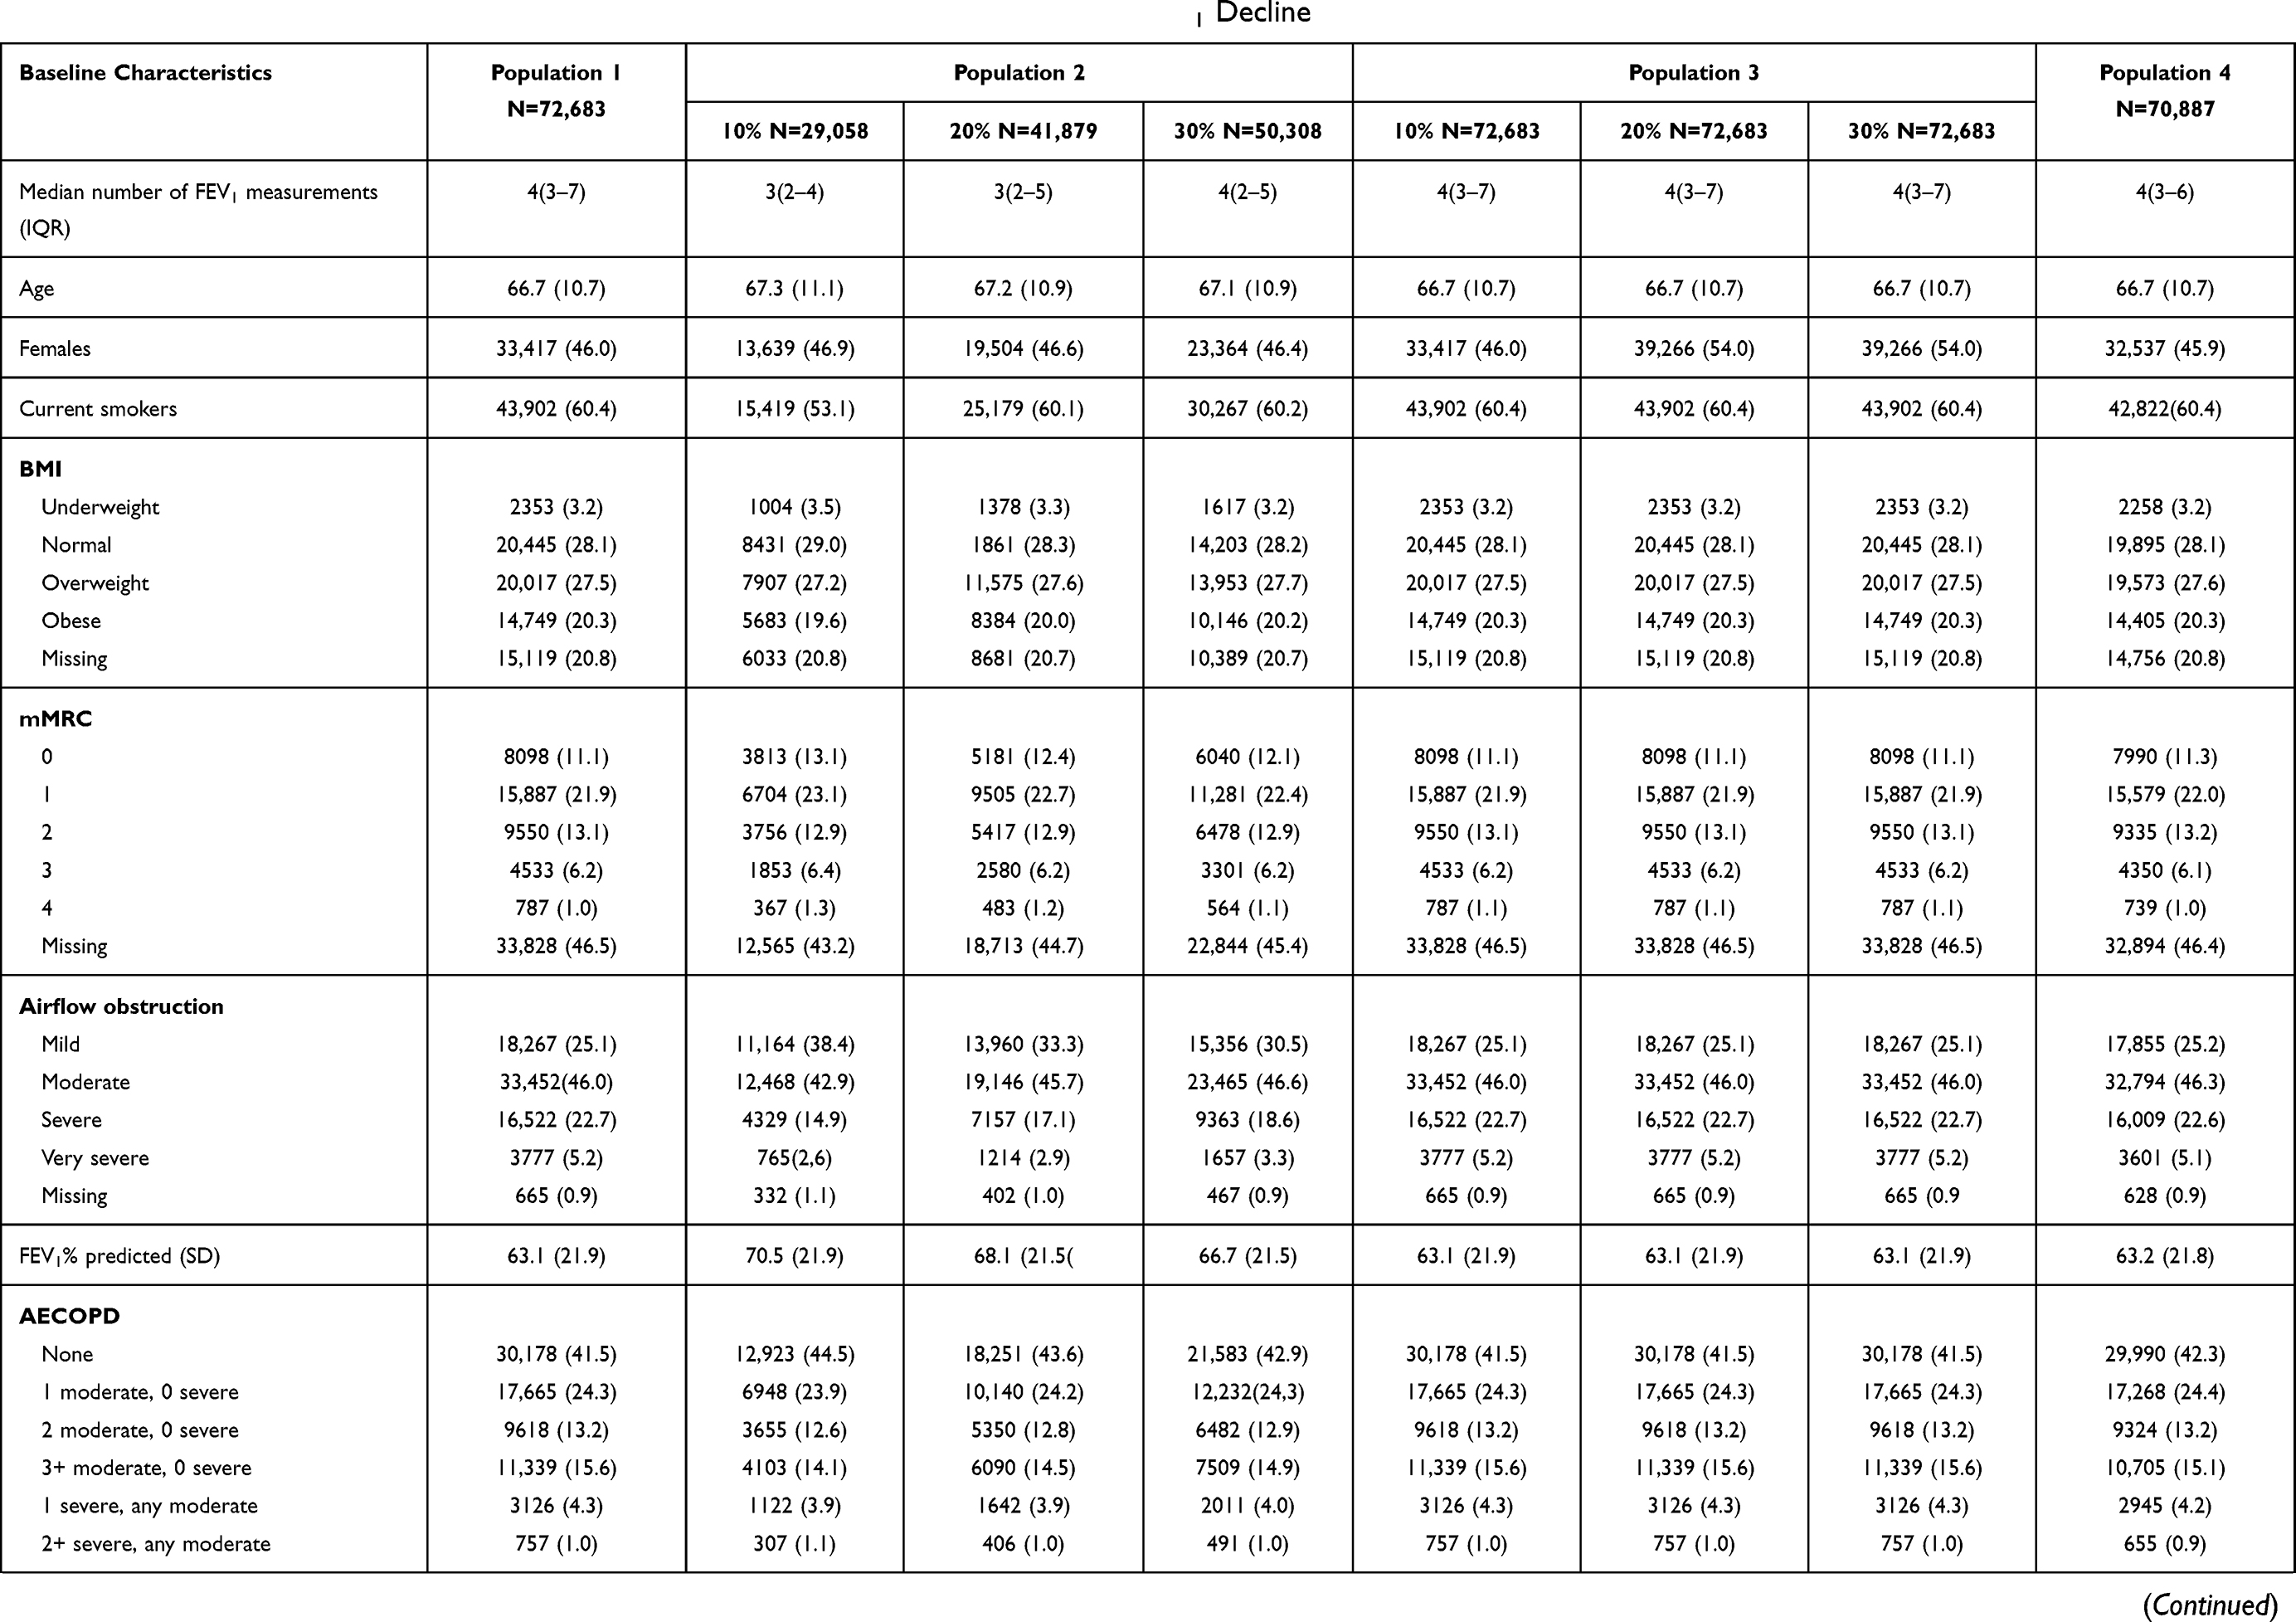 | 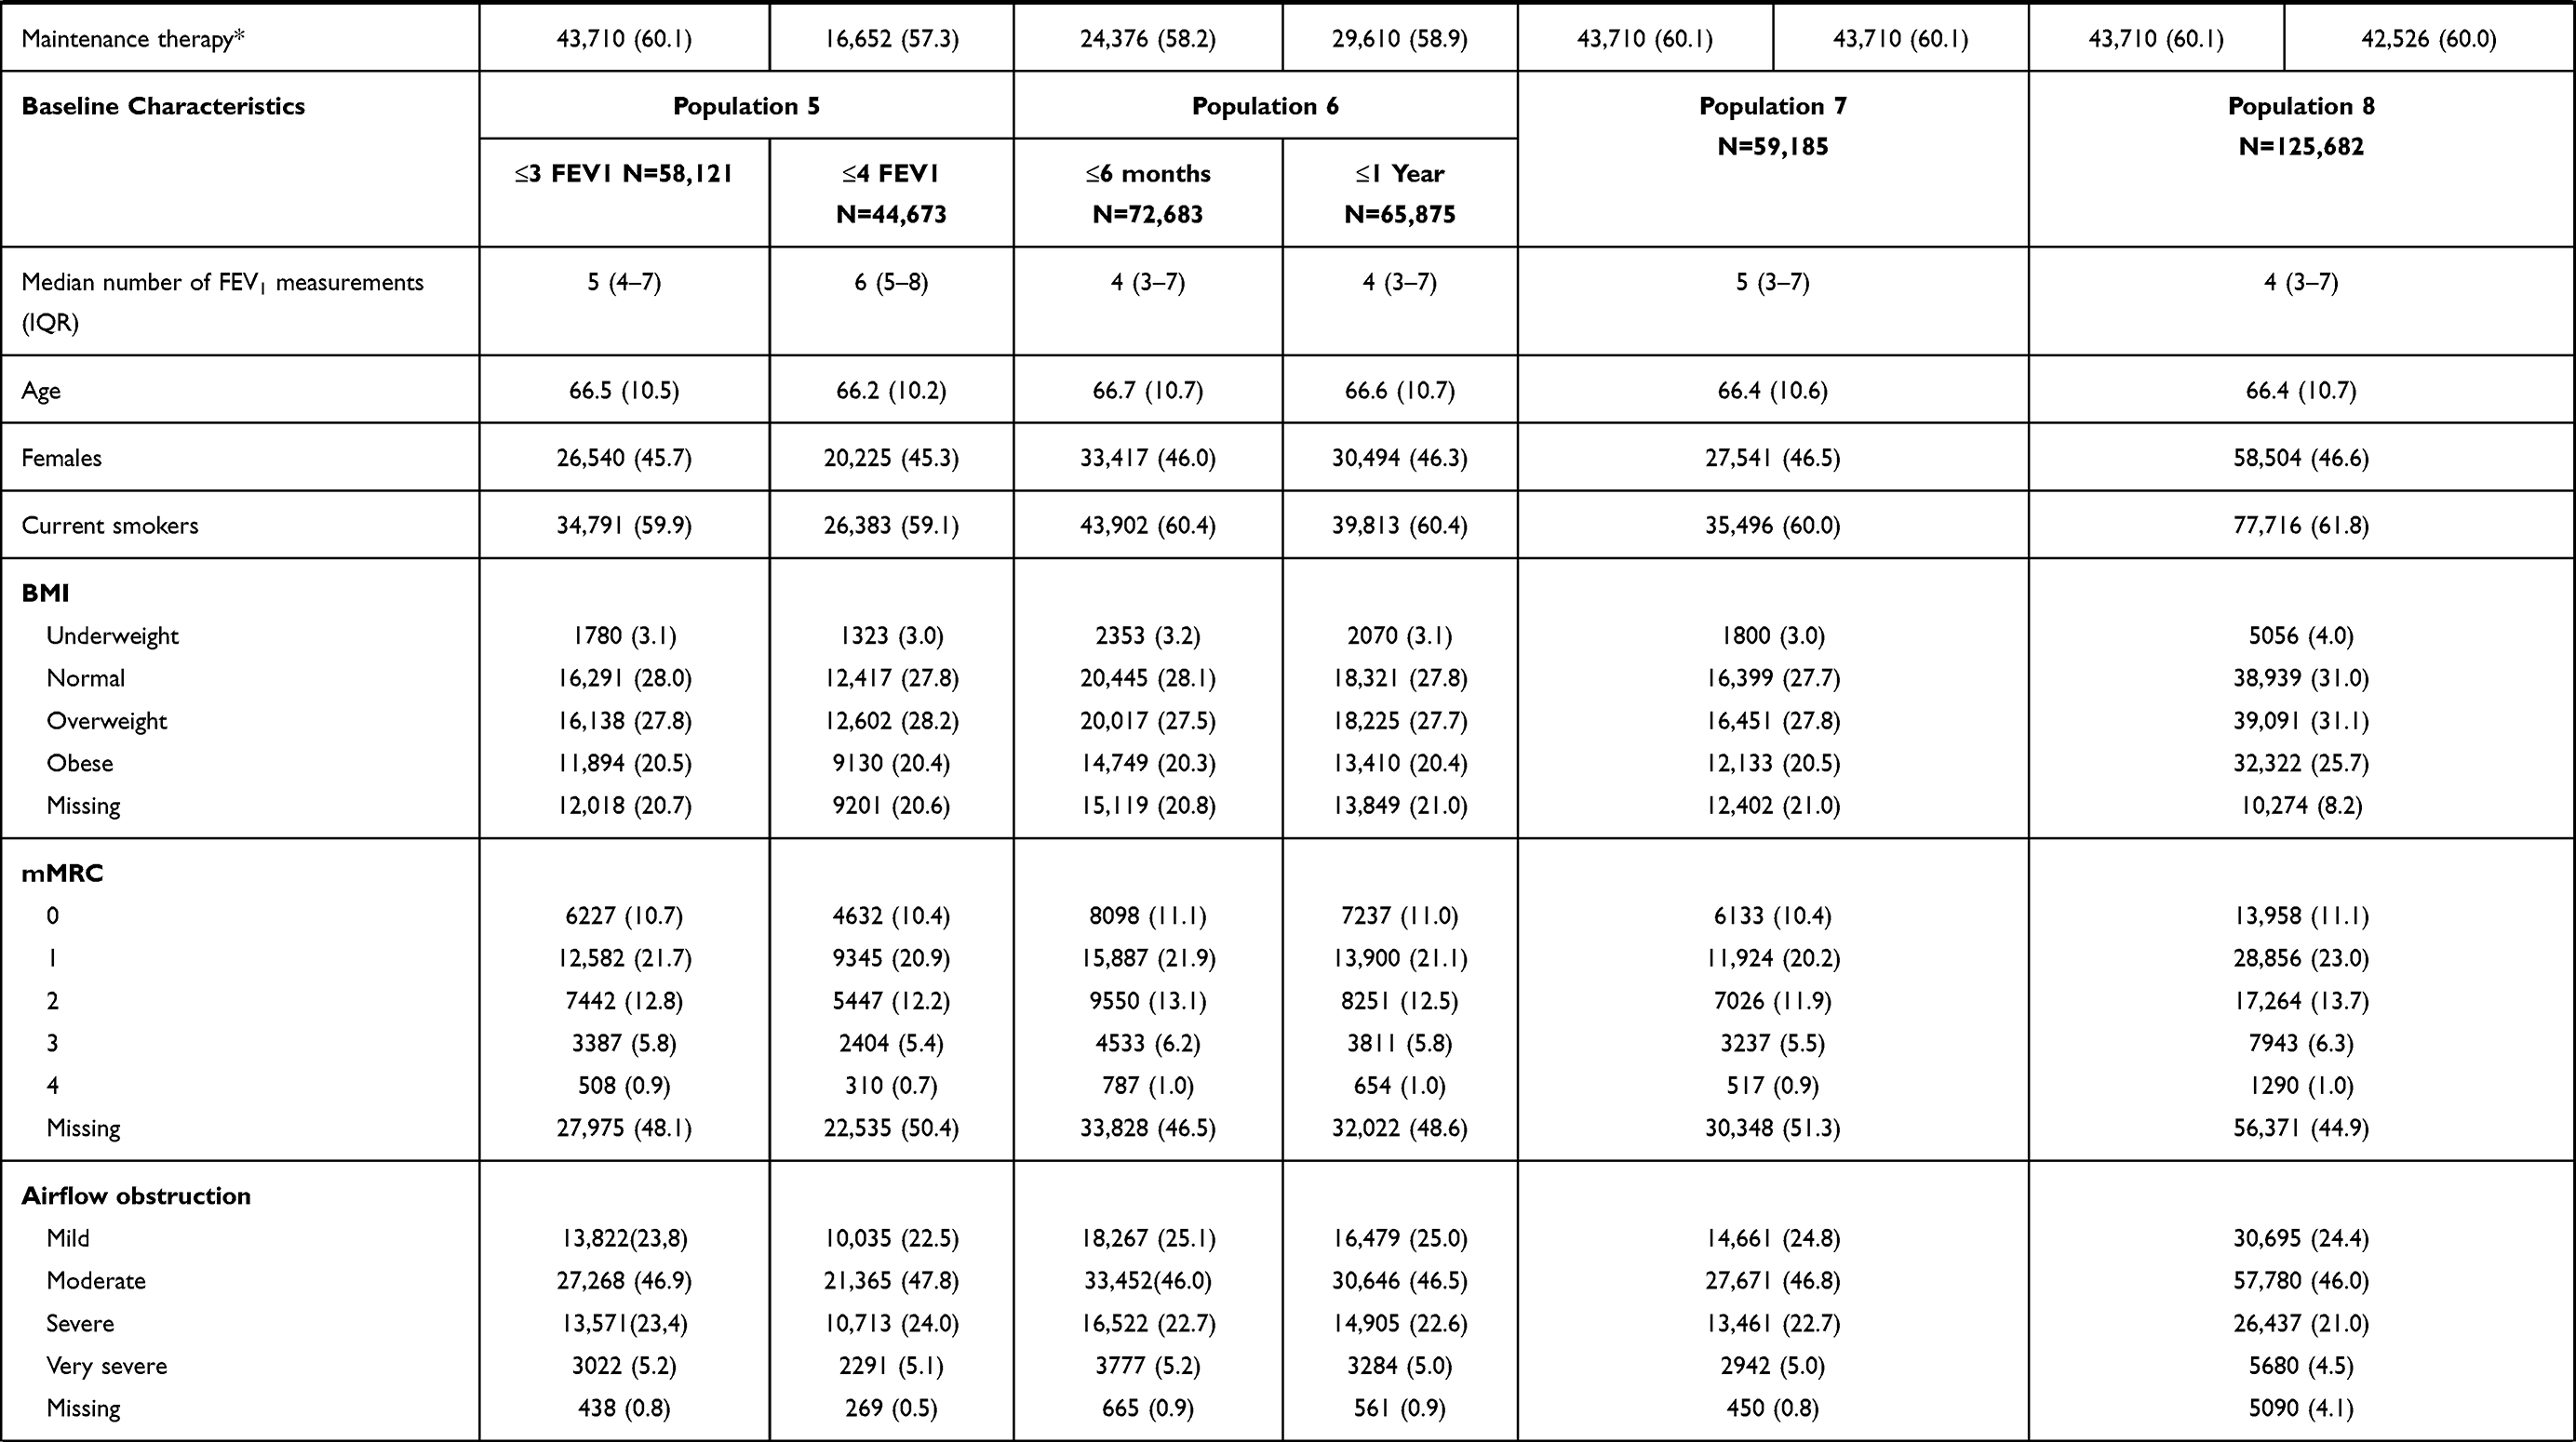 | 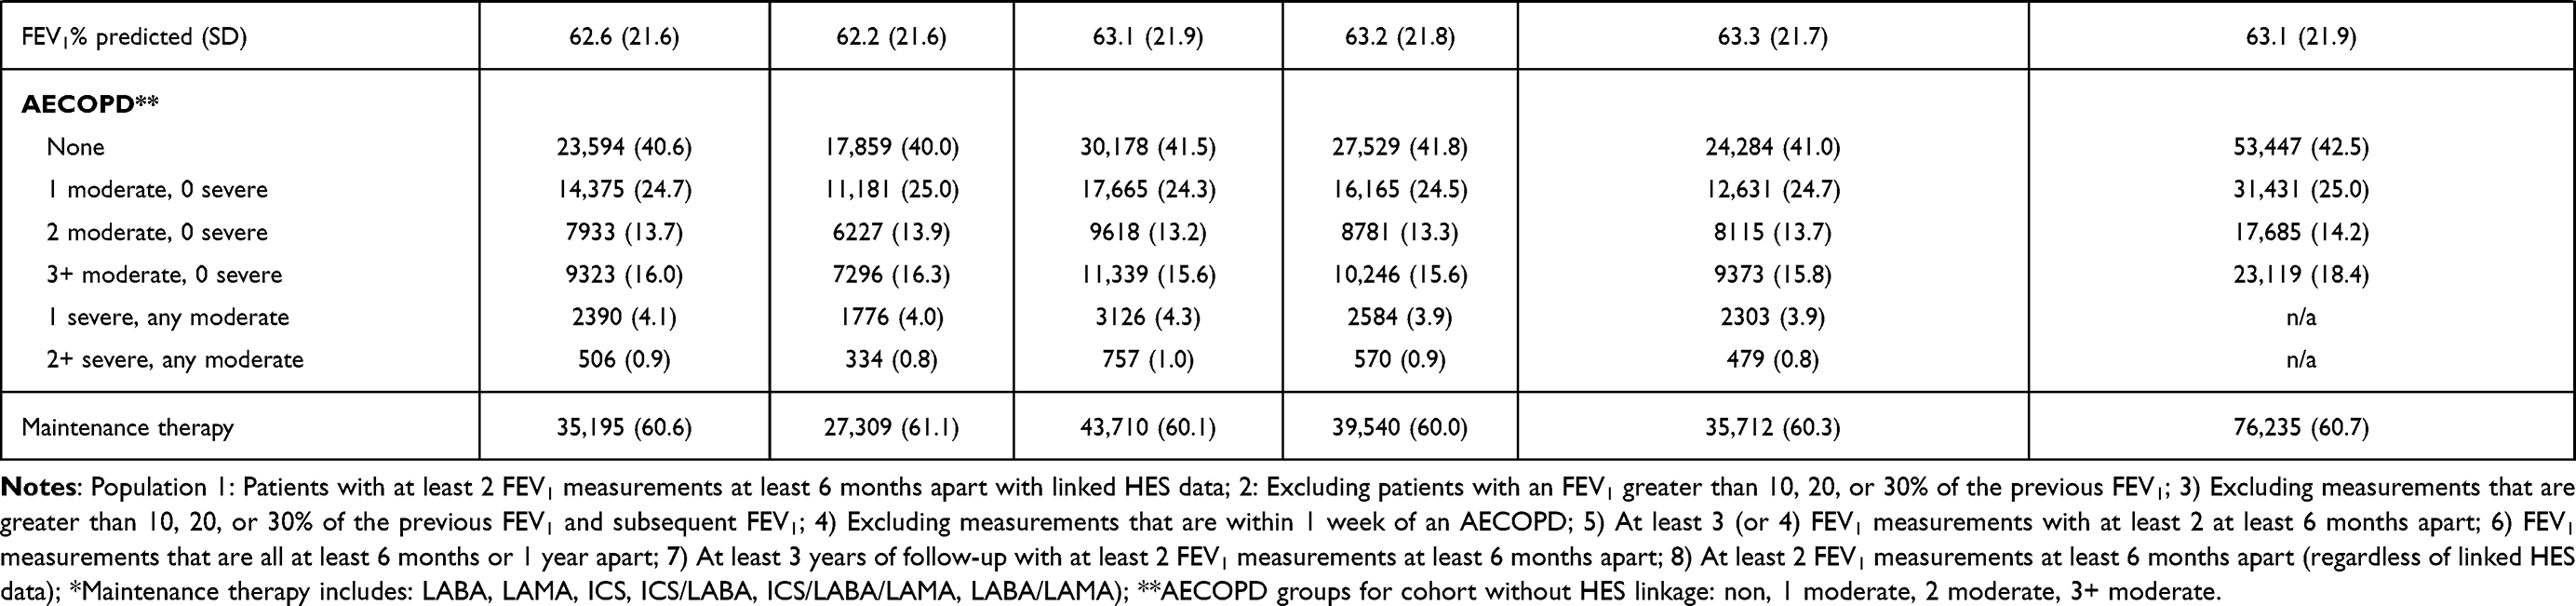 |
Table 1 Baseline Characteristics for All Populations Defined Using Different Criteria for FEV1 Decline |
Most populations had a median of 4 FEV1 measurements during follow-up; however, patients in population two (that excluded patients with an FEV1 greater than 10% or 20% of the previous and subsequent FEV1 measurements) had fewer FEV1 measurements over follow-up with a median of 3. On the other hand, population five that included patients with at least 4 FEV1 measurements had a median of 6 measurements over follow-up. In addition, for population one, the median FEV1 measurement over follow-up was 1.5 L (IQR 1.08–2.03 (Supplementary Figure E1).
Rate of FEV1 Decline
Minimally adjusted and fully adjusted mean rates of FEV1 decline in each population are shown in Figures 3 and 4. Estimates from crude analyses can be found in the supplementary material (Tables E1–E9). Mean rates of FEV1 decline were similar in all patient populations except for population two (i.e., exclusion of patients with FEV1 greater than a) 10%, b) 20%, and c) 30% of the previous and subsequent FEV1 measurements. Minimally adjusted rates of FEV1 decline in population one and three-eight ranged from −18.7mL/year (95% CI −19.2 to −18.2) to −16.5mL/year (95% CI −17.3 to −15.7). The mean rates of FEV1 decline for population two was −79.4mL/year (95% CI −80.7 to −78.2) excluding those with an FEV1 greater than 10% of their previous FEV1, −57.1mL/year (95% CI −58.0 to −56.2) excluding patients with an FEV1 greater than 20% of their previous FEV1, and −46.8mL/year (95% CI −47.6 to −46.0) excluding patients with an FEV1 greater than 30% of their previous FEV1.
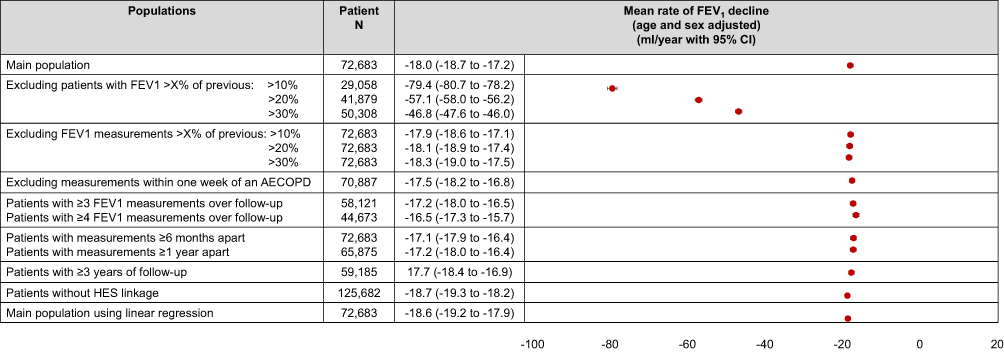 |
Figure 3 Minimally adjusted rates of FEV1 decline. Note: Adjusted for age and sex. |
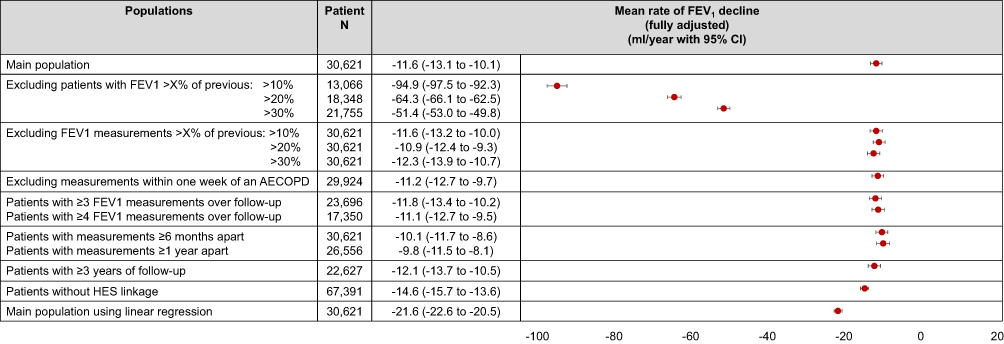 |
Figure 4 Fully adjusted rates of FEV1 decline. Note: Adjusted for all baseline covariates. |
Fully adjusted rates of FEV1 decline in population one and three-eight ranged from −14.6mL/year (95% CI −15.7 to −13.6) to −9.8mL/year (95% CI −11.5 to −8.1). Fully adjusted mean rates of FEV1 decline for population two were −94.9mL/year (95% CI −97.5 to −92.3) excluding those with an FEV1 greater than 10% of their previous FEV1, −64.3mL/year (95% CI −66.1 to −62.5) excluding those with an FEV1 greater than 20% of their previous FEV1, and −51.4mL/year (95% CI −53.0 to −49.8) excluding those with an FEV1 greater than 30% of their previous FEV1.
It is important to note that minimally adjusted and fully adjusted models differed by patient numbers due to complete case analysis. Tables E1–E8 provide further information on unadjusted models, minimally adjusted models, unadjusted models in patients with complete data, and fully adjusted models. Unadjusted models in patients with complete baseline covariates were similar to fully adjusted models. Fully adjusted complete case analyses included fewer patients due to missing BMI, mMRC, and height (used to calculate FEV1% predicted).
Estimates using linear regression models were similar for unadjusted and minimally adjusted analyses; however, the rate of FEV1 decline was faster in fully adjusted analyses compared to rates estimated using mixed linear regression models (Table E9). The rate of FEV1 decline was also assessed in the base population (population 1) using patients first and last FEV1 measurements only. Overall, the mean unadjusted rate of FEV1 decline using this method was −16.4mL/year (SD 246.5).
Within patient variation of FEV1 in minimally adjusted mixed linear models ranged from 330.6 mL to 339.8 mL in populations one, four, five, seven, and eight. Within patient variation in FEV1 was slightly higher in population six at 350.7 mL. Population two had the lowest within patient variation in FEV1 at 195.5 mL, 191.2 mL, and 202.5 mL after excluding patients with an FEV1 greater than 10%, 20%, and 30% of the previous FEV1 measurements, respectively. See Supplementary Tables E1–E8 for further details on within patient variation in all models and populations.
Discussion
This piece of work set out to describe potential differences in patient characteristics, FEV1 variability and rates of FEV1 decline between COPD populations defined using different requirements around FEV1 measurements in routinely collected data using CPRD. Specifically, how different definitions around measurement error, number of measurements, time intervals between measurements, follow-up time, and secondary care data linkage can lead to the selection of potentially different study populations. Overall, we found that regardless of the number of FEV1 measurements, time intervals between measurements, follow-up time, and secondary care data linkage, patient demographics, within patient FEV1 variability, and rates of FEV1 decline remained consistent. Similarly, results were consistent in populations that excluded individual FEV1 measurements that were likely due to measurement error. However, excluding patients (rather than individual measurements) with likely measurement error led to the exclusion of a specific group of COPD patients; severely obstructed patients (low FEV1% predicted). This could lead to selection bias in studies that aim to use a representative population of COPD patients. In addition, using mixed linear regression provided estimates that were different from those using linear regression, suggesting that clustering at the patient level is important when investigating the rate of FEV1 decline in routinely collected data.
The mean annual rates of FEV1 decline described in this study for populations one and three to eight were similar to those reported in previous studies of COPD patients.4,8,9 Interestingly, population two (those who were excluded due to potential measurement error) had faster rates of FEV1 decline. More patients with low FEV1% predicted were excluded in this population, which meant that there were more patients with milder COPD (higher FEV1% predicted) than all other populations. Previous studies have suggested that rates of FEV1 decline are faster in COPD patients with milder disease because they have more absolute lung function to lose at baseline than those with severe disease.14 This also suggests that patients with lower FEV1% predicted are more likely to have poorly recorded spirometry (potential measurement error). It is possible that patients with more severe disease, and lower FEV1% predicted, were more likely to perform poor spirometry, which might have contributed to the high variation seen in this group of patients. Whilst the best of three spirometry recordings should be recorded by healthcare practitioners, it is possible that only one spirometry is performed and recorded if patients are too severe to perform three in a row. It is also important to note that the increase in FEV1 by 10%, 20%, and 30% could be due to initiation of COPD medications, which can have an acute bronchodilation effect; however, studies have shown that this effect decreases over time in COPD patients on long-term treatment.15,16 Therefore, researchers should consider their research question prior to defining the rate of FEV1 decline.
It is also important to note that fewer patients were included in models with patients who had complete baseline covariate data. In CPRD-GOLD this is due to the lack of consistent recording of BMI and mMRC. Fully adjusted analyses produced slower mean rates of FEV1 decline compared to crude or minimally adjusted rates of decline. However, in the population that excluded patients due to potential measurement error (population two), fully adjusted mean rates of FEV1 decline were faster than crude and minimally adjusted models. Patient populations that excluded patients with potential measurement error and who had complete baseline data included slightly milder patients than the same population regardless of complete baseline data (data not shown). On the other hand, all other patient populations who had complete baseline data had slightly more severe patients than the same populations regardless of complete baseline data. This is consistent with the theory that milder COPD patients might have faster rates of FEV1 decline due to initial lung function.14 Therefore, it is possible that missing baseline variables could influence the type of patients included in a study, and the rate of FEV1 decline.
Lastly, simple linear regression provided estimates that were slightly faster than those using mixed linear regression. Previous studies have used linear regression to describe the rate of FEV1 decline.4,9,17 The limitation to this model is that within and between patient variations are not taken into consideration by the model. If similar types of patients are included and FEV1 is not highly variable within or between patients, then linear regression can be sufficient. However, due to the nature of CPRD, a routinely collected EHR, a wide variety of phenotypes can exist, and measurement error is possible therefore, mixed linear regression should be used to take into account FEV1 variation.
Previous studies (notably RCTs) have also estimated changes in FEV1 using two FEV1 measurements, one at baseline and one at follow-up.18,19 The nature of RCTs ensures that patients are similar in all arms of the trial and confounding is adjusted for by the study design. However, in CPRD, and other EHRs, this method could be easily biased by measurement errors, changes in maintenance therapies during follow-up, AECOPD events during follow-up, and other everyday primary care factors. This method for estimating changes in FEV1 would require the two measurements to be accurate and not be recorded close to events that may influence FEV1 such as AECOPDs and changes in medication. Overall, in order to use as much data as possible over follow-up, and to consider varying changes in individual patient decline and initial lung function, mixed linear regression should be used when studying FEV1 using EHR.
One important limitation to acknowledge in this study is that whilst the majority (96.5%) of spirometry measurements recorded in CPRD-GOLD are of adequate quality, pre, and post-FEV1 cannot always be distinguished. However, in a previous validation study of spirometry measurements in CRPD-GOLD, of those that could be distinguished, the majority of measurements were post-bronchodilator spirometry.6
Overall, this study aimed to explore different definitions around longitudinal change in FEV1 in CPRD-GOLD and describe differences in populations created using these definitions. Previous studies have investigated how patient characteristics are associated with FEV1 decline; however, the purpose of this study was to primarily show how mean rates of FEV1 decline differed depending on the definition used.8–10,20,21 We found that in the cohorts that did not exclude measurements or individuals due to increases in FEV1, the mean rates of FEV1 and within patient variation remained similar. For this reason, the definition used to create population one (i.e., using all available FEV1 measurements over follow-up) could be used to describe the rate of FEV1 decline in a COPD population using CPRD data. However, researchers should consider their research question prior to the selection of the definition for rate of FEV1 decline.
Conclusion
Overall, the quality of FEV1 in CPRD is adequate for the purpose of studying FEV1 decline. We found that regardless of potential measurement error, number of FEV1 measurements, time intervals between measurements, follow-up period, exclusion of specific FEV1 measurements, and linkage to secondary care data, FEV1 variability and rate of FEV1 decline remain similar in a COPD population. This suggests that CPRD is a good resource for investigating the rate of FEV1 decline in epidemiological studies and pragmatic trials. However, researchers using EHR should be aware of the difference in rate of FEV1 decline and patient characteristics when excluding individuals with questionable data.
Data Sharing Statement
Data are available on request from the Clinical Practice Research Datalink (CPRD). Their provision requires the purchase of a license and our license does not permit us to make them publicly available to all. We used data from the version collected in January 2018 and have clearly specified the data selected in our Methods section. To allow identical data to be obtained by others, via the purchase of a license, we will provide the code lists on request. Licences are available from the CPRD (http://www.cprd.com): The Clinical Practice Research Datalink Group, The Medicines and Healthcare products Regulatory Agency, 10 South Colonnade, Canary Wharf, London E14 4PU.
This research was supported by the NIHR Imperial Biomedical Research Centre (BRC). The views expressed are those of the author(s) and not necessarily those of the NIHR or the Department of Health and Social Care.
Ethics Approval
The protocol for this research was approved by the Independent Scientific Advisory Committee (ISAC) for MHRA Database Research (protocol number 16_186) and the approved protocol was made available to the journal and reviewers during peer review. This study is based in part on data from the Clinical Practice Research Datalink obtained under licence from the UK Medicines and Healthcare products Regulatory Agency. The data is provided by patients and collected by the NHS as part of their care and support. The interpretation and conclusions contained in this study are those of the author/s alone. Linked pseudonymised data was provided for this study by CPRD. Data is linked by NHS Digital, the statutory trusted third party for linking data, using identifiable data held only by NHS Digital. Select general practices consent to this process at a practice level with individual patients having the right to opt-out.
This study is based in part on data from the Clinical Practice Research Datalink (CPRD) obtained under licence from the UK Medicines and Healthcare products Regulatory Agency. The data is provided by patients and collected by the National Health Service (NHS) as part of their care and support. The Office for National Statistics (ONS) was the provider of the ONS Data contained within the CPRD Data and maintains a Copyright © 2019, re-used with the permission of The Health & Social Care Information Centre, all rights reserved. The interpretation and conclusions contained in this study are those of the authors alone.
Author Contributions
All authors made a significant contribution to the work reported, whether that is in the conception, study design, execution, acquisition of data, analysis and interpretation, or in all these areas; took part in drafting, revising or critically reviewing the article; gave final approval of the version to be published; have agreed on the journal to which the article has been submitted; and agree to be accountable for all aspects of the work.
Funding
There is no funding to report.
Disclosure
HW reports grants from GSK, AZ, and BI, outside the submitted work; SK reports grants from Medical Research Council, during the conduct of the study; personal fees from Roche Diagnostics, personal fees from DIADEM, personal fees from AstraZeneca, outside the submitted work; JQ reports grants from British Lung Foundation and personal fees from AZ, Asthma UK, BI, Bayer, GSK, MRC, and Chiesi, outside the submitted work. The authors report no other conflicts of interest in this work.
References
1. Whittaker H, Quint JK. Using routine health data for research: the devil is in the detail. Thorax. 2020;75:714–715. doi:10.1136/thoraxjnl-2020-214821
2. Tantucci C, Modina D. Lung function decline in COPD. Int J Chron Obstruct Pulmon Dis. 2012;7:95–99. doi:10.2147/COPD.S27480
3. Sin DD, Anthonisen NR, Soriano JB, Agusti AG. Mortality in COPD: role of comorbidities. Eur Respir J. 2006;28(6):1245. doi:10.1183/09031936.00133805
4. Vestbo J, Edwards LD, Scanlon PD, et al. Changes in forced expiratory volume in 1 second over time in COPD. N Engl J Med. 2011;365(13):1184–1192. doi:10.1056/NEJMoa1105482
5. Herrett E, Gallagher AM, Bhaskaran K, et al. Data resource profile: clinical practice research datalink (CPRD). Int J Epidemiol. 2015;44(3):827–836. doi:10.1093/ije/dyv098
6. Rothnie KJ, Chandan JS, Goss HG, Mullerova H, Quint JK. Validity and interpretation of spirometric recordings to diagnose COPD in UK primary care. Int J Chron Obstruct Pulmon Dis. 2017;12:1663–1668. doi:10.2147/COPD.S133891
7. Quint JK, Mullerova H, DiSantostefano RL, et al. Validation of chronic obstructive pulmonary disease recording in the clinical practice research datalink (CPRD-GOLD). BMJ Open. 2014;4(7):e005540. doi:10.1136/bmjopen-2014-005540
8. Whittaker HR, Pimenta JM, Jarvis DA-O, Kiddle SA-O, Quint JA-O. Characteristics associated with accelerated lung function decline in a primary care population with chronic obstructive pulmonary disease. Int J Chron Obstruct Pulmon Dis. 2020;15:3079. (1178-2005 (Electronic)). doi:10.2147/COPD.S278981
9. Whittaker HR, Mullerova H, Jarvis D, et al. Inhaled corticosteroids, blood eosinophils, and FEV1 decline in patients with COPD in a large UK primary health care setting. Int J Chron Obstruct Pulmon Dis. 2019;14:1063–1073. doi:10.2147/COPD.S200919
10. Whittaker HR, Bloom C, Morgan A, Jarvis D, Kiddle SJ, Quint JK. Accelerated FEV1 decline and risk of cardiovascular disease and mortality in a primary care population of COPD patients. Eur Respir J. 2020;2000918. doi:10.1183/13993003.00918-2020
11. Watz H, Tetzlaff K, Magnussen H, et al. Spirometric changes during exacerbations of COPD: a post hoc analysis of the WISDOM trial. Respir Res. 2018;19(1):251. doi:10.1186/s12931-018-0944-3
12. Whittaker HR, Jarvis D, Sheikh MR, Kiddle SJ, Quint JK. Inhaled corticosteroids and FEV1 decline in chronic obstructive pulmonary disease: a systematic review. Respir Res. 2019;20(1):277. doi:10.1186/s12931-019-1249-x
13. Quanjer PH, Tammeling GJ, Cotes JE, Pedersen OF, Peslin R, Yernault JC. Lung volumes and forced ventilatory flows. Eur Respir J. 1993;6(Suppl 16):5. doi:10.1183/09041950.005s1693
14. Mannino DM, Davis KJ. Lung function decline and outcomes in an elderly population. Thorax. 2006;61(6):472–477. doi:10.1136/thx.2005.052449
15. Tashkin DP, Li N, Kleerup EC, et al. Acute bronchodilator responses decline progressively over 4 years in patients with moderate to very severe COPD. Respir Res. 2014;15(1):102. doi:10.1186/s12931-014-0102-5
16. Tashkin DP, Celli B, Decramer M, et al. Bronchodilator responsiveness in patients with COPD. Eur Respir J. 2008;31(4):742. doi:10.1183/09031936.00129607
17. Kim J, Yoon HI, Oh Y-M, et al. Lung function decline rates according to GOLD group in patients with chronic obstructive pulmonary disease. Int J Chron Obstruct Pulmon Dis. 2015;10:1819–1827. doi:10.2147/COPD.S87766
18. Luoto J, Pihlsgard M, Wollmer P, Elmstahl S. Relative and absolute lung function change in a general population aged 60–102 years. Eur Respir J. 2019;53(3):3. doi:10.1183/13993003.01812-2017
19. Magnussen H, Disse B, Rodriguez-Roisin R, et al. Withdrawal of inhaled glucocorticoids and exacerbations of COPD. N Engl J Med. 2014;371(14):1285–1294. doi:10.1056/NEJMoa1407154
20. Donaldson GC, Seemungal TAR, Bhowmik A, Wedzicha JA. Relationship between exacerbation frequency and lung function decline in chronic obstructive pulmonary disease. Thorax. 2002;57(10):847–852. doi:10.1136/thorax.57.10.847
21. Calverley PM, Anderson JA, Brook RD, et al. Fluticasone furoate, vilanterol and lung function decline in patients with moderate COPD and heightened cardiovascular risk. Am J Respir Crit Care Med. 2017.
 © 2021 The Author(s). This work is published and licensed by Dove Medical Press Limited. The
full terms of this license are available at https://www.dovepress.com/terms
and incorporate the Creative Commons Attribution
- Non Commercial (unported, 3.0) License.
By accessing the work you hereby accept the Terms. Non-commercial uses of the work are permitted
without any further permission from Dove Medical Press Limited, provided the work is properly
attributed. For permission for commercial use of this work, please see paragraphs 4.2 and 5 of our Terms.
© 2021 The Author(s). This work is published and licensed by Dove Medical Press Limited. The
full terms of this license are available at https://www.dovepress.com/terms
and incorporate the Creative Commons Attribution
- Non Commercial (unported, 3.0) License.
By accessing the work you hereby accept the Terms. Non-commercial uses of the work are permitted
without any further permission from Dove Medical Press Limited, provided the work is properly
attributed. For permission for commercial use of this work, please see paragraphs 4.2 and 5 of our Terms.