Back to Journals » Journal of Pain Research » Volume 14
Central Sensitization in Chronic Low Back Pain: A Population-Based Study of a Japanese Mountain Village
Authors Akeda K ![]() , Takegami N
, Takegami N ![]() , Yamada J, Fujiwara T
, Yamada J, Fujiwara T ![]() , Nishimura A
, Nishimura A ![]() , Sudo A
, Sudo A
Received 14 January 2021
Accepted for publication 28 April 2021
Published 18 May 2021 Volume 2021:14 Pages 1271—1280
DOI https://doi.org/10.2147/JPR.S301924
Checked for plagiarism Yes
Review by Single anonymous peer review
Peer reviewer comments 3
Editor who approved publication: Professor Michael Überall
Koji Akeda, Norihiko Takegami, Junichi Yamada, Tatsuhiko Fujiwara, Akinobu Nishimura, Akihiro Sudo
Department of Orthopaedic Surgery, Mie University Graduate School of Medicine, Tsu, Japan
Correspondence: Koji Akeda
Department of Orthopaedic Surgery, Mie University Graduate School of Medicine, 2-174 Edobashi, Tsu City, Mie, 514-8507, Japan
Tel +81-59-231-5022
Fax +81-59-231-5211
Email [email protected]
Purpose: Central sensitization (CS) is defined as the increased responsiveness of nociceptive neurons in the central nervous system to normal or subthreshold afferent input. CS has been proposed as an underlying mechanism of chronic pain in musculoskeletal disorders including low back pain (LBP). A Central Sensitization Inventory (CSI) has recently been developed for screening participants with CS. However, the association of CS with chronic LBP (cLBP) in the general population remains unknown. The purpose of this study was to investigate the association of CS with cLBP using the CSI in a population-based cohort of a Japanese mountain village.
Participants and Methods: Participants aged more than 50 years were recruited from the inhabitants of a mountain village in Japan. Participants completed the following patient-reported outcome measures. Severity of CS was assessed by the CSI. LBP intensity was measured on a numerical rating scale (NRS). Health-related quality of life (QOL) was measured using the EuroQol 5-dimension (EQ-5D), EuroQol-visual analogue scales (EQ-VAS), and the Oswestry Disability Index (ODI). The association of CS and each parameter was statistically evaluated.
Results: A total of 272 participants (average age: 72.1 years-old) were analyzed in this study, and 28.3% had cLBP. Average NRS, ODI and CSI scores were significantly higher in the cLBP group than in the without LBP (LBP−) group. There was a significant correlation between CSI and NRS scores (r=0.34, P< 0.0001), ODI (r=0.60, P< 0.0001), EQ5D (r=− 0.55, P< 0.0001) and EQ-VAS (r=− 0.52, P< 0.0001). A multiple regression analysis identified that ODI, EQ-VAS and age were factors significantly associated with CSI.
Conclusion: The results of this study suggest that CS is involved in the pathological condition of cLBP in the local residents of a Japanese mountain village.
Keywords: central sensitization, low back pain, Central Sensitization Inventory, general population
Introduction
Low back pain (LBP) is the leading cause of disability worldwide.1,2 Especially, in the aged population, LBP results in a significant burden, incurs considerable human costs, adversely affects the quality of life (QOL), and produces activity limitations. For the older population with LBP, it is sometimes difficult to accurately identify the specific nociceptive origin and appropriately manage symptoms for improving disability and QOL.3 Increasing evidence has recently shown that LBP is a complex condition with multiple contributors to both nociceptive pain and associated disability, including psychological factors, social factors, and pain-transmission mechanisms (see review in1).
Central sensitization (CS) has been defined as an amplification of pain signaling within the central nervous system, which evokes pain hypersensitivity.4 It has been recognized that CS is associated with mechanical hyperalgesia and allodynia in patients with chronic pain conditions.5 CS has been proposed as an underlying mechanism of musculoskeletal disorders including LBP,6–8 osteoarthritis,9–11 rheumatoid arthritis,12 neck and shoulder pain,13 fibromyalgia,11 and tendinopathies.14
The Central Sensitization Inventory (CSI) assesses 25 health-related symptom dimensions that have been reported to be associated with CS-related disorders;15 it is now used as a screening instrument to identify patients whose symptoms are related to CS.16 Since Mayer et al developed the English version of the CSI,15 the CSI has also been validated in other languages (see review in17) including Japanese.18 A recent systemic review of 14 published studies on chronic pain conditions evaluated by the outcome measures of the CSI revealed that the interpretability measures of the CSI were consistent and its construct validity was strong; this suggests that the CSI is a screening tool that generates reliable and valid data to quantify the severity of several symptoms of CS.19
Most previous studies on CS assessed by CSI score have been conducted for patients with chronic pain conditions. Recent clinical studies have shown that CSI scores were significantly correlated with the intensity of LBP for patients with lumbar spine disorders who need surgical or non-surgical orthopedic treatments.6,20 However, little is known about the CS and/or CSI of a local elderly population whose residents are predominantly of an age to be affected with lumbar spine disorders. Therefore, we decided to investigate the CS by CSI score of a population-based cohort study in a Japanese mountain village where the ageing rate is high and progressing, and the population turnover is low.
The purpose of this study was to investigate the association of CS with chronic LBP (cLBP) using the CSI in a population-based cohort of a Japanese mountain village.
Participants and Methods
Participants
This study was conducted in accordance with the Declaration of Helsinki. Ethical approval for the study was granted by the Committee for the Ethics of Human Research of Mie University (IRB reference number: U2018-022). Data were obtained from November 30 to December 15 in 2019 from participants in the Miyagawa study. The Miyagawa study started in 1997 and is a population-based cohort study conducted to identify factors associated with knee osteoarthritis,21 osteoporosis,22 vertebral fracture23 and disc degeneration24 by collecting data from a representative sample of a local elderly Japanese population every second year. Participants aged more than 50 years were recruited by invitation to a medical examination from the inhabitants of Odai-cho, a mountain village located in the center of Mie Prefecture (Japan).
Participants completed an interviewer-administered questionnaire that included information on age, gender, the presence of pain in the neck, upper extremity, low back, hip, knee, ankle, and foot. Anthropometric measurements included body height, body weight, body mass index (BMI: weight [kg]/height2 [m2]) and bone mineral density (BMD). The BMD of the forearm was measured using dual-energy x-ray absorptiometry (DCS-600EX, Aloka, Tokyo). All participants were interviewed by experienced orthopedists regarding the presence of low back pain and were first asked, “Do you have low back pain that lasts more than 24 hours?” Participants who answered yes were subsequently asked, “Have you experienced low back pain within the last month or for more than three months?” The participants who answered “within the last month” were defined as acute LBP (aLBP) group, and “more than three months” were defined as cLBP group.
Procedures and Measurements
All participants completed the following patient-reported outcome measures: extent of LBP level, health-related QOL, LBP-related QOL and CSI.
LBP intensity was measured on an 11-point pain intensity numerical rating scale (NRS). NRS is a measurement of pain in which patients evaluate their pain ranging from 0=no pain to 10=worst possible pain.25,26
Health-related QOL was measured using the EuroQol 5-dimension (EQ-5D) that has two parts: EQ-5D self-classifier and EuroQol-visual analogue scales (EQ-VAS). The EQ-5D self-classifier is a standardized, characterized instrument for assessing health-related QOL measures27 that had been translated into Japanese for the present study. The EQ-5D comprises five self-assessment dimensions in which participants provide a description of their health status from the viewpoints of mobility, self-care, daily activities, pain, and depression. Each dimension has three grades (no problems, some problems, and extreme problems). The results were coded and converted to utility scores using a table of values.28 The EQ-VAS is a vertical visual analogue scale that takes values between 100 (best imaginable health) and 0 (worst imaginable health), on which patients provide a global assessment of their health.29,30
The Oswestry Disability Index (ODI), scored from 0 to 100, is the most used questionnaire to assess LBP-related QOL. The ODI, developed by Fairbank et al,31 consists of 10 items that assess the level of pain and physical activities that include sleeping, self-care, sex life, social life, and traveling. The Japanese version of the ODI, the high reliability and validity of which has been reported,32 was used in this study.
The CSI is a self‐report measure for quantifying the extent of individual somatic and emotional complaints associated with CS.15 This inventory is divided into two parts: part A and B. However, only part A was used in this study. Part A is a 25‐item questionnaire used to assess health‐related symptoms common in CS conditions, in which each item can be scored on a 5‐point Likert scale ranging from 0 = “never” to 4 = “always.” The total score ranges from 0 to 100 points. CSI severity was classified into five categories according to the total score points as follows: 1) subclinical (0-–29 points); 2) mild (30–39 points); 3) moderate (40–49 points); 4) severe (50–59 points); and 5) extreme (60–100 points).16 For evaluation of the participants with cLBP, the cut-off CSI value of 28 was used.20 In this study, participants with CSI ≥ 28 were defined as the high CSI group, and those with CSI ˂ 28 as the low CSI group.
Statistical Analysis
Differences in age, body height, body weight, BMI, BMD, ODI (%), EQ-5D, EQ-VAS and CSI between groups were assessed for statistical significance by one-way analysis of variance (ANOVA), followed by the Bonferroni post hoc test or unpaired t-test. Differences in NRS were analyzed by the Kruskal–Wallis test or Mann–Whitney U-test. Differences in the ratio of gender and the cLBP participants were analyzed by chi-square test. Correlation between CSI and each parameter were evaluated using the Spearman rank-order correlation test. Multiple regression analysis was performed to identify factors contributing to the scoring of CSI as a dependent variable with participant parameters and location of pain. A forward stepwise method was used. Standardized regression coefficients (β) and associated P-values were determined to assess statistical significance (P < 0.05).
An exploratory factor analysis (EFA) was performed with the maximum likelihood method using a promax rotation. Factors were considered for Eigenvalues greater than one. The cut-off for loading was set to 0.4. Multiple regression analysis was performed to identify factors contributing to the scoring of CSI as a dependent variable with participant parameters.
Results
Participant Characteristics
Three hundred participants were included; however, 28 participants were excluded because of missing more than one outcome measure. Data of 272 participants were finally analyzed in this study. The characteristics of the total participants with or without LBP are summarized in Table 1. The CSI score of the total participants ranged from 0 to 57 and the average CSI score was 16.1 (± 11.1). As previously reported by Neblett et al,16 the total participants were classified into five subgroup according to the severity of CSI scores. The number and percentage of the participants in each subgroup were as follows: subclinical (CSI score <30), 240 (88.2%); mild (30≤CSI sscore <0), 20 (7.4%); moderate (40≤CSI sscore <0), 10 (3.7%); severe (50≤CSI sscore <0), 2 (0.7%); and extreme (60≤CSI), 0 (Figure 1).
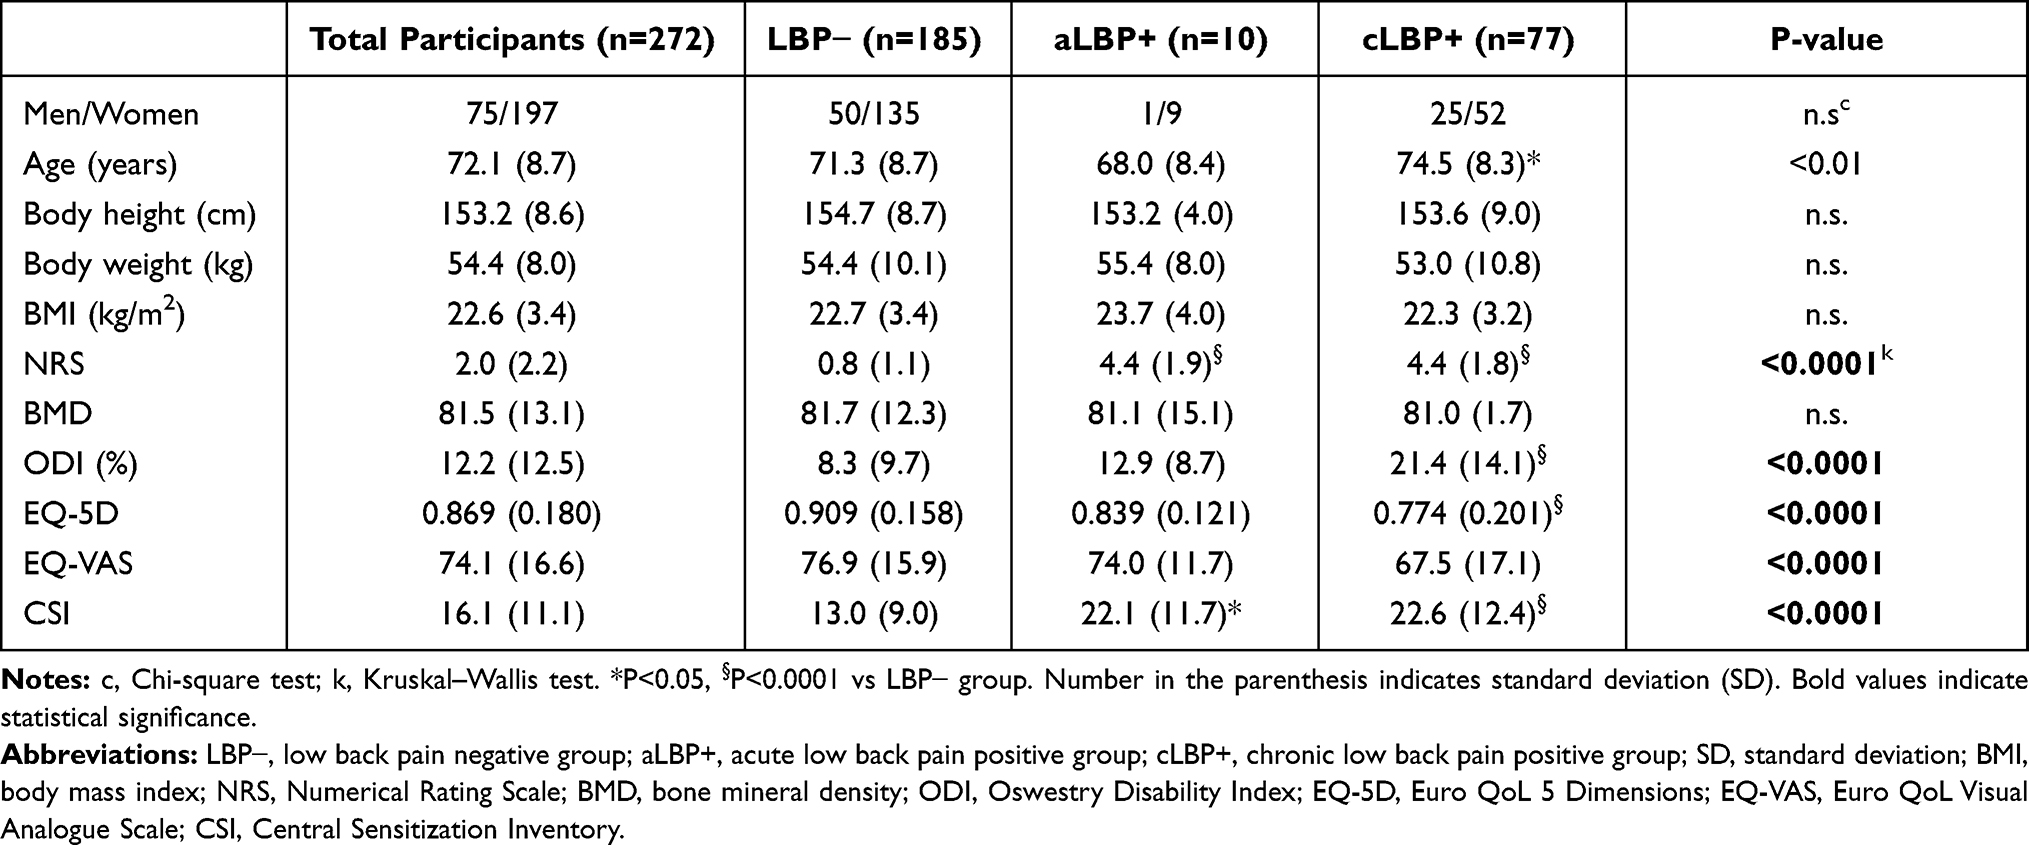 |
Table 1 Characteristics of Participants with or without Low Back Pain |
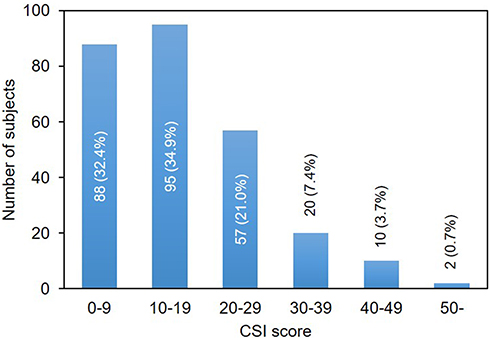 |
Figure 1 Frequency distribution histogram of the Central Sensitivity Index (CSI). |
In this study, 3.3% (10/272) of the participants had aLBP, and 28.3% (77/272) had cLBP. Average NRS and CSI scores in aLBP positive participants were significantly higher than those in the LPB - participants (P <0.0001, P<0.05, respectively) (Table 1). The average age of participants having cLBP (cLBP +) was significantly higher than that in the LBP− participants (P<0.05). Average NRS, ODI and CSI scores were significantly higher in the cLBP + group than those in the LBP− group (P<0.0001, respectively). Average EQ-5D and EQ-VAS in the cLBP + participants were significantly lower than those in the LBP− participants (P<0.0001, respectively). No significant differences among the three groups (LBP−, aLBP+ and cLBP+ groups) were found for gender, body height, body weight, BMI, and BMD.
Central Sensitivity Index (CSI) Analysis in Participants with Chronic Low Back Pain
To evaluate the association between CSI and cLBP, participants with aLBP were excluded. Among 262 participants, 37 participants (14.1%) were included in the high CSI (≥28) group, and 225 participants (85.9%) in the low CSI (˂28) group. The number of cLBP participants and NRS and ODI scores in the high CSI group were significantly higher than those in the low CSI group (all, P<0.0001, respectively) (Table 2). EQ-5D and EQ-VAS were significantly lower in the high CSI group than in the low CSI group (P<0.0001, respectively) (Table 2).
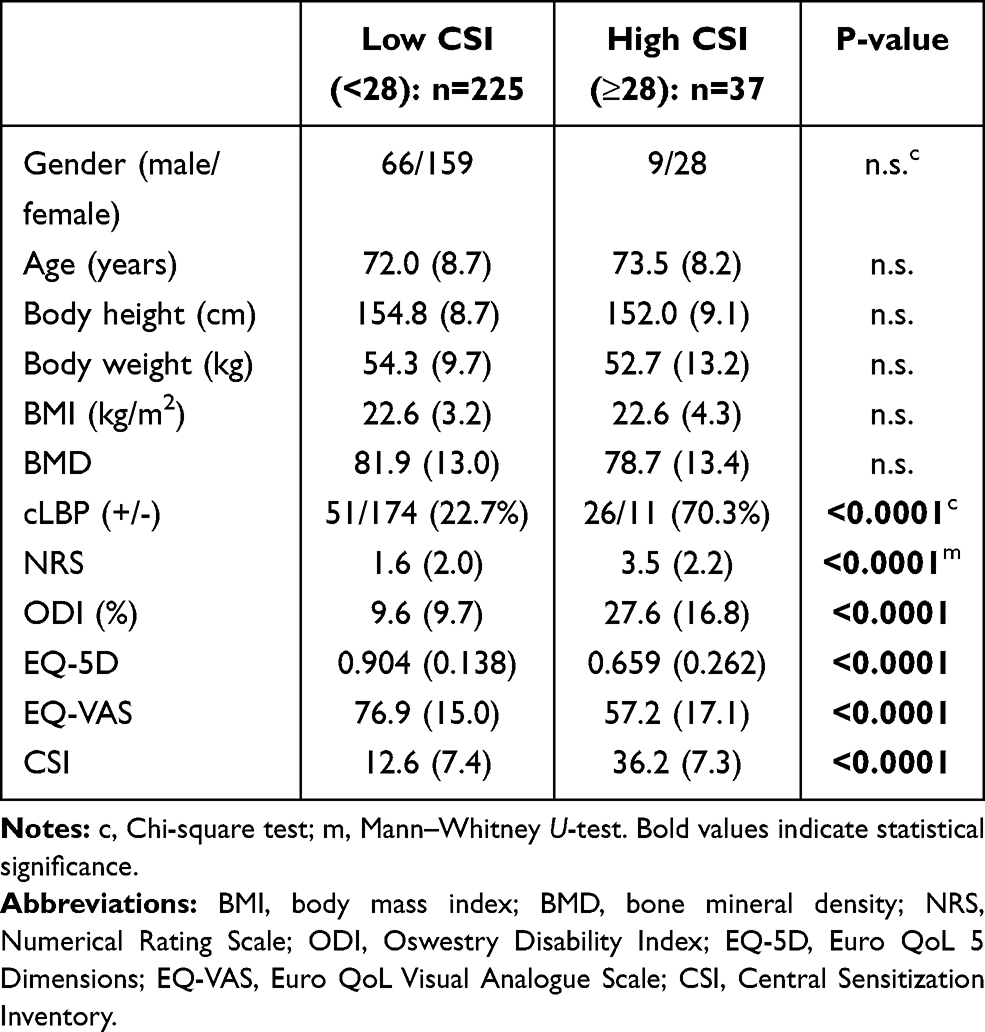 |
Table 2 Comparison Between Low CSI (<28) and High CSI (≥28) Groups |
Correlation Between Central Sensitivity Index (CSI) and Participant Characteristics
There was no significant correlation between CSI and age, body height, body weight, and BMD (Figure 2A–E). CSI was significantly but weakly correlated with NRS (r=0.34, P<0.0001) (Figure 2F). There was a significant correlation between CSI and ODI (r=0.60, P<0.0001), EQ-5D (r=−0.49, P<0.0001), and EQ-VAS (r=−0.52, P<0.0001) (Figure 2G–I).
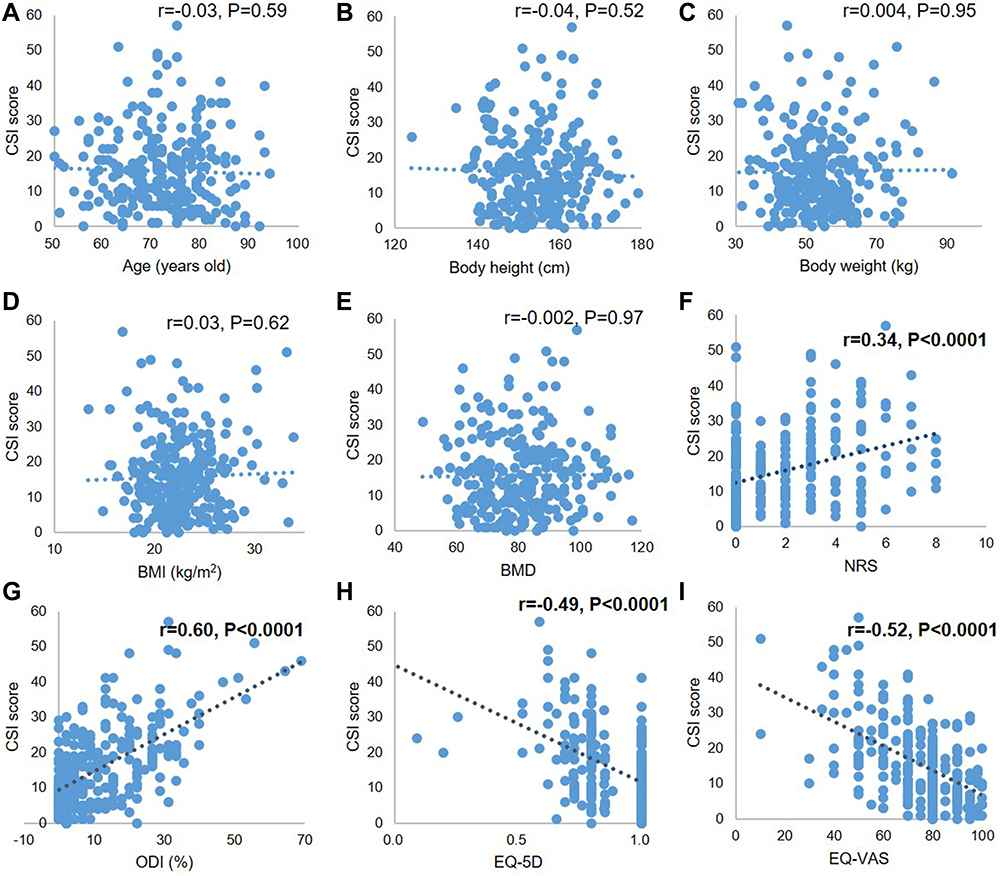 |
Figure 2 Correlation between Central Sensitivity Index (CSI) and participant characteristics. (A) age, (B) body height, (C) body weight, (D) body mass index (BMI), (E) bone mineral density (BMD), (F) numerical rating scale (NRS), (G) Oswestry Disability Index (ODI) (%), (H) Euro QoL 5 Dimensions (EQ-5D), (I) Euro QoL Visual Analogue Scale (EQ-VAS). |
Multiple regression analysis identified that ODI (%) (β = 0.44, P<0.0001), EQ-VAS (β = −0.17, P<0.0001) and age (β = −0.20, P<0.01) were significantly associated factors with CSI (Table 3).
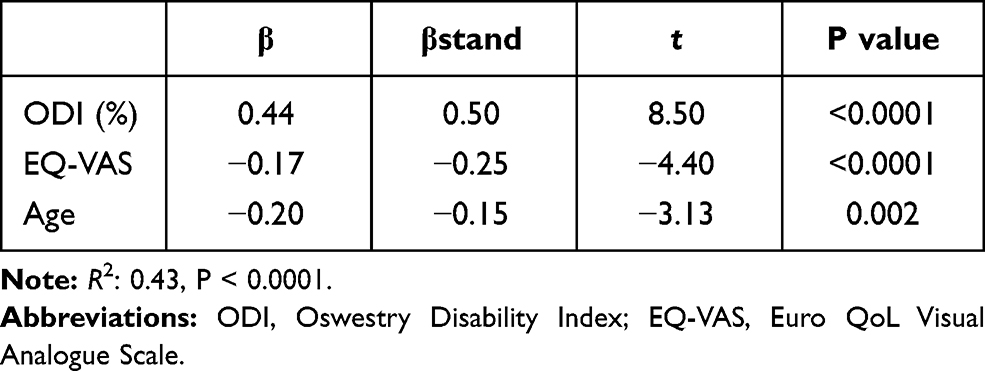 |
Table 3 Association of Central Sensitization Inventory (CSI) with Participant Characteristics |
Exploratory Factor Analysis of the Central Sensitivity Index (CSI)
The factor analysis statistically grouped 25 items into six factors (Table 4). Factor 1 includes four items that associated with “physiological stress.” Factor 2 contained six items that were associated with “physical symptoms.” Factor 3 contained four items that were associated with “headache/jaw symptoms.” Factor 4 contains only one item that was associated with “sleep.” Factor 5 contains two items that are associated with “urological symptom”. Factor 6 contains one item that was associated with “depression”. All correlation coefficients between factors showed positive correlations (Table 5).
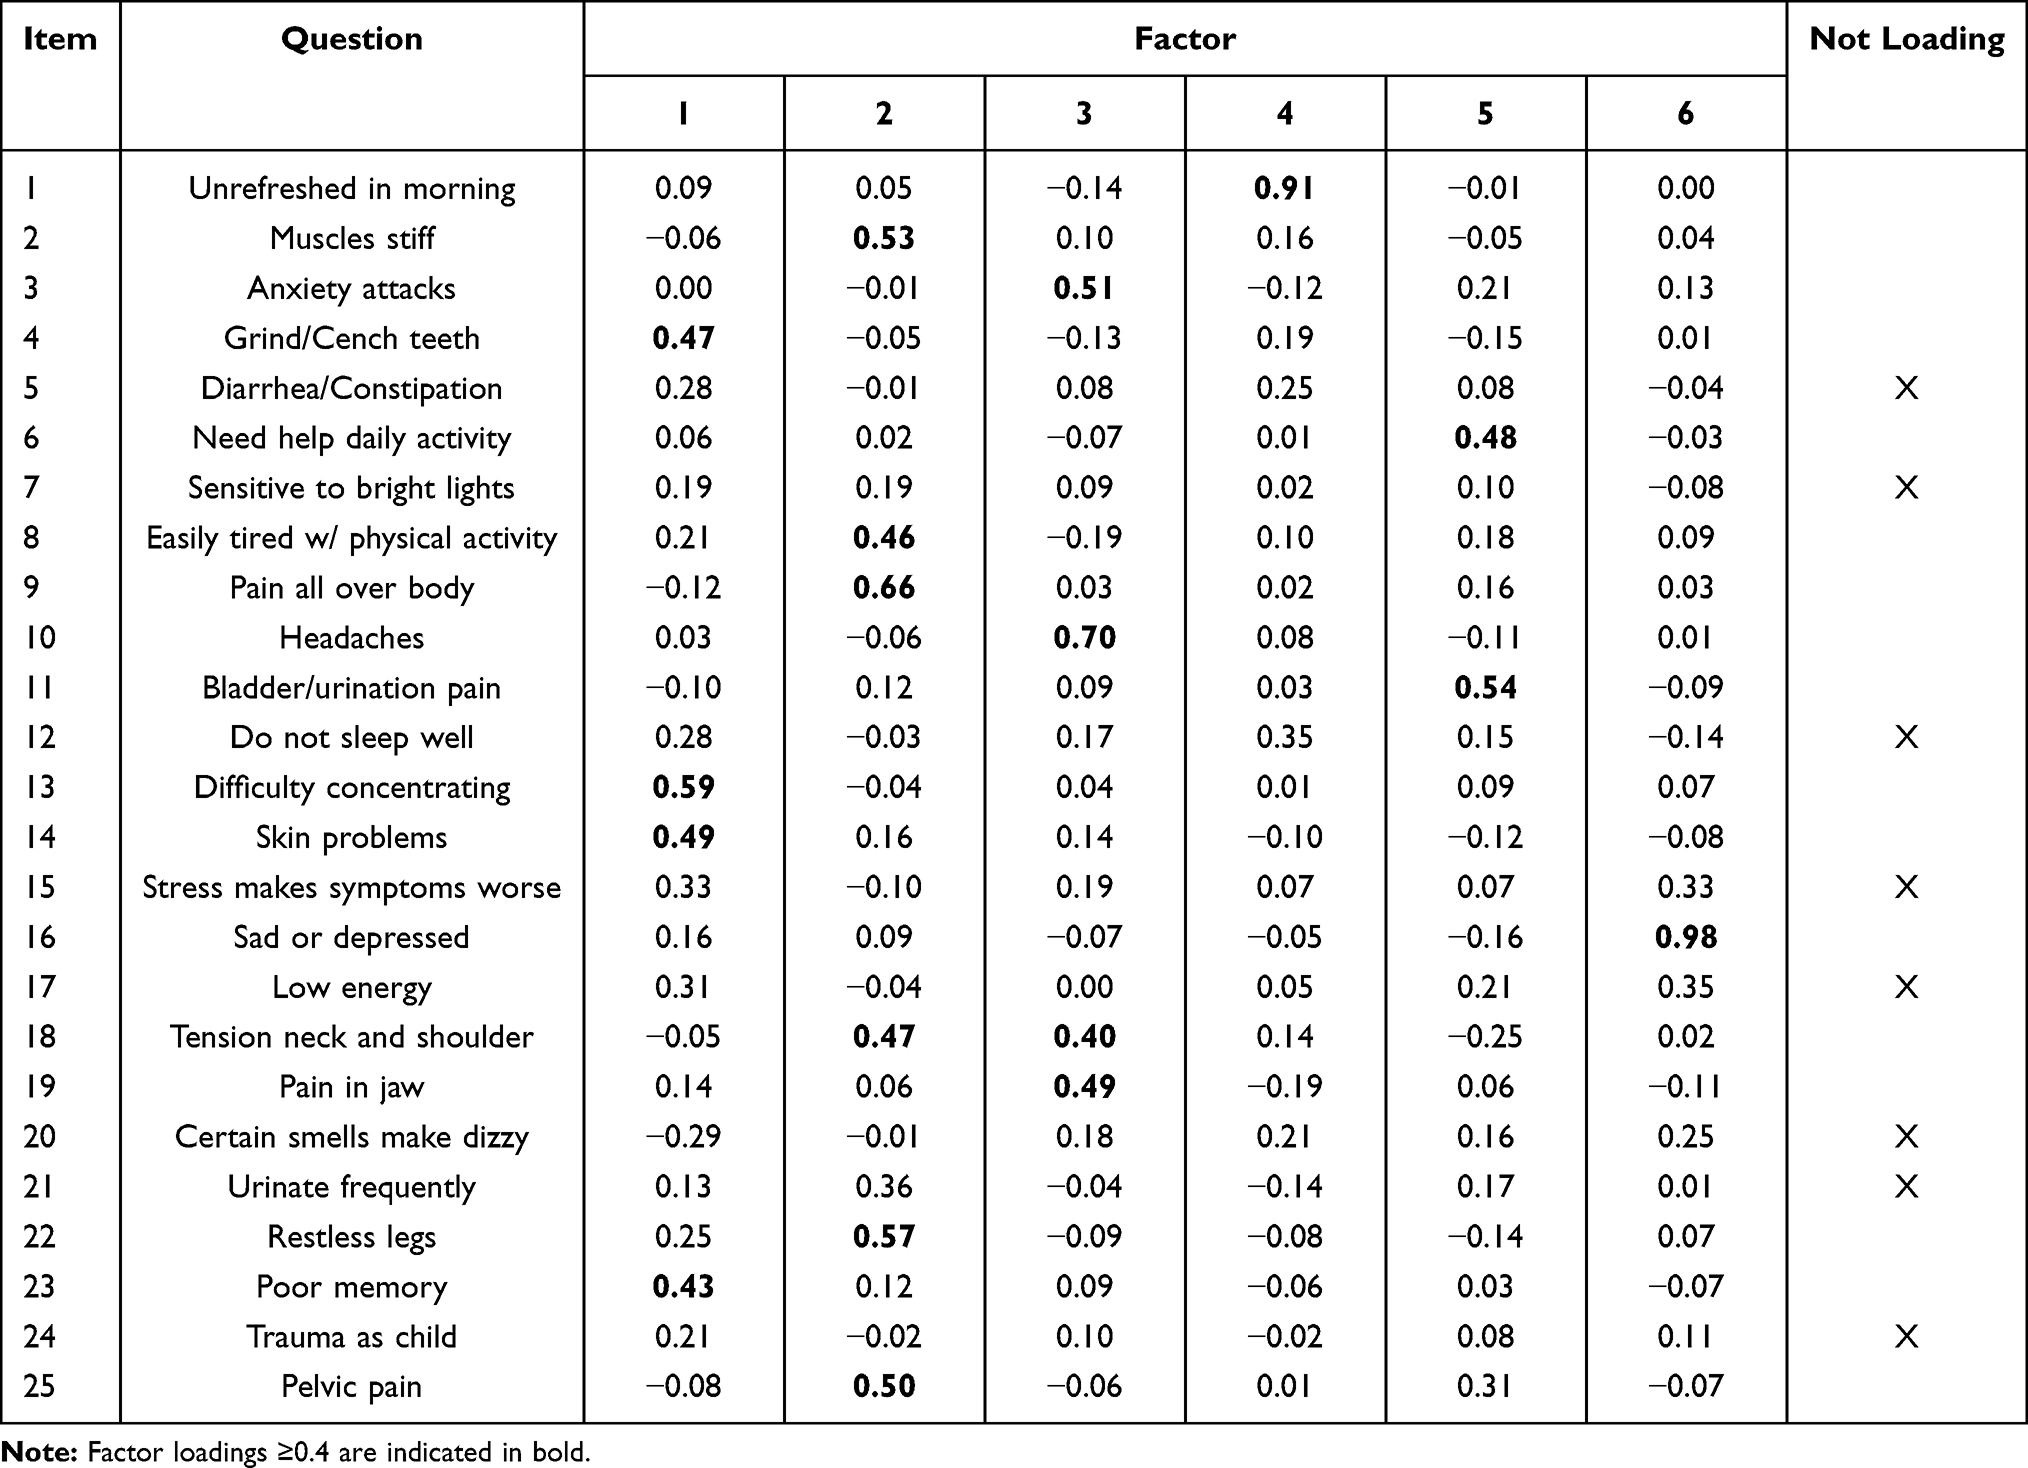 |
Table 4 Factor Loading of the Exploratory Factor Analysis with Promax Rotation |
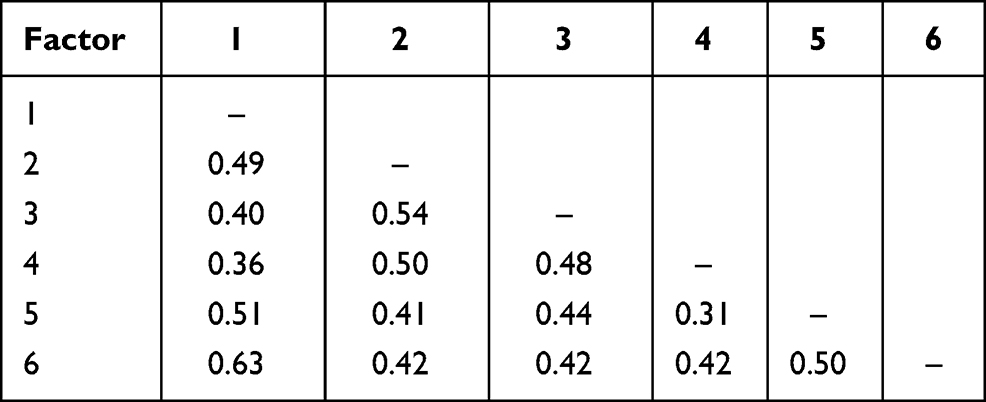 |
Table 5 Promax Factor Correlations |
Central Sensitivity Index (CSI) Scores in Participants with Pain in Neck and Extremities
The number of participants who had pain involving neck and extremities are summarized in Table 6. The number of participants with knee pain (27.5% of total participants) was highest, followed by upper extremity (19.1%), foot (7.3%), neck (6.5%), ankle (6.1%) and hip (5.3%). Comorbidity with cLBP was highest in participants with knee pain (9.5% of total), followed by upper extremity (4.2%), hip (2.7%), ankle (1.9%), foot (1.9%) and neck pain (1.1%).
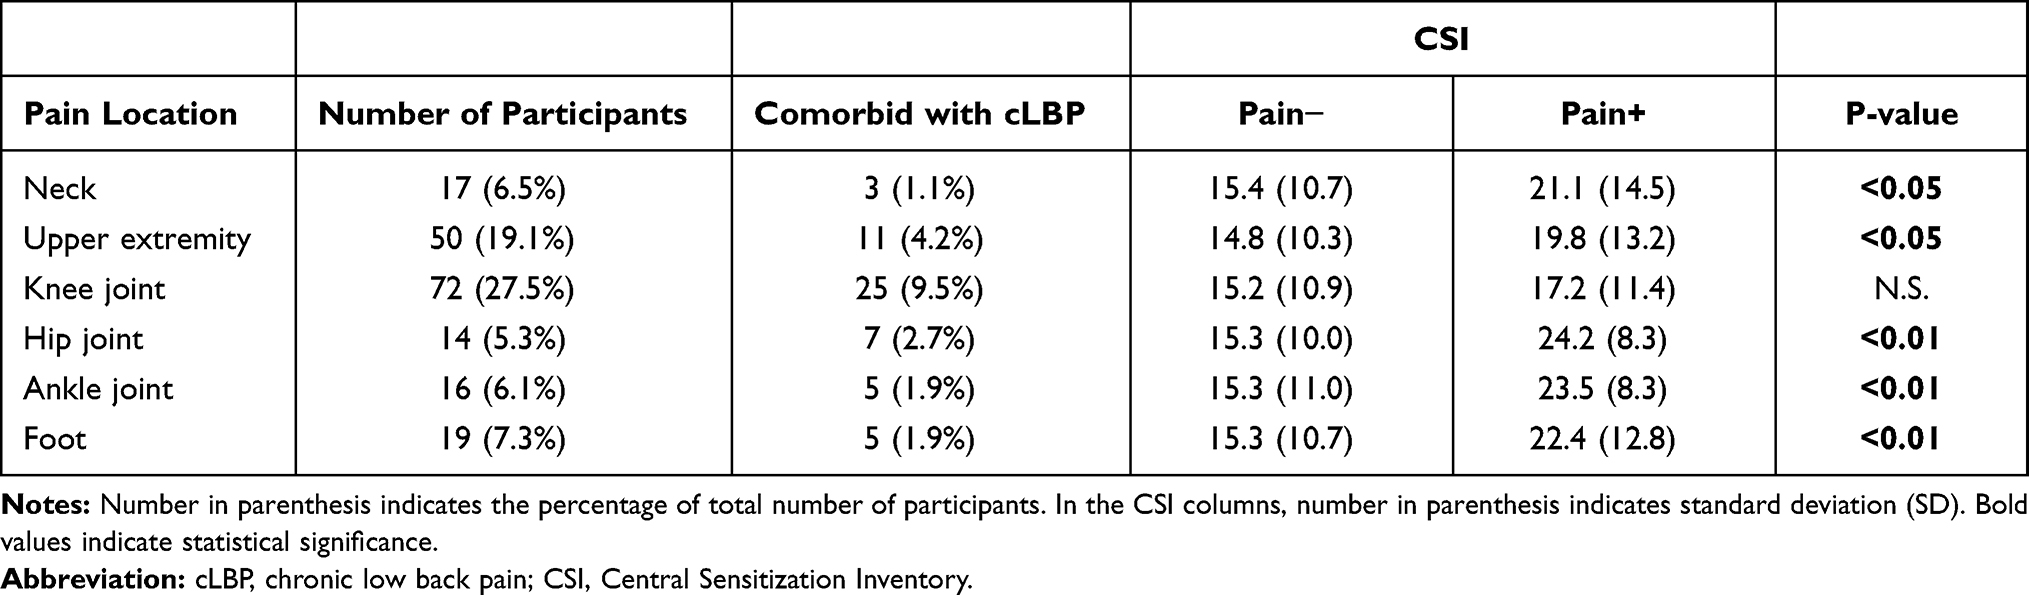 |
Table 6 Participants with Pain in Neck and Extremities |
There were no significant differences in CSI scores between participants with and without knee pain (P = 0.2). The CSI score was significantly higher in participants with pain in the neck (P<0.05), upper extremity (P<0.05), hip (P<0.01), ankle (P<0.01) and foot (P<0.01) compared to those without pain in the respective location (Table 6). A multiple regression analysis was next performed to identify the location of pain that associated with the CSI with the pain location, including cLBP as independent variable. The result of multiple regression analysis showed that the presence of cLBP (β=8.83, P<0.0001), hip (β=5.83, P<0.05), ankle (β=5.58, P<0.05) and upper extremity (β=3.78, P<0.05) was significantly associated with CSI (Table 7).
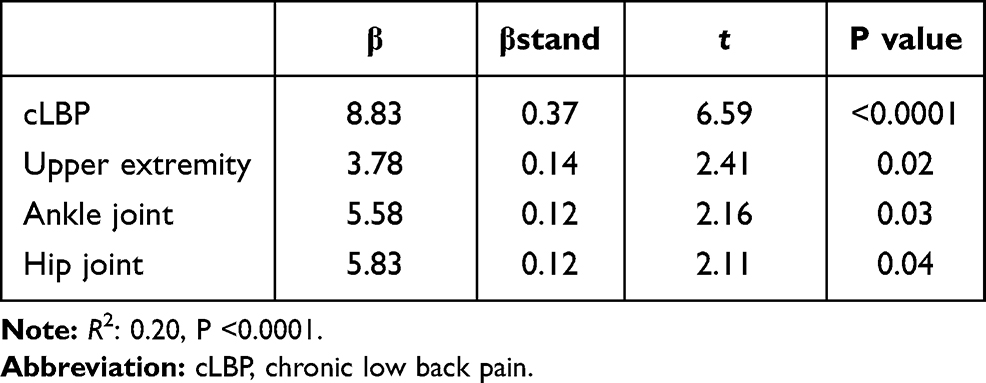 |
Table 7 Association of Central Sensitization Inventory (CSI) with the Participant’s Pain Location |
Discussion
The results of our population-based cohort study of a Japanese mountain village showed that the average CSI score of total participants was 16.1. The number of participants whose CSI score ≥40 was 12 (4.4%). According to the 40-point cutoff score proposed by Neblett et al,16 the prevalence of participants with CS-related symptoms was very low in this population-based cohort. Ide et al33 also recently reported a population-based cohort study that investigated the CS using CSI scores of 373 elderly residents of a Japanese mountain village. In their report, the mean CSI of the total participants was 14.2, and 1.6% of the participants (n=6) had a high CSI score (≥40). The average CSI score of Ide’s study was comparable with that of our cohort study. Several previously published studies of multi-country participants have reported the average CSI score of healthy controls (see review in Cuesta-Vargas et al17). Mayer’s study reported that the average CSI score of 40 university students was 28.9.15 Kregel et al reported the CSI score of 49 pain-free Dutch controls was 21.6.34 Knezevic et al reported that the CSI score data in control samples of Serbian medical rehabilitation students with no reported pain was 20.9.35 We recognize that the average CSI score of participants in our population cohort of a Japanese mountain village is lower when compared to these previously reported CSI scores of healthy controls. In our population-based cohort of a Japanese mountain village, the participants (aged more than fifty) live in mountainous regions, and many engage in forestry and/or agriculture. The living environment of mountainous regions might influence to inhabitant’s physical and/or physiological factors, and thereby contribute to relatively lower CSI scores.
The results of this study showed that the prevalence of cLBP in the total participants in this population-based cohort was 28.3%; this was similar to that previously reported in an aged population (see reviews in36,37). The average CSI score (22.6) for participants with cLBP was significantly higher than that of participants with no LBP or the total participants. Mibu et al recently cross-sectionally evaluated the CSI score of 104 patients in orthopedic clinics.20 Among these patients, the average CSI score of 50 patients with cLBP was reported to be 25.5. More recently, Miki et al investigated the association between CS and psychological factors in LBP patients undergoing spinal surgeries.6 They showed that the average CSI score of these patients before surgery was 24.4. According to these previously reported data, the CSI scores of cLBP participants in our population was comparable with those of LBP patients with musculoskeletal disorders seeking care from orthopedic specialists or clinics.
Neblett et al first suggested a 40-point CSI score as a cut-off value to identify CS among outpatient chronic pain samples;16 however, a recent study suggested that the cut-off value to identify CS in cLBP patients in orthopedic clinics should be 28.20 Therefore, in this study, participants with CSI ≥28 was defined as the high CSI group and those with CSI <28 as the low CSI group. Our results showed that the prevalence of cLBP, NRS, and ODI was significantly higher in the high CSI group than in the low CSI group. In addition, QOL scores, such as EQ-5D and EQ-VAS, were significantly lower in the high CSI group. These results suggest that CS is associated with the extent of pain and QOL in the participants with cLBP.
Our study showed that the intensity of LBP, as assessed by NRS, was significantly, but weakly, correlated with CSI. A weak correlation with intensity of pain itself had also been reported by previous studies in patients with musculoskeletal diseases;6,20 this suggests that CS would be associated not only with pain itself but with multiple factors. On the other hand, our study showed that CSI was significantly correlated with health-related QOL scores, including EQ-5D and ODI. The correlation coefficient (CC) of CSI with EQ-5D in our population cohort study (−0.49) was similar to those in previous studies in orthopedic clinic patients (CC: −0.4418, −0.4720). The correlation coefficient between CSI and ODI in our study (CC: 0.60) was higher than that of a clinometric study targeted at chronic pain patients (CC: 0.36).38 The authors recognize that CSI in our population is strongly associated with health-related QOL, especially LBP-related QOL.
In our study, 25 items of the CSI were categorized into a 6-factor model by exploratory factor analysis (EFA). Although this categorization differed from either the previous English version15 or the Japanese version,18 only factor 2 (physical symptoms) shares common items of the previous two studies (item 9: pain all over body and item 22: restless legs). The authors speculated that the differences in participants between studies (local residents in this study and chronic pain patients in the previous studies) would result in different categorizations by the EFA. Therefore, this 6-factor model should be recognized as the categorization for local resident participants.
Because CS is involved in not only LBP but also systemic pain, the involvement of pain in the neck and extremities was also evaluated. Multiple regression analysis revealed that CSI was significantly associated with the presence of cLBP, upper extremity pain, ankle pain and hip pain. Interestingly, cLBP was the factor that predominantly contributed to the CSI score in this population-based study. Ide et al33 recently evaluated the CSI score of participants with pain in the neck and extremities in elderly adults of a Japanese population; they reported that participants with neck pain had the highest CSI score (22.4), followed by upper limb (18.9) and lower limb (18.1). These CSI scores were similar to those in our study. Mibu et al20 also reported that the CSI score was significantly higher in cLBP patients than in knee OA patients of an orthopedic clinic. More recently, Roldán-Jiménez et al39 evaluated CS symptoms of 395 chronic musculoskeletal disorders (CMPDs) patients, and reported that 37.8% of LBP patients had clinically relevant CSI scores (<40), whereas this was found in 8.1% of knee pain patients and 2.1% of shoulder pain patients. The results of our study and these previously reported studies suggest that pain in the lumbar region would most strongly associate with CS rather than that of other regions. There is growing evidence that psychosocial factors are associated with the treatment outcome and prolongation of LBP symptoms.40,41 A recent study showed that the CSI score was significantly associated with psychosocial factors, including fear, catastrophic thought, anxiety, and depression of patients with presurgical LBP.6 Although psychosocial factors were not evaluated in this study, these factors would be important for evaluating the LBP that associated with CS.
There were some limitations to this study. First, Odai-cho is a mountain village, and many inhabitants are typically engaged in forestry. Therefore, there would be differences in occupation ratio compared with that of general Japanese population. Secondly, participants who could attend the medical examination would be relatively healthy population without serious illness and/or severe physical disability.
Conclusion
We have assessed the severity of CS by CSI score, and evaluated whether CS is involved in the pathological condition of cLBP of the local residents of a Japanese mountain village. Although the prevalence of the participants presenting CS-related symptoms was low, the CSI score was significantly associated with the extent of LBP and back pain-related QOL scores. In addition, the authors recognize that CS symptoms appear to commonly contribute to the lived experience of cLBP in the population studied. The CSI scores and analysis data of a general population with or without LBP identified in this study would be of importance for comparison in future epidemiological and/or clinical research on LBP.
Data Sharing Statement
The datasets used and analyzed during the current study are available from the corresponding author at a reasonable request.
Ethics Approval and Informed Consent
Ethical approval for the study was granted by the Committee for the Ethics of Human Research of Mie University (IRB reference number: U2018-022). All participants provided written informed consent before enrollment in the study.
Author Contributions
KA performed statistical analysis and drafted the manuscript, conceived of this study, and made substantial contributions to study design. KA was responsible for data collection. NT, JY, TF, AN performed data acquisition and revised the manuscript. AS contributed to the study design and coordination and revised the manuscript. All authors contributed to data analysis, drafting or revising the article, have agreed on the journal to which the article will be submitted, gave final approval of the version to be published, and agree to be accountable for all aspects of the work.
Funding
This study was partially supported by JSPS KAKENHI Grant no. JP18K09063.
Disclosure
The authors declare that they have no conflicts of interest.
References
1. Hartvigsen J, Hancock MJ, Kongsted A, et al. What low back pain is and why we need to pay attention. Lancet. 2018;391(10137):2356–2367. doi:10.1016/S0140-6736(18)30480-X
2. DALYs GBD, Collaborators H. Global, regional, and national disability-adjusted life-years (DALYs) for 315 diseases and injuries and healthy life expectancy (HALE), 1990–2015: a systematic analysis for the Global Burden of Disease Study 2015. Lancet. 2016;388(10053):1603–1658.
3. Foster NE, Anema JR, Cherkin D, et al. Prevention and treatment of low back pain: evidence, challenges, and promising directions. Lancet. 2018;391(10137):2368–2383. doi:10.1016/S0140-6736(18)30489-6
4. Woolf CJ. Central sensitization: implications for the diagnosis and treatment of pain. Pain. 2011;152(3 Suppl):S2–15. doi:10.1016/j.pain.2010.09.030
5. Nielsen LA, Henriksson KG. Pathophysiological mechanisms in chronic musculoskeletal pain (fibromyalgia): the role of central and peripheral sensitization and pain disinhibition. Best Pract Res Clin Rheumatol. 2007;21(3):465–480. doi:10.1016/j.berh.2007.03.007
6. Miki T, Nishigami T, Takebayashi T, et al. Association between central sensitivity syndrome and psychological factors in people with presurgical low back pain: a cross-sectional study. J Orthop Sci. 2020. doi:10.1016/j.jos.2020.03.017
7. Roussel NA, Nijs J, Meeus M, et al. Central sensitization and altered central pain processing in chronic low back pain: fact or myth? Clin J Pain. 2013;29(7):625–638. doi:10.1097/AJP.0b013e31826f9a71
8. Sanzarello I, Merlini L, Rosa MA, et al. Central sensitization in chronic low back pain: a narrative review. J Back Musculoskelet Rehabil. 2016;29(4):625–633. doi:10.3233/BMR-160685
9. Gervais-Hupe J, Pollice J, Sadi J, et al. Validity of the central sensitization inventory with measures of sensitization in people with knee osteoarthritis. Clin Rheumatol. 2018;37(11):3125–3132. doi:10.1007/s10067-018-4279-8
10. Hochman JR, Davis AM, Elkayam J, et al. Neuropathic pain symptoms on the modified painDETECT correlate with signs of central sensitization in knee osteoarthritis. Osteoarthritis Cartilage. 2013;21(9):1236–1242. doi:10.1016/j.joca.2013.06.023
11. Lopez-Ruiz M, Losilla JM, Monfort J, et al. Central sensitization in knee osteoarthritis and fibromyalgia: beyond depression and anxiety. PLoS One. 2019;14(12):e0225836. doi:10.1371/journal.pone.0225836
12. Cao Y, Fan D, Yin Y. Pain mechanism in rheumatoid arthritis: from cytokines to central sensitization. Mediators Inflamm. 2020;2020:2076328. doi:10.1155/2020/2076328
13. Matre D, Knardahl S. ‘Central sensitization’ in chronic neck/shoulder pain. Scand J Pain. 2012;3(4):230–235. doi:10.1016/j.sjpain.2012.04.003
14. Jespersen A, Amris K, Graven-Nielsen T, et al. Assessment of pressure-pain thresholds and central sensitization of pain in lateral epicondylalgia. Pain Med. 2013;14(2):297–304. doi:10.1111/pme.12021
15. Mayer TG, Neblett R, Cohen H, et al. The development and psychometric validation of the central sensitization inventory. Pain Pract. 2012;12(4):276–285. doi:10.1111/j.1533-2500.2011.00493.x
16. Neblett R, Cohen H, Choi Y, et al. The Central Sensitization Inventory (CSI): establishing clinically significant values for identifying central sensitivity syndromes in an outpatient chronic pain sample. J Pain. 2013;14(5):438–445. doi:10.1016/j.jpain.2012.11.012
17. Cuesta-Vargas AI, Neblett R, Chiarotto A, et al. Dimensionality and reliability of the central sensitization inventory in a pooled multicountry sample. J Pain. 2018;19(3):317–329. doi:10.1016/j.jpain.2017.11.006
18. Tanaka K, Nishigami T, Mibu A, et al. Validation of the Japanese version of the central sensitization inventory in patients with musculoskeletal disorders. PLoS One. 2017;12(12):e0188719. doi:10.1371/journal.pone.0188719
19. Scerbo T, Colasurdo J, Dunn S, et al. Measurement properties of the central sensitization inventory: a systematic review. Pain Pract. 2018;18(4):544–554. doi:10.1111/papr.12636
20. Mibu A, Nishigami T, Tanaka K, et al. Difference in the impact of central sensitization on pain-related symptoms between patients with chronic low back pain and knee osteoarthritis. J Pain Res. 2019;12:1757–1765. doi:10.2147/JPR.S200723
21. Nishimura A, Hasegawa M, Kato K, et al. Risk factors for the incidence and progression of radiographic osteoarthritis of the knee among Japanese. Int Orthop. 2011;35(6):839–843. doi:10.1007/s00264-010-1073-x
22. Nishimura A, Akeda K, Kato K, et al. Osteoporosis, vertebral fractures and mortality in a Japanese rural community. Mod Rheumatol. 2014;24(5):840–843. doi:10.3109/14397595.2013.866921
23. Ikeda Y, Sudo A, Yamada T, et al. Mortality after vertebral fractures in a Japanese population. J Orthop Surg. 2010;18(2):148–152. doi:10.1177/230949901001800204
24. Akeda K, Yamada T, Inoue N, et al. Risk factors for lumbar intervertebral disc height narrowing: a population-based longitudinal study in the elderly. BMC Musculoskelet Disord. 2015;16(1):344. doi:10.1186/s12891-015-0798-5
25. Childs JD, Piva SR, Fritz JM. Responsiveness of the numeric pain rating scale in patients with low back pain. Spine. 2005;30(11):1331–1334. doi:10.1097/01.brs.0000164099.92112.29
26. Farrar JT, Young JP
27. EuroQol G. EuroQol--a new facility for the measurement of health-related quality of life. Health Policy. 1990;16(3):199–208.
28. Tsuchiya A, Ikeda S, Ikegami N, et al. Estimating an EQ-5D population value set: the case of Japan. Health Econ. 2002;11(4):341–353. doi:10.1002/hec.673
29. Feng Y, Parkin D, Devlin NJ. Assessing the performance of the EQ-VAS in the NHS PROMs programme. Qual Life Res. 2014;23(3):977–989. doi:10.1007/s11136-013-0537-z
30. Whynes DK, Group T. Correspondence between EQ-5D health state classifications and EQ VAS scores. Health Qual Life Outcomes. 2008;6(1):94. doi:10.1186/1477-7525-6-94
31. Fairbank JC, Couper J, Davies JB, et al. The Oswestry low back pain disability questionnaire. Physiotherapy. 1980;66(8):271–273.
32. Fujiwara A, Kobayashi N, Saiki K, et al. Association of the Japanese Orthopaedic Association score with the Oswestry Disability Index, Roland-Morris Disability Questionnaire, and short-form 36. Spine. 2003;28(14):1601–1607. doi:10.1097/01.BRS.0000077510.95462.39
33. Ide K, Yasuda T, Hasegawa T, et al. Evaluation of the Central Sensitization Inventory Score in elderly adults with musculoskeletal examination. Mod Rheumatol. 2020:1–5. doi:10.1080/14397595.2020.1822983.
34. Kregel J, Vuijk PJ, Descheemaeker F, et al. The Dutch Central Sensitization Inventory (CSI): factor analysis, discriminative power, and test-retest reliability. Clin J Pain. 2016;32(7):624–630. doi:10.1097/AJP.0000000000000306
35. Knezevic A, Neblett R, Jeremic-Knezevic M, et al. Cross-cultural adaptation and psychometric validation of the Serbian version of the central sensitization inventory. Pain Pract. 2018;18(4):463–472. doi:10.1111/papr.12618
36. Hoy D, Bain C, Williams G, et al. A systematic review of the global prevalence of low back pain. Arthritis Rheum. 2012;64(6):2028–2037. doi:10.1002/art.34347
37. Meucci RD, Fassa AG, Faria NM. Prevalence of chronic low back pain: systematic review. Rev Saude Publica. 2015;49:49. doi:10.1590/S0034-8910.2015049005874
38. Chiarotto A, Viti C, Sulli A, et al. Cross-cultural adaptation and validity of the Italian version of the Central Sensitization Inventory. Musculoskelet Sci Pract. 2018;37:20–28. doi:10.1016/j.msksp.2018.06.005
39. Roldan-Jimenez C, Perez-Cruzado D, Neblet R, et al. Central sensitization in chronic musculoskeletal pain disorders in different populations: a Cross-Sectional Study. Pain Med. 2020;21(11):2958–2963. doi:10.1093/pm/pnaa069
40. Meyer T, Cooper J, Raspe H. Disabling low back pain and depressive symptoms in the community-dwelling elderly: a prospective study. Spine. 2007;32(21):2380–2386. doi:10.1097/BRS.0b013e3181557955
41. Ramond A, Bouton C, Richard I, et al. Psychosocial risk factors for chronic low back pain in primary care--a systematic review. Fam Pract. 2011;28(1):12–21. doi:10.1093/fampra/cmq072
 © 2021 The Author(s). This work is published and licensed by Dove Medical Press Limited. The
full terms of this license are available at https://www.dovepress.com/terms
and incorporate the Creative Commons Attribution
- Non Commercial (unported, 3.0) License.
By accessing the work you hereby accept the Terms. Non-commercial uses of the work are permitted
without any further permission from Dove Medical Press Limited, provided the work is properly
attributed. For permission for commercial use of this work, please see paragraphs 4.2 and 5 of our Terms.
© 2021 The Author(s). This work is published and licensed by Dove Medical Press Limited. The
full terms of this license are available at https://www.dovepress.com/terms
and incorporate the Creative Commons Attribution
- Non Commercial (unported, 3.0) License.
By accessing the work you hereby accept the Terms. Non-commercial uses of the work are permitted
without any further permission from Dove Medical Press Limited, provided the work is properly
attributed. For permission for commercial use of this work, please see paragraphs 4.2 and 5 of our Terms.