Back to Journals » International Journal of General Medicine » Volume 15
CENPO is Associated with Immune Cell Infiltration and is a Potential Diagnostic and Prognostic Marker for Hepatocellular Carcinoma
Authors He K ![]() , Xie M, Li J, He Y
, Xie M, Li J, He Y ![]() , Yin Y
, Yin Y
Received 3 August 2022
Accepted for publication 13 September 2022
Published 25 September 2022 Volume 2022:15 Pages 7493—7510
DOI https://doi.org/10.2147/IJGM.S382234
Checked for plagiarism Yes
Review by Single anonymous peer review
Peer reviewer comments 2
Editor who approved publication: Dr Scott Fraser
Kun He,1 Mengyi Xie,1 Jingdong Li,1 Yi He,2 Yaolin Yin2
1Institute of Hepato-Biliary-Pancreatic-Intestinal disease, North Sichuan Medical College, Nanchong, People’s Republic of China; 2Department of Hepatobiliary Surgery, Affiliated Hospital of North Sichuan Medical College, Nanchong, People’s Republic of China
Correspondence: Jingdong Li, Institute of Hepato-Biliary-Pancreatic-Intestinal disease, North Sichuan Medical College, 234 Fujiang Road, Shunqing District, Nanchong, 637000, People’s Republic of China, Tel +86 18215521587, Fax +86 817-2222856, Email [email protected]
Purpose: To examine the expression, clinical significance, and potential regulatory mechanism of centromere protein O (CENPO) in hepatocellular carcinoma (HCC).
Methods: CENPO expression in pan-cancer was studied using the TCGA-GTEx database, in HCC and normal liver tissues using the GEO and TCGA databases, and in clinical HCC samples by RT-qPCR. The diagnostic value of CENPO was assessed using receiver operating characteristic curves. Univariate and multivariate regression analyses of factors associated with HCC prognosis were performed. CENPO function and its mechanism in HCC were explored using GO, KEGG, and GSEA analyses of differentially expressed genes (DEGs). Association of CENPO expression with immune cell infiltration and immune checkpoint-associated molecules was conducted using TCGA data and the TIMER2.0 database. Relationships between CENPO expression and DNA methylation were analyzed using the UALCAN and cBioPortal databases. CENPO expression in HCC cell lines was detected using RT-qPCR.
Results: CENPO is upregulated in most cancers, including HCC and cell lines, and is a potential biomarker for HCC diagnosis (AUC = 0.936, 95% CI: 0.911– 0.960). Higher CENPO expression was associated with poorer outcomes in patients with HCC (OS, p = 0.004; DSS, p = 0.002; PFI, p < 0.001), and CENPO was an independent predictor of factors influencing overall survival in HCC. DEGs between samples with high and low CENPO levels were enriched in various biological processes, including activation of the G2M checkpoint and other signaling pathways, while CENPO expression correlated with HCC immune cell infiltration and immune checkpoint-associated molecules, as well as CENPO promoter methylation (p < 0.001).
Conclusion: In HCC and cell lines, CENPO is overexpressed, a potential diagnostic marker and an indicator of poor prognosis. CENPO may regulate HCC development by influencing nuclear division and tumor immune infiltration and is regulated by methylation, making it a potential target for HCC immunotherapy.
Keywords: HCC, diagnosis, prognosis, biomarker, immune checkpoints, methylation
Introduction
Hepatocellular carcinoma (HCC) is the most frequent type of liver cancer, accounting for approximately 75–85% of all liver carcinomas, and is associated with poor patient prognosis. In 2020, there were approximately 900,000 new cases of HCC and 830,000 deaths from the disease.1 HCC is treated using various methods, including surgery, radiotherapy, interventional therapy, targeted therapy, and traditional Chinese medicine, with surgical resection being the most effective therapy option for patients with HCC.2 Patients are frequently diagnosed when they have advanced illness, because clinical symptoms of HCC are non-specific and screening procedures are largely ineffective, and patients often experience disease recurrence or subsequent metastases following surgery.3 Consequently, the short-and long-term outlook for patients diagnosed with liver cancer is dismal. Identification of biomarkers that can be used for early diagnosis of liver cancer and to predict its prognosis is therefore of considerable importance.
Centromere protein O (CENPO) belongs to the centromere protein (CENP) family. The CENPO gene is located on human chromosome 2p23.3, contains eight exons, and encodes a 34-kDa CENPO protein, also known as interphase centromere complex protein 36, which consists of 300 amino acids. CENPO is essential for spindle formation, chromosome segregation, and cell cycle checkpoint signaling during mitosis, while its increased expression is associated with poor prognosis in rectal cancer,4 gastric cancer,5 bladder cancer,6 and chronic granulocytic leukemia.7 Recent studies have also shown an association between CENPO and breast cancer chemoresistance.8 Nevertheless, the activity and mechanism underlying the role of CENPO in HCC remain unknown. In this study, we investigated the role of CENPO in HCC using bioinformatics and molecular biology approaches.
Transcriptome information was retrieved from The Cancer Genome Atlas (TCGA), the Gene Expression Omnibus (GEO), and the Genotype-Tissue Expression (GTEx) databases, with the aim of investigating the differential expression of CENPO in liver cancer and normal liver tissues. Next, we analyzed associations between CENPO expression and the clinicopathological characteristics of HCC. Further, we assessed the value of CENPO as a prognostic factor in HCC and we used gene enrichment analysis to assess the potential functions of CENPO in HCC. CENPO expression and immune cell infiltration were also examined to determine their potential contribution to promotion of HCC. Finally, we investigated the relationship between CENPO expression and methylation, with the aim of determining the mechanisms underlying CENPO upregulation in HCC.
Materials and Methods
Collection and Analysis of RNA-Seq Data
CENPO mRNA expression data in pan-cancer was downloaded using the UCSC XENA browser.9 Using data from TCGA database, the expression of CENPO in 374 HCC tissues and 50 normal liver tissues was investigated.10 RNA-seq data in FPKM format were translated to TPM format, and then log2 transformed for analysis. The GSE4184 dataset (platform: GPL570), including 20 cases of HCC and 20 para-cancer tissue expression profiles,11 was downloaded from the GEO database and used to analyze CENPO expression levels.
Tissue Specimens
The study was conducted in accordance with the principles of the Declaration of Helsinki, and the protocol was approved by the North Sichuan Medical College Hospital Ethics Committee (IRB Review Approval Notice, File Number: 2022ER243-1). Fifteen pairs of primary HCC and normal liver specimens were acquired from the Department of Hepatobiliary Surgery, Affiliated Hospital of North Sichuan Medical College (Nanchong, China). All patients provided informed consent. At least two pathologists each made a diagnosis for each case. No patients underwent radiotherapy, chemotherapy, or immunotherapy prior to surgery. After surgical resection, liver cancer and liver tissue samples were collected and immediately frozen in liquid nitrogen, before transfer to –80℃ freezers for storage.
Cell Culture
The human Huh7, MHCC97L, Hep3B, HepG2 HCC cell lines, and normal liver THLE-2 cells were purchased from the American Type Culture Repository and stored in liquid nitrogen at the Institute of Hepatobiliary and Pancreatic Diseases, North Sichuan Medical College. All cells were cultured in DMEM containing 10% fetal bovine serum (VivaCell; Shanghai, China), 100 units/mL penicillin (VivaCell; Shanghai, China), and 100 mg/mL streptomycin (VivaCell; Shanghai, China). Cells were cultured at 37℃ in a 5% CO2 incubator. The culture medium was changed every 48 hours and cells in log phase were used for RNA extraction.
RNA Extraction and qRT-PCR Assays
TRIzol reagent (Invitrogen) was used to extract RNA from tissues or cells, and the concentration and purity of the extracted RNA was determined using a NanoDrop 2000 (Thermo Scientific). Reverse transcription of extracted RNA into cDNA was conducted using a Superscript II Reverse Transcription Kit (Vazyme Biotech, Nanjing, China). Real-time PCR assays were conducted on a LightCycler® 96 RT-qPCR system (Roche, Switzerland) using SYBR Green PCR Kits (Vazyme Biotech, Nanjing, China). GAPDH served as the endogenous control. The primers used in this investigation were synthesized by Sangon Biotechnology (Shanghai, China), as follows: CENPO, Forward, 5’-TTACAGACCAACATCCAGCACTTCC-3’, Reverse, 5’-GCAAGGGCTTCGTACAGAACAGAG-3’; and GAPDH, Forward, 5’-AAGGTCATCCCTGAGCTGAA-3’, Reverse, 5’-TGACAAAGTGGTCGTTGAGG-3’. PCR amplification conditions: 95℃, 15 sec; 95℃, 10 sec; 60℃, 30 sec, 40 cycles. Results were analyzed by calculating the relative expression of CENPO mRNA using the 2−ΔΔCt method.
Survival and Prognosis Association Analysis
After exclusion of patients with missing information, clinical features and RNA-seq data of patients with HCC were retrieved from TCGA; a total of 374 patient profiles were acquired for analysis in this study. To investigate the relationships between CENPO expression and patient clinicopathological characteristics, patients were divided into a high expression group (n = 187) and a low expression group (n = 187) according to median expression of CENPO. Associations of CENPO expression with overall survival (OS), disease-specific survival (DSS), and progression-free interval survival (PFI) of patients with HCC were analyzed using the R package “survival” (version 3.6.3). The R package “pROC” (version 1.17) was used to estimate the sensitivity of CENPO mRNA as a diagnostic indicator for HCC and the results were visualized with the R package “ggplot2” (version 3.3.3).
Analysis of Differentially Expressed Genes and Biological Function Analysis
Patients were separated into two groups according to median expression of CENPO, and analysis of differential gene expression between the two groups conducted using the R program “DESeq2” (version 3.6.3). Genes with adjusted p values < 0.05 and |fold change| ≥ 1 were screened and defined as Differentially Expressed Genes (DEGs). Gene ontology (GO) and Kyoto Encyclopedia of Genes and Genomes (KEGG) pathway enrichment analyses of DEGs between the high and low CENPO expression groups were conducted using the R package “clusterProfiler” (version 3.14.3).12
Gene Set Enrichment Analysis (GSEA)
Gene Set Enrichment Analysis (GSEA) was used to determine whether an a priori defined gene set was statistically significant and to determine the consistency of differences between two biological states.13 Hence, GSEA was conducted using the R package “clusterProfiler” (version 3.14.3) using the cluster Profiler “h.all.v7.2.symbols.gmt [Hallmarks]” gene set available from the Molecular Signature Database (http://software.broadinstitute.org/gsea/msigdb/). The interchange of gene sets was 1000 per analysis. Biological pathways with a false discovery rate < 0.05 and p < 0.05 were considered to be significantly enriched. The R package “ggplot” (version 3.3.3) was used to visualize the top five signaling pathways.
Analysis of Immune Cell Infiltration
To evaluate HCC tumor-immune infiltration, we applied single-sample GSEA using the R package “GSVA” (version 3.6)14 to assess correlations between numbers of infiltrated HCC tumor-associated immune cells and CENPO mRNA expression. To calculate p values and assess correlations, the Wilcoxon rank sum and Spearman rank correlation tests were applied. Associations among patient prognosis, CENPO expression, and levels of immune cell infiltration were analyzed using the “Outcomes” module of the TIMER 2.0 database.15 The “Corr” module was used to analyze correlations between CENPO expression and immune checkpoint molecules.
Analysis of Correlations Between CENPO Expression and Promoter Methylation
Analysis of differences in CENPO promoter methylation levels between HCC and normal liver tissue was performed using the data from the UALCAN database.16 The “Plot” module of cBioPortal for Cancer Genomics was used to evaluate correlations between CENPO expression and methylation using Spearman and Pearson tests.17
Statistical Analysis
Statistical analyses and data visualization were conducted using R software (version 3.6.3) and GraphPad Prism software. P < 0.05 was set as the threshold for statistical significance.
Results
Pan-Cancer CENPO mRNA Expression Analysis
TCGA database contains RNA sequencing data from 33 cancers, including LIHC. Analysis of the RNA-seq profiles of all 33 cancers demonstrated that CENPO mRNA was highly expressed in 24 cancer types, including HCC, pancreatic adenocarcinoma, and cholangiocarcinoma, while its expression was down-regulated in kidney chromophobe, acute myeloid leukemia, and thyroid carcinoma (Figure 1A). CENPO mRNA expression levels were significantly higher in HCC than in normal liver tissues (Figure 1B), and in HCC tissues compared with adjacent non-cancerous tissues (Figure 1C) (paired samples t-test). Further, we validated the overexpression of CENPO in HCC using data from the GEO database (GSE41804 dataset; platform, GPL570) (Figure 1D). Next, CENPO expression was measured in paired HCC and corresponding normal liver tissues (n = 15) by RT-qPCR and the results demonstrated that CENPO mRNA was over-expressed in HCC tissue (Figure 1E).
 |
Figure 1 CENPO mRNA expression in pan cancer and LIHC (HCC). (A) Pan-cancer CENPO mRNA expression. (B) CENPO mRNA expression in 374 unpaired liver cancer tissues and 50 normal liver tissues from TCGA. (C) CENPO mRNA expression in 50 paired liver cancer and normal liver tissues from TCGA. (D) CENPO mRNA expression in 20 paired liver cancer and normal liver tissues in the GEO dataset (GSE 41804). (E) Analysis of CENPO mRNA expression in 15 paired clinical liver cancer and normal liver tissues by RT-qPCR. ns, not significant; *p < 0.05, **p < 0.01, ***p < 0.001. Abbreviations: ACC, adrenocortical carcinoma; BLCA, bladder urothelial carcinoma; BRCA, breast invasive carcinoma; CESC, cervical squamous cell carcinoma; CHOL, cholangiocarcinoma; COAD, colonic adenocarcinoma; DLBC, diffuse large B-cell lymphoma; ESCA, esophageal carcinoma; GBM, glioblastoma multiforme; HNSC, head and neck squamous cell carcinoma; KICH, kidney Chromophobe; KIRC, kidney renal clear cell carcinoma; KIRP, kidney renal papillary cell carcinoma; LAML, acute myeloid leukemia; LGG, lower grade glioma; LIHC, Liver hepatocellular carcinoma; LUAD, lung adenocarcinoma; LUSC, lung squamous cell carcinoma; MESO, mesothelioma; OV, ovarian serous cystadenocarcinoma; PAAD, pancreatic adenocarcinoma; PCPG, pheochromocytoma and paraganglioma. PRAD, prostate adenocarcinoma; READ, rectum adenocarcinoma; SARC, sarcoma; SKCM, skin cutaneous melanoma; STAD, stomach adenocarcinoma; TGCT, testicular germ cell tumors; THCA, thyroid carcinoma; THYM, thymoma; UCEC, uterine corpus endometrial carcinoma; UCS, uterine carcinosarcoma; UVM, uveal melanoma. |
Analysis of the Diagnostic Value of CENPO and Association of CENPO Expression with Clinical Characteristics of Patients with HCC
To explore the clinical diagnostic value of CENPO in HCC, we evaluated the feasibility of distinguishing HCC from normal tissue using receiver operating characteristics (ROC) curve analysis. The calculated area under the curve (AUC) value (AUC = 0.936, CI = 0.911–0.960) indicated that CENPO had high accuracy as a diagnostic indicator for HCC (Figure 2A). Patients were divided into high and low CENPO expression groups (n = 187 each) according to median CENPO expression and correlations between CENPO expression levels and patient clinicopathological characteristics were investigated. High expression of CENPO in HCC was significantly and positively correlated with pathological stage (p = 0.002), T stage (p < 0.001), histological grade (p < 0.001), and vascular invasion (p = 0.035) (Chi-square or Fisher’s exact test). CENPO expression was also positively correlated to alpha fetoprotein (AFP; p < 0.001) levels and was negatively related to age (p = 0.012) (Wilcoxon rank-sum test) (Table 1).
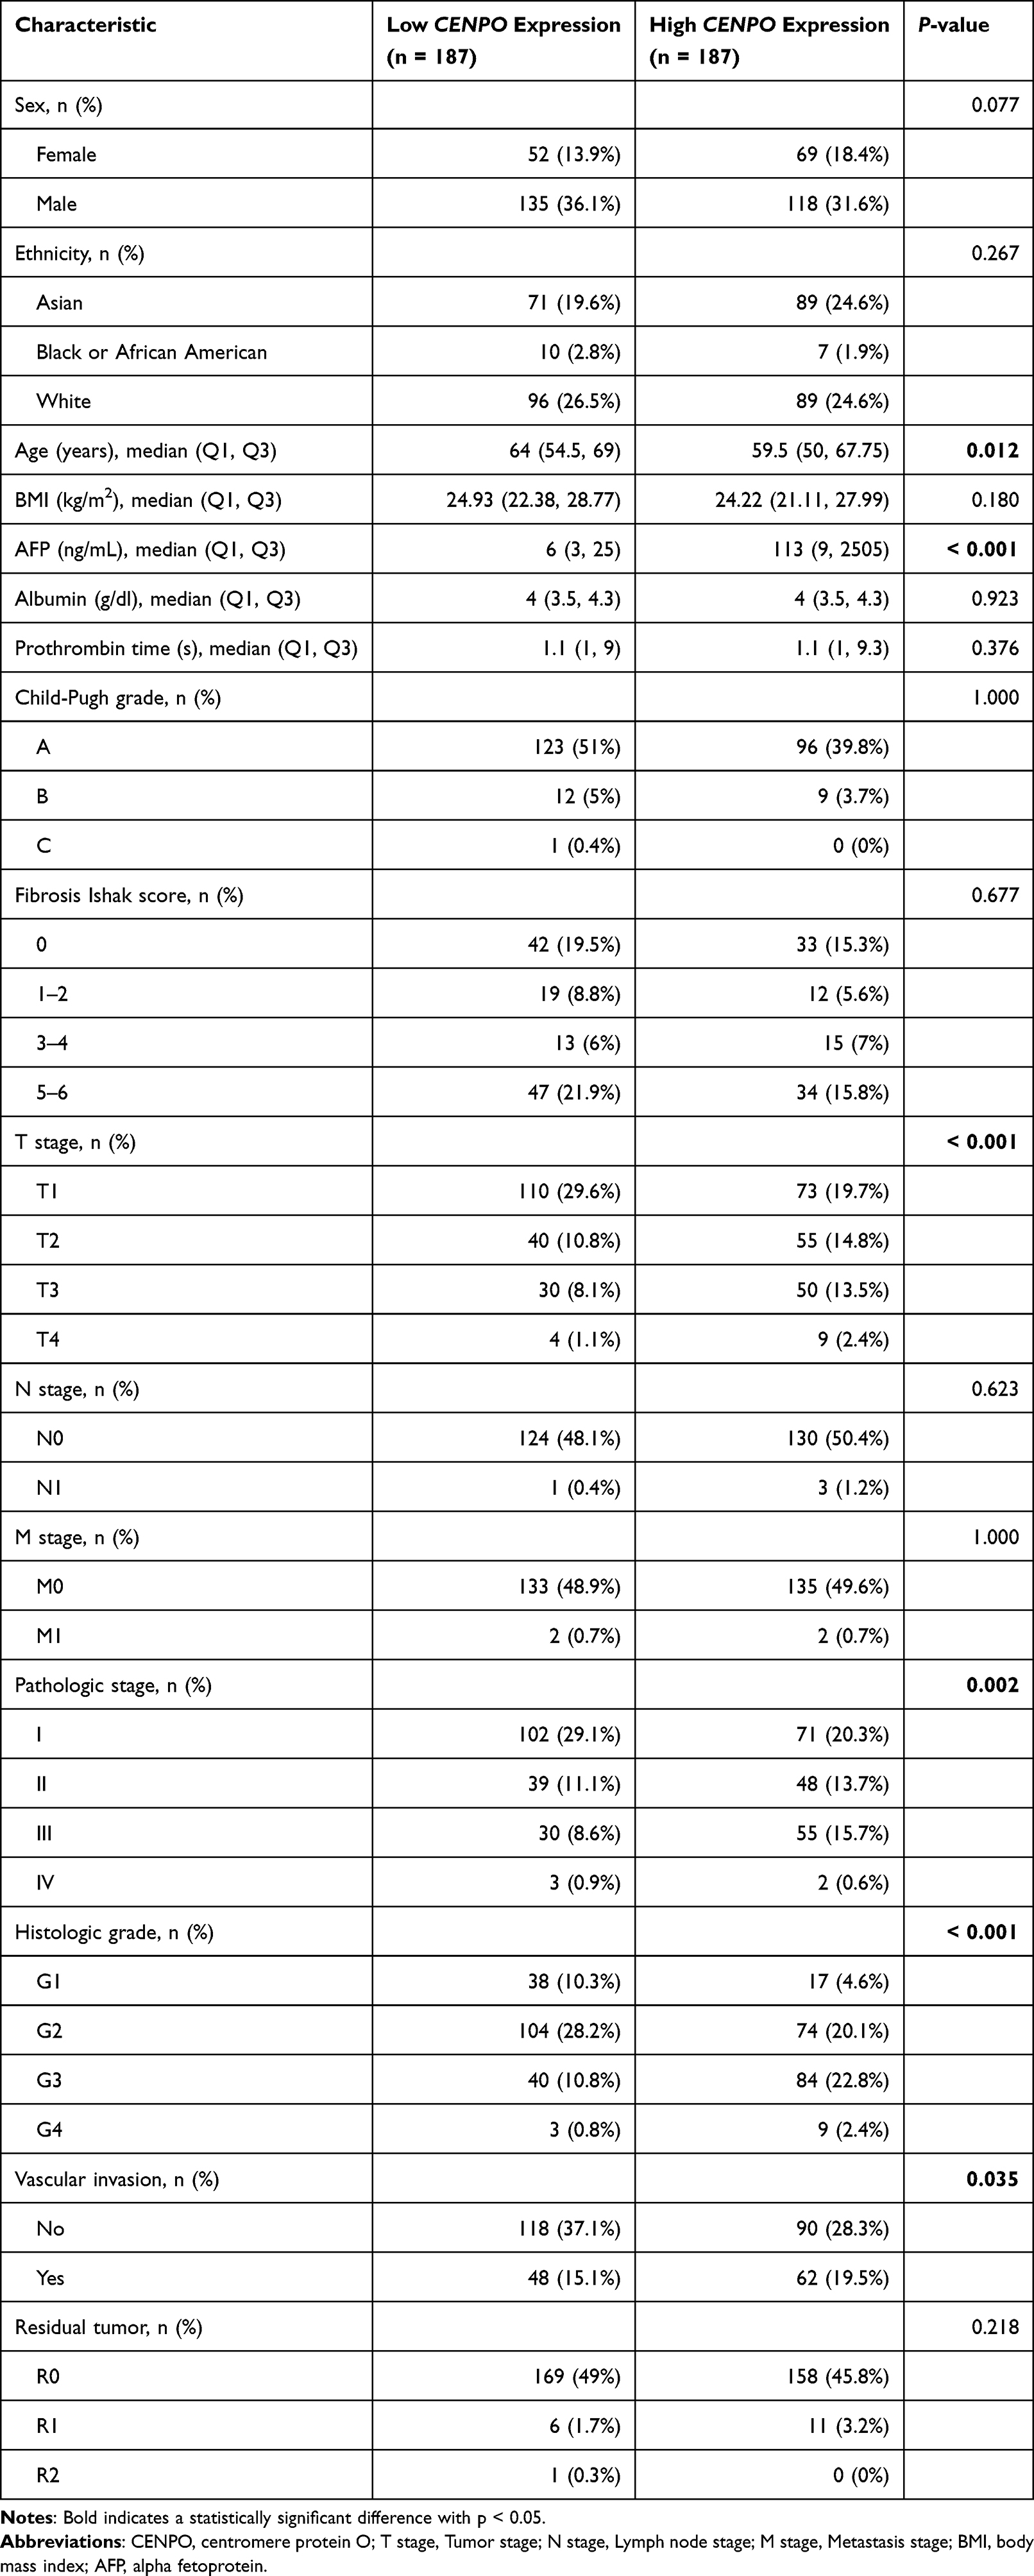 |
Table 1 Analysis of the Association Between CENPO Expression and Clinicopathological Features of HCC in TCGA-LIHC Data |
 |
Figure 2 Relationship between CENPO mRNA expression and HCC diagnosis and prognosis. (A) Diagnostic value of CENPO expression in HCC. TPR, true positive rate; FPR, false positive rate. (B) Association between CENPO expression and overall survival. (C) Association between CENPO expression and disease-specific survival. (D) Association between CENPO expression and progression-free interval. |
High CENPO Expression is Associated with Worse Survival Prognosis in Patients with HCC
To explore the prognostic value of CENPO in HCC, we evaluated the relationships between CENPO mRNA levels and OS, DSS, and PFI in patients with HCC. Kaplan–Meier analysis showed that, compared with the low expression group, patients with high CENPO mRNA expression had significantly worse OS (hazard ratio (HR) = 1.67, 95% CI: 1.19–2.36, p = 0.004), DSS (HR = 2.05, 95% CI: 1.32–3.19, p = 0.002), and PFI (HR = 1.88, 95% CI: 1.40–2.52, p < 0.001) (Figure 2B–D). Next, univariate and multivariate Cox analyses were conducted to identify independent predictors of OS in patients with HCC. Univariate analysis showed that CENPO expression (p = 0.004), T-stage (p < 0.001), M-stage (p = 0.017), and pathological stage (p < 0.001) were associated with OS in patients with HCC (Table 2). Further, multivariate Cox analysis showed that CENPO expression (p = 0.014) and T-stage (p = 0.013) remained significant predictors of poorer OS (Table 2). These findings suggest that CENPO is an independent predictor of OS in patients with HCC and a promising potential prognostic marker for HCC.
 |
Table 2 Univariate and Multivariate Cox Analyses of Factors Influencing Overall Survival in HCC |
Functional Enrichment Analysis of DEGs Between HCC with High and Low CENPO Expression
Next, GO, KEGG, and GSEA were used to probe the functions and pathways involving DEGs between patients with high and low CENPO expression. The results suggest that the DEGs were involved in several GO-biological process terms, including protein activation cascade, nuclear division, complement activation, and humoral immune response (Figure 3A). Further, KEGG pathway analysis indicated that the DEGs were mainly enriched in signaling pathways, including bile secretion, retinol metabolism, metabolism of xenobiotics by cytochrome P450 and the drug metabolism cytochrome P450 signal pathway (Figure 3B). The top five GSEA results indicated that hallmark G2M_checkpoint, E2F_targets, spermatogenesis, mitotic spindle, and KRAS signaling were significantly enriched in the high CENPO expression group (Figure 3C).
 |
Figure 3 GO, KEGG, and GSEA evaluation of DEGs between HCC with high and low CENPO expression. (A) Biological processes enriched for DEGs identified by GO analysis. (B) Pathways enriched for DEGs according to KEGG analysis. (C) Top five pathways with the highest GSEA enrichment analysis scores. (D) Correlation between CENPO expression and the abundance of 24 immune cell infiltrates in TCGA-LIHC. Abbreviations: TFH, T follicular helper cells; aDC, activated dendritic cell; iDC, interdigitating dendritic cell; Treg, regulatory T cells; pDC, plasmacytoid dendritic cell; Tgd, gamma delta T cells; DC, dendritic cell. |
Expression of CENPO is Associated with Immune Cell Infiltration
The results of our functional exploration of DEGs between high and low CENPO expression groups indicated that CENPO was associated with complement activation and humoral immune responses; therefore, we speculated that there may be an association between CENPO expression in HCC and immune cell tumor infiltration, and analyzed the correlation between CENPO expression and the abundance of infiltrating tumor immune cells. To explore possible correlations between CENPO mRNA levels and levels of 24 immune cell types, we used the “ssGSEA” package in R. The results are presented as Spearman’s r values and showed that CENPO expression was significantly correlated with Th2 cells, dendritic cells (DC), T helper cells, T follicular helper cells (TFH), neutrophils, cytotoxic cells, Th17 cells, plasmacytoid DC (pDC), CD8 T cells, gamma delta T (Tgd), natural killer (NK) CD56bright cells, regulatory T cells (Tregs), NK cells, mast cells, and activated DC (aDC) (Figure 3D). Further, CENPO expression was positively correlated with levels of Th2 cells (Figure 4A) (r = 0.632, p < 0.001), T helper cells (Figure 4B) (r = 0.292, p < 0.001), and TFH cells (Figure 4C) (r = 0.299, p < 0.001), NK CD56bright cells (Figure 4D) (r = 0.165, p = 0.001), and aDC infiltration (Figure 4E) (r = 0.114, p = 0.028). In addition, CENPO expression was negatively correlated with DCs (Figure 4F) (r = –0.341, p < 0.001), neutrophils (Figure 4G) (r = –0.345, p < 0.001), cytotoxic cells (Figure 4H) (r = –0.301, p < 0.001), Th17 cells (Figure 4I) (r = –0.265, p < 0.001), pDCs (Figure 4J) (r = –0.190, p < 0.001), CD8 T cells (Figure 4K) (r = –0.182, p < 0.001), Tgd (Figure 4L) (r = –0.195, p < 0.001), Tregs (Figure 4M) (r = –0.142, p = 0.006), NK cells (Figure 4N) (r = –0.130, p = 0.012), and mast cells (Figure 4O) (r = –0.124, p = 0.016).
 |
Figure 4 CENPO expression was significantly correlated with the abundance of 15 immune cell infiltrates. (A) Th2 cells, (B) T helper cells, (C) T follicular helper cells (TFH), (D) natural killer (NK) CD56bright cells, (E) activated dendritic cell (aDC), (F) dendritic cells (DCs), (G) neutrophils, (H) cytotoxic cells, (I) Th17 cells, (J) plasmacytoid DCs (pDCs), (K) CD8 T cells, (L) gamma delta T (Tgd), (M) regulatory T cells (Tregs), (N) NK cells, and (O) mast cells. |
The above results encouraged us to further explore the associations between CENPO expression and the abundance of tumor infiltrating immune cells. Interestingly, we observed significant differences in the degree of tumor immune cell infiltration between the high and low CENPO expression groups. In the CENPO high expression group, tumor-infiltrating immune cells Th2 cells (Figure 5A) (p < 0.001), T helper cells (Figure 5B) (p < 0. 001), TFH cells (Figure 5C) (p < 0.001), NK CD56bright cells (Figure 5D) (p = 0.021), and aDC (Figure 5E) (p = 0.024) were more abundant. However, in the CENPO low expression group, DCs (Figure 5F) (p < 0.001), neutrophils (Figure 5G) (p < 0.001), cytotoxic cells (Figure 5H) (p < 0.001), Th17 cells (Figure 5I) (p < 0.001), pDCs (Figure 5J) (p = 0. 002), CD8 T cells (Figure 5K) (p = 0.017), Tgd (Figure 5L) (p = 0.033), Tregs (Figure 5M) (p = 0.009), NK cells (Figure 5N) (p = 0.013), and mast cells (Figure 5O) (p = 0.014) had a higher infiltration abundance. This is consistent with the results of the previous correlation analysis between CENPO expression and immune cells. Finally, we evaluated the associations between CENPO and immune cell infiltration with clinical survival outcomes in patients with liver cancer, according to the TIMER 2.0 online database. Low levels of CD4+ memory resting T cells and endothelial cells were associated with poor prognosis in patients with HCC and high CENPO expression (p < 0.05) (Figure 6A and B). Further levels of neutrophil and macrophage M2 infiltration were significantly associated with poor prognosis in patients in the low CENPO expression group (p < 0.05) (Figure 6C and D). These findings suggest that CENPO has an important role in the immune infiltration of HCC.
 |
Figure 5 Analysis of the abundance of various immune cell infiltrates between different CENPO expression cohorts. (A) Th2 cells, (B) T helper cells, (C) T follicular helper cells (TFH), (D) natural killer (NK) CD56bright cells, (E) activated dendritic cell (aDC), (F) dendritic cells (DCs), (G) neutrophils, (H) cytotoxic cells, (I) Th17 cells, (J) plasmacytoid DCs (pDCs), (K) CD8 T cells, (L) gamma delta T (Tgd), (M) regulatory T cells (Tregs), (N) NK cells, and (O) mast cells. |
 |
Figure 6 Prognosis of HCC according to CENPO expression combined with immune cell infiltration based on TIMER2.0 database analysis. (A) resting memory CD4+T cells, (B) endothelial cells, (C) M2 macrophages, and (D) neutrophils. |
CENPO Function in HCC Immune Evasion
Immunotherapy is a standard feature of care for patients with advanced HCC; however, it is accompanied by complications, such as immunological tolerance. Several immunological checkpoints linked to immune escape have been identified, among which, PD1, PD-L1, and CTLA-4 are most prominent. Using the TIMER2.0 database, we investigated the relationships of CENPO with PDCD1, CD274, and CTLA4, to learn more about the role of CENPO in HCC immunological tolerance. CENPO expression in HCC was strongly and positively correlated with CTLA4 (r = 0.395, p < 0.001), PDCD1 (r = 0.389, p < 0.001), and CD274 (r = 0.364, p < 0.001) levels (Figure 7A–C). These findings suggest that CENPO is a potential target for immunotherapy in HCC.
 |
Figure 7 Associations between CENPO expression and (A) CTLA4, (B) PD-1, and (C) PD-L1 in the TIMER 2.0 database. (D) CENPO promoter methylation levels in HCC. (E) Correlation analysis of CENPO expression and methylation. |
Relationship Between CENPO Expression and Methylation in HCC
Tumor occurrence is generally associated with abnormal gene expression. To further investigate the mechanisms underlying abnormal CENPO expression in HCC, we analyzed the relationship between CENPO expression and genomic methylation. A total of 50 normal liver tissue and 377 liver cancer samples from the UALCAN database were included in the analysis of methylation levels at the CENPO promoter region. The results showed that methylation levels at the CENPO promoter region were significantly lower in the HCC group that those in normal liver tissues (p < 0.001) (Figure 7D). Further, genomic level analysis of changes in CENPO in 1009 liver cancer samples from four groups of HCC studies selected through the cBioPortal database showed that its expression was negatively correlated with methylation (Spearman’s r = –0.24, p < 0.001; Pearson’s r = –0.22, p < 0.001) (Figure 7E). These findings suggest that methylation changes may control CENPO expression in HCC.
Analysis of CENPO mRNA Expression in Cell Lines
To further explore the expression of CENPO in HCC cell lines, we examined the expression of CENPO mRNA in human HCC Huh7, MHCC97L, Hep3B, HepG2 cell lines, and normal liver THLE-2 cells by RT-qPCR. The results showed that the expression of CENPO mRNA was significantly higher in Huh7, Hep3B, and HepG2 cells than in normal hepatocytes. In MHCC97L cells, CENPO mRNA expression tended to be higher, although the difference was not statistically significant (Figure 8).
 |
Figure 8 Expression of CENPO mRNA in HCC cell lines. The results were normalized with GAPDH. ns, not significant; *p < 0.05, **p < 0.01. |
Discussion
HCC remains a major cause of cancer-related deaths worldwide.18 The number of men with liver cancer in China is second only to that with lung cancer, whereas the number of women with liver cancer is second only to that with breast cancer.19 Patients with HCC are often diagnosed when the disease is at an advanced stage, and many patients continue to die from disease recurrence and distant metastasis after surgery. Therefore, there is an urgent need to find more effective biomarkers for early diagnosis and surveillance of the development of liver cancer.
With the development of molecular biology techniques, over 100 members of the CENP family of centromere proteins have been discovered.20 CENPs can be subdivided into subgroups (CENP-C, CENP-L/M, CENP-H/I/K/M, CENP-T/W, CENP-O/P/Q/R/U, and CENP-S/X) based on their functions.21,22 Mislocalization or abnormal expression of these proteins or complexes can result in abnormal cell division and the formation of chromosome aneuploidies, and such alterations are frequently linked to cell cycle disruption and cancer development.23,24 With advances in bioinformatics and molecular biology, an increasing number of centromere proteins have been identified as involved in the regulation of HCC. CENPA,25 CENPE,26 CENPF,27 CENPH,28 CENPK,29 CENPL,30 CENPM,31 CENPN,32 and CENPU33 are highly expressed in HCC and their levels correlate with patient prognosis; however, to our knowledge, there have been no studies on the role of CENPO in HCC. In this study, we explored the possible mechanisms underlying the function of CENPO in HCC and its suitability as a diagnostic and prognostic biomarker.
In our pan-cancer analyses, we observed upregulation of CENPO mRNA expression in the majority of cancer types. By integrating data from multiple databases, we demonstrated that CENPO expression is consistently upregulated in HCC. Further, our RT-qPCR data confirmed that CENPO mRNA expression in liver cancer tissues was higher than that in healthy liver. Furthermore, we investigated whether CENPO expression was associated with the clinicopathological characteristics of HCC and found significant associations between CENPO and AFP levels, T stage, pathological stage, histological grade, and vascular invasion, and a negative correlation with age. Survival analysis showed that patients with high CENPO expression had worse OS, DSS, and PFI compared to those with low CENPO expression. Moreover, univariate and multivariate Cox analysis showed that CENPO was an independent predictor of factors influencing overall survival in HCC. In addition, ROC curve analysis suggest that CENPO can serve as a diagnostic biomarker in HCC. Overall, CENPO could be applied as a new marker to diagnose HCC and predict patient prognosis.
The tumor immune microenvironment comprises a complex system characterized by immunosuppression as well as immune escape, induced by multiple immune cells within the tumor.34 The percentages of immune cell types infiltrating the tumor immune microenvironment can significantly influence the malignant biological behavior of tumors. Other members of the centromere protein family (CENPF35,36 and CENPM31) are also associated with infiltration of multiple immune cell types in HCC. GO analysis demonstrated that the main biological processes involving CENPO include humoral immune responses and complement activation. We further demonstrated that CENPO expression was associated with HCC infiltration of multiple immune cells. We speculate that CENPO may influence the tumor microenvironment by altering the ratio of immune cells, which in turn promotes HCC progression, because HCC is a chronic inflammation-driven tumor, and disruption of the immune microenvironment is an important cause of HCC progression.37
Our study shows that CENPO expression is significantly and positively correlated with various immune cell types, particularly Th2 cells. Previous studies have shown that skewing of the Th1/Th2 cell ratio toward Th2 cells may be associated with HCC metastasis.38 Further, Th2 cells can induce the polarization of M1 into M2 macrophages, which ultimately leads to suppression of the host immune system, thus promoting cancer development.39 There is also evidence that energy metabolism between Th2 cells and the tumor microenvironment is interdependent, and can influence tumor development.40 Our data show that CENPO expression is positively correlated with abundance of immune cells, including TFH cells which can be switched to Th1 or Th2 cells to regulate humoral immunity.41 Hence, upregulation of CENPO expression may contribute to HCC occurrence and progression by affecting immune infiltration. In light of these findings, we used the TIMER2.0 database to investigate the effects of CENPO and immune cells on HCC prognosis. Our results suggest that CENPO expression, along with CD4+ memory resting phase T cell, endothelial cell, M2 macrophage, and neutrophil levels, may influence the outcome of patients with HCC. TIMER2.0 database analysis of the relationship between CENPO and immune checkpoint-related molecules revealed a positive correlation, indicating that CENPO likely promotes HCC via immune regulation. Together, these results suggest that CENPO may influence HCC development by altering immune cell infiltration; however, the tumor microenvironment is highly complex and other immune cell classes in the tumor microenvironment are also likely to influence tumor cell survival. Hence, further experiments to investigate the association between CENPO and immune cells are required.
Finally, we explored the upstream mechanisms underlying the high CENPO expression detected in HCC. Tumors are frequently the result of abnormal gene expression. Methylation status or regulation by upstream non-coding RNA can alter gene expression, which may influence tumor progression.42,43 Attachment of a methyl group to the fifth carbon of the cytosine ring to generate 5-methylcytosine (5-mC) is referred to as DNA methylation, and 5-mC modification can modulate transcription both in vitro and in vivo.44 Here, we observed lower methylation levels of the CENPO promoter region in HCC compared to healthy tissue, and correlation analysis showed that CENPO expression in HCC was negatively correlated with methylation. We hypothesize that CENPO expression in HCC may be influenced by methylation modification, thus contributing to HCC development; however, our data could only be associated with the influence of methylation on CENPO levels, and we did not investigate other potential mechanisms of CENPO expression regulation, such as the effects of various non-coding RNAs.
Although this study was the first to reveal the correlation between CENPO and HCC, our study has limitations. First, the majority of the datasets used in this study were obtained directly from public databases; hence, further validation using in vivo and in vitro experimental and clinical data is needed. Second, longer follow-up and larger patient populations are necessary to confirm the validity of CENPO as a predictor of OS, DSS, and PFI. Finally, additional investigations are required to determine the cause of high CENPO expression in HCC.
Conclusion
Our findings clarify pan-cancer CENPO mRNA expression levels, including in HCC tissues and cell lines. CENPO expression was associated with multiple clinicopathological features of HCC, and high CENPO expression was associated with poor patient prognosis. Downstream pathway analysis suggests that CENPO may influence HCC progression by regulating tumor immune cells and participating in pathways related to the cellular G2M checkpoint. Our data also suggest that CENPO may be associated with immune escape in HCC. Further investigation of the potential mechanisms upstream of HCC showed that differential expression of CENPO in HCC may be controlled by changes in methylation status, suggesting that methylation may be involved in HCC development.
Abbreviations
CENPA, centromere protein A; CENPE, centromere protein E; CENPF, centromere protein F; CENPH, centromere protein H; CENPK, centromere protein K; CENPL, centromere protein L; CENPM, centromere protein M; CENPN, centromere protein N; CENPO, centromere protein O; CENPU, centromere protein U; DEGs, differentially expressed genes; DSS, disease-specific survival; GEO, Gene Expression Omnibus; GO, Gene Ontology; GSEA, Gene Set Enrichment Analysis; GTEX, Genotype-Tissue Expression; HCC, hepatocellular carcinoma; KEGG, Kyoto Encyclopedia of Genes and Genomes; OS, overall survival; PFI, progression-free interval; TCGA, The Cancer Genome Atlas.
Acknowledgments
We acknowledge TCGA, GTEx, GEO, MSigDB, TIMER2.0, UALCAN, and cBioPortal for the data sources.
Funding
This work was supported by the Sichuan Provincial Health and Health Commission Scientific Research Project (Grant No. 20YFZJ0091), the Science and Technology Development Plan of the Affiliated Hospital of North Sichuan Medical College (Grant No. 2018ZX001), the Science and Technology Strategic Cooperation Project of Nanchong Science and Technology Bureau of Sichuan Province (Grant No. 18SXHZ0186), and the Nanchong Science and Technology Program Project (Grant No. 20YFZJ0091).
Disclosure
The authors report no conflicts of interest in this work.
References
1. Sung H, Ferlay J, Siegel RL, et al. Global cancer statistics 2020: GLOBOCAN estimates of incidence and mortality worldwide for 36 cancers in 185 countries. CA Cancer J Clin. 2021;71:209–249. doi:10.3322/caac.21660
2. Vogel A, Cervantes A, Chau I, et al. Hepatocellular carcinoma: ESMO clinical practice guidelines for diagnosis, treatment and follow-up. Ann Oncol. 2019;30:871–873. doi:10.1093/annonc/mdy510
3. Tiong L, Maddern GJ. Systematic review and meta-analysis of survival and disease recurrence after radiofrequency ablation for hepatocellular carcinoma. Brit J Surg. 2011;98:1210–1224. doi:10.1002/bjs.7669
4. Liu Z, Chen C, Yan M, et al. CENPO regulated proliferation and apoptosis of colorectal cancer in a p53-dependent manner. Discov Oncol. 2022;13:8. doi:10.1007/s12672-022-00469-2
5. Cao Y, Xiong J, Li Z, et al. CENPO expression regulates gastric cancer cell proliferation and is associated with poor patient prognosis. Mol Med Rep. 2019;20:3661–3670. doi:10.3892/mmr.2019.10624
6. Liu Y, Xiong S, Liu S, et al. Analysis of gene expression in bladder cancer: possible involvement of mitosis and complement and coagulation cascades signaling pathway. J Comput Biol. 2020;27:987–998. doi:10.1089/cmb.2019.0237
7. Ma H, Qu J, Luo J, et al. Super-enhancer-associated hub genes in chronic myeloid leukemia identified using weighted gene co-expression network analysis. Cancer Manag Res. 2019;11:10705–10718. doi:10.2147/CMAR.S214614
8. Zhang S, Xie Y, Tian T, et al. High expression levels of centromere protein A plus upregulation of the phosphatidylinositol 3-kinase/Akt/mammalian target of rapamycin signaling pathway affect chemotherapy response and prognosis in patients with breast cancer. Oncol Lett. 2021;21:410. doi:10.3892/ol.2021.12671
9. Goldman MJ, Craft B, Hastie M, et al. Visualizing and interpreting cancer genomics data via the Xena platform. Nat Biotechnol. 2020;38:675–678. doi:10.1038/s41587-020-0546-8
10. Blum A, Wang P, Zenklusen JC. SnapShot: TCGA-analyzed tumors. Cell. 2018;173:530. doi:10.1016/j.cell.2018.03.059
11. Hodo Y, Honda M, Tanaka A, et al. Association of interleukin-28B genotype and hepatocellular carcinoma recurrence in patients with chronic hepatitis C. Clin Cancer Res. 2013;19:1827–1837. doi:10.1158/1078-0432.CCR-12-1641
12. Yu G, Wang LG, Han Y, et al. clusterProfiler: an R package for comparing biological themes among gene clusters. Omics. 2012;16:284–287. doi:10.1089/omi.2011.0118
13. Subramanian A, Tamayo P, Mootha VK, et al. Gene set enrichment analysis: a knowledge-based approach for interpreting genome-wide expression profiles. Proc Nat Acad Sci USA. 2005;102:15545–15550. doi:10.1073/pnas.0506580102
14. Hänzelmann S, Castelo R, Guinney J. GSVA: gene set variation analysis for microarray and RNA-seq data. BMC Bioinform. 2013;14:7. doi:10.1186/1471-2105-14-7
15. Li T, Fu J, Zeng Z, et al. TIMER2.0 for analysis of tumor-infiltrating immune cells. Nucleic Acid Res. 2020;48:W509–W514. doi:10.1093/nar/gkaa407
16. Chandrashekar DS, Bashel B, Balasubramanya SAH, et al. UALCAN: a portal for facilitating tumor subgroup gene expression and survival analyses. Neoplasia. 2017;19:649–658. doi:10.1016/j.neo.2017.05.002
17. Cerami E, Gao J, Dogrusoz U, et al. The cBio cancer genomics portal: an open platform for exploring multidimensional cancer genomics data. Cancer Discov. 2012;2:401–404. doi:10.1158/2159-8290.CD-12-0095
18. Vo Quang E, Shimakawa Y, Nahon P. Epidemiological projections of viral-induced hepatocellular carcinoma in the perspective of WHO global hepatitis elimination. Liver Int. 2021;41:915–927. doi:10.1111/liv.14843
19. Li Y, Zhu Y, Fang J, et al. Apoptin regulates apoptosis and autophagy by modulating reactive oxygen species (ROS) levels in human liver cancer cells. Front Oncol. 2020;10:1026. doi:10.3389/fonc.2020.01026
20. Earnshaw WC. Discovering centromere proteins: from cold white hands to the A, B, C of CENPs. Nat Rev Mol Cell Biol. 2015;16:443–449. doi:10.1038/nrm4001
21. Perpelescu M, Fukagawa T. The ABCs of CENPs. Chromosoma. 2011;120:425–446. doi:10.1007/s00412-011-0330-0
22. Weir JR, Faesen AC, Klare K, et al. Insights from biochemical reconstitution into the architecture of human kinetochores. Nature. 2016;537:249–253. doi:10.1038/nature19333
23. Gordon DJ, Resio B, Pellman D. Causes and consequences of aneuploidy in cancer. Nat Rev Genet. 2012;13:189–203. doi:10.1038/nrg3123
24. Kaowinn S, Seo EJ, Heo W, et al. Cancer upregulated gene 2 (CUG2), a novel oncogene, promotes stemness-like properties via the NPM1-TGF-β signaling axis. Biochem Biophys Res Commun. 2019;514:1278–1284. doi:10.1016/j.bbrc.2019.05.091
25. Zhang Y, Yang L, Shi J, et al. The oncogenic role of CENPA in hepatocellular carcinoma development: evidence from bioinformatic analysis. BioMed Res Int. 2020;2020:3040839. doi:10.1155/2020/3040839
26. He P, Hu P, Yang C, et al. Reduced expression of CENP-E contributes to the development of hepatocellular carcinoma and is associated with adverse clinical features. Biomed Pharmacother. 2020;123:109795. doi:10.1016/j.biopha.2019.109795
27. Li X, Li Y, Xu A, et al. Apoptosis-induced translocation of centromere protein F in its corresponding autoantibody production in hepatocellular carcinoma. Oncoimmunol. 2021;10:1992104. doi:10.1080/2162402X.2021.1992104
28. Lu G, Hou H, Lu X, et al. CENP-H regulates the cell growth of human hepatocellular carcinoma cells through the mitochondrial apoptotic pathway. Oncol Rep. 2017;37:3484–3492. doi:10.3892/or.2017.5602
29. Zeng H, Shen Y, Hirachan S, et al. Pan-cancer investigation of CENPK gene: clinical significance and oncogenic immunology. Am J Transl Res. 2021;13:13336–13355.
30. Zeng Z, Jiang X, Pan Z, et al. Highly expressed centromere protein L indicates adverse survival and associates with immune infiltration in hepatocellular carcinoma. Aging. 2021;13:22802–22829. doi:10.18632/aging.203574
31. Wu ZH, Yang DL. High CENPM mRNA expression and its prognostic significance in hepatocellular carcinoma: a study based on data mining. Cancer Cell Int. 2020;20:406. doi:10.1186/s12935-020-01499-y
32. Wang Q, Yu X, Zheng Z, et al. Centromere protein N may be a novel malignant prognostic biomarker for hepatocellular carcinoma. PeerJ. 2021;9:e11342. doi:10.7717/peerj.11342
33. Yu Y, Chen X, Zhang W, et al. Abnormal expression of centromere protein U is associated with hepatocellular cancer progression. BioMed Res Int. 2021;2021:4051192. doi:10.1155/2021/4051192
34. Saeed M, Chen F, Ye J, et al. From design to clinic: engineered nanobiomaterials for immune normalization therapy of cancer. Adv Material. 2021;33:e2008094. doi:10.1002/adma.202008094
35. Si T, Huang Z, Jiang Y, et al. Expression levels of three key genes CCNB1, CDC20, and CENPF in HCC are associated with antitumor immunity. Front Oncol. 2021;11:738841. doi:10.3389/fonc.2021.738841
36. Guo Y, Hu J, Zhao Z, et al. Identification of a prognostic model based on 2-gene signature and analysis of corresponding tumor microenvironment in alcohol-related hepatocellular carcinoma. Front Oncol. 2021;11:719355. doi:10.3389/fonc.2021.719355
37. Pinato DJ, Guerra N, Fessas P, et al. Immune-based therapies for hepatocellular carcinoma. Oncogene. 2020;39:3620–3637. doi:10.1038/s41388-020-1249-9
38. Zhu C, Xiao H, Jiang X, et al. Prognostic biomarker DDOST and its correlation with immune infiltrates in hepatocellular carcinoma. Front Genet. 2021;12:819520. doi:10.3389/fgene.2021.819520
39. Denardo DG, Barreto JB, Andreu P, et al. CD4(+) T cells regulate pulmonary metastasis of mammary carcinomas by enhancing protumor properties of macrophages. Cancer Cell. 2009;16:91–102. doi:10.1016/j.ccr.2009.06.018
40. Schreiber S, Hammers CM, Kaasch AJ, et al. Metabolic interdependency of Th2 cell-mediated type 2 immunity and the tumor microenvironment. Front Immunol. 2021;12:632581. doi:10.3389/fimmu.2021.632581
41. Rezende RM, Lanser AJ, Rubino S, et al. γδ T cells control humoral immune response by inducing T follicular helper cell differentiation. Nat Commun. 2018;9:3151. doi:10.1038/s41467-018-05487-9
42. Huang HY, Li J, Tang Y, et al. MethHC 2.0: information repository of DNA methylation and gene expression in human cancer. Nucleic Acids Res. 2021;49:D1268–d75. doi:10.1093/nar/gkaa1104
43. Wei JW, Huang K, Yang C, et al. Non-coding RNAs as regulators in epigenetics. Oncol Rep. 2017;37:3–9. doi:10.3892/or.2016.5236
44. Angeloni A, Bogdanovic O. Enhancer DNA methylation: implications for gene regulation. Essays Biochem. 2019;63:707–715. doi:10.1042/EBC20190030
 © 2022 The Author(s). This work is published and licensed by Dove Medical Press Limited. The
full terms of this license are available at https://www.dovepress.com/terms
and incorporate the Creative Commons Attribution
- Non Commercial (unported, 3.0) License.
By accessing the work you hereby accept the Terms. Non-commercial uses of the work are permitted
without any further permission from Dove Medical Press Limited, provided the work is properly
attributed. For permission for commercial use of this work, please see paragraphs 4.2 and 5 of our Terms.
© 2022 The Author(s). This work is published and licensed by Dove Medical Press Limited. The
full terms of this license are available at https://www.dovepress.com/terms
and incorporate the Creative Commons Attribution
- Non Commercial (unported, 3.0) License.
By accessing the work you hereby accept the Terms. Non-commercial uses of the work are permitted
without any further permission from Dove Medical Press Limited, provided the work is properly
attributed. For permission for commercial use of this work, please see paragraphs 4.2 and 5 of our Terms.
Recommended articles
Identification of KRBA1 as a Potential Prognostic Biomarker Associated with Immune Infiltration and m6A Modification in Hepatocellular Carcinoma
Liu Y, Fu B, Yu Z, Song G, Zeng H, Gong Y, Ding Y, Huang D
Journal of Hepatocellular Carcinoma 2022, 9:497-516
Published Date: 31 May 2022
CSTF2 Acts as a Prognostic Marker Correlated with Immune Infiltration in Hepatocellular Carcinoma
Zhang W, Wan Y, Zhang Y, Liu Q, Zhu X
Cancer Management and Research 2022, 14:2691-2709
Published Date: 12 September 2022
Downregulation of ST6GAL1 Promotes Liver Inflammation and Predicts Adverse Prognosis in Hepatocellular Carcinoma
Liu R, Cao X, Liang Y, Li X, Jin Q, Li Y, Du H, Zao X, Ye Y
Journal of Inflammation Research 2022, 15:5801-5814
Published Date: 10 October 2022
Establishment and Clinical Application of the Nomogram Related to Risk or Prognosis of Hepatocellular Carcinoma: A Review
Wang X, Zhao M, Zhang C, Chen H, Liu X, An Y, Zhang L, Guo X
Journal of Hepatocellular Carcinoma 2023, 10:1389-1398
Published Date: 22 August 2023
BICDL1 Predicts Poor Prognosis and is Correlated with Methylation and Immune Infiltration in Colorectal Cancer
Luo H, Luo J, Ding N, Zhang T, He Y
Pharmacogenomics and Personalized Medicine 2023, 16:1109-1126
Published Date: 22 December 2023