")
Back to Journals » International Journal of General Medicine » Volume 14
CCNB2, CDC20, AURKA, TOP2A, MELK, NCAPG, KIF20A, UBE2C, PRC1, and ASPM May Be Potential Therapeutic Targets for Hepatocellular Carcinoma Using Integrated Bioinformatic Analysis
Authors Yang Z , Wu X, Li J, Zheng Q, Niu J, Li S
Received 15 October 2021
Accepted for publication 9 December 2021
Published 22 December 2021 Volume 2021:14 Pages 10185—10194
DOI https://doi.org/10.2147/IJGM.S341379
Checked for plagiarism Yes
Review by Single anonymous peer review
Peer reviewer comments 3
Editor who approved publication: Dr Scott Fraser
Video abstract presented by Zhiqiang Yang.
Views: 283
Zhiqiang Yang, Xinglang Wu, Junbo Li, Qiang Zheng, Junwei Niu, Shengwei Li
Department of Hepatobiliary Surgery, Second Affiliated Hospital of Chongqing Medical University, Chongqing, People’s Republic of China
Correspondence: Shengwei Li Tel/Fax +8618780728917
Email [email protected]
Background: Hepatocellular carcinoma (HCC) is a highly malignant, recurrent and drug-resistant tumor, and patients often lose the opportunity for surgery when they are diagnosed. Abnormal gene expression is closely related to the occurrence of HCC. The aim of the present study was to identify the differentially expressed genes (DEGs) between tumor tissue and non-tumor tissue of HCC samples in order to investigate the mechanisms of liver cancer.
Methods: The gene expression profile (GSE62232, GSE89377, and GSE112790) was downloaded from the Gene Expression Omnibus (GEO) and analyzed using the online tool GEO2R to identify differentially expressed genes (DEGs). Gene Ontology (GO) function and Kyoto Encyclopedia of Genes and Genomes (KEGG) pathway enrichment analysis were performed using the Database for Annotation, Visualization and Integrated Discovery. Protein–protein interaction (PPI) of these DEGs was analyzed based on the Search Tool for the Retrieval of Interacting Genes database and visualized by Cytoscape software. In addition, we used the online Kaplan–Meier plotter survival analysis tool to evaluate the prognostic value of hub genes expression. HPA database was used to reveal the differences in protein level of hub genes.
Results: A total of 50 upregulated DEGs and 122 downregulated DEGs were identified. Among them, ten hub genes with a high degree of connectivity were picked out. Overexpression of these hub genes was associated with unfavorable prognosis of HCC.
Conclusion: Our study suggests that CCNB2, CDC20, AURKA, TOP2A, MELK, NCAPG, KIF20A, UBE2C, PRC1, and ASPM were overexpressed in HCC compared with normal liver tissue. Overexpression of these genes was an unfavorable prognostic factor of HCC patients. Further study is needed to explore the value of them in the diagnosis and treatment of HCC.
Keywords: hepatocellular carcinoma, hub genes, expression profiling data, protein–protein interaction network
Introduction
Hepatocellular carcinoma (HCC) ranks sixth among the most common cancers, and its incidence is increasing in almost all countries.1 Hepatocellular carcinoma accounts for more than 90% of all liver cancers, and its risk factors include hepatitis B virus (HBV) and hepatitis C virus (HCV) infection, alcohol consumption, aflatoxin exposure and metabolic abnormalities.2 Alpha fetoprotein (AFP) combined with imaging is the most widely used method for screening and diagnosis of liver cancer currently. Because of the low sensitivity of serum AFP, the diagnostic sensitivity of all HCC patients is only 59%. Due to the lack of diagnostic accuracy, the American Association for the Study of Liver Diseases and the European Association for Liver Research do not recommend AFP for the diagnosis of liver cancer.3,4 There are many treatment methods for liver cancer, including surgical resection, chemotherapy, TACE, and liver transplantation.5 However, the rate of recurrence, progression and metastasis of HCC is still high. Previous studies have found that abnormal gene expression is closely related to the biological aggressiveness of HCC and patient survival. These genes provide new drug targets for relapsed or unresectable HCC, improving the therapeutic effect greatly.6,7 Therefore, screening of new prognostic biomarkers and therapeutic targets for HCC patients is an important research topic.
In order to detect the differentially expressed genes (DEGs) between HCC and healthy human liver tissues, we downloaded three gene expression profiles from the GEO database to obtain DEGs between HCC tissues and normal tissue samples. Through gene ontology (GO) annotation and Kyoto Encyclopedia of Genes and Genomes (KEGG) pathway enrichment, the selected DEGs were analyzed for their potential functions. Then, we established and used Cytoscape software to construct a protein–protein interaction (PPI) network composed of these predicted target genes to find hub genes related to HCC. The online database Kaplan–Meier plotter was used for survival analysis of these hub genes. The hub gene immunohistochemical staining of liver cancer tissues and normal tissues was obtained from the HPA database. The purpose of this study is to explore and identify the hub gene and its potential molecular mechanisms related to invasion and metastasis based on a comprehensive bioinformatics analysis.
Materials and Methods
Data Source
In this study, the gene expression profile datasets were obtained from the Gene Expression Omnibus (https://www.ncbi.nlm.nih.gov/geo/) of NCBI. A total of 2241 series about human hepatocellular carcinoma were retrieved from the database. After a careful review, three gene expression profiles (GSE62232, GSE89377, and GSE112790) were selected. Among them, GSE89377 was based on the platform GPL6947 Illumina HumanHT-12 V3.0 expression beadchip, and GSE62232 and GSE112790 were based on platform GPL570[HG-U133_Plus_2] Affymetrix Human Genome U133 Plus 2.0 Array. All the data are freely available online, and this study does not involve any experiments conducted by any author on humans or animals. Ethical approval was not necessary for this study because public datasets were analyzed.
Data Processing of DEGs
GEO2R (www.ncbi.nlm.nih.gov/geo/geo2r/), a web tool performing comparisons based on limma and GEOquery R packages of the Bioconductor project, was used to identify the DEGs between HCC and normal specimens. Genes that met the cutoff criteria, adjusted P<0.05 and |logFC|>1.0, were considered as DEGs. Statistical analysis was carried out for each dataset, and the Venn diagram web tool (bioinformatics.psb.ugent.be/webtools/Venn/) was performed to identify the common DEGs shared by these three GSEs.
GO and KEGG Pathway Analysis of DEGs
GO is a common method for annotating genes, gene products and sequences to underlying biological phenomena; gene functions can be classified into biological process (BP), molecular function (MF), and cellular component (CC). KEGG is an integrated database resource for biological interpretation of genome sequences and other high-throughput data. Both analyses were available in the DAVID database (https://david.ncifcrf.gov/), which is a bioinformatics data resource composed of an integrated biology knowledge base and analysis tools to extract meaningful biological information from large quantities of genes and protein collections. P < 0.01 and gene counts >5 were considered statistically significant.
PPI Network Construction and Hub Gene Identification
The Search Tool for the Retrieval of Interacting Genes (STRING; www.string-db.org/) was used to evaluate the PPI information. The PPI network served to identify the key genes and Cytoscape software (www.cytoscape.org) was used to draw the network diagram. The topology of the PPI network was analyzed and the extent of the expression of each gene was calculated. Nodes with higher degree of connectivity tend to be more essential in maintaining the stability of the entire network. CytoHubba was used to calculate the degree of each protein node.
Survival Analysis of Hub Genes
The Kaplan–Meier plotter (http://kmplot.com/analysis/) is capable to assess the effect of 54k genes (mRNA, miRNA, protein) on survival in 21 cancer types including breast (n = 6234), ovarian (n = 2190), lung (n = 3452), and gastric (n = 1440) cancer. Sources for the databases include GEO, EGA, and TCGA. The Kaplan– Meier plotter mRNA liver cancer database was applied to evaluate the prognostic values of hub genes in hepatocellular carcinoma patients. Probes of genes were selected based on the “only JetSet best probe set”, and the probe ID required for each gene is shown in Table 1. P <0.01 was considered as a statistically significant result.
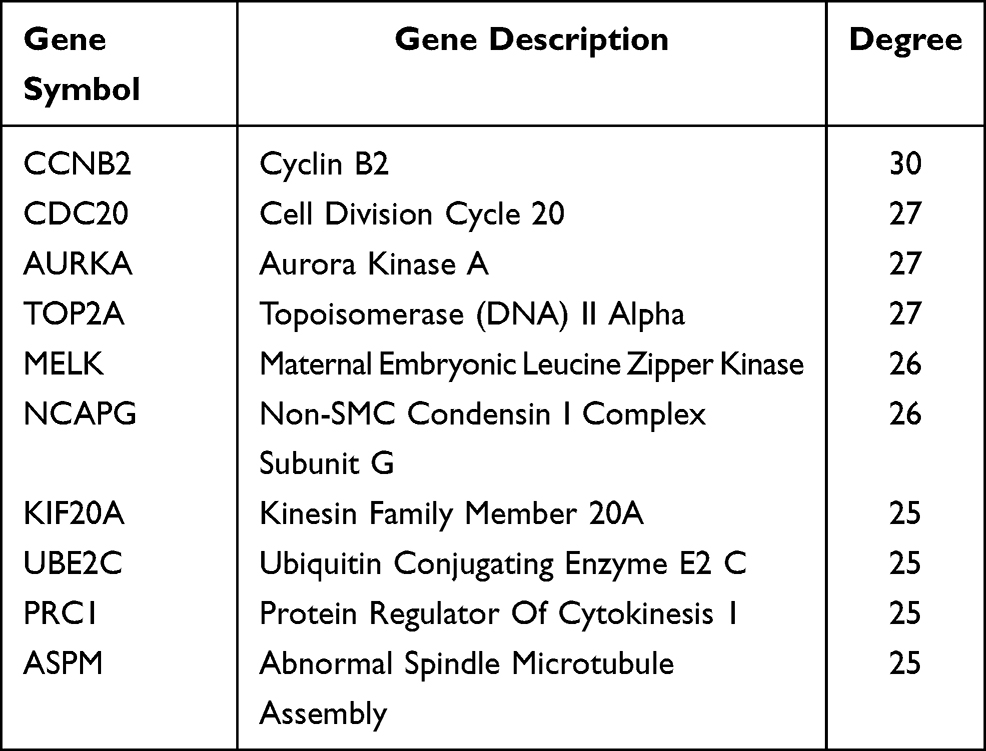 |
Table 1 Top Ten Hub Genes with Higher Degree of Connectivity |
Evaluation of Immunohistochemical Staining
To verify the protein expression level of candidate genes in HCC tissues, we used Human Protein Atlas (HPA, https://www.proteinatlas.org/) database to obtain immunohistochemical staining. The flow diagram of bioinformatics analysis is shown in Figure 1.
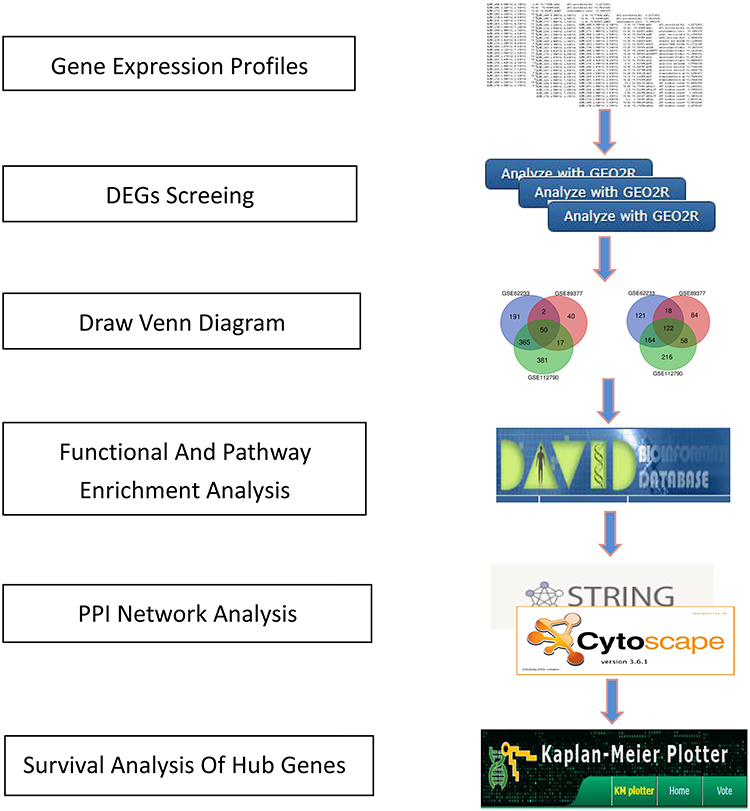 |
Figure 1 Flow diagram of bioinformatics analysis. |
Results
Identification of DEGs
A total of 3 datasets were retrieved from GEO repository and further subjected for the data analysis according to the inclusion criteria, including GSE62232, GSE89377 and GSE112790. Among them, GSE62232 contained 81 HCC samples and 10 normal samples, GSE89377 contained 40 HCC samples and 13 normal samples, and GSE112790 included 183 HCC specimens and 15 normal liver specimens (Table 2). Based on the criteria of P < 0.05 and |logFC|>1, a total of 1033 DEGs were identified from GSE62232, including 608 upregulated genes and 425 downregulated genes. In gene chip GSE89377, 391 DEGs were identified; 109 genes were upregulated, and 282 genes were downregulated. And from GSE112790, 1337 DEGs including 813 upregulated genes and 560 downregulated genes were identified. All DEGs were identified by comparing HCC samples with normal liver samples. The overlap among the 3 datasets as shown in the Venn diagram (Figure 2). One hundred and seventy-two DEGs were significantly differentially expressed among all three groups, of which 50 were significantly upregulated genes and 122 were downregulated.
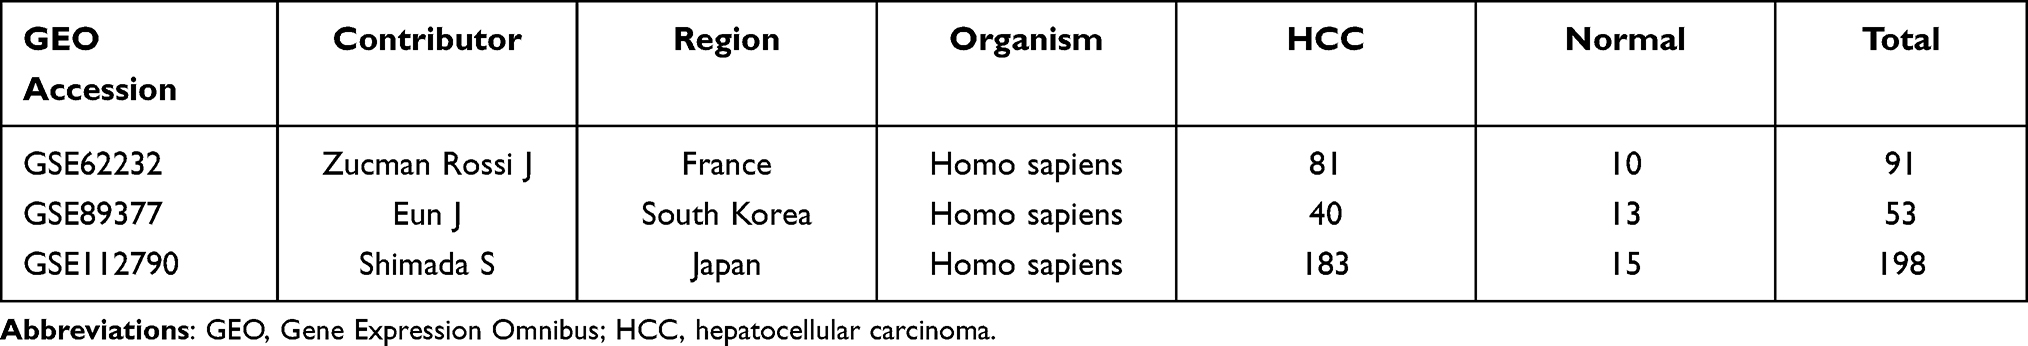 |
Table 2 Statistics of the Three Microarray Databases Derived from the GEO Database |
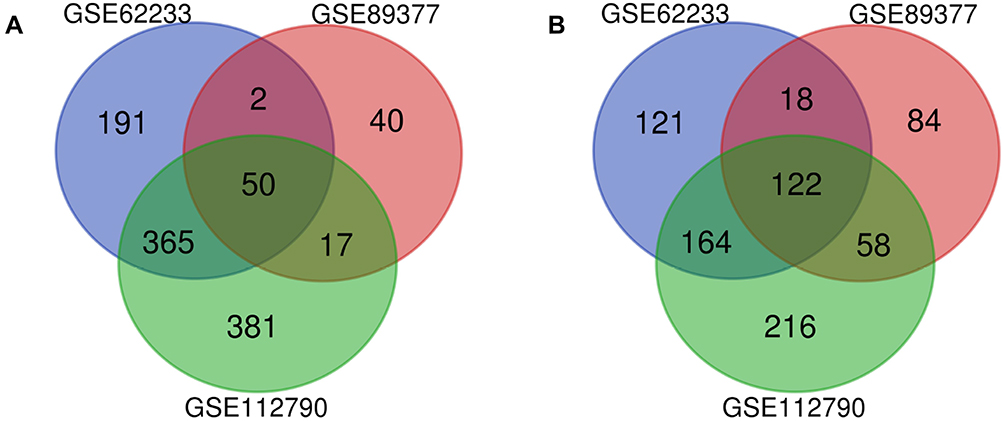 |
Figure 2 Venn diagram of DEGs common to all three GEO datasets. Abbreviations: DEG, differentially expressed gene; GEO, Gene Expression Omnibus. Notes: (A) Upregulated genes. (B) Downregulated genes. |
Functional Enrichment Analyses of DEGs
To analyze the biological classification of DEGs, functional and pathway enrichment analyses were performed using DAVID (Table 3). The results of GO analysis indicated that DEGs were mainly enriched in cellular component, including extracellular region part, membrane fraction, extracellular region, and extracellular space. BP analysis showed that the DEGs were significantly enriched in oxidation reduction, cell cycle, DNA metabolic process, and cell cycle process. For the molecular function, the DEGs were enriched in electron carrier activity, carbohydrate binding, cofactor binding, and lipid binding. In addition, the results of KEGG pathway analysis showed that DEGs were mainly enriched in cell cycle, DNA replication, fatty acid metabolism, and retinol metabolism.
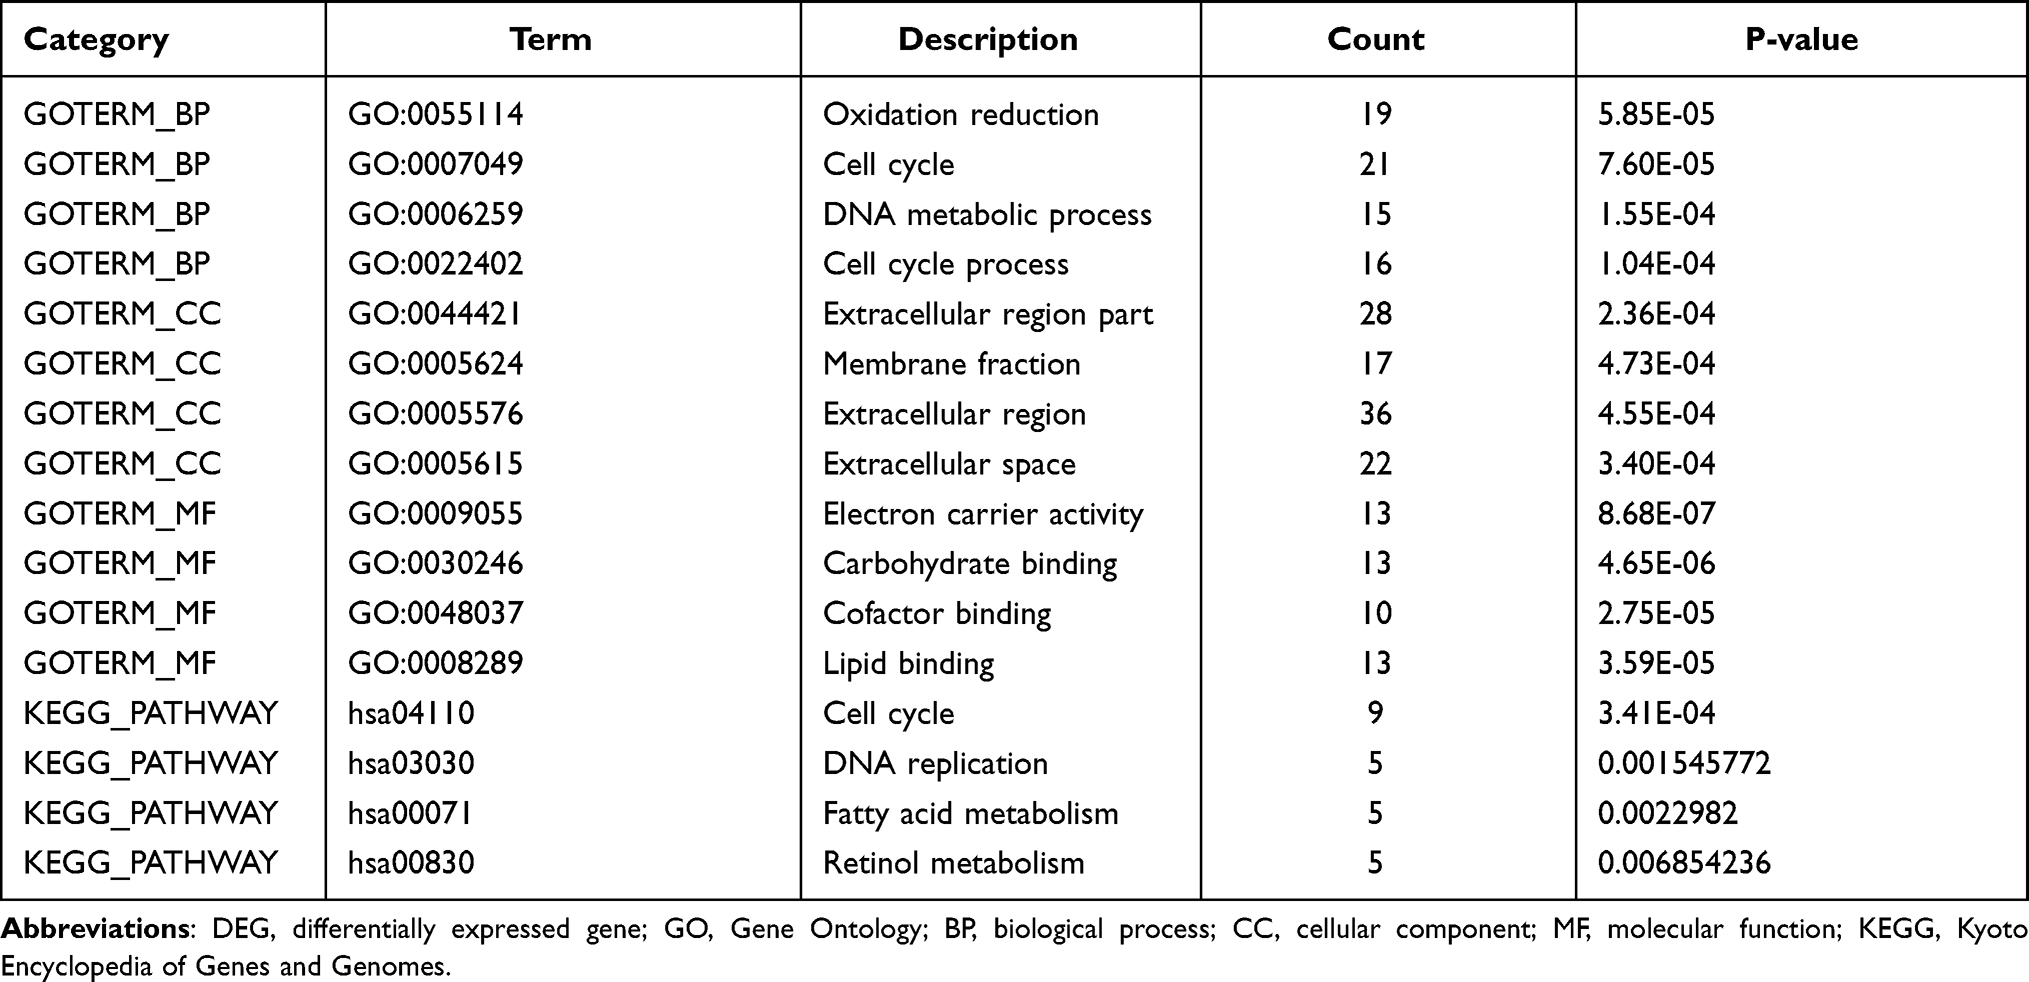 |
Table 3 Significantly Enriched GO Terms and KEGG Pathways of DEGs |
PPI Network Construction and Hub Gene Identification
The PPI network of DEGs was constructed (Figure 3) and the most significant module was obtained using Cytoscape (Figure 4). A total of 45 nodes were involved in the PPI network. The top ten genes evaluated by connectivity degree in the PPI network were identified (Table 1). The results showed that cyclin B2 (CCNB2) was the most outstanding gene with connectivity degree = 30, followed by cell division cycle 20 (CDC20; degree = 27), aurora kinase A (AURKA; degree = 27), topoisomerase (DNA) II alpha (TOP2A; degree = 27), maternal embryonic leucine zipper kinase (MELK; degree = 26), non-SMC condensin I complex subunit G (NCAPG; degree = 26), kinesin family member 20A (KIF20A; degree = 25), ubiquitin conjugating enzyme E2 C (UBE2C; degree = 25), protein regulator of cytokinesis 1 (PRC1; degree = 25), and abnormal spindle microtubule assembly (ASPM; degree = 25). All of these hub genes were upregulated in HCC.
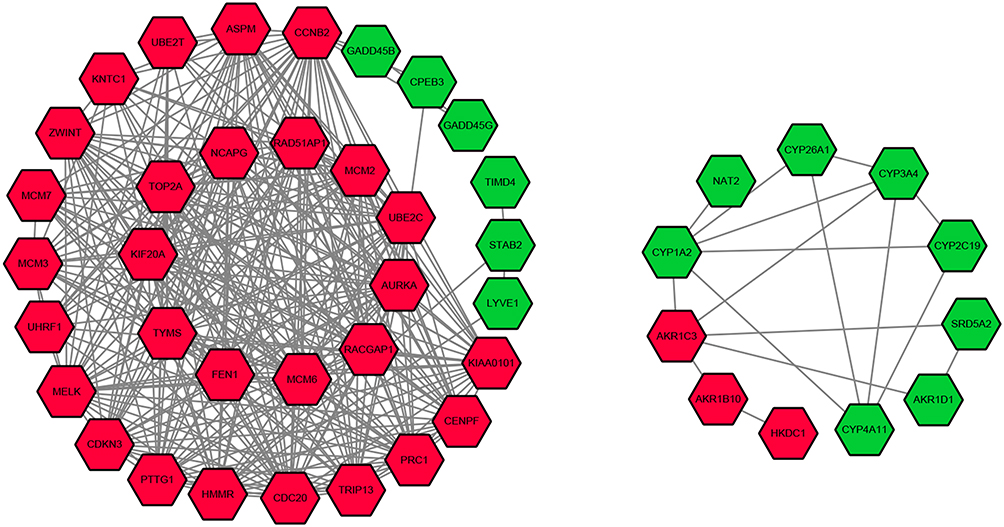 |
Figure 3 Protein–protein interaction network of the differentially expressed genes in hepatocellular carcinoma. Note: Red nodes represent upregulated genes, and green nodes represent downregulated genes. |
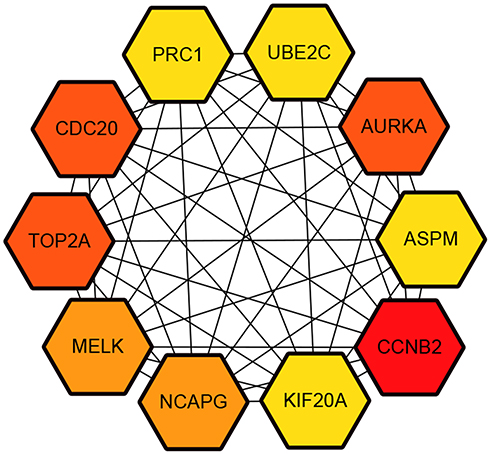 |
Figure 4 Hub genes screened from protein–protein interaction network. |
Survival Analysis of Ten Hub Genes
The prognostic information of the 10 hub genes was freely available in Kaplan Meier-plotter. A total of 364 liver cancer patients were available for the analysis of overall survival (OS) and relapse-free survival (RFS). It was found that high expression of these hub genes was associated with unfavorable OS and RFS for HCC patients (Figures 5 and 6).
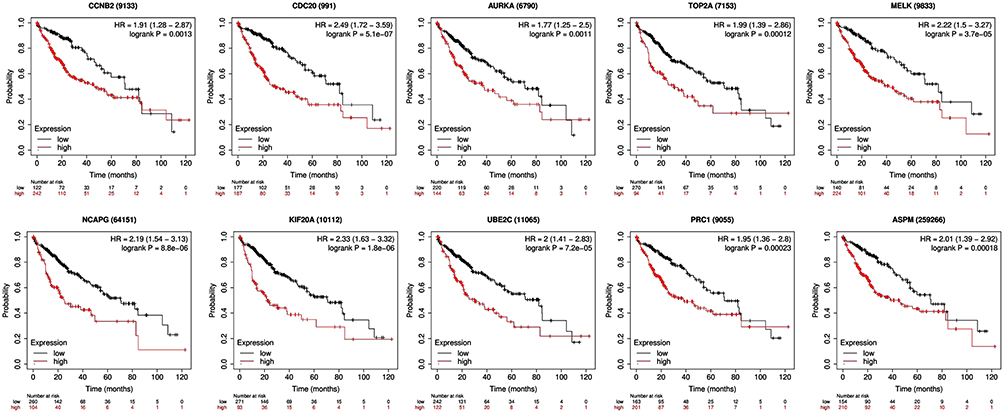 |
Figure 5 Kaplan–Meier overall survival analyses for the top ten hub genes expressed in hepatocellular carcinoma patients. |
 |
Figure 6 Kaplan–Meier relapse-free survival analyses for for the top ten hub genes expressed in hepatocellular carcinoma patients. |
Differences of Nine Hub Genes in Protein Level Between HCC and Normal Tissues
HPA database was used to exhibit the differences in protein level of CCNB2, CDC20, AURKA, TOP2A, MELK, NCAPG, KIF20A, UBE2C, and PRC1. The results showed the immunohistochemical staining of CCNB2, CDC20, AURKA, TOP2A, MELK, NCAPG, KIF20A, UBE2C, and PRC1 was negative staining in normal tissues and positive in HCC tissues, demonstrating that these genes were significantly expressed in HCC tissues than in normal liver tissues (Figure 7).
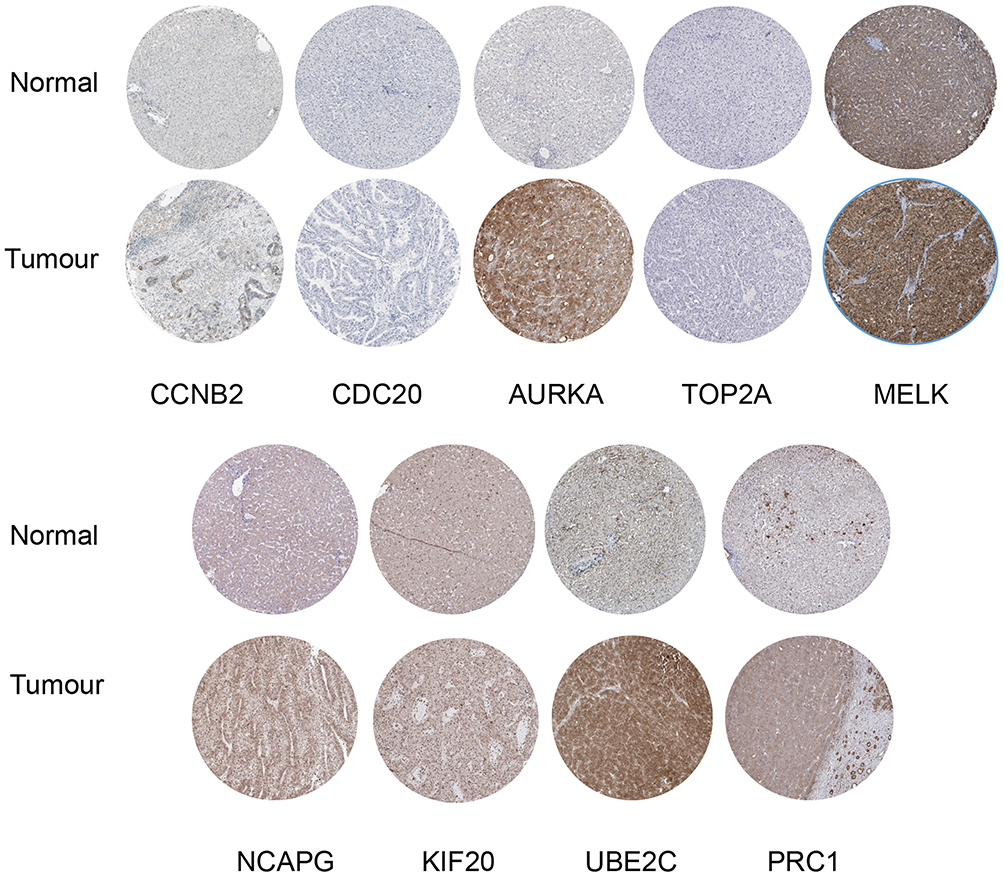 |
Figure 7 Representative protein expression of the nine hub genes. |
Discussion
Hepatocellular carcinoma (HCC) is a common malignant tumor of the digestive system, and its incidence has been on the rise in recent years. The main causes of liver cancer include liver cirrhosis, chronic hepatitis virus infection, alcoholic liver disease and aflatoxin. The most common cause is chronic hepatitis B virus (HBV) infection.8,9 The analysis of HCC gene expression profile through bioinformatics helps us better understand the molecular mechanism of liver cancer formation and find new targets for its diagnosis and treatment.10,11 In this study, we obtained DEGs between liver cancer tissues and non-cancerous tissues. A total of 172 DEGs genes were identified, including 122 down-regulated genes and 50 up-regulated genes. Through GO and KEGG enrichment analysis, the interaction between DEGs was explored. Differential genes are mainly enriched in Oxidation reduction, Cell cycle, DNA metabolic process and Fatty acid metabolism. In order to understand the interaction between genes, 10 hub genes were screened through PPI network and module analysis, including CCNB2, CDC20, AURKA, TOP2A, MELK, NCAPG, KIF20A, UBE2C, PRC1, and ASPM.
CCNB2 is synthesized in the G1 phase, and then rapidly decreases in the early, middle and late stages. Abnormal expression of CCNB2 will cause the G2/M checkpoint function to fail in the cell cycle. The function of G2/M checkpoint is to repair damaged DNA and maintain genome integrity. Defects in DNA damage checkpoints can lead to gene mutations and even tumors. In addition, CCNB2 overexpression is associated with bladder cancer, lung cancer and breast cancer.12 CCNB2 can inhibit cell proliferation and migration, promote cell apoptosis, and cause S phase arrest of liver cancer cells. Promotes cell proliferation and migration through the CCNB2/PLK1 pathway.12 Cell division cycle 20 (CDC20), as one of the regulatory factors of cell cycle checkpoints, is initiated in the late cell cycle and exited in the late mitosis. CDC20 directly binds to APC during mitosis and G1 phase and activates its cyclin ubiquitination activity.13 The expression of CDC20 can be significantly inhibited by p53 protein, which inhibits malignant transformation by regulating cell cycle, cell senescence and apoptosis-related genes. AURKA is up-regulated in HCC tissues and is related to pathological staging and distant metastasis. The overexpression of AURKA induces epithelial–mesenchymal transition (EMT) and cancer stem cell (CSC) behavior through PI3K/AKT pathway, while silencing AURKA inhibits the invasiveness of liver cancer cells. AURKA is involved in cancer metastasis after HCC radiotherapy.14,15
The TOP2A gene encodes a 170 kDa ribozyme that controls the topological structure of DNA, and is often co-amplified with the HER2 gene in breast and bladder cancer.16 The expression of TOP2A is related to the advanced histological grade of liver cancer, microvascular invasion and early onset of malignant tumors. The expression of TOP2A has been reported as a predictor of tumor progression, recurrence and poor survival rates in small cell lung cancer, rectal cancer, nasopharyngeal cancer and prostate cancer.17,18 MELK inhibits the growth and invasion of HCC cells by inducing apoptosis and mitosis. The overexpression of MELK in liver cancer tissues is closely related to the cell cycle and mitosis-related genes, which are directly regulated as part of the forkhead transcription factor and FoxM1-related cell division program.19 NCAPG is a mitotic gene required for HCC cell proliferation and migration. NCAPG gene knockout can induce mitosis of HCC cells and inhibit cell growth, proliferation and migration.20 Tetracycline-induced shRNA knockout NCAPG inhibits the growth of liver cancer cells. In addition, the overexpression of NCAPG in clinical HCC specimens is related to the recurrence and survival of patients. The overexpression of NCAPG is closely related to the overexpression of CCNB1 (mitotic-specific cyclin B1), which is a regulatory protein involved in mitosis.20,21 Kinesin family member 20A (KIF20A) can directly interact with Rab6 small GTPase and participate in the dynamic process of the Golgi apparatus. It is also an important mitotic kinesin required for cytokinesis. KIF20A accumulates in the nucleus during the G2 phase of the cell cycle and promotes normal and pathological hepatocyte proliferation.22 KIF20A is the downstream target of Gli2, which is an important transcription factor that regulates the proliferation and growth of human liver cancer cells.23
Down-regulation of UBE2C expression has a significant inhibitory effect on the proliferation, migration and invasion of liver cancer cells. In addition, UBE2C can protect cancer cells from autophagy death.24 Hepatoma cells with UBE2C gene knockout are more sensitive to chemotherapy drugs such as adriamycin (ADR) and 5-fluorouracil (5-FU). Silencing of UBE2C also increased the sensitivity of liver cancer cells to sorafenib.25 The expression and distribution of PRC1 are dynamically regulated by Wnt3a signal.26,27 The knockout of PRC1 gene damages the transcriptional activity of transcription factor (TCF), reduces the expression of Wnt target genes, and reduces nuclear β-catenin levels. PRC1 interacts with the β-catenin destruction complex, regulates the membrane isolation of the destruction complex induced by Wnt3a, and promotes the release of β-catenin from the APC complex. In vivo, the high expression of PRC1 is related to the targeted expression of nuclear β-catenin and Wnt.28 PRC1 plays a carcinogenic effect by promoting tumor proliferation, metastasis and tumor occurrence. Overexpression of ASPM alleviates G2/M cell cycle arrest. NS5A protein inhibits the promoter activity of Aspm gene in a dose-dependent manner. NS5A protein down-regulates the expression of the mitotic spindle protein ASPM and induces abnormal mitotic cell cycles, leading to chromosomal instability and tumorigenesis.29,30
Conclusion
Our bioinformatics analysis identified 172 DEGs between HCC and normal liver tissues based on the gene expression datasets obtained from the GEO database. Among them, ten hub genes might be the core genes of liver cancer, including CCNB2, CDC20, AURKA, TOP2A, MELK, NCAPG, KIF20A, UBE2C, PRC1, and ASPM. All of them were upregulated in liver cancer, and overexpression of these genes was associated with unfavorable clinical outcome in liver cancer patients. Further study is needed to confirm the results of our research.
Ethics Statement
This study was approved by the Ethics committee of Second Affiliated Hospital of Chongqing Medical University. The research was conducted in accordance with the “Declaration of Helsinki” (revised in 2013).
Disclosure
The authors declare that they have no conflicts of interest in this work.
References
1. Sung H, Ferlay J, Siegel RL, et al. Global cancer statistics 2020: GLOBOCAN estimates of incidence and mortality worldwide for 36 cancers in 185 countries. CA Cancer J Clin. 2021;71(3):209–249. doi:10.3322/caac.21660
2. European Association for the Study of the Liver. EASL clinical practice guidelines: management of hepatocellular carcinoma [published correction appears in J Hepatol. 2019 Apr;70(4):817]. J Hepatol. 2018;69(1):182–236. doi:10.1016/j.jhep.2018.03.019
3. Bruix J, Sherman M; American Association for the Study of Liver Diseases. Management of hepatocellular carcinoma: an update. Hepatology. 2011;53(3):1020–1022. doi:10.1002/hep.24199
4. European Association For The Study Of The Liver; European Organisation For Research And Treatment Of Cancer. EASL-EORTC clinical practice guidelines: management of hepatocellular carcinoma [published correction appears in J Hepatol. 2012 Jun;56(6):1430]. J Hepatol. 2012;56(4):908–943. doi:10.1016/j.jhep.2011.12.001
5. Heimbach JK, Kulik LM, Finn RS, et al. AASLD guidelines for the treatment of hepatocellular carcinoma. Hepatology. 2018;67(1):358–380. doi:10.1002/hep.29086
6. Zhuang L, Wu Y, Han J, et al. A network biology approach to discover the molecular biomarker associated with hepatocellular carcinoma. Biomed Res Int. 2014;2014:278956. doi:10.1155/2014/278956
7. Chow EY, Zhang J, Qin H, Chan TF. Characterization of hepatocellular carcinoma cell lines using a fractionation-then-sequencing approach reveals nuclear-enriched HCC-associated lncRNAs. Front Genet. 2019;10:1081. doi:10.3389/fgene.2019.01081
8. Yang JD, Hainaut P, Gores GJ, Amadou A, Plymoth A, Roberts LR. A global view of hepatocellular carcinoma: trends, risk, prevention and management. Nat Rev Gastroenterol Hepatol. 2019;16(10):589–604. doi:10.1038/s41575-019-0186-y
9. Kim H-S, El-Serag HB. The epidemiology of hepatocellular carcinoma in the USA. Curr Gastroenterol Rep. 2019;21(4):17. doi:10.1007/s11894-019-0681-x
10. Wu M, Liu Z, Li X, Zhang A, Lin D, Li N. Analysis of potential key genes in very early hepatocellular carcinoma. World J Surg Oncol. 2019;17(1):77. doi:10.1186/s12957-019-1616-6
11. Yin F, Shu L, Liu X, et al. Microarray-based identification of genes associated with cancer progression and prognosis in hepatocellular carcinoma. J Exp Clin Cancer Res. 2016;35(1):127. doi:10.1186/s13046-016-0403-2
12. Li R, Jiang X, Zhang Y, et al. Cyclin B2 overexpression in human hepatocellular carcinoma is associated with poor prognosis. Arch Med Res. 2019;50(1):10–17. doi:10.1016/j.arcmed.2019.03.003
13. Li J, Gao JZ, Du JL, Huang ZX, Wei LX. Increased CDC20 expression is associated with development and progression of hepatocellular carcinoma. Int J Oncol. 2014;45(4):1547–1555. doi:10.3892/ijo.2014.2559
14. Chen C, Song G, Xiang J, Zhang H, Zhao S, Zhan Y. AURKA promotes cancer metastasis by regulating epithelial-mesenchymal transition and cancer stem cell properties in hepatocellular carcinoma. Biochem Biophys Res Commun. 2017;486(2):514–520. doi:10.1016/j.bbrc.2017.03.075
15. Zhu LF, Hu Y, Yang CC, et al. Snail overexpression induces an epithelial to mesenchymal transition and cancer stem cell-like properties in SCC9 cells. Lab Invest. 2012;92(5):744–752. doi:10.1038/labinvest.2012.8
16. Varga Z, Moelans CB, Zuerrer-Hardi U, et al. Topoisomerase 2A gene amplification in breast cancer. Critical evaluation of different FISH probes. Breast Cancer Res Treat. 2012;133:929–935.
17. Panvichian R, Tantiwetrueangdet A, Angkathunyakul N, Leelaudomlipi S. TOP2A amplification and overexpression in hepatocellular carcinoma tissues. Biomed Res Int. 2015;2015:381602. doi:10.1155/2015/381602
18. Wong N, Yeo W, Wong WL, et al. TOP2A overexpression in hepatocellular carcinoma correlates with early age onset, shorter patients survival and chemoresistance. Int J Cancer. 2009;124(3):644–652. doi:10.1002/ijc.23968
19. Xia H, Kong SN, Chen J, et al. MELK is an oncogenic kinase essential for early hepatocellular carcinoma recurrence. Cancer Lett. 2016;383(1):85–93. doi:10.1016/j.canlet.2016.09.017
20. Wang Y, Gao B, Tan PY, et al. Genome-wide CRISPR knockout screens identify NCAPG as an essential oncogene for hepatocellular carcinoma tumor growth. FASEB J. 2019;33(8):8759–8770. doi:10.1096/fj.201802213RR
21. Zhang Q, Su R, Shan C, Gao C, Wu P. Non-SMC condensin I complex, subunit G (NCAPG) is a novel mitotic gene required for hepatocellular cancer cell proliferation and migration. Oncol Res. 2018;26(2):269–276. doi:10.3727/096504017X15075967560980
22. Gasnereau I, Boissan M, Margall-Ducos G, et al. KIF20A mRNA and its product MKlp2 are increased during hepatocyte proliferation and hepatocarcinogenesis. Am J Pathol. 2012;180(1):131–140. doi:10.1016/j.ajpath.2011.09.040
23. Lu M, Huang X, Chen Y, et al. Aberrant KIF20A expression might independently predict poor overall survival and recurrence-free survival of hepatocellular carcinoma. IUBMB Life. 2018;70(4):328–335. doi:10.1002/iub.1726
24. Guo L, Ding Z, Huang N, Huang Z, Zhang N, Xia Z. Forkhead Box M1 positively regulates UBE2C and protects glioma cells from autophagic death. Cell Cycle. 2017;16(18):1705–1718. doi:10.1080/15384101.2017.1356507
25. Xiong Y, Lu J, Fang Q, et al. UBE2C functions as a potential oncogene by enhancing cell proliferation, migration, invasion, and drug resistance in hepatocellular carcinoma cells. Biosci Rep. 2019;39(4):BSR20182384. doi:10.1042/BSR20182384
26. Rao S, Xiang J, Huang J, et al. PRC1 promotes GLI1-dependent osteopontin expression in association with the Wnt/β-catenin signaling pathway and aggravates liver fibrosis. Cell Biosci. 2019;9:100. doi:10.1186/s13578-019-0363-2
27. Chen J, Rajasekaran M, Xia H, et al. The microtubule-associated protein PRC1 promotes early recurrence of hepatocellular carcinoma in association with the Wnt/β-catenin signalling pathway. Gut. 2016;65(9):1522–1534. doi:10.1136/gutjnl-2015-310625
28. Tang H, Zhao H, Yu ZY, et al. MicroRNA-194 inhibits cell invasion and migration in hepatocellular carcinoma through PRC1-mediated inhibition of Wnt/β-catenin signaling pathway. Dig Liver Dis. 2019;51(9):1314–1322. doi:10.1016/j.dld.2019.02.012
29. Wu SC, Chang SC, Wu HY, Liao PJ, Chang MF. Hepatitis C virus NS5A protein down-regulates the expression of spindle gene Aspm through PKR-p38 signaling pathway. J Biol Chem. 2008;283(43):29396–29404. doi:10.1074/jbc.M802821200
30. Gai M, Bianchi FT, Vagnoni C, et al. ASPM and CITK regulate spindle orientation by affecting the dynamics of astral microtubules [published correction appears in EMBO Rep. 2017 Oct;18(10):1870]. EMBO Rep. 2016;17(10):1396–1409. doi:10.15252/embr.201541823
 © 2021 The Author(s). This work is published and licensed by Dove Medical Press Limited. The full terms of this license are available at https://www.dovepress.com/terms.php and incorporate the Creative Commons Attribution - Non Commercial (unported, v3.0) License.
By accessing the work you hereby accept the Terms. Non-commercial uses of the work are permitted without any further permission from Dove Medical Press Limited, provided the work is properly attributed. For permission for commercial use of this work, please see paragraphs 4.2 and 5 of our Terms.
© 2021 The Author(s). This work is published and licensed by Dove Medical Press Limited. The full terms of this license are available at https://www.dovepress.com/terms.php and incorporate the Creative Commons Attribution - Non Commercial (unported, v3.0) License.
By accessing the work you hereby accept the Terms. Non-commercial uses of the work are permitted without any further permission from Dove Medical Press Limited, provided the work is properly attributed. For permission for commercial use of this work, please see paragraphs 4.2 and 5 of our Terms.