Back to Journals » Journal of Inflammation Research » Volume 19
CCL5-Mediated Immune Interactions Drive Osteosarcoma Progression: Insights from Mendelian Randomization, Single-Cell Analysis, and Functional Validation
Authors Chen J, Shao Y, Guo J, Hu K, Yang X, Huang T, Zhou H ![]()
Received 7 August 2025
Accepted for publication 14 November 2025
Published 6 January 2026 Volume 2026:19 559167
DOI https://doi.org/10.2147/JIR.S559167
Checked for plagiarism Yes
Review by Single anonymous peer review
Peer reviewer comments 3
Editor who approved publication: Dr Junhao Wang
Jihao Chen,1,* Yinyan Shao,2,* Junhua Guo,1 Keke Hu,1 Xuefei Yang,1 Ting Huang,1 Heran Zhou1
1Department of Oncology, Hangzhou TCM Hospital Affiliated to Zhejiang Chinese Medical University, Hangzhou, Zhejiang, 310007, People’s Republic of China; 2Department of General Medicine, Hangzhou TCM Hospital Affiliated to Zhejiang Chinese Medical University, Hangzhou, Zhejiang, 310007, People’s Republic of China
*These authors contributed equally to this work
Correspondence: Heran Zhou, Department of Oncology, Hangzhou TCM Hospital Affiliated to Zhejiang Chinese Medical University, No. 453 Stadium Road, Xihu District, Hangzhou, Zhejiang Province, 310007, People’s Republic of China, Email [email protected] Ting Huang, Department of Oncology, Hangzhou TCM Hospital Affiliated to Zhejiang Chinese Medical University, No. 453 Stadium Road, Xihu District, Hangzhou, Zhejiang Province, 310007, People’s Republic of China, Email [email protected]
Background: Osteosarcoma is a highly aggressive bone malignancy with a complex immune microenvironment. Chronic inflammation and immune cell dysregulation are known to contribute to tumor progression, yet the causal relationships remain largely unclear.
Methods: This study integrated Mendelian Randomization (MR), single-cell RNA sequencing (scRNA-seq), bulk transcriptomic analysis, and functional experiments to explore the role of inflammatory cytokines and immune cells in osteosarcoma. MR analyses were performed to identify cytokines and immune cell traits causally related to osteosarcoma risk, followed by scRNA-seq to profile CCL5 expression across cell types. Immune cell infiltration and its association with CCL5 expression were analyzed using the TARGET dataset. Functional assays including qPCR, CCK-8, EdU, and colony formation validated the biological effects of CCL5.
Results: MR identified CCL5 as a pro-tumorigenic cytokine with a significant causal association with osteosarcoma (OR > 15). scRNA-seq revealed that monocytes/macrophages and fibroblasts were major CCL5-producing cells. Four immune traits were causally linked to osteosarcoma, including CD86 expression on monocytes and CD127 expression on CD4+ T cells (risk factors), and CD8dim T cell and terminally differentiated CD4+ T cell counts (protective factors). CCL5 expression positively correlated with infiltration of CD8+ T cells, Tregs, and M1 macrophages, and was associated with advanced tumor stage. Co-culture assays confirmed that tumor-associated macrophages with high CCL5 expression enhanced osteosarcoma cell proliferation and colony formation.
Conclusion: CCL5 plays a central role in shaping the immune landscape of osteosarcoma and promoting tumor progression. Its spatial association with immune markers such as CD127 and CD86 further supports its regulatory role. These findings provide mechanistic insights and highlight CCL5 as a promising biomarker and immunotherapeutic target in osteosarcoma.
Keywords: osteosarcoma, immune cells, cytokines, CCL5, macrophage
Introduction
Osteosarcoma is the most common primary malignant bone tumor, characterized by its aggressive nature and high propensity for metastasis.1 Despite advances in surgical techniques and chemotherapy, the overall prognosis remains poor, with a five-year survival rate of approximately 60–70%.2 The complex pathogenesis of osteosarcoma involves genetic mutations, epigenetic alterations, and interactions with the tumor microenvironment, which play crucial roles in tumor initiation, progression, and immune evasion.3,4
Inflammation has emerged as a key driver of cancer development and progression, with a growing body of evidence suggesting that chronic inflammation creates a favorable environment for tumor growth and metastasis.5,6 In the context of osteosarcoma, the immune microenvironment is particularly complex, involving interactions between tumor cells, immune cells, and stromal components. These interactions can either promote or inhibit tumor growth, depending on the balance of pro- and anti-inflammatory signals.7,8
Previous studies have identified various cytokines and immune cell subsets that are dysregulated in osteosarcoma, but the causal relationships and mechanisms underlying these interactions remain unclear.9 Mendelian randomization (MR) is a powerful epidemiological method that leverages genetic variants as instrumental variables to infer causal relationships between risk factors and outcomes.10,11
In this study, we first conducted MR analysis on 41 inflammatory factors to identify potential causal relationships with osteosarcoma. We then used scRNA-seq data to explore the expression patterns of these factors in various immune cell types. Subsequently, we performed MR analysis on immune cell characteristics to identify causal relationships with osteosarcoma. Furthermore, immune cell infiltration in osteosarcoma transcriptomic data was assessed, and the relationship between immune cell infiltration and CCL5 expression was explored. Finally, qPCR, cell proliferation, colony formation assays, and EdU assays were conducted to validate the proliferative capacity of osteosarcoma cells. These comprehensive analyses provide new insights into the genetic mechanisms linking osteosarcoma, immune cells, and cytokines.
Materials and Methods
Study Design
Our study first employed MR to investigate the relationship between immune cells, cytokines, and osteosarcoma. We then validated the positively associated immune cells and cytokines identified by MR using transcriptomic and single-cell analyses. Finally, we confirmed our findings through expression and functional experiments (Figure 1).
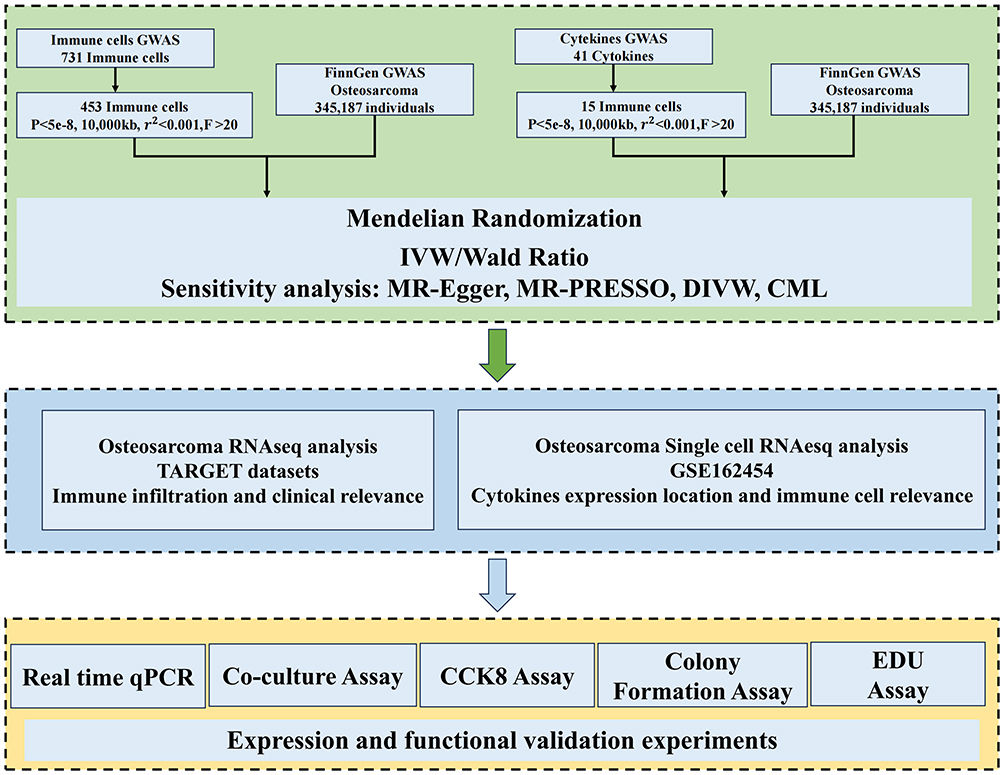 |
Figure 1 Flow chart of the study design. |
GWAS Data Acquisition for Osteosarcoma
The data for this study are from the FinnGen database, a large - scale Finnish population genomics project. It integrates genetic and health records of Finnish people to provide rich resources for disease research. We obtained the data set named “finngen_R11_C3_OSTEOSARCOMA_EXALLC” from it. This data set contains genetic information related to osteosarcoma.12
Immune Cell GWAS Data Acquisition
In this study, we obtained GWAS data for 731 immune cell types from the SardiNIA cohort study conducted on the Italian island of Sardinia. This cohort comprises 3757 individuals, aged between 18 and 102 years, with a roughly balanced gender distribution. Our analysis focused on 731 immune phenotypes, adjusting for covariates such as age and gender. These phenotypes encompass a variety of immune cell subsets, including T cells, B cells, dendritic cells, and monocytes. The dataset comprises absolute cell counts (n = 118), median fluorescence intensity levels of surface antigens (n = 389), morphological parameters (n = 32), and relative cell counts (n = 192).13,14
Cytokines GWAS Data Acquisition
In this study, we analyzed genetic associations with 41 inflammatory cytokines using data from 8293 Finnish participants involved in the Finnish Youth Cardiovascular Risk Study and the FINRISK study. Our analysis involved genetic adjustments for ten major components, including age, gender, and body mass index (BMI). Additionally, we employed genomic control to account for population stratification and cryptic relatedness, ensuring the precision and reliability of our findings. This comprehensive approach allowed us to delve into the genetic underpinnings of inflammatory cytokines and their potential role in cardiovascular health.15,16
Osteosarcoma Single-Cell Sequencing Data Acquisition
Single-cell Sequencing data were obtained from the TISCH database, which provides curated and preprocessed high-quality datasets. Specifically, we analyzed the OS_GSE162454 dataset. To ensure data quality and consistency, we performed additional preprocessing, including normalization and the removal of low-quality cells and lowly expressed genes.17
Selection Criteria for Instrumental Variants
In this study, we implemented a stringent selection process for instrumental variants (IVs) to ensure they are strongly associated with the exposure of interest and do not have a direct association with the outcome. We applied a significance threshold of p < 5×10⁻⁸ to filter for SNPs that exhibit a significant relationship with the exposure. Additionally, we performed linkage disequilibrium (LD) pruning to ensure the independence of the selected IVs. Specifically, we set a r2 threshold of less than 0.001 and clumped within a 10,000 kb window to identify and exclude closely linked SNPs that might confound the interpretation of results. By employing these methods, we aimed to select a set of genetic variants that are both strongly related to the exposure and not directly associated with the outcome variable, thereby providing a solid foundation for the MR analysis.18,19
Mendelian Randomization Analysis
In the present study, we embarked on a comprehensive Mendelian Randomization analysis to delve into the causal interplay between 731 distinct immune cell types and 41 distinct inflammatory factors. Our analytical arsenal included a suite of methods: the inverse variance weighted (IVW) approach, MR-Egger regression, the weighted median, the weighted mode (WM), the Constrained maximum likelihood (CML), and the Wald ratio method. Through the rigorous application of this diverse array of methods, we have been able to conduct a more nuanced and robust assessment of the potential causal nexus between immune cells and inflammatory factors. For exposures with IVs of 1, we used CML as the final judgment criterion, and for exposures with IVs greater than 1, we used IVW as the final judgment.20
Sensitivity Analysis
In this study, we conducted a comprehensive sensitivity analysis to validate the robustness of our MR findings. The analysis included heterogeneity testing, pleiotropy testing, directional testing, leave-one-out analysis, and funnel plot analysis.21
We performed heterogeneity testing that assesses the consistency of the effect estimates across different genetic instruments. We used the Cochran’s Q test and the I2 statistic to quantify the degree of heterogeneity among the genetic variants.
To check for pleiotropy, where genetic variants might affect multiple traits, we analyzed the data. We used the Steiger test, which is a method to detect pleiotropy by comparing the results of MR analysis with those obtained from a pleiotropy-corrected approach.
Directional testing assesses whether the effect of the genetic variant on the exposure is in the expected direction. A significant result from this test indicates that the genetic effect is consistent with the expected direction of causality.
Leave-One-Out analysis method involves iteratively removing one genetic variant at a time and recalculating the MR estimate to assess the influence of each variant on the overall result. The stability of the results across these iterations indicates the robustness of the MR findings.
Funnel plot analysis is used to detect publication bias or small-study effects in MR studies. We plotted the precision (inverse of the standard error) against the effect size (log odds ratio) for each genetic variant. The symmetrical distribution of points around the vertical line of no effect suggests that there is no significant publication bias.
These sensitivity analyses collectively provide a rigorous assessment of the robustness and reliability of our MR findings, ensuring that our conclusions are not unduly influenced by outliers, pleiotropic effects, or publication bias.
Single-Cell Data Analysis
This study employs Uniform Manifold Approximation and Projection (UMAP) to reduce high - dimensional single - cell data to a two - dimensional heatmap for in - depth exploration of cell characteristics and functions. As an efficient nonlinear dimensionality reduction method, UMAP effectively retains data topology, enabling precise identification of clusters and patterns in the dataset. Based on specific gene expression, cells are categorized into positive and negative groups, and the proportion of different cell types in each group is calculated to assess the distribution differences of the gene across cell types.22
Immunological Analysis
Osteosarcoma transcriptome sequencing and clinical data were retrieved from the TARGET database. After quality control of the raw transcriptome data and preprocessing of the clinical data to extract relevant clinical features (age, gender, pathological stage, etc), the CIBERSORT algorithm was applied to analyze immune infiltration,23 estimating the relative proportions of 22 immune cell types. The resulting data were visualized via heatmaps and grouped boxplots using the ggplot2 package. Additionally, Spearman rank correlation analysis was conducted to assess the relationship between immune cell infiltration levels and CCL5 expression. We also analyzed a panel of common immune checkpoint genes and generated radar plots. All analyses were performed in the R 4.2.2 environment, with statistical significance set at P < 0.05.
Cell Culture
The OS cell lines (K7M2 cell) was obtained from the American Type Culture Collection (ATCC). The cells were maintained in Dulbecco’s modified Eagle’s medium (DMEM) at 37 °C in a humidified atmosphere of 5% CO2. Media was supplemented with 10% fetal bovine serum (FBS), 100 IU/mL penicillin, and 100 mg/mL streptomycin.
qPCR
Total RNA was extracted from cells or tissue samples using the RNA isolater (Vazyme, Jiangsu, China) and reverse transcribed into cDNA with the HiFiScript cDNA Synthesis Kit (CWBIO, Beijing, China). CCL5 expression levels were quantified by RT-qPCR using the UltraSYBR Mixture (CWBIO) on an ABI system (Thermo Fisher Scientific, MA, USA) under the following conditions: 95°C for 10 min, followed by 40 cycles of 95°C for 15s and 60°C for 1 min. β-actin served as the internal control for normalization. The primer sequences for CCL5 are as follows: CCL5-F: TTTGCCTACCTCTCCCTCG, CCL5-R: CGACTGCAAGATTGGAGCACT.
Cell Proliferation and Colony Formation Assays
Cell viability was assessed using the Cell Counting Kit-8 (Beyotime, China). For colony formation assays, 800–1500 osteosarcoma cells were seeded into each well of a 6-well plate and cultured in medium containing 10% fetal bovine serum (FBS) for 10–15 days. The colonies were then fixed with methanol and stained with 0.1% crystal violet. The number of colonies was counted using an inverted microscope.
EdU Assay
An EdU assay kit (Beyotime, China) was used to evaluate cell proliferation. Briefly, 1000 osteosarcoma cells were seeded into each well of a 12-well plate. After cell attachment, the medium was replaced with EdU-containing medium at a final concentration of 10–50 μM and incubated for 4 hours. The cells were then washed twice with PBS, fixed with 4% paraformaldehyde for 10–15 minutes, and permeabilized with 0.3% Triton X-100 for 10 minutes. Subsequently, the cells were incubated with the EdU reaction solution in the dark for 30 minutes. Finally, cell nuclei were counterstained with DAPI, and the cells were observed under a fluorescence microscope.
Result
Causal Relationship Between Cytokines and Osteosarcoma
We evaluated the causal relationship between the levels of 41 cytokines and osteosarcoma using MR and ultimately screened for one positive result, CCL5. CCL5 exposure was significantly associated with increased odds of disease using both the CML (Odds Ratio [OR] = 17.601, 95% Confidence Interval [CI] = 2.141–144.685, p = 0.008) and WR (OR = 15.149, 95% CI = 2.857–80.325, p = 0.001) methods (Figure 2A). Since the IVs of CCL5 are only 1 SNP, this avoids the problem of heterogeneity and pleiotropy, meanwhile, the results of the steiger test showed a correct causal relationship from CCL5 to osteosarcoma (Table S1-4).
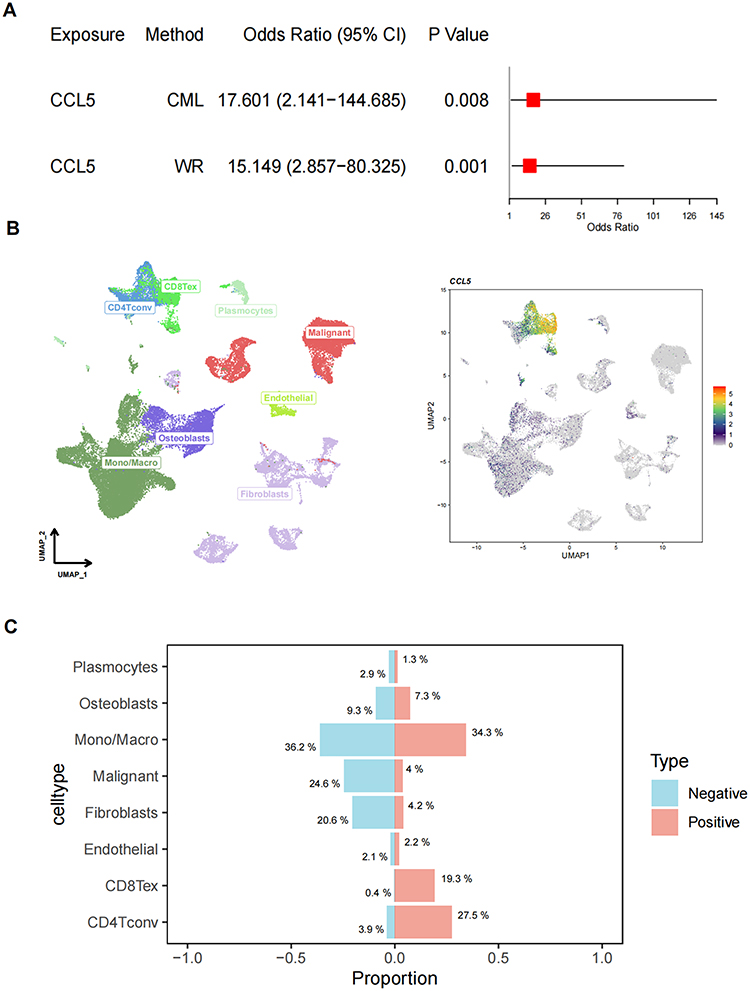 |
Figure 2 Inflammatory factors CCL5 in osteosarcoma. (A) Summary of Mendelian randomization analysis results; (B) UMAP visualization of single-cell RNA data; (C) Proportion of CCL5-positive and negative cells across different cell types. |
To further explore the cellular implications of CCL5, we performed scRNA-seq and visualized the data using UMAP (Figure 2B). The left panel displays distinct cell clusters, including CD8Tex, CD4Tconv, Plasmacytoid Dendritic Cells (Plasmocytes), Malignant cells, Endothelial cells, Osteoblasts, Monocytes/Macrophages (Mono/Macro), and Fibroblasts. The right panel highlights CCL5 expression across these cell types, with varying levels of expression indicated by color intensity.
The bar chart shows the proportion of CCL5-positive and negative cells within each cell type. Mono/Macro cells had the highest proportion of CCL5-positive cells at 34.3%, followed by Osteoblasts at 9.3% and Fibroblasts at 20.6%. In contrast, CD8Tex cells had the lowest proportion of CCL5-positive cells at 0.4%. These findings suggest that CCL5 expression varies significantly across different cell types, with certain cell types such as Mono/Macro cells and CD4Tconv potentially playing a more significant role in CCL5-mediated pathways (Figure 2C).
Causal Relationship Between Immune Cell Profile and Osteosarcoma
Although CCL5 was identified above as a risk factor for osteosarcoma and it is predominantly found in cells such as CD8 Tex, CD4 Tconv, and mono, the relationship between these cells and osteosarcoma is unclear, so we analyzed the causal associations between immune cells and osteosarcoma using 731 immune cell characteristics as exposure and osteosarcoma as outcome. We focused on CD8dim T cell (CD8Tex), CD4 T cell and monocyte characteristics to explore immune cell characteristics that are causally associated with osteosarcoma.
Ultimately, among the 16 kinds of CD8dim T cell characteristics, we identified one positive feature associated with osteosarcoma in a causal manner (Figure 3A). Specifically, the percentage of CD8+ and CD8dim T cells within leukocytes (CD8+ and CD8dim T cell %leukocyte) serves as a protective factor for osteosarcoma. The OR is 0.065 (95% confidence interval: 0.009–0.481), with a P-value of 0.008. Among the 59 kinds of monocyte characteristics (Figure 3B), we found that CD86 expression on monocytes has a positive causal relationship with osteosarcoma, indicating it as a risk factor. The P-value is 0.038, and the OR (95% confidence interval) is 9.900 (1.131–86.670). In the analysis of 71 kinds of CD4 T cell characteristics (Figure 3C), we discovered two positive cell characteristics associated with osteosarcoma in a causal way. The absolute count of terminally differentiated CD4+ T cells act as a protective factor, with a P-value of 0.017 and an OR (95% confidence interval) of 0.159 (0.035–0.724). In contrast, CD127 expression on CD28+ CD4+ T cells is a risk factor for osteosarcoma, with a P-value of 0.039 and an OR (95% confidence interval) of 3.374 (1.060–10.735) (Table 1).
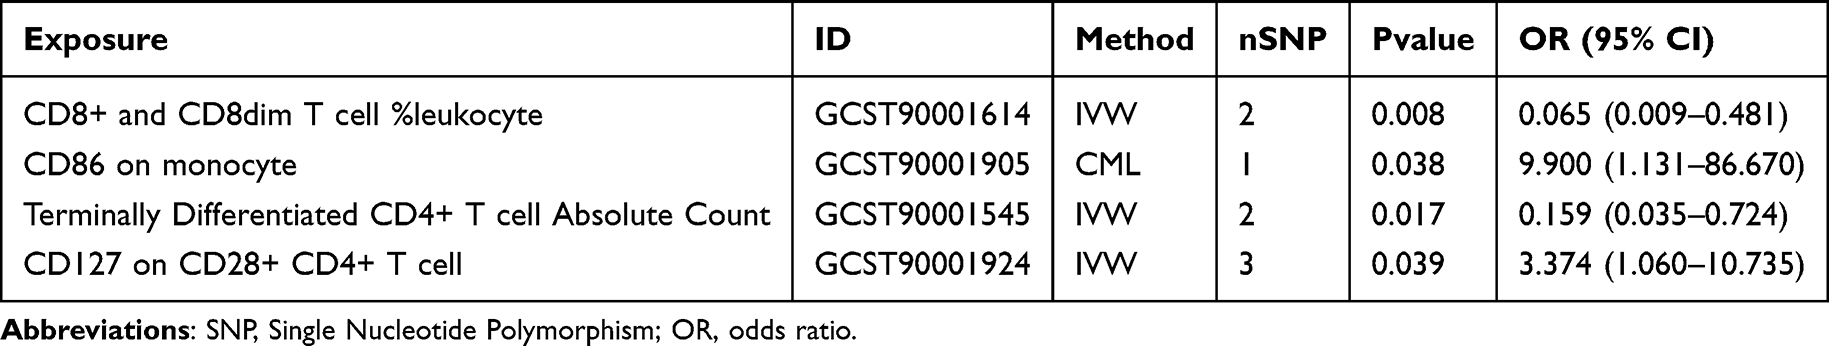 |
Table 1 MR Analysis of Immune Cells Characteristics to Osteosarcoma |
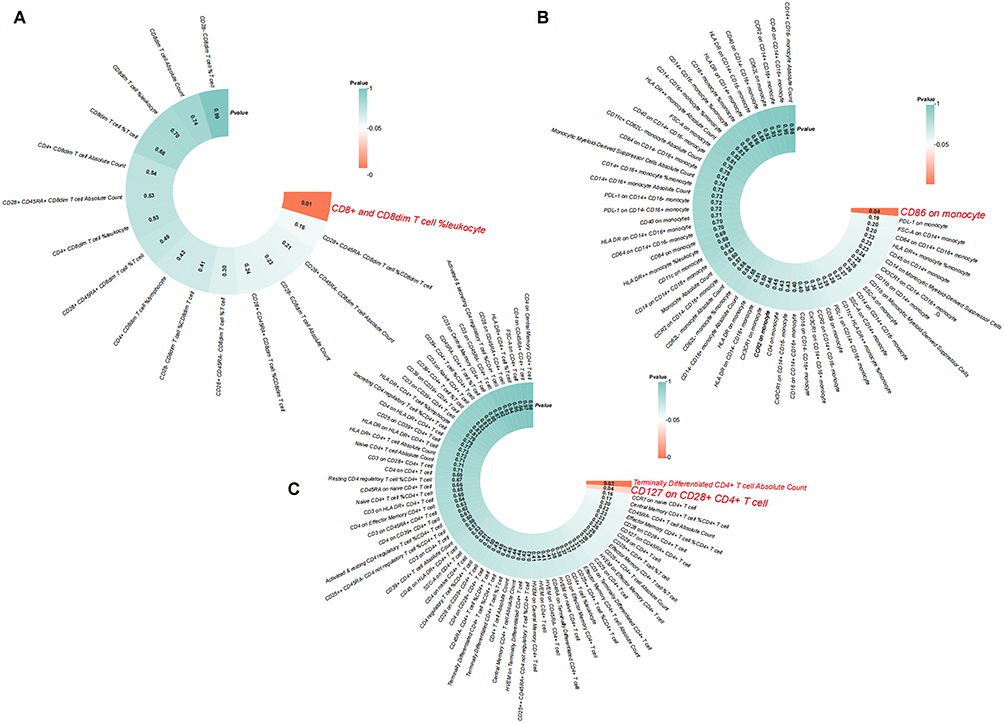 |
Figure 3 MR analysis of CD8dim T cells, CD4 T cells and monocyte characteristics to osteosarcoma. (A) MR analysis of CD8dim T cells characteristics to osteosarcoma; (B) MR analysis of CD4 T cells characteristics to osteosarcoma; (C) MR analysis of monocyte characteristics to osteosarcoma. |
Since there is only one SNP as IV for CD86 on monocyte, there is no heterogeneity and pleiotropy in its results, and the steriger test indicates that its causal direction with osteosarcoma found in this study is correct. For CD8+ and CD8dim T cell %leukocyte, Terminally Differentiated CD4+ T cell Absolute Count and CD127 on CD28+ CD4+ T cell, we performed a sensitivity analysis, and the results showed that none of them were heterogeneous, pleiotropic and the causal direction is correct (Table S4-8). The balance of IVs used in this paper is also further illustrated by the funnel plot and scatter plot, and the conclusions are robust (Figure 4).
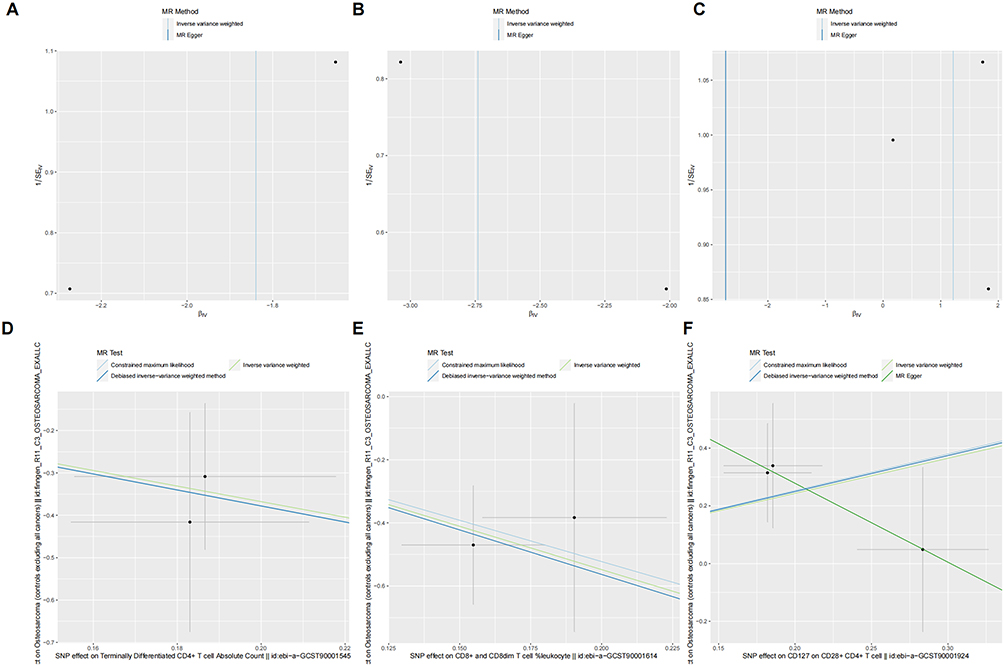 |
Figure 4 Sensitivity test of immune cells characteristics to osteosarcoma. (A–C) The funnel plot; (D–F) The scatter plot. |
Relationship Between CCL5 and Immune Cells
In the analysis of CCL5 expression in relation to CD127 expression within the CD127+ CD4 Tconv population, UMAP visualizations were utilized to explore the distribution and correlation of these markers. Notably, cells expressing higher levels of CD127 (green to red) are predominantly clustered in specific regions of the UMAP space, suggesting a potential spatial correlation with CCL5 expression. This visualization reveals a distinct pattern where cells with high CCL5 expression (red) are spatially associated with regions of high CD127 expression (green to red), indicating a positive correlation between these two markers within the CD127+ CD4 Tconv subset (Figure 5A).
 |
Figure 5 Relationship of CCL5 to CD127+ CD4Tconv and CD86+ mono/macro. (A) Relationship of CCL5 to the CD127 expression in CD127+ CD4Tconv; (B) Relationship of CCL5 to the CD86 expression in CD86+ mono/macro. |
Similarly, the relationship between CCL5 and CD86 expression was examined within the CD86+ mono/macrophage population. Cells expressing higher levels of CD86 (green to red) are clustered in specific regions, suggesting a potential spatial correlation with CCL5 expression. Cells with high CCL5 expression (red) are spatially associated with regions of high CD86 expression, indicating a positive correlation between these two markers within the CD86+ mono/macrophage subset.
In summary, the UMAP analyses demonstrate a significant spatial correlation between CCL5 and both CD127 and CD86 expression within their respective cell populations, suggesting potential functional interactions or regulatory mechanisms linking these markers (Figure 5B).
High Expression of CCL5 is Associated with Tumor Immune Microenvironment Variation and Clinical Grades
Tumor progression in osteosarcoma is closely related to multiple cells and molecules in the immune microenvironment, such as tumor - infiltrating lymphocytes, CD4 + T cells, and CD8 + T cell expression levels. Immunotherapy targeting the immune microenvironment has become a hot topic in osteosarcoma treatment. Immune checkpoint inhibitors can block immunosuppressive signals and boost anti - tumor immunity. Analyzing the correlation between immune checkpoints and immune cell infiltration can help explore the potential of such a model to guide immunotherapy, predict radio resistance, and assess prognosis.
In our study, patients were divided into high - and low - CCL5 expression groups based on CCL5 expression in different samples. Immune cell infiltration analysis showed that CCL5 expression was linked to CD8 + T cells (p < 0.01), Treg cells (p < 0.01), M1 macrophages (p < 0.001), activated dendritic cells (p < 0.05), and M0 macrophages (p < 0.01) (Figure 6A and B). CCL5 expression was positively correlated with CD8 + T cells (R = 0.441) (Figure 6C), Treg cells (R = 0.346) (Figure 6D), and M1 macrophages (R = 0.425) (Figure 6E), but negatively correlated with M0 macrophages (R = −0.440) (Figure 6F) and activated dendritic cells (R = −0.243) (Figure 6G). This indicates a close connection between CCL5 expression and immune system activation. Also, using the Spearman test, we found that CCL5 expression was related to CD226 (R = 0.402, p < 0.001) (Figure S1A and B). Furthermore, CCL5 expression was associated with clinical features of osteosarcoma, and its high expression was positively correlated with tumor malignancy. Thus, CCL5 can be an important molecular marker for predicting patient condition (Figure S1C).
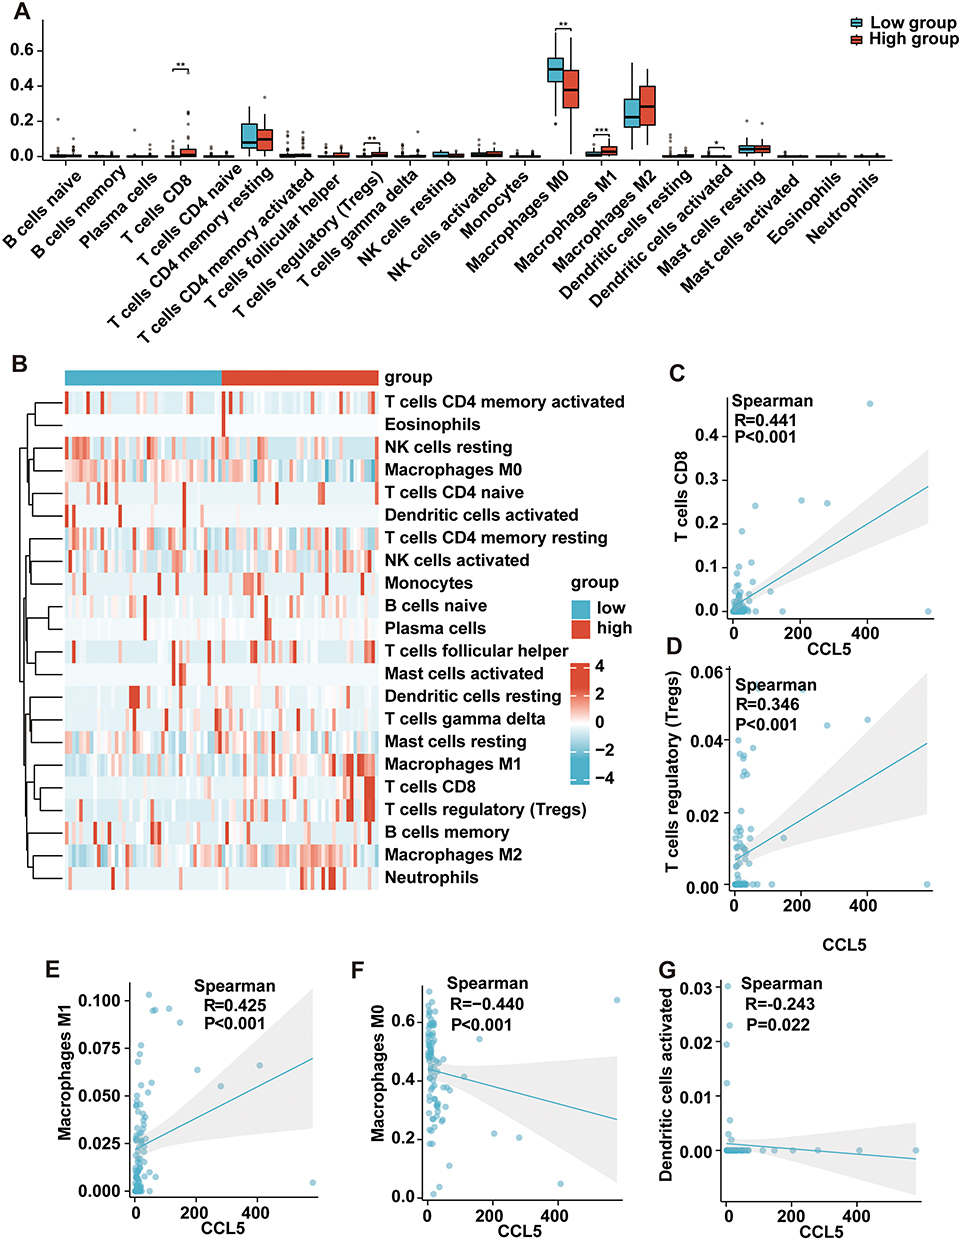 |
Figure 6 Correlation of CCL5 with Tumor-Associated Macrophages in Osteosarcoma and Its Prognostic Implications. (A) Box plots of immune cell infiltration analysis in different CCL5 expression groups. (B) Heatmap of immune cell infiltration analysis in different CCL5 expression groups. (C) Correlation analysis of CCL5 with CD8+ T cells. (D) Correlation analysis of CCL5 with Treg cells. (E) Correlation analysis of CCL5 with M0 macrophages. (F) Correlation analysis of CCL5 with M1 macrophages. (G) Correlation analysis of CCL5 with activated dendritic cells. |
Demonstration of High CCL5 Expression in Tumor-Associated Macrophages and Their Promotion of Osteosarcoma Progression
In this study, we conducted co-culture experiments with macrophages and osteosarcoma cells. We found that CCL5 protein was highly expressed in tumor-associated macrophages (Figure 7A and B) through the co-culture process, which is consistent with the results of our previous bioinformatics analysis. Subsequently, we performed CCK-8 and EdU assays to assess the activity of osteosarcoma cells in different groups. The results showed that K7M2 cells co-cultured with tumor-associated macrophages exhibited significantly higher viability (Figure 7C and D). Moreover, colony formation assays demonstrated that K7M2 cells co-cultured with tumor-associated macrophages exhibited more rapid growth and higher malignancy (Figure 7E and F). These findings confirm our hypothesis that high expression of CCL5 in tumor-associated macrophages promotes the progression of osteosarcoma cells.
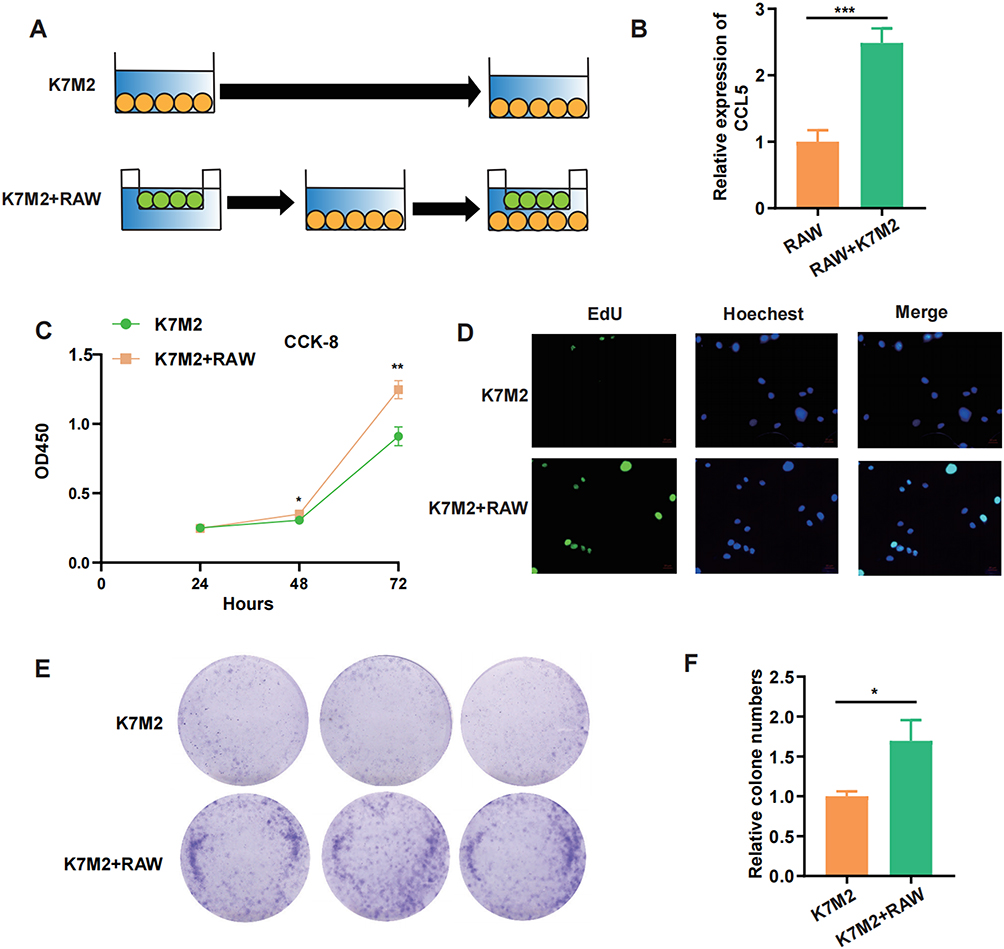 |
Figure 7 High Expression of CCL5 in Tumor-Associated Macrophages and Its Role in Osteosarcoma Progression. (A) Schematic diagram of the cell co-culture model. (B) High expression of CCL5 in tumor-associated macrophages co-cultured with K7M2 cells. (C) CCK-8 assay showing increased viability of K7M2 cells co-cultured with tumor-associated macrophages. (D) EdU assay showing increased viability of K7M2 cells co-cultured with tumor-associated macrophages. (E and F) Colony formation assays demonstrating increased viability of K7M2 cells co-cultured with tumor-associated macrophages. *, P < 0.05, **, p < 0.01, ***, p < 0.001. |
Discussion
Our study demonstrates that CCL5 plays a crucial role in the progression of osteosarcoma and in the immune microenvironment. MR analysis revealed a significant causal relationship between CCL5 exposure and increased risk of osteosarcoma, with varying expression levels across different cell types, particularly in monocytes/macrophages. Our study also identified causal associations between immune cell characteristics, such as CD8dim T cells and CD86 expression on monocytes, and osteosarcoma. High CCL5 expression was linked to immune cell infiltration and tumor malignancy. Furthermore, co-culture experiments confirmed that high CCL5 expression in tumor-associated macrophages promotes osteosarcoma progression by enhancing cell viability and colony formation. These findings suggest that CCL5 could serve as an important molecular marker for predicting patient prognosis and guiding immunotherapy strategies in osteosarcoma treatment.
The discovery of four causal relationships involving immune cell characteristics (CD86 on monocytes, CD127 on CD28+ CD4+ T cells, CD8+ and CD8dim T cell percentages, and terminally differentiated CD4+ T cell counts) provides a detailed understanding of the immune microenvironment in osteosarcoma. These findings suggest that targeting specific immune cell markers could be a promising strategy for treating osteosarcoma. The spatial correlation between CCL5 and CD127/CD86 in their respective cell populations, as revealed by scRNA-seq data, underscores the importance of spatial context in understanding the interactions between inflammatory factors and immune cells. This spatial analysis provides a more nuanced view of the immune microenvironment.24
CD86 is a key co-stimulatory molecule expressed on antigen-presenting cells (APCs) such as monocytes.25–27 It interacts with CD28 on T cells to provide a co-stimulatory signal essential for T cell activation. In the context of osteosarcoma, elevated CD86 expression on monocytes may enhance T cell activation, potentially promoting tumor progression.28 However, CD86 also plays a role in regulatory T cell (Treg) homeostasis, suggesting a complex interplay between pro- and anti-tumor immune responses.29 CD127 is the receptor for interleukin-7 (IL-7),30 which is critical for T cell survival and proliferation. CD28+ CD4+ T cells are effector T cells that play a crucial role in immune responses.31 The combination of CD127 and CD28 on CD4+ T cells suggest a subset of T cells that are highly responsive to IL-7 and co-stimulatory signals, which may contribute to the immunomodulatory environment in osteosarcoma.32
Our study still has some shortcomings. Clinical validation across disease stages and metastatic statuses, as well as integrative analyses correlating CCL5-related interactions with patient prognosis and immune infiltration profiles remain to be addressed. The sample sizes used for our MR analyses and scRNA-seq study may limit the generalizability of our findings. In particular, the MR component draws predominantly on European-ancestry cohorts, and the resulting inferences may not fully extrapolate to other populations. Replication in larger cohorts is necessary to validate identified causal relationships and ensure robustness of results. Although our study provides strong evidence for the involvement of CCL5 and immune cell characteristics in osteosarcoma, the underlying mechanisms require further investigation, as co-expression and spatial proximity do not establish direct regulation of CD127/CD86 by CCL5. We did not perform perturbational or in-vivo validation and lacked a longitudinal cohort with standardized treatment-response endpoints; thus, causality and predictive value remain unresolved. The exploratory clinical-stage analysis in the Supplementary Materials is constrained by sparse, heterogeneous staging data and requires external validation. Future studies should focus on functional assays and in vivo modeling to validate causality and explore molecular mechanisms. The immune microenvironment of osteosarcoma is highly heterogeneous. Future studies should explore the role of other immune cell types and signaling pathways for a more comprehensive understanding of the immune microenvironment.
Conclusion
Our study highlights the importance of the immune microenvironment in osteosarcoma and identifies CCL5 and specific immune cell characteristics as potential therapeutic targets. The integration of multiple analytical techniques provides a robust framework for future research. However, further validation and mechanistic studies are needed to fully understand the implications of these findings for clinical practice.
Ethics Approval and Consent to Participate
The Institutional Ethics Committee reviewed the protocol and granted an exemption (Number 2025KLL204).
Consent for Publication
All authors read the guidelines of the journal and agreed with consent for publication.
Acknowledgments
We gratefully acknowledge all public databases and the respective authors who provided the original data for analysis.
Author Contributions
All authors made a significant contribution to the work reported, whether that is in the conception, study design, execution, acquisition of data, analysis and interpretation, or in all these areas; took part in drafting, revising or critically reviewing the article; gave final approval of the version to be published; have agreed on the journal to which the article has been submitted; and agree to be accountable for all aspects of the work.
Funding
This research received financial support from the Construction Fund of Medical Key Disciplines of Hangzhou. (No. 2020SJZDXK004).
Disclosure
The authors declare no competing interests.
References
1. Cersosimo F, Lonardi S, Bernardini G, et al. Tumor-associated macrophages in osteosarcoma: from mechanisms to therapy. Int J Mol Sci. 2020;21(15):5207. doi:10.3390/ijms21155207
2. Adewuyi E, Chorya H, Muili A, et al. Chemotherapy, immunotherapy, and targeted therapy for osteosarcoma: recent advancements. Crit Rev Oncol Hematol. 2025;206:104575. doi:10.1016/j.critrevonc.2024.104575
3. Chen C, Xie L, Ren T, et al. Immunotherapy for osteosarcoma: fundamental mechanism, rationale, and recent breakthroughs. Cancer Lett. 2021;500:1–14. doi:10.1016/j.canlet.2020.12.024
4. Yang K, Wu J, Xu T, et al. Machine learning to predict distant metastasis and prognostic analysis of moderately differentiated gastric adenocarcinoma patients: a novel focus on lymph node indicators. Front Immunol. 2024;15:1398685. doi:10.3389/fimmu.2024.1398685
5. Zhang L, Jiang H, Ma H. Progress in immune microenvironment, immunotherapy and prognostic biomarkers in pediatric osteosarcoma. Front Immunol. 2025;16: 1548527. doi:10.3389/fimmu.2025.1548527
6. Luo C, Min X, Zhang D. New insights into the mechanisms of the immune microenvironment and immunotherapy in osteosarcoma. Front Immunol. 2025;15: 1539696.
7. Anand N, Peh KH, Kolesar JM. Macrophage repolarization as a therapeutic strategy for osteosarcoma. Int J Mol Sci. 2023;24(3):2858. doi:10.3390/ijms24032858
8. Ding JT, Yang K-P, Zhou H-N, et al. Landscapes and mechanisms of CD8(+) T cell exhaustion in gastrointestinal cancer. Front Immunol. 2023;14:1149622. doi:10.3389/fimmu.2023.1149622
9. Li Z, Yin S, Yang K, et al. CircRNA regulation of T cells in cancer: unraveling potential targets. Int J Mol Sci. 2024;25(12):6383.
10. Chen B, Yan Y, Wang H, et al. Association between genetically determined telomere length and health-related outcomes: a systematic review and meta-analysis of Mendelian randomization studies. Aging Cell. 2023;22(7):e13874. doi:10.1111/acel.13874
11. Markozannes G, Kanellopoulou A, Dimopoulou O, et al. Systematic review of Mendelian randomization studies on risk of cancer. BMC Med. 2022;20(1):41. doi:10.1186/s12916-022-02246-y
12. Kurki MI, Karjalainen J, Palta P, et al. FinnGen provides genetic insights from a well-phenotyped isolated population. Nature. 2023;613(7944):508–518. doi:10.1038/s41586-022-05473-8
13. Li W, Xu J-W, Chai J-L, et al. Complex causal association between genetically predicted 731 immunocyte phenotype and osteonecrosis: a bidirectional two-sample Mendelian randomization analysis. Int J Surg. 2024;110(6):3285–3293. doi:10.1097/JS9.0000000000001327
14. Lu Y, Yao Y, Zhai S, et al. The role of immune cell signatures in the pathogenesis of ovarian-related diseases: a causal inference based on Mendelian randomization. Int J Surg. 2024;110(10):6541–6550. doi:10.1097/JS9.0000000000001814
15. Chen J, Xu F, Ruan X, et al. Therapeutic targets for inflammatory bowel disease: proteome-wide Mendelian randomization and colocalization analyses. EBioMedicine. 2023;89:104494. doi:10.1016/j.ebiom.2023.104494
16. Yeung CHC, Schooling CM. Systemic inflammatory regulators and risk of Alzheimer’s disease: a bidirectional Mendelian-randomization study. Int J Epidemiol. 2021;50(3):829–840. doi:10.1093/ije/dyaa241
17. Han Y, Wang Y, Dong X, et al. TISCH2: expanded datasets and new tools for single-cell transcriptome analyses of the tumor microenvironment. Nucleic Acids Res. 2023;51(D1):D1425–d1431. doi:10.1093/nar/gkac959
18. Sekula P, Del Greco M F, Pattaro C, et al. Mendelian randomization as an approach to assess causality using observational data. J Am Soc Nephrol. 2016;27(11):3253–3265. doi:10.1681/ASN.2016010098
19. Li Y, Sundquist K, Zhang N, et al. Mitochondrial related genome-wide Mendelian randomization identifies putatively causal genes for multiple cancer types. EBioMedicine. 2023;88:104432. doi:10.1016/j.ebiom.2022.104432
20. Birney E. Mendelian Randomization. Cold Spring Harb Perspect Med. 2022;12(4). doi:10.1101/cshperspect.a041302
21. Bowden J, Holmes MV. Meta-analysis and Mendelian randomization: a review. Res Synth Methods. 2019;10(4):486–496. doi:10.1002/jrsm.1346
22. Becht E, McInnes L, Healy J, et al. Dimensionality reduction for visualizing single-cell data using UMAP. Nat Biotechnol. 2018. doi:10.1038/nbt.4314
23. Chen B, Khodadoust MS, Liu CL, Newman AM, Alizadeh AA. Profiling tumor infiltrating immune cells with CIBERSORT. Methods Mol Biol. 2018;1711:243–259.
24. Yang K, Zhang Y, Ding J, et al. Autoimmune CD8+ T cells in type 1 diabetes: from single-cell RNA sequencing to T-cell receptor redirection. Front Endocrinol. 2024;15:1377322. doi:10.3389/fendo.2024.1377322
25. Kennedy A, Waters E, Rowshanravan B, et al. Differences in CD80 and CD86 transendocytosis reveal CD86 as a key target for CTLA-4 immune regulation. Nat Immunol. 2022;23(9):1365–1378. doi:10.1038/s41590-022-01289-w
26. Girndt M, Sester M, Sester U, et al. Defective expression of B7-2 (CD86) on monocytes of dialysis patients correlates to the uremia-associated immune defect. Kidney Int. 2001;59(4):1382–1389. doi:10.1046/j.1523-1755.2001.0590041382.x
27. Pinto BF, Medeiros NI, Teixeira-Carvalho A, et al. CD86 expression by monocytes influences an immunomodulatory profile in asymptomatic patients with chronic chagas disease. Front Immunol. 2018;9:454. doi:10.3389/fimmu.2018.00454
28. Muraro M, Mereuta OM, Saglio F, et al. Interactions between osteosarcoma cell lines and dendritic cells immune function: an in vitro study. Cell Immunol. 2008;253(1–2):71–80. doi:10.1016/j.cellimm.2008.05.002
29. Frijlink E, Bosma DMT, Busselaar J, et al. PD-1 or CTLA-4 blockade promotes CD86-driven Treg responses upon radiotherapy of lymphocyte-depleted cancer in mice. J Clin Invest. 2024;134(6). doi:10.1172/JCI171154.
30. Li X, Bechara R, Zhao J, et al. IL-17 receptor-based signaling and implications for disease. Nat Immunol. 2019;20(12):1594–1602. doi:10.1038/s41590-019-0514-y
31. Fenoglio D, Dentone C, Signori A, et al. CD8(+)CD28(-)CD127(lo)CD39(+) regulatory T-cell expansion: a new possible pathogenic mechanism for HIV infection? J Allergy Clin Immunol. 2018;141(6):2220–2233.e4. doi:10.1016/j.jaci.2017.08.021
32. Hui X, Farooq MA, Chen Y, et al. A novel strategy of co-expressing CXCR5 and IL-7 enhances CAR-T cell effectiveness in osteosarcoma. Front Immunol. 2024;15:1462076. doi:10.3389/fimmu.2024.1462076
 © 2026 The Author(s). This work is published and licensed by Dove Medical Press Limited. The
full terms of this license are available at https://www.dovepress.com/terms
and incorporate the Creative Commons Attribution
- Non Commercial (unported, 4.0) License.
By accessing the work you hereby accept the Terms. Non-commercial uses of the work are permitted
without any further permission from Dove Medical Press Limited, provided the work is properly
attributed. For permission for commercial use of this work, please see paragraphs 4.2 and 5 of our Terms.
© 2026 The Author(s). This work is published and licensed by Dove Medical Press Limited. The
full terms of this license are available at https://www.dovepress.com/terms
and incorporate the Creative Commons Attribution
- Non Commercial (unported, 4.0) License.
By accessing the work you hereby accept the Terms. Non-commercial uses of the work are permitted
without any further permission from Dove Medical Press Limited, provided the work is properly
attributed. For permission for commercial use of this work, please see paragraphs 4.2 and 5 of our Terms.
Recommended articles
A Human Whole Blood Culture System Reveals Detailed Cytokine Release Profiles of Implant Materials
Klimosch SN, Weber M, Caballé-Serrano J, Knorpp T, Munar-Frau A, Schaefer BM, Schmolz M
Medical Devices: Evidence and Research 2024, 17:23-36
Published Date: 5 January 2024
Urolithin-C Suppresses Inflammation by Blocking NF-κB Signaling Pathway in LPS-Induced RAW 264.7 Macrophages

Manjappa VK, Venkatappa MM, Urs D, Basavarajaiah SM, Venkataramaiah S, Mahendranathsingh SBS, Mohan S, Pushpavathi HR, Krishnappa DK, Sannaningaiah D
Journal of Inflammation Research 2025, 18:12463-12483
Published Date: 9 September 2025