Back to Journals » Diabetes, Metabolic Syndrome and Obesity » Volume 16
Causal Paradigm Between Common Comorbidities of Cardiovascular and Metabolism-Related Diseases in Elderly: Evidence from Cross-Sectional and Mendelian Randomization Studies
Authors Gu J, Wang Q, Wu X, Zhang H, Wu C, Qiu W
Received 22 June 2023
Accepted for publication 19 September 2023
Published 22 September 2023 Volume 2023:16 Pages 2953—2966
DOI https://doi.org/10.2147/DMSO.S427103
Checked for plagiarism Yes
Review by Single anonymous peer review
Peer reviewer comments 4
Editor who approved publication: Professor Gian Paolo Fadini
Junwang Gu,* Qi Wang,* Xuanhui Wu, Han Zhang, Chunmei Wu, Wei Qiu
School of Public Health and Health Management, Gannan Medical University, Ganzhou, Jiangxi Province, 341000, People’s Republic of China
*These authors contributed equally to this work
Correspondence: Wei Qiu; Chunmei Wu, Tel/Fax +86-7978169236, Email [email protected]; [email protected]
Background: Comorbidity is a common problem among elderly people, significantly damaging individuals’ health and healthcare systems. However, observational studies may be susceptible to residual confounding factors and bias. The present study aimed to assess the causal effect of common chronic disease comorbidity using the Mendelian randomization (MR) approach.
Methods: Data for the present study were obtained from a community survey conducted between 2018 and 2020 in four counties in Ganzhou City, southern China. A cross-sectional survey was conducted using a multi-stage stratified random sampling method. A total of 1756 valid questionnaires were collected to analyze common chronic disease comorbidities. Genetic variants associated with hypertension, diabetes, stroke, and hyperlipidemia-related factors were selected as instrumental variables for univariate and multivariate MR analyses.
Results: The self-reported prevalence of chronic disease in the older adult population in Southern China was 68.1%, with hypertension (46.1%), diabetes (10.5%), and hyperlipidemia (8.5%) being the three most common conditions. The prevalence of chronic disease comorbidity was 20.7% among the 12 chronic diseases studied. Hypertension was identified as a predictor of diabetes (OR [95% CI]: 1.114 [1.049, 1.184], p < 0.001), and diabetes mellitus was equally identified as a risk factor for hypertension (OR [95% CI]: 1.118 [1.069, 1.187], p < 0.001). Furthermore, high triglyceride levels were identified as a risk factor for hypertension (OR [95% CI]: 1.262 [1.129, 1.411], p < 0.001). In contrast to intracranial hemorrhages, hypertension had a significant impact on ischemic stroke (OR [95% CI]: 1.299 [1.161, 1.454], p < 0.001).
Conclusion: The causal association between multiple cardiovascular and metabolism-related diseases is mediated by hypertension, with a bidirectional cause-and-effect relationship between hypertension and diabetes. Hypertension is a risk factor for ischemic stroke, and the hyperlipidemia-related factor triglycerides (TG) influence hypertension. Therefore, prioritizing hypertension prevention and control in the elderly is critical for effective chronic disease management.
Keywords: hypertension, diabetes, hyperlipidemia, stroke, causal, mendelian randomization
Introduction
Chronic diseases, also known as non-communicable chronic diseases (NCDs), are a group of diseases caused by a combination of genetic, physiological, environmental, and behavioral factors. They have an insidious onset, a long course, and no clear etiology. Chronic diseases are major killers in the modern era, accounting for most healthcare expenditures. They are also increasingly becoming a health burden in lower- and middle-income countries, putting pressure on public health efforts to scale up interventions.1,2
Multimorbidity or comorbidities, the coexistence of two or more chronic diseases, is a common problem in the elderly and is significantly associated with increased mortality, disability, and functional decline.3,4 Information on chronic disease interactions can help diagnose and prevent.5 The link between these diseases is complex and is mediated by common risk factors, notably smoking and physical inactivity.6 A cross-sectional study revealed that having one cardiovascular disease (CVD) increased the risk of co-occurring CVD and many other chronic diseases. However, the etiology of chronic disease comorbidities remains unknown. Given the high incidence and prevalence of chronic disease comorbidity, the assumption that chronic diseases are mutually causal appears acceptable However, because of the difficulty in designing such longitudinal studies, such causal relationships have rarely been investigated. Despite the rigorous design and analysis of traditional observational epidemiological studies, it remains challenging to exclude confounding factors, and there are shortcomings in clarifying causality when arguing for causality in complex diseases such as chronic diseases.7 Randomized controlled trials (RCTs) are the most effective method for proving the etiological hypothesis in epidemiological studies because they can minimize potential biases in clinical trial design and implementation, balance confounding factors, and improve statistical test validity.8 Nevertheless, it is not easy to implement widely because of ethical concerns, high costs, and time required.8 Therefore, this study used Mendelian randomization (MR) to overcome the limitations of traditional studies.
MR is a statistical approach that uses single-nucleotide polymorphisms (SNPs) as instrumental variables (IVs) to determine the relationship between risk factors and disease outcomes. MR can significantly reduce the risk of confounding and reverse causation, which are shortcomings of conventional epidemiological studies.9 The present study aims to investigate the causal relationship between common chronic disease comorbidities. To achieve this objective, we obtained data from a community survey of chronic diseases among older adults in southern China to identify common disease comorbidities. Subsequently, we used public summary data from a genome-wide association study (GWAS) to conduct an MR study to investigate causal associations among chronic diseases. The findings of the present study may contribute to improving the understanding of the development and causal relationships of chronic disease comorbidity, thereby increasing the value of chronic disease prevention and management.
Materials and Methods
Participants
A multistage stratified random sampling method was used to conduct cross-sectional community surveys between 2018 and 2020 in Ganzhou City, southern China, to collect self-reported data on chronic diseases of the elderly through questionnaires.
The investigation area for this study comprised four county-level districts, namely Zhanggong, Ganxian, Nankang, and Xinfeng districts in Ganzhou City, as illustrated in Figure S1. The study targeted permanent residents aged 18 years and above who had resided in the area for at least six months. The survey was conducted in collaboration with the township health center under the guidance of the related county Health Commission and was organized by the Centers for Disease Control and Prevention (CDC). The program design, on-site investigation, and residents’ health examinations were all conducted under the auspices of these entities. After eliminating questionnaires with significant errors, such as duplicate and unreliable questionnaires, 1756 valid questionnaires were collected from older respondents.
Definitions
The present study includes twelve types of chronic diseases, and respondents were defined as chronic disease comorbidities if they had been diagnosed with two or more.
The risk ratios (RR) and observed-to-expected ratios (O/E) of comorbidity indicators between diseases were used to calculate the correlation.10 The RR value for a chronic disease indicates the likelihood of a comorbid person suffering from a specific chronic disease compared with non-comorbid persons. This is equal to the prevalence of comorbid patients divided by the prevalence of non-comorbid patients. A higher RR value indicates that there are more comorbidities than non-comorbidities and that the disease is more likely to coexist with other diseases. However, there is no direct relationship between comorbidity risk and prevalence.
The O/E ratio was calculated to estimate conditional probabilities of combinations of two chronic conditions and is equal to the ratio of observed and expected prevalence of co-modality. The predicted prevalence of co-modality is the product of the respective prevalence of chronic diseases included in the co-modality.
MR Study
GWAS Summary Data
All GWAS summary statistics used in the current MR study were obtained from the IEU Open GWAS Project summary datasets (https://gwas.mrcieu.ac.uk/). Because we only analyzed publicly available summary-level GWAS data, the MR study was exempt from ethical review. Table 1 presents the detailed information.
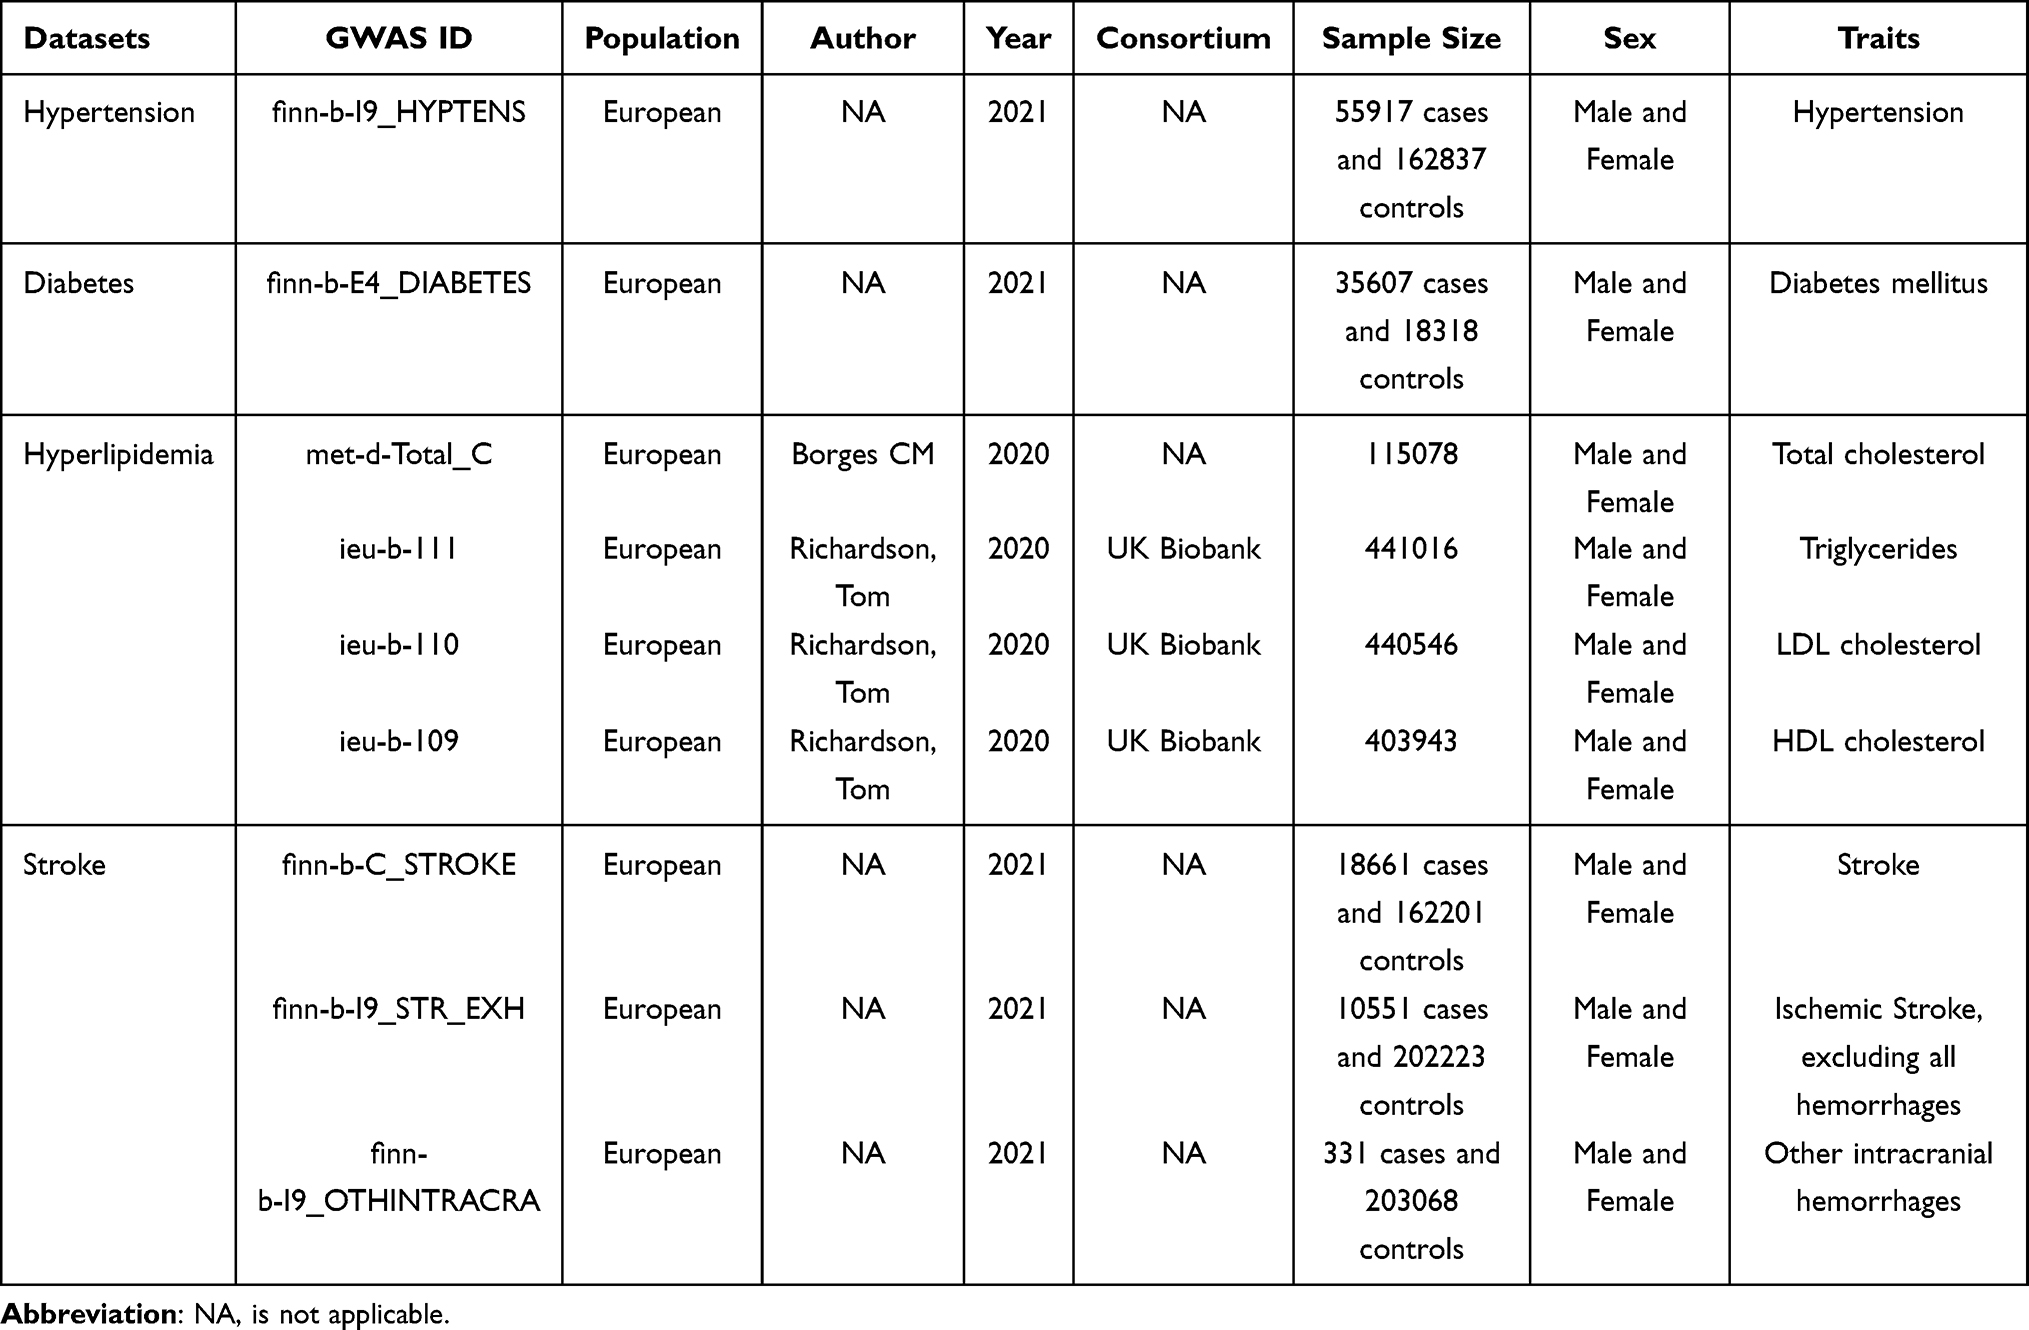 |
Table 1 Detailed Information on GWAS Datasets Used in This MR Study |
IVs Selection
The extracted genetic variants were selected as IVs to estimate causal effects in chronic diseases based on the following assumptions: (1) predictive of exposure variables, (2) independent of confounders, and (3) no change in outcome variables via an independent pathway other than exposure. We first used the SNPs associated with exposure variables at genome-wide significance (p < 5×10⁻⁸), then pruned for linkage disequilibrium (LD) (r2 < 0.001, distance < 10,000 kb) to obtain independent SNPs. The F statistic (F = beta2/se2) was used to evaluate the potency of the instrumental variable (IV) to avoid potentially weak instrumental bias. A value of F greater than ten indicates a strong correlation between IV and exposure, protecting the MR analysis results from the effects of weak instrumental bias.11,12 Each exposure-associated SNP was then examined for potential Assumptions 2 and 3 violations using GWAS database. SNPs associated with known risk factors for the outcome variables were excluded from further investigation. A PhenoScanner V2 search was performed to identify confounding phenotypes related to the selected IVs.13,14 The remaining SNPs were aggregated with GWAS outcome variable database, removing those not included in the outcome variable database. Palindromic SNPs with intermediate allele frequencies (MAF threshold = 0.3) were removed. The MRORESSO test also removes SNPs with potentially pleiotropic outliers.15 Figure 1 depicts the SNPs selection process for the univariate MR study.
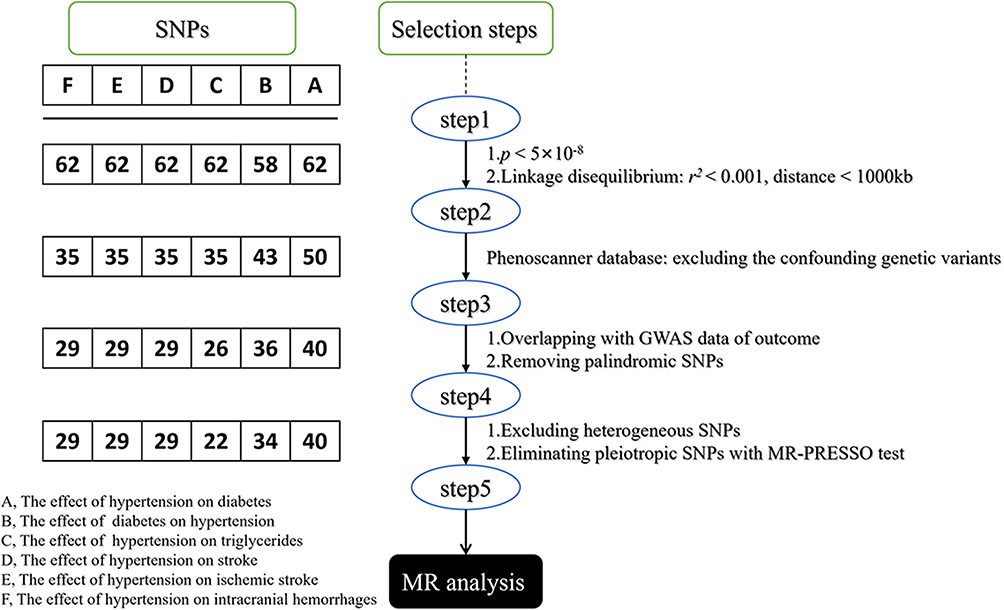 |
Figure 1 IVs selection flow. Abbreviations: MR, Mendelian Randomization; LD, Linkage disequilibrium, SNPs, Single nucleotide polymorphisms. |
Statistical Analysis
As the primary MR method in this two-sample MR analysis, we used the inverse variance weighted (IVW) method implemented in the TwoSampleMR R package. If the selected SNPs meet IV assumptions, this method provides the most reliable causal assessment and has the highest statistical power.16 We then performed sensitivity analyses using MR-Egger, weighted median, weighted mode, simple mode, and maximum likelihood methods to evaluate the robustness of the findings. The intercept of the MR-Egger regression method was used to measure the effect size of horizontal pleiotropy. The closer the intercept to zero, the smaller the horizontal pleiotropy, and p > 0.05 of the horizontal pleiotropy test was considered to indicate no horizontal pleiotropy.17 We also ran a leave-one-out sensitivity analysis to evaluate whether individual IVs drove the observed causal associations. Cochran’s Q statistical test was used to assess the presence of heterogeneity between the variant-specific estimates. All statistical analyses, including univariate and multivariate MR, were performed in R (version 4.2.3) using the package “TwoSampleMR” (version 0.5.6).18,19 Statistical significance was set at p < 0.05.
Results
Characteristics of Respondents
The demographic characteristics of the respondents are summarized in Table 2. Among the total sample, 830 (47.3%) were male, and 926 (52.7%) were female. Most of the respondents (98.7%) were Han Chinese. The sample had a mean age of 68.92 ± 7.41 years, with men having a mean age of 68.72 ± 6.87 years and women having a mean age of 69.10 ± 7.86 years. Only two (0.1%) respondents had an undergraduate or higher level of education. Most respondents (60.2%) were unemployed, jobless or retired. Approximately 38.5% of the respondents reported a monthly average income per capita of ≥ 1000 and < 3000 Yuan, while 23.6% reported an income of ≥ 3000 and < 5000 Yuan.
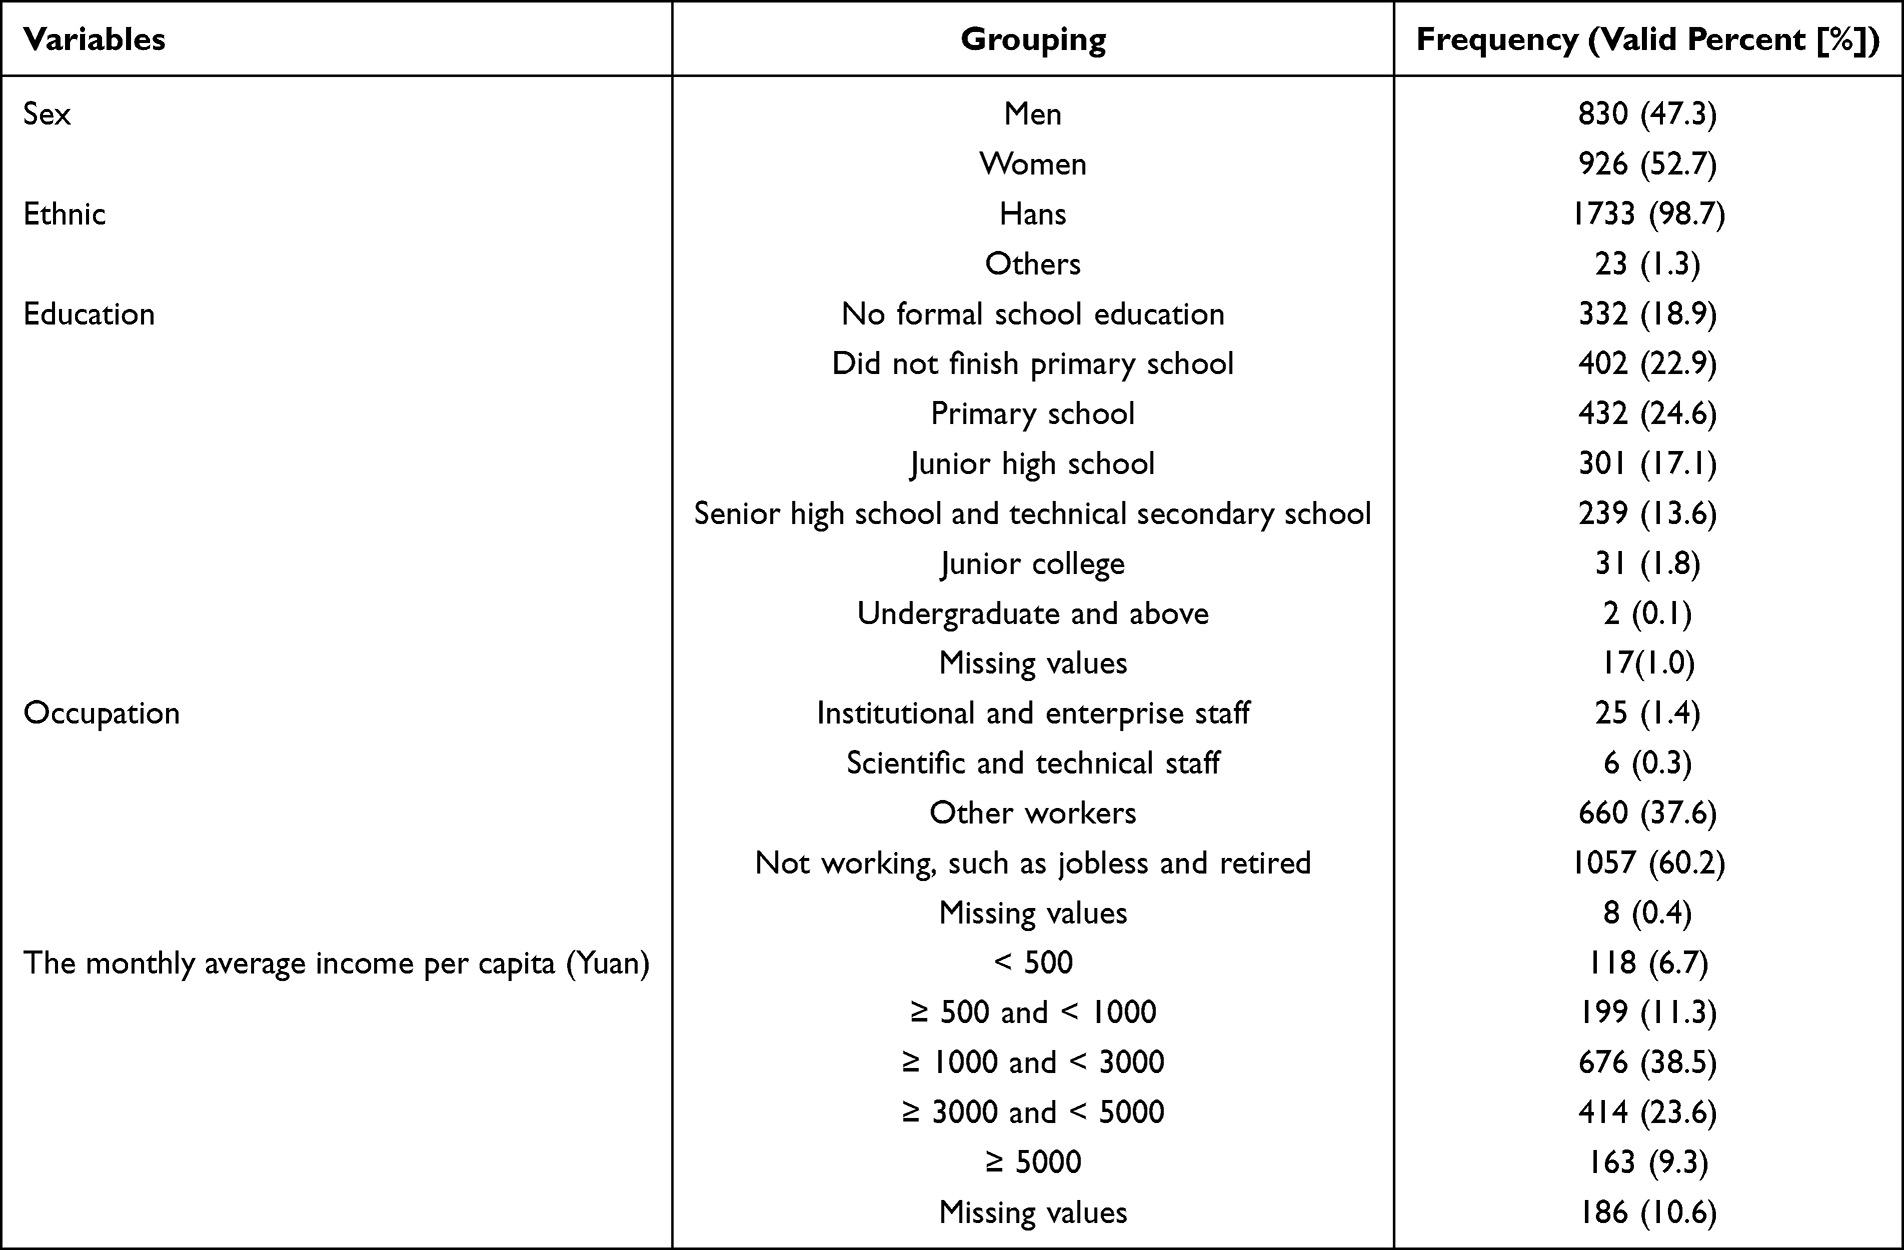 |
Table 2 Characteristics of Respondents |
Self-Reported Prevalence of Chronic Diseases Among the Elderly in Southern China
Of the 1756 participants, 1195 residents had at least one chronic disease, resulting in a self-reported prevalence of 68.1%. The prevalence rates of the 12 common chronic diseases in this survey were arranged in descending order (Figure 2), with hypertension having the highest prevalence rate (46.1%), followed by diabetes (10.5%), hyperlipidemia (8.5%), coronary artery disease (6.1%), chronic bronchitis (5.4%), osteoporosis (4.4%), stroke (2.8%), prostatic hypertrophy (1.9%), cataract (1.5%), malignant tumor (0.6%), mental illness (0.3%), and chronic hepatitis (0.3%).
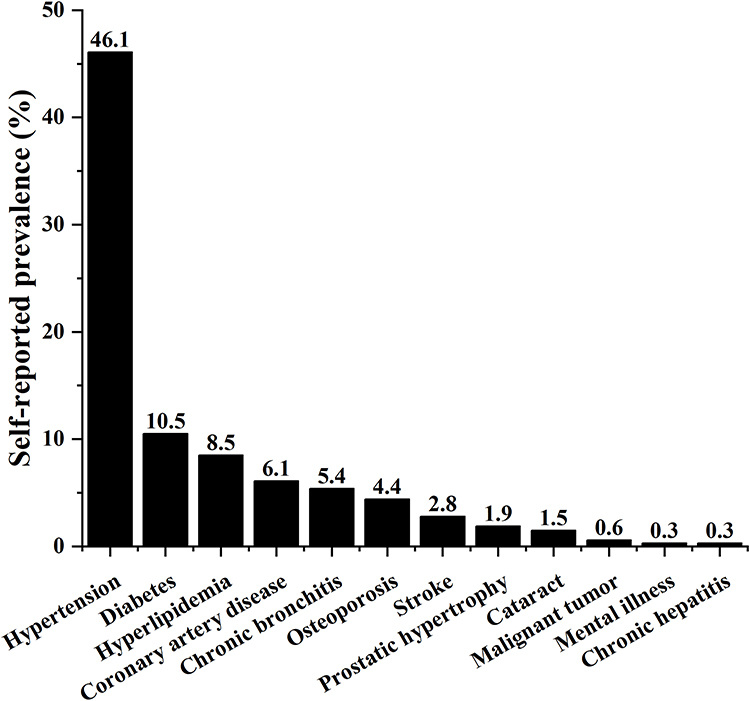 |
Figure 2 Self-reported prevalence of the chronic diseases. |
Chronic Disease Comorbidity in the Elderly
The present study examined the prevalence and pattern of chronic comorbidities in the elderly. The correlation among the components of chronic disease comorbidity was estimated by calculating the relative RR and O/E ratio of the comorbidity.
The survey included 12 chronic diseases, and the results indicated a prevalence of chronic disease comorbidity of 20.7% (364/1756), with 28 different types of dyad comorbidity (Figure 3). Among the 12 chronic diseases examined, the following conditions exhibited a heightened risk of comorbidity: hyperlipidemia (RR = 6.14), prostatic hypertrophy (RR = 5.60), stroke (RR = 3.90), coronary artery disease (RR = 3.28), diabetes (RR = 2.78), chronic bronchitis (RR = 1.79), osteoporosis (RR = 1.60), cataract (RR = 1.0), hypertension (RR = 0.68), chronic hepatitis (RR = 0.67), malignant tumor (RR = 0.57), and mental illness (RR = 0.25). Correlation analysis revealed that the dyad comorbidity with the highest O/E (4.837) was a malignant tumor and prostatic hypertrophy. Figure 3 depicts the prevalence and correlations of dyad chronic diseases of comorbidities.
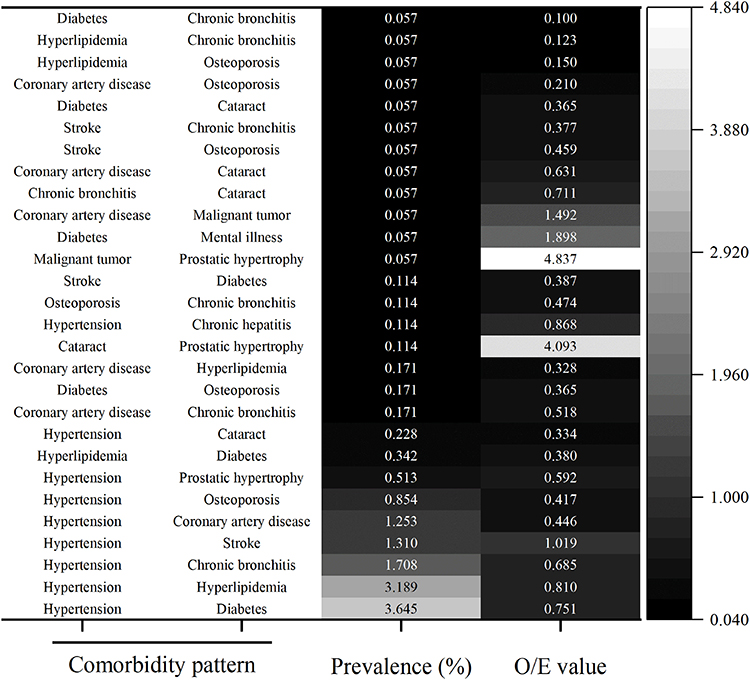 |
Figure 3 The prevalence and correlations of dyad chronic diseases comorbidities. The O/E ratio was calculated to estimate conditional probabilities of combinations of two conditions and is equal to the ratio of observed and expected prevalence of co-modality. |
Based on the prevalence and association probability (indicated by O/E values) of comorbidity patterns, the dyad comorbidity patterns of chronic disease with both prevalence and O/E values ranking in the top eight were selected in the subsequent MR study. Finally, three dyad disease comorbidity patterns, namely, hypertension and diabetes, hypertension and hyperlipidemia, and hypertension and stroke, were included in the next step.
Causal Relationships Between Chronic Diseases
Hypertension and Diabetes
Hypertension and diabetes are common chronic diseases that affect a large proportion of the adult population. Hypertension and diabetes mellitus are “silent killers” with an increasing global prevalence. Hypertension is a common diabetes comorbidity and a mortality risk factor.20 High blood pressure (BP) is reported in more than two-thirds of patients with type 2 diabetes (T2D), and its onset coincides with hyperglycemia.21 High BP is associated with a higher risk of diabetes.22 Hypertension accelerates the progression of diabetic nephropathy through glomerular hyperfiltration and causes atherosclerosis in diabetes.23 In the current observational studies, diabetes mellitus was associated with an increased risk of hypertension and vice versa, but the causality between these conditions is yet to be determined.
A 4-year follow-up study revealed that high BP is a risk factor for T2D in middle-aged and elderly Chinese.24 The highest diastolic BP and longest hypertension duration were independently associated with T2D in hypertensive subjects.25 A prospective cohort study indicated that diabetes was associated with hypertension and arterial stiffness, with arterial stiffness predicting diabetes better than hypertension.26
In contrast, observational evidence revealed that diabetic or obese patients frequently have morning hypertension.27 A case-control study demonstrated that diabetes was a significant risk factor for hypertension and that diabetes positively interacted with hypertension.28 Therefore, we hypothesized that hypertension and diabetes are causally linked. The literature was searched, and a few MR studies were found to elaborate on their causal association.29,30 However, the results were inconsistent, probably because of the different samples and the use of differentiated IVs. Therefore, by conducting a bidirectional two-sample MR study, we attempted to exclude the effect of confounding factors to investigate the causal associations between hypertension and diabetes.
Initially, 62 SNPs were selected from the hypertension GWAS database (GWAS ID: finn-b-I9_HYPTENS). Then, the known underlying confounding factors, such as age, body mass index (BMI),31 obesity, overweight, Vitamin D, and sleep, were included in MR analysis to eliminate confounding SNPs, and 12 were identified and removed. Following overlap with the diabetes GWAS data (GWAS ID: finn-b-E4_DIABETES), 10 SNPs were removed as palindromic. MR-PRESSO test results revealed no individual SNPs with significant pleiotropy. Finally, 40 SNPs were selected as IVs for MR analysis (The effect estimates of single SNPs are shown in Figure S2A). The overall F-statistic value of 12.20 is significantly higher than the critical value of 10, indicating no weak instrumental bias exists in IVs.
In the present study, three MR analysis methods were used to estimate the effect of hypertension on the development of diabetes mellitus: MR Egger, Weighted median, and IVW methods. The random effects model of the IVW method was used to investigate the effect of hypertension on diabetes, given heterogeneity (Cochran’s Q = 80.875, p < 0.01). As shown in Figure 4A, the findings revealed hypertension as a significant predictor of diabetes (IVW, OR [95% CI]: 1.114 [1.049, 1.184], p < 0.001). The MR Egger method estimated an intercept of −0.0019 with a p-value of 0.8116, indicating a lack of statistical significance and implying that the IVs had no horizontal pleiotropic effects. Leave-one-out analysis (Figure S3A) and funnel plot (Figure S4A) demonstrated that the results were sufficiently robust.
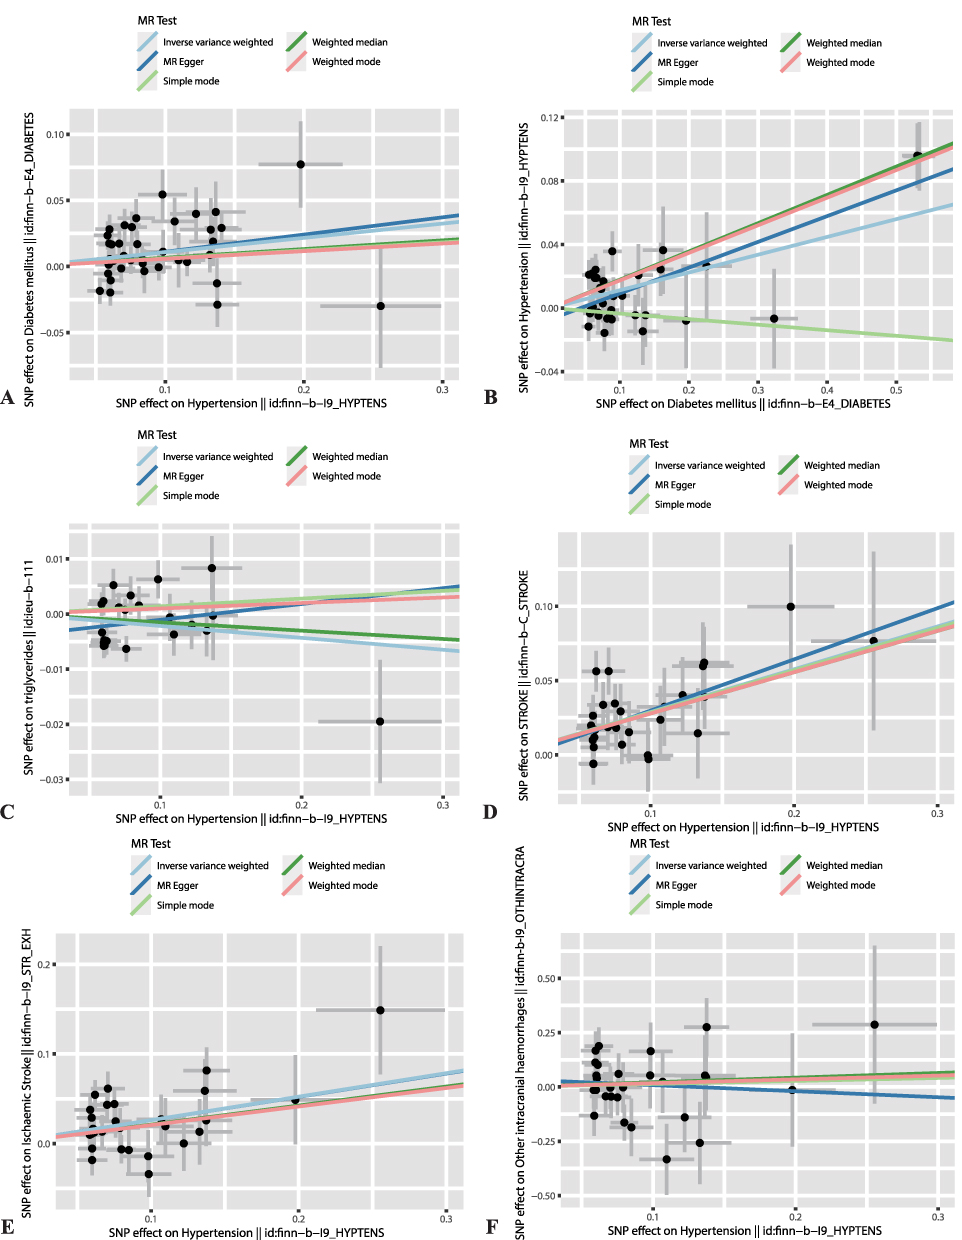 |
Figure 4 Scatter plots of estimated effect sizes among variables. Scatter plot revealing MR effect estimates of exposure over the outcome. Each variant-exposure association was plotted against the variant-outcome association, and the corresponding MR estimate for inverse variance weighted, MR Egger, weighted median, simple mode, and weighted mode. The slope indicates the size of the estimated effect of the exposure on outcome. The effect of (A) hypertension on diabetes, (B) diabetes on hypertension, (C) hypertension on triglycerides, (D) hypertension on stroke, (E) hypertension on ischemic stroke, and (F) hypertension on intracranial hemorrhages. The figure displays the correlation effect (β, beta) of the two conditions, with the slopes of the lines serving as indicators. The odds ratios (ORs) were calculated using the odds Ratio() function in R (version 4.2.3), where OR is equivalent to exp(β). |
We further analyzed the causal associations between diabetes mellitus and hypertension. The diabetes GWAS database yielded 58 SNPs. After comparing the results to the hypertension GWAS database, 15 confounding SNPs and seven palindromic SNPs were identified and removed. Two SNPs with significant pleiotropy (as determined by the MR-PRESSO Outlier Test, p < 0.05) were excluded. Finally, 34 SNPs were selected as IVs (Figure S2B) without evidence of weak instrumental bias (F = 23.65). Conversely, diabetes mellitus was equally a risk factor for hypertension in MR analysis (IVW (random effects), OR [95% CI]: 1.118 [1.069, 1.187], p < 0.001, Figure 4B). There was no significant horizontal pleiotropy from IVs to outcome (intercept = −0.0070, p = 0.090), and the results appeared sufficiently robust (Figures S3B, and S4B).
Hypertension and Hyperlipidemia
Hyperlipidemia is a common chronic disease in the elderly. A report stated that people with hyperlipidemia have roughly twice the risk of developing cardiovascular disease (CVD) compared to those with normal total cholesterol levels in the United States.32 Hyperlipidemia is characterized by an imbalance in blood cholesterol levels, including low-density lipoprotein cholesterol (LDL-C) and high-density lipoprotein cholesterol (HDL-C) levels. Hypertriglyceridemia and mixed hyperlipidemia are other types of hyperlipidemia that involve elevated cholesterol and triglyceride levels.32 Elevated LDL-C levels can cause plaque buildup in arteries and are associated with an increased risk of atherosclerotic cardiovascular disease.32 To date, no publication has investigated the causal association between hyperlipidemia and hypertension. MR analyses examining the causal association between hypertension and hyperlipidemia are not currently being performed because of the possible lack of hyperlipidemia GWAS data. However, many observational studies have identified triglycerides (TG), cholesterol, and TG/HDL-C ratio as independent risk factors for hypertension, and the causal relationship between lipid-related factors (such as LDL-C, HDL-C, and triacylglycerols) and hypertension has been partially validated. Previous MR studies have linked HDL-C and TG levels to causal risk factors for hypertension. Nonetheless, hyperlipidemia is a multivariate lipid effect, and previous univariate MR studies appear insufficiently convincing. Therefore, we included common hyperlipidemia-related lipid factors, namely, total cholesterol (TC), TG, LDL-C, and HDL-C, in a multivariate MR analysis.
A total of 1616 SNPs were selected from the GWAS database to represent four exposure variables: TC (GWAS ID: met-d-Total_C), TG (GWAS ID: ieu-b-111), LDL-C (GWAS ID: ieu-b-110), and HDL-C (GWAS ID: ieu-b-109). The remaining 396 SNPs were included in the analysis after being removed for duplication, palindromic with intermediate allele frequencies, and association with potential confounding factors such as age, BMI, obesity, overweight, sleep, and dietary fiber.33 Subsequently, 49 SNPs were removed for being palindromic from GWAS data of hyperlipidemia-related factors and hypertension (GWAS ID: finn-b-I9_HYPTENS). Finally, 347 SNPs were selected as IVs for MR analysis.
Multivariate MR revealed that high TG was a risk factor for hypertension (IVW, OR [95% CI]:1.262 [1.129, 1.411], p < 0.001) with no weak instrumental bias in IVs (F = 16.70), while the other three factors were not found to be causally associated with hypertension (IVW, ORs [95% CI]:0.830 [0.578, 1.191], p = 0.312 for TC; 1.115 [0.822, 1.513], p = 0.485 for LDL–C; and 0.953 [0.799, 1.136], p = 0.591 for HDL–C).
Subsequently, we used a two-sample MR method to investigate the plausible direct effects of hypertension on TG levels. We integrated confounding factors, such as cholesterol, to identify confounding SNPs and mitigate the influence of confounding variables. We eliminated four palindromic SNPs after intersection with TG GWAS. We included 22 SNPs (Figure S2C) as IVs in MR analysis after eliminating four SNPs due to significant horizontal pleiotropy. It should be noted that these IVs may exhibit a weak instrumental variable bias (F = 3.19). The findings indicated the absence of horizontal pleiotropy (intercept = −0.0039, p = 0.2328) but the presence of heterogeneity (Cochran’s Q = 48.268, p < 0.001) in the IVs. Therefore, IVW random model was used to assess the effects of hypertension on TG levels. The results indicated that hypertension was not a significant predictor of TG level (OR [95% CI]:0.979 [0.956, 1.002], p = 0.074, Figure 4C), and the results appeared sufficiently robust (Figures S3C and S4C).
Hypertension and Stroke
Several studies have demonstrated that hypertension is the most important risk factor for all types of strokes.34–37 High BP is the most significant risk factor for stroke and applies to both ischemic stroke and intracerebral hemorrhage. Significant risks include smoking, diabetes, hyperlipidemia, and physical inactivity.38
Twenty-seven SNPs associated with confounding factors, such as age, BMI, obesity, overweight, diabetes, cholesterol, TG, and sleep were excluded. Six palindromic SNPs were eliminated after harmonizing the SNPs between the exposure and outcome. The remaining 29 SNPs (Figure S2D) were analyzed as IVs, and there was no weak instrumental variable bias (F = 53.62). The IVs showed no significant horizontal pleiotropy (intercept = −0.0047, p = 0.6627) or heterogeneity (Cochran’s Q = 31.374, p = 0.301). Therefore, the effect of hypertension on stroke was estimated using the fixed effects IVW method. As shown in Figure 4D, the results revealed that besides the IVW estimates (OR [95% CI]: 1.334 [1.235, 1.441], p < 0.001), all other methods, such as MR Egger (OR [95% CI]: 1.411 [1.083, 1.839], p < 0.05), weighted median (OR [95% CI]: 1.320 [1.182, 1.475], p < 0.001), simple mode (OR [95% CI]: 1.329 [1.067, 1.656], p < 0.05), and weighted mode (OR [95% CI]: 1.321 [1.073, 1.626], p < 0.05) indicated that hypertension was a notable risk factor for stroke.
Furthermore, we estimated the risk of hypertension for two types of strokes: ischemic stroke and intracerebral hemorrhage.38 Two GWAS databases (ischemic stroke, GWAS ID: finn-b-I9_STR_EXH, and intracranial hemorrhage, GWAS ID: finn-b-I9_OTHINTRACRA) derived from the corresponding two stroke types were collected for SNP selection of SNPs.
First, we investigated the effects of hypertension on ischemic stroke. 29 SNPs were included as IVs in the MR analysis (Figure S2E), with no weak instrumental variable bias (F = 20.78 > 10). No horizontal pleiotropic IVs were observed (intercept = 0.0002, p = 0.9906). Because IVs were heterogeneous (Cochran’s Q = 41.493, p < 0.05), the random-effects IVW method was used to evaluate the effect of hypertension on ischemic stroke. The findings revealed that hypertension had a significant effect on ischemic stroke (OR [95% CI], 1.299 [1.161–1.454], p < 0.001, Figure 4E). The effect of hypertension on intracranial hemorrhage was investigated. Similarly, 29 SNPs were selected as IVs in MR analysis (Figure S2F) with potentially weak instrumental variable bias (F = 0.41 < 10). Horizontal pleiotropy (intercept = 0.0361, p = 0.6070) and heterogeneity (Cochran’s Q = 34.73, p = 0.178) of IVs were insignificant. The results of MR analysis suggested that hypertension was not a predictor of intracranial hemorrhage (Fixed-effect IVW, OR [95% CI]:1.172 [0.723, 1.899], p = 0.520, Figure 4F). Based on the leave-one-out analysis (Figure S3D–S3F) and funnel plot (Figure S4D–S4F), all the above results were found to be robust.
The graphical representation depicted in Figure 5A provides a comprehensive overview of the influence of hypertension on common comorbidities. Similarly, Figure 5B illustrates the effect of other illnesses on hypertension. As summarized in Figure 5C, hypertension mediated the causal association between multiple chronic diseases. Hypertension and diabetes have a bidirectional cause-and-effect relationship. Hypertension is a risk factor for stroke, particularly ischemic stroke. The hyperlipidemia-related factor TG influences hypertension.
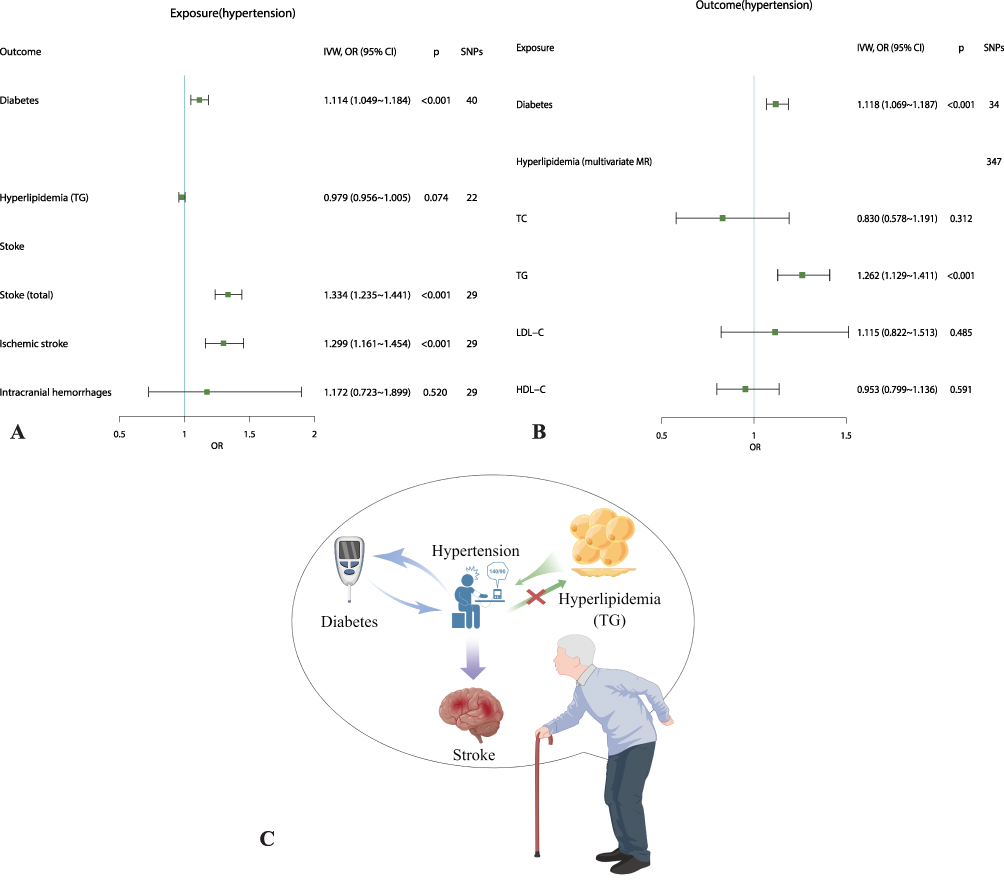 |
Figure 5 Causal interaction effects among common comorbidities. (A). Estimates of the effect of hypertension on diabetes, hyperlipidemia-related factors (triglycerides), and stroke. (B). Estimates of the effects of diabetes mellitus and hyperlipidemia-related factors on hypertension. (C). The schematic diagram of the causal interaction effects of comorbidities of common chronic diseases. |
Discussion
Comorbidity, defined as multiple chronic diseases in an individual, has emerged as a prevalent global phenomenon, particularly among the elderly.3,4 A cross-sectional community survey conducted in the present study revealed that the prevalence of comorbidity among the 12 chronic diseases investigated was 20.7% among individuals aged ≥ 60 years, indicating a heightened risk of chronic disease comorbidity among the local older adults. Therefore, relevant authorities must implement appropriate health management measures to combat the escalating threat of chronic disease.
Various factors such as smoking, alcohol consumption, diet, and exercise contribute to chronic diseases. However, the causal relationships between chronic illnesses have not been extensively studied because of the difficulty in designing rigorous longitudinal RCT to investigate their causal evidence. Consequently, the present study investigated the prevalence of chronic illness comorbidities and their causal associations using MR methods with a public GWAS database.
We examined MR evidence supporting a bidirectional relationship between T2D and hypertension. A prospective study demonstrated that higher blood pressure (BP) is a risk factor for T2D in middle-aged and elderly individuals.24 Similar MR studies on the causal association between hypertension and T2D have also been reported, revealing that T2D may causally affect hypertension (OR [95% CI], 1.07 [1.04–1.10]), whereas the relationship between hypertension and T2D is unlikely (0.96 [0.88–1.04]). There was also a counterargument that BP had BMI-independent causal effects on the risk of T2D.30 The present study evaluated the causal relationship between hypertension and diabetes, contradicting previous findings. Variations in the sample sources, IVs, and effect estimation methods can cause discrepancies in the results of multiple MR studies.
A minor bidirectional causal relationship between hypertension and diabetes has also been validated. The current results are more reliable because we used more rigorous screening of SNPs, specifically by removing potential confounding SNPs, and we selected newer, larger samples for analysis. Numerous pathophysiological mechanisms have supported this association. Among these mechanisms, insulin resistance in the nitric-oxide pathway, the stimulatory effect of hyperinsulinemia on the sympathetic drive, smooth muscle growth, and sodium-fluid retention, pivotal involvement of purinergic signaling, and the excitatory effect of hyperglycemia on the renin-angiotensin-aldosterone system appear to mediate the causality between them. Moreover, obesity, inflammation, oxidative stress, and insulin resistance have been proposed as common pathways that mediate causality.39 A comprehensive review provided evidence supporting the notion that insulin resistance is a critical link between hypertension and diabetes. Notably, insulin resistance is thought to play a critical role in developing and progressing hypertension-induced target organ damage such as left ventricular hypertrophy, atherosclerosis, and chronic kidney disease.
The present study had some limitations. One of the fundamental tenets of MR is that IVs should not be linked to potentially confounding variables. Considering the modest effect size (with an OR value of approximately one) observed in the present and previous studies, the causal relationship between hypertension and diabetes requires further investigation owing to the possibility of unidentified confounding factors that could introduce bias. For instance, neuroinflammation may be a potential confounder because it uses the autonomic nervous system to mediate the development of diabetes and hypertension. Despite the efforts to account for all confounding factors, it remains challenging to conduct studies that completely exclude the impact of confounding SNPs in IVs. Nevertheless, the current study used the most common confounding factors, and the conclusions were considered reliable.
Hypertension and hyperlipidemia are common comorbidities among patients in China. TG and cholesterol levels are frequently used as biomarkers for hyperlipidemia detection. Despite the lack of publicly available genetic data on hyperlipidemia in MR studies, these biomarkers were used as variables. Consistent with previous observational studies, high TG levels were associated with an increased risk of hypertension. Genetic and observational data have highlighted the mediating role of pulse rate and lymphocyte count in the causal pathway from TG to BP.40
Nevertheless, the current findings contradict those of previous research and do not support cholesterol as a predictor of hypertension. After controlling for other variables, such as TG, the present study discovered that cholesterol levels were not predictors of hypertension. This inconsistency can be attributed to two factors. First, the results of observational studies provide causal indications rather than conclusive causal evidence. Second, univariate analysis does not account for potential underlying variables to the same extent as multivariate analysis.
The present MR analysis validated hypertension as a risk factor for stroke, consistent with previous research findings.34–37 Previous MR studies investigated the causal association between BP and stroke (systolic BP, per 10 mmHg: OR [95% CI], 1.35 [1.24–1.48]; diastolic BP, per 5 mmHg: OR [95% CI], 1.20 [1.12–1.28]).41 However, the current study focused on the causal relationship between hypertension and stroke rather than BP, which is more clinically relevant. Furthermore, the current findings indicate that hypertension is a predictive factor for ischemic stroke rather than for hemorrhagic stroke. This assertion is supported by an MR study that suggested that hypertensive disorders during pregnancy are also associated with an increased risk of ischemic stroke (OR, 1.27; 95% CI, 1.12–1.44).42
The present study proposed a causal paradigm for common chronic diseases in the elderly, as depicted in Figure 5C. The mediating role of hypertension in the causal association between multiple chronic diseases has been previously highlighted. Notably, there was a bidirectional cause-and-effect relationship between hypertension and diabetes. Furthermore, hypertension is a risk factor for ischemic stroke, with the hyperlipidemia-related factor, TG influencing hypertension. Given these findings, prioritizing hypertension prevention and control in the elderly is crucial for effective chronic disease management. Besides, unhealthy lifestyle habits often result in obesity, which is considered as the upstream pathophysiology of chronic diseases. Therefore, it is also crucial to manage upstream conditions such as abdominal obesity to control chronic diseases.
Abbreviations
MR, Mendelian Randomization; NCDs, non-communicable chronic diseases; CVD, cardiovascular disease; RCTs, Randomized Controlled Trials; SNPs, single nucleotide polymorphisms; IVs, instrument variables; GWAS, genome-wide association study; IVW, inverse variance weighted; RR, risk ratios; O/E, observed-to-expected ratios; LD, linkage disequilibrium; BP, blood pressure; T2D, type 2 diabetes; LDL-C, low-density lipoprotein cholesterol; HDL-C, high-density lipoprotein cholesterol; TG, triglycerides.
Data Sharing Statement
The cross-sectional data during the current study are available from the author Junwang Gu (E-mail: gj_one.gmu.edu.cn) upon reasonable request. Publicly available datasets were analyzed in MR study and can be obtained from https://gwas.mrcieu.ac.uk/.
Ethics Approval and Consent to Participate
The cross-sectional study protocol was approved by the Ethics Review Board of Gannan Medical University, and the study was performed following the tenets of the Declaration of Helsinki and relevant policies in China. Participants provided informed consent before data collection, and their personal information was maintained anonymously. The current Mendelian randomization study that analyzed publicly available summary-level data was exempt from ethical approval.
Acknowledgments
We thank the IEU Open GWAS Project (https://gwas.mrcieu.ac.uk/) for providing summary statistics.
Funding
This work was supported by the Science and Technology Project of Jiangxi Province Educational Department of China (NO. GJJ201547, GJJ180825) and the Open Project of Key Laboratory of Cardiovascular and Cerebrovascular Disease Prevention and Control in Gannan Medical University, Ministry of Education (NO. XN201801, XN202021).
Disclosure
The authors report no conflicts of interest in this work.
References
1. Bauer UE, Briss PA, Goodman RA, Bowman BA. Prevention of chronic disease in the 21st century: elimination of the leading preventable causes of premature death and disability in the USA. Lancet. 2014;384(9937):45–52. doi:10.1016/S0140-6736(14)60648-6
2. Gaziano TA, Pagidipati N. Scaling up chronic disease prevention interventions in lower- and middle-income countries. Annu Rev Public Health. 2013;34(1):317–335. doi:10.1146/annurev-publhealth-031912-114402
3. Valderas JM, Starfield B, Sibbald B, Salisbury C, Roland M. Defining comorbidity: implications for understanding health and health services. Ann Fam Med. 2009;7(4):357–363. doi:10.1370/afm.983
4. Salive ME. Multimorbidity in older adults. Epidemiol Rev. 2013;35(1):75–83. doi:10.1093/epirev/mxs009
5. Schafer I, von Leitner EC, Schon G, et al. Multimorbidity patterns in the elderly: a new approach of disease clustering identifies complex interrelations between chronic conditions. PLoS One. 2010;5(12):e15941. doi:10.1371/journal.pone.0015941
6. Booth FW, Roberts CK, Laye MJ. Lack of exercise is a major cause of chronic diseases. Compr Physiol. 2012;2(2):1143–1211.
7. Westreich D. Epidemiology by Design: A Causal Approach to the Health Sciences. Oxford University Press; 2019.
8. Benson K, Hartz AJ. A comparison of observational studies and randomized, controlled trials. N Engl J Med. 2000;342(25):1878–1886. doi:10.1056/NEJM200006223422506
9. Budu-Aggrey A, Paternoster L. Research techniques made simple: using genetic variants for randomization. J Invest Dermatol. 2019;139(7):1416–1421 e1411. doi:10.1016/j.jid.2019.03.1138
10. van den Bussche H, Koller D, Kolonko T, et al. Which chronic diseases and disease combinations are specific to multimorbidity in the elderly? Results of a claims data based cross-sectional study in Germany. BMC Public Health. 2011;11(1):101. doi:10.1186/1471-2458-11-101
11. Feng R, Lu M, Xu J, et al. Pulmonary embolism and 529 human blood metabolites: genetic correlation and two-sample Mendelian randomization study. BMC Genom Data. 2022;23(1):69. doi:10.1186/s12863-022-01082-6
12. Burgess S, Thompson SG, Collaboration CCG. Avoiding bias from weak instruments in Mendelian randomization studies. Int J Epidemiol. 2011;40(3):755–764. doi:10.1093/ije/dyr036
13. Staley JR, Blackshaw J, Kamat MA, et al. PhenoScanner: a database of human genotype-phenotype associations. Bioinformatics. 2016;32(20):3207–3209. doi:10.1093/bioinformatics/btw373
14. Kamat MA, Blackshaw JA, Young R, et al. PhenoScanner V2: an expanded tool for searching human genotype-phenotype associations. Bioinformatics. 2019;35(22):4851–4853. doi:10.1093/bioinformatics/btz469
15. Verbanck M, Chen CY, Neale B, Do R. Detection of widespread horizontal pleiotropy in causal relationships inferred from Mendelian randomization between complex traits and diseases. Nat Genet. 2018;50(5):693–698. doi:10.1038/s41588-018-0099-7
16. Davey Smith G, Hemani G. Mendelian randomization: genetic anchors for causal inference in epidemiological studies. Hum Mol Genet. 2014;23(R1):R89–98. doi:10.1093/hmg/ddu328
17. Bowden J, Davey Smith G, Burgess S. Mendelian randomization with invalid instruments: effect estimation and bias detection through Egger regression. Int J Epidemiol. 2015;44(2):512–525. doi:10.1093/ije/dyv080
18. Hemani G, Zheng J, Elsworth B, et al. The MR-Base platform supports systematic causal inference across the human phenome. Elife. 2018;7. doi:10.7554/eLife.34408
19. Hemani G, Tilling K, Davey Smith G, Li J. Orienting the causal relationship between imprecisely measured traits using GWAS summary data. PLoS Genet. 2017;13(11):e1007081. doi:10.1371/journal.pgen.1007081
20. Yildiz M, Esenboga K, Oktay AA. Hypertension and diabetes mellitus: highlights of a complex relationship. Curr Opin Cardiol. 2020;35(4):397–404. doi:10.1097/HCO.0000000000000748
21. Ferrannini E, Cushman WC. Diabetes and hypertension: the bad companions. Lancet. 2012;380(9841):601–610. doi:10.1016/S0140-6736(12)60987-8
22. Wise J. High blood pressure is linked to increased risk of diabetes. BMJ. 2015;351:h5167. doi:10.1136/bmj.h5167
23. Yamazaki D, Hitomi H, Nishiyama A. Hypertension with diabetes mellitus complications. Hypertens Res. 2018;41(3):147–156. doi:10.1038/s41440-017-0008-y
24. Yang X, Chen J, Pan A, et al. Association between higher blood pressure and risk of diabetes mellitus in middle-aged and elderly Chinese adults. Diabetes Metab J. 2020;44(3):436–445. doi:10.4093/dmj.2019.0081
25. Chen Y, Ma J, Lu D, Fang Y. The risk factors of type 2 diabetes in hypertensive subjects. Front Endocrinol. 2022;13:901614. doi:10.3389/fendo.2022.901614
26. Tian X, Zuo Y, Chen S, et al. Hypertension, arterial stiffness, and diabetes: a prospective cohort study. Hypertension. 2022;79(7):1487–1496. doi:10.1161/HYPERTENSIONAHA.122.19256
27. Toyama M, Watanabe S, Miyauchi T, et al. Diabetes and obesity are significant risk factors for morning hypertension: from Ibaraki Hypertension Assessment Trial (I-HAT). Life Sci. 2014;104(1–2):32–37. doi:10.1016/j.lfs.2014.03.029
28. Li AL, Peng Q, Shao YQ, Fang X, Zhang YY. The interaction on hypertension between family history and diabetes and other risk factors. Sci Rep. 2021;11(1):4716. doi:10.1038/s41598-021-83589-z
29. Sun D, Zhou T, Heianza Y, et al. Type 2 diabetes and hypertension. Circ Res. 2019;124(6):930–937. doi:10.1161/CIRCRESAHA.118.314487
30. Jia Y, Guo D, Sun L, et al. Diet, lifestyle behaviours and other risk factors associated with type 2 diabetes beyond body mass index: a Mendelian randomization study. Can J Diabetes. 2022;46(8):822–828. doi:10.1016/j.jcjd.2022.06.001
31. Huang J, Huffman JE, Huang Y, et al. Genomics and phenomics of body mass index reveals a complex disease network. Nat Commun. 2022;13(1). doi:10.1038/s41467-022-35553-2
32. Karr S. Epidemiology and management of hyperlipidemia. Am J Manag Care. 2017;23(9 Suppl):S139–s148.
33. Chen G, Wang H, Zhang X, Yang ST. Nutraceuticals and functional foods in the management of hyperlipidemia. Crit Rev Food Sci Nutr. 2014;54(9):1180–1201. doi:10.1080/10408398.2011.629354
34. Dubow J, Fink ME. Impact of hypertension on stroke. Curr Atheroscler Rep. 2011;13(4):298–305. doi:10.1007/s11883-011-0187-y
35. Rantakomi SH, Laukkanen JA, Sivenius J, Kauhanen J, Kurl S. Alcohol consumption and the risk of stroke among hypertensive and overweight men. J Neurol. 2013;260(2):534–539. doi:10.1007/s00415-012-6672-6
36. Alloubani A, Saleh A, Abdelhafiz I. Hypertension and diabetes mellitus as a predictive risk factors for stroke. Diabetes Metab Syndr. 2018;12(4):577–584. doi:10.1016/j.dsx.2018.03.009
37. Huang Y, Cai X, Li Y, et al. Prehypertension and the risk of stroke: a meta-analysis. Neurology. 2014;82(13):1153–1161. doi:10.1212/WNL.0000000000000268
38. Campbell BCV, Khatri P. Stroke. Lancet. 2020;396(10244):129–142. doi:10.1016/S0140-6736(20)31179-X
39. Cheung BM, Li C. Diabetes and hypertension: is there a common metabolic pathway? Curr Atheroscler Rep. 2012;14(2):160–166. doi:10.1007/s11883-012-0227-2
40. Liu LY, Gu Q, Hu X, Fan J, Liu XZ. Potential mediators of causal associations of circulating triglycerides with blood pressure: evidence from genetic and observational data. Hypertension. 2022;79(11):2439–2447. doi:10.1161/HYPERTENSIONAHA.122.19510
41. Wan EYF, Fung WT, Schooling CM, et al. Blood pressure and risk of cardiovascular disease in UK biobank: a mendelian randomization study. Hypertension. 2021;77(2):367–375. doi:10.1161/HYPERTENSIONAHA.120.16138
42. Rayes B, Ardissino M, Slob EAW, Patel KHK, Girling J, Ng FS. Association of hypertensive disorders of pregnancy with future cardiovascular disease. JAMA Network Open. 2023;6(2):e230034. doi:10.1001/jamanetworkopen.2023.0034
 © 2023 The Author(s). This work is published and licensed by Dove Medical Press Limited. The
full terms of this license are available at https://www.dovepress.com/terms
and incorporate the Creative Commons Attribution
- Non Commercial (unported, 3.0) License.
By accessing the work you hereby accept the Terms. Non-commercial uses of the work are permitted
without any further permission from Dove Medical Press Limited, provided the work is properly
attributed. For permission for commercial use of this work, please see paragraphs 4.2 and 5 of our Terms.
© 2023 The Author(s). This work is published and licensed by Dove Medical Press Limited. The
full terms of this license are available at https://www.dovepress.com/terms
and incorporate the Creative Commons Attribution
- Non Commercial (unported, 3.0) License.
By accessing the work you hereby accept the Terms. Non-commercial uses of the work are permitted
without any further permission from Dove Medical Press Limited, provided the work is properly
attributed. For permission for commercial use of this work, please see paragraphs 4.2 and 5 of our Terms.
Recommended articles
The Causal Correlation Between Gastroesophageal Reflux Disease and Chronic Widespread Pain: A Bidirectional Mendelian Randomization Study
Chen M, Tu H, Zhou J, Zhang Y, Wen S, Xiao Y, He L
Journal of Pain Research 2025, 18:3107-3115
Published Date: 24 June 2025
Celiac Disease as a Genetic Predisposing Factor for Dermatitis Herpetiformis: A Two-Sample Mendelian Randomization Analysis
Su Y, Xu P, Zhang M, Wen P, Xu K, Xie J, Wan X, Liu L, Yang Z, Yang M
Clinical, Cosmetic and Investigational Dermatology 2025, 18:3317-3329
Published Date: 7 December 2025