Back to Journals » Clinical Epidemiology » Volume 13
Case-Ascertainment Models to Identify Adults with Obstructive Sleep Apnea Using Health Administrative Data: Internal and External Validation
Authors Kendzerska T ![]() , van Walraven C, McIsaac DI, Povitz M, Mulpuru S
, van Walraven C, McIsaac DI, Povitz M, Mulpuru S ![]() , Lima I, Talarico R, Aaron SD
, Lima I, Talarico R, Aaron SD ![]() , Reisman W, Gershon AS
, Reisman W, Gershon AS ![]()
Received 3 March 2021
Accepted for publication 12 May 2021
Published 17 June 2021 Volume 2021:13 Pages 453—467
DOI https://doi.org/10.2147/CLEP.S308852
Checked for plagiarism Yes
Review by Single anonymous peer review
Peer reviewer comments 2
Editor who approved publication: Professor Irene Petersen
Tetyana Kendzerska,1– 3 Carl van Walraven,1– 3 Daniel I McIsaac,1,3,4 Marcus Povitz,5,6 Sunita Mulpuru,1,2 Isac Lima,1,3 Robert Talarico,1,3 Shawn D Aaron,1,2 William Reisman,5,7 Andrea S Gershon3,8,9
1Department of Medicine, The Ottawa Hospital Research Institute/The Ottawa Hospital, Ottawa, Ontario, Canada; 2Department of Medicine, University of Ottawa, Ottawa, Ontario, Canada; 3ICES, Ottawa, Toronto, Ontario, Canada; 4Departments of Anesthesiology & Pain Medicine, University of Ottawa and Ottawa Hospital, Ottawa, Ontario, Canada; 5Department of Medicine at Schulich School of Medicine and Dentistry at Western University, London, Ontario, Canada; 6Cumming School of Medicine, Department of Medicine, University of Calgary, Calgary, Alberta, Canada; 7Department of Medicine, London Health Sciences Centre, London, Ontario, Canada; 8Faculty of Medicine, Department of Medicine, University of Toronto, Toronto, Ontario, Canada; 9Department of Medicine, Sunnybrook Health Sciences Centre, Toronto, Ontario, Canada
Correspondence: Tetyana Kendzerska
Ottawa Hospital Research Institute, Division of Respirology, University of Ottawa, The Ottawa Hospital, Civic Campus, 1053 Carling Ave, Ottawa, ON, K1Y 4E9, Canada
Email [email protected]
Background: There is limited evidence on whether obstructive sleep apnea (OSA) can be accurately identified using health administrative data.
Study Design and Methods: We derived and validated a case-ascertainment model to identify OSA using linked provincial health administrative and clinical data from all consecutive adults who underwent a diagnostic sleep study (index date) at two large academic centers (Ontario, Canada) from 2007 to 2017. The presence of moderate/severe OSA (an apnea–hypopnea index≥ 15) was defined using clinical data. Of 39 candidate health administrative variables considered, 32 were tested. We used classification and regression tree (CART) methods to identify the most parsimonious models via cost-complexity pruning. Identified variables were also used to create parsimonious logistic regression models. All individuals with an estimated probability of 0.5 or greater using the predictive models were classified as having OSA.
Results: The case-ascertainment models were derived and validated internally through bootstrapping on 5099 individuals from one center (33% moderate/severe OSA) and validated externally on 13,486 adults from the other (45% moderate/severe OSA). On the external cohort, parsimonious models demonstrated c-statistics of 0.75– 0.81, sensitivities of 59– 60%, specificities of 87– 88%, positive predictive values of 79%, negative predictive values of 73%, positive likelihood ratios (+LRs) of 4.5– 5.0 and –LRs of 0.5. Logistic models performed better than CART models (mean integrated calibration indices of 0.02– 0.03 and 0.06– 0.12, respectively). The best model included: sex, age, and hypertension at the index date, as well as an outpatient specialty physician visit for OSA, a repeated sleep study, and a positive airway pressure treatment claim within 1 year since the index date.
Interpretation: Among adults who underwent a sleep study, case-ascertainment models for identifying moderate/severe OSA using health administrative data had relatively low sensitivity but high specificity and good discriminative ability. These findings could help study trends and outcomes of OSA individuals using routinely collected health care data.
Keywords: obstructive sleep apnea, case-ascertainment modelling, health administrative data
Introduction
Obstructive sleep apnea (OSA) is the most common respiratory sleep disorder, afflicting up to one billion people globally.1–3 Untreated OSA is a potentially important modifiable risk factor for adverse acute health outcomes associated with greater healthcare utilization.4–9 While consistent evidence exists on the association between OSA and increased all-cause and cardiovascular mortality, the influence of OSA on other health outcomes has been less clear.10 Therefore, larger real-world generalizable population-based studies that follow participants for longer periods of time are required to investigate outcomes, treatment, epidemiology, and medical care use for individuals with OSA.7
A referral to a sleep physician followed by in-laboratory polysomnography (PSG), an overnight sleep study in a sleep laboratory, is generally considered the reference standard for the diagnosis of OSA (Data Supplement: e-Figure 1).11 The term PSG implies the recording, analysis, and interpretation of multiple physiologic signals collected simultaneously, including but not limited to an electroencephalogram, electromyogram, electrooculogram, electrocardiogram, and respiratory signals.12 The apnea–hypopnea index (AHI), one of the respiratory signals derived from the PSG, which calculates the number of times an individual partially or completely stops breathing per hour of sleep, is used to diagnose OSA and measure its severity.13 Based on the AHI, OSA may be categorized as mild (AHI of 5–14.9), moderate (AHI of 15–30), or severe (AHI >30) OSA.14 Treatments for OSA include conservative measures (weight reduction and positional therapy), positive airway pressure (PAP) treatment, oral appliance treatment (OA), and surgery.14,15 PAP treatment is the recommended modality for moderate to severe OSA in adults.15 Follow-up sleep studies may be used to titrate PAP or OA to individual needs or to reassess the severity of OSA following surgery, weight reduction, or on positional therapy.
If we can accurately ascertain individuals with OSA from health administrative data, needed epidemiological studies could be conducted. However, PSG results on OSA presence and severity are not typically collected on a population-level, and OSA may not be accurately captured by diagnostic codes,16 making a valid interpretation of the study results problematic. Without valid case ascertainment algorithms, studies that identify OSA in administrative data17–23 using only diagnostic codes are at substantial risk of non-quantifiable misclassification bias.
A few prior studies have examined health administrative codes for identifying OSA in health administrative data.24,25 The best case-ascertainment algorithms derived from those studies were 1) a combination of a billing claim for a PSG and receipt of a PAP device in a 2-year period, which yielded a sensitivity and specificity of 19% and 98%, respectively, to identify individuals with OSA based on diagnosis by a sleep physician or AHI ≥524 and 2) a combination of one hospital discharge code or three outpatient billing claims for OSA in a 2-year period, which yielded a sensitivity and specificity of 12% and 82%, respectively, to identify individuals with OSA (AHI ≥5).25 Additional consideration of hypertension, diabetes, myocardial infarction, or stroke in the case definition improved specificity to 91%, while the sensitivity remained the same.25 Together, these findings suggest that no code or combination of codes achieves an adequate level of accuracy to confidently rule in or rule out the presence of OSA.26 These studies, however, considered only a limited number of variables in tested algorithms, mostly based on diagnoses or procedural codes, and were limited by a lack of internal and external validations. Multivariable modelling techniques may potentially improve the accuracy of case ascertainment algorithms.27,28
This study aimed to address the limitations of previous research by developing multivariable case-ascertainment models based on demographics, comorbidities, physician characteristics, diagnostic tests, and procedure codes from health administrative data to accurately identify OSA among individuals with a high enough pre-test probability of OSA to be referred for a sleep study.
Methods
Study Design
We conducted a retrospective cohort study to derive and validate a case-ascertainment model to identify adults with OSA in health administrative data by linking clinical data from diagnostic sleep studies from two academic sleep centers in Ontario (the most populous province in Canada) and provincial health administrative databases housed at ICES (formerly, the Institute for Clinical and Evaluative Sciences).
This project was approved by the Research Ethics Boards of the Ottawa Health Science Network, the Western University Health Sciences, and the Sunnybrook Health Sciences Centre (Canada). ICES is an independent, non-profit research institute whose legal status under Ontario’s health information privacy law allows it to collect and analyze health care and demographic data, without consent, for health system evaluation and improvement.
Data Sources
Clinical Data
To derive and internally validate predictive models, we utilized The Ottawa Hospital (TOH) Sleep Database (NCT03834792), which contains clinical and PSG data on all consecutive adults who underwent a diagnostic sleep study in the TOH Sleep Center between 2015 and 2017. To validate models externally, we used the London Health Sciences Centre Sleep and Apnea Assessment Unit PSG database, which includes clinical and PSG data on all consecutive adults who underwent a diagnostic sleep study in the London Health Sciences Centre between 2007 and 2015. Details on databases, including scoring criteria used and data collection, are presented in the Data Supplement (e-Text 1).
Provincial Health Administrative Data Housed at ICES
We deterministically linked clinical databases to provincial health administrative databases using encrypted individual health card numbers. Residents of Ontario have universal public health insurance under the Ontario Health Insurance Plan (OHIP), with sleep medicine services being 100% reimbursed. Since 1991, ICES has housed high-quality individual-level administrative datasets on publicly funded services provided.29,30
Databases used in this study included the Registered Persons Database (RPDB) [demographic information]; Discharge Abstract Database (DAD) [information on hospital admission]; Same Day Surgery Database (SDS) [same day surgery information]; the National Ambulatory Care Registry System (NACRS) [information on emergency visits]; the OHIP database [physician billing and technical fees for procedures including PSGs]; the Canadian Census [neighborhood socioeconomic details]; ICES Physician Database (IPDB) [information on physician specialty]. We also utilized ICES-derived disease-specific databases. Finally, for all insured Ontario residents who have been diagnosed with OSA by a sleep physician registered with the Assistive Devices Program (ADP), funding is provided for PAP systems and recorded in the ADP database.31 The databases listed were linked using unique encoded identifiers. A detailed description of the ICES datasets is available at https://datadictionary.ices.on.ca/Applications/DataDictionary/.
OSA Status Determination
The AHI, a gold standard measure of OSA severity,14 and the Epworth Sleepiness Score (ESS, a measure of daytime sleepiness32) were derived from both sleep databases to define the OSA status.
Given the unclear clinical significance of mild OSA,33 we utilized two definitions for clinically significant OSA separately as primary: 1) moderate/severe OSA (Yes/No) defined by AHI ≥15 and 2) severe OSA (Yes/No) defined by AHI >30.14 For the secondary analyses, we utilized two alternative definitions for OSA: 1) AHI ≥5 regardless of the presence of daytime sleepiness and 2) AHI ≥5 and presence of moderate to severe daytime sleepiness as measured by the ESS ≥13 of 24 (www.epworthsleepinessscale.com). We focused on individuals with moderate to severe daytime sleepiness, given that current evidence is insufficient to assess the balance of benefits and harms of identifying and treating individuals with mild OSA associated with mild symptoms, asymptomatic, or unrecognized symptoms.10
Predictive Model Covariates from Health Administrative Data
e-Figure 1 presents a health care pattern for individuals with suspected OSA in Ontario (Canada). We used a combination of clinical judgment and empirical evidence to select variables from health administrative data. Following variables were derived from 3 years before to 1 year after the index sleep study: 1) physician billing diagnoses for OSA (OHIP); 2) OSA billing physician specialty more frequently associated with a sleep medicine practice such as internal medicine, respirology, neurology, otolaryngology or psychiatry (IPDB); 3) OSA billing physician being registered with the ADP (Yes/No); 4) diagnostic and/or therapeutic sleep studies (OHIP); 5) inpatient hospitalizations for OSA (DAD/SDS); 6) surgical procedures for OSA such as maxillomandibular advancement surgery, uvulopalatopharyngoplasty, tonsillectomy and/or adenoidectomy or bariatric surgery (DAD/SDS/OHIP); 7) PAP treatment claims (ADP) as recommended treatment for moderate to severe OSA in adults15; and 8) having substance abuse disorder34 (DAD). Finally, we used 9) patient demographics, such as age, sex, income status and place of residence (RPDB/Census) at the year of the sleep study; and 10) prevalent comorbidities at the year of the sleep study and hospitalizations for selected comorbidities in the last 3 years prior to the sleep study, including the Charlson Comorbidity Index35 (ICES-derived databases/OMHRS/OHIP/DAD). Comorbidities were included due to association with OSA,36 and to address an increased exposure to the health care system that may increase the likelihood of a documented OSA diagnosis. Detailed definitions of 39 candidate variables considered are presented in the Data Supplement (e-Text 2).
Analyses
Study results were reported using the Standards for Reporting of Diagnostic Accuracy criteria for assessing the quality of validation studies of health administrative data.37
Descriptive statistics were used to characterize the study populations. Each selected variable was cross-tabulated with the OSA status: sensitivity, specificity, and 95% confidence intervals (CI) of each variable were evaluated.
Development of Case-Ascertainment Model
First, we selected candidate variables (see details above). Then, we screened the list of candidate variables and excluded those with a prevalence of ≤0.5% in the sleep cohort used for the internal validation38 (31 of 39 candidate variables left). Next, we used the classification and regression tree (CART) methods to identify the most parsimonious model with the best predictive characteristics.39 For each OSA status definition, the full tree was pruned back to a more parsimonious tree via cost-complexity pruning to prevent overfitting and select a parsimonious set of variables. The pruning parameter selected was based on the tree with the number of leaves that minimized the average squared error across 10-fold cross-validation.39 Finally, we used the CART and logistic regression techniques to test the internal and external validity of prediction models based on selected variables. Two types of models were tested: 1) parsimonious models selected via cost-complexity pruning (both CART and logistic regressions) and 2) full models (with all 31 selected variables included in logistic regressions only). All individuals with an estimated probability of 0.5 or greater using the case-ascertainment models were classified as having OSA; a default cut point of 0.5 was chosen given the lack of recommendations on the best probability threshold for OSA validation.
Measures of the Predictive Model Performance
C-index, sensitivities, specificities, positive (+LR) and negative likelihood ratios (−LR), and positive (PPV) and negative predictive values (NPV) were used to assess the performance of the case-ascertainment models.40,41 C-index values of 0.70–0.79, 0.80–0.89, and >0.90 were interpreted as having moderate, good, and excellent discriminative ability, respectively.42 Based on the values, LRs as measures of diagnostic accuracy were considered as small (+LR: 2–5; −LR: 0.2–0.5), moderate (+LR: 5–10; −LR: 0.1–0.2) and important (+LR: >10; −LR: <0.1).43
Internal Validation
Optimism corrected methods via the bootstrap were used to internally validate model discrimination.44 The optimism was estimated as the decrease in the c-index when models derived in 1 of 1000 bootstrap samples were applied to the original sample. This optimism was then subtracted from the original estimate to obtain an “optimism-corrected” estimate.45
External Validation
External validity was assessed by the following measures: calibration-in-the-large or the model intercept; calibration slope; discrimination (c-index); and a mean integrated calibration index (ICI).46,47 Calibration plots were used to visualize the agreement between the observed and predicted values; a locally weighted least squares regression smoothing technique (ie, the loess algorithm) was utilized.48
Secondary Analyses
We used the analytic approaches described above for the alternative definitions of OSA. We also refitted our parsimonious models among 1) men and women separately; 2) individuals aged 30 and 69 years, given that OSA prevalence is most often reported in this population3; 3) individuals with prevalent hypertension; 4) individuals who were diagnosed with OSA by a physician registered with the ADP; and 5) among those who claimed a PAP device through the ADP following a diagnostic sleep study. Finally, we tested multiple OSA probability thresholds for the best predictive model identified to be tested in future research.
All statistical analyses were performed in the secure environment at ICES Ottawa following Ontario privacy standards using SAS Enterprise Guide 7.15 (SAS Institute Inc., Cary, NC).
Results
Characteristics of clinical cohorts are presented in Table 1.
 |
Table 1 Characteristics of Adults Who Underwent a Diagnostic Sleep Study at the Ottawa Hospital (TOH) Sleep Center (Internal Validation Cohort) and at the London Health Sciences Centre (External Validation Cohort) |
The Derivation and Internal Validation Cohort
Of 5155 adults who underwent a diagnostic sleep study from 2015 to 2017 at the Ottawa Hospital Sleep center, 5099 (99%) were successfully linked to health administrative data. Patients were middle-aged (median age of 50 years), equally divided between males and females (53% males) and had a median AHI of 8.6, with 3266 (64%) individuals having mild to severe OSA (AHI ≥5), 1664 (33%) having moderate to severe OSA (AHI ≥15) and 643 (13%) having severe OSA (AHI >30). Distributions of variables by the reference standard (primary and secondary definitions) are presented in e-Tables 1 and 2.
The External Validation Cohort
Of 13,787 adults who underwent a diagnostic sleep study from 2007 to 2015 at the London Health Sciences Centre, 13,486 (98%) were successfully linked to health administrative data. Similar to the derivation cohort, patients were middle-aged (median age of 51 years), although more likely to be males (60% males), and had a higher median AHI of 12.3, with 9687 (72%) individuals having mild to severe OSA, 6006 (45%) having moderate to severe OSA and 3369 (25%) having severe OSA. Distributions of variables by the reference standard (primary and secondary definitions) are presented in e-Tables 3 and 4.
Sensitivities and Specificities for Individual Variables Considered in Case-Ascertainment Models
In the derivation cohort, the sensitivities of the variables considered in the case-ascertainment models to identify moderate to severe OSA ranged between 0.42% and 83.8%. The variable with the highest sensitivity was an inpatient or outpatient visit for OSA within 1 year since the index sleep study. The specificities ranged between 52.4% and 99.2%. The variable with the highest specificity was a prior surgical treatment for OSA (Table 2). Similar results were noted in the cohort used for the external validation (Table 2), and for individual variables tested to identify severe OSA (Table 3).
 |
Table 2 Sensitivities and Specificities, %, (with 95% Confidence Intervals) for Individual Variables to Be Considered in a Case-Ascertainment Model for Moderate to Severe Obstructive Sleep Apnea (OSA) (AHI ≥ 15) |
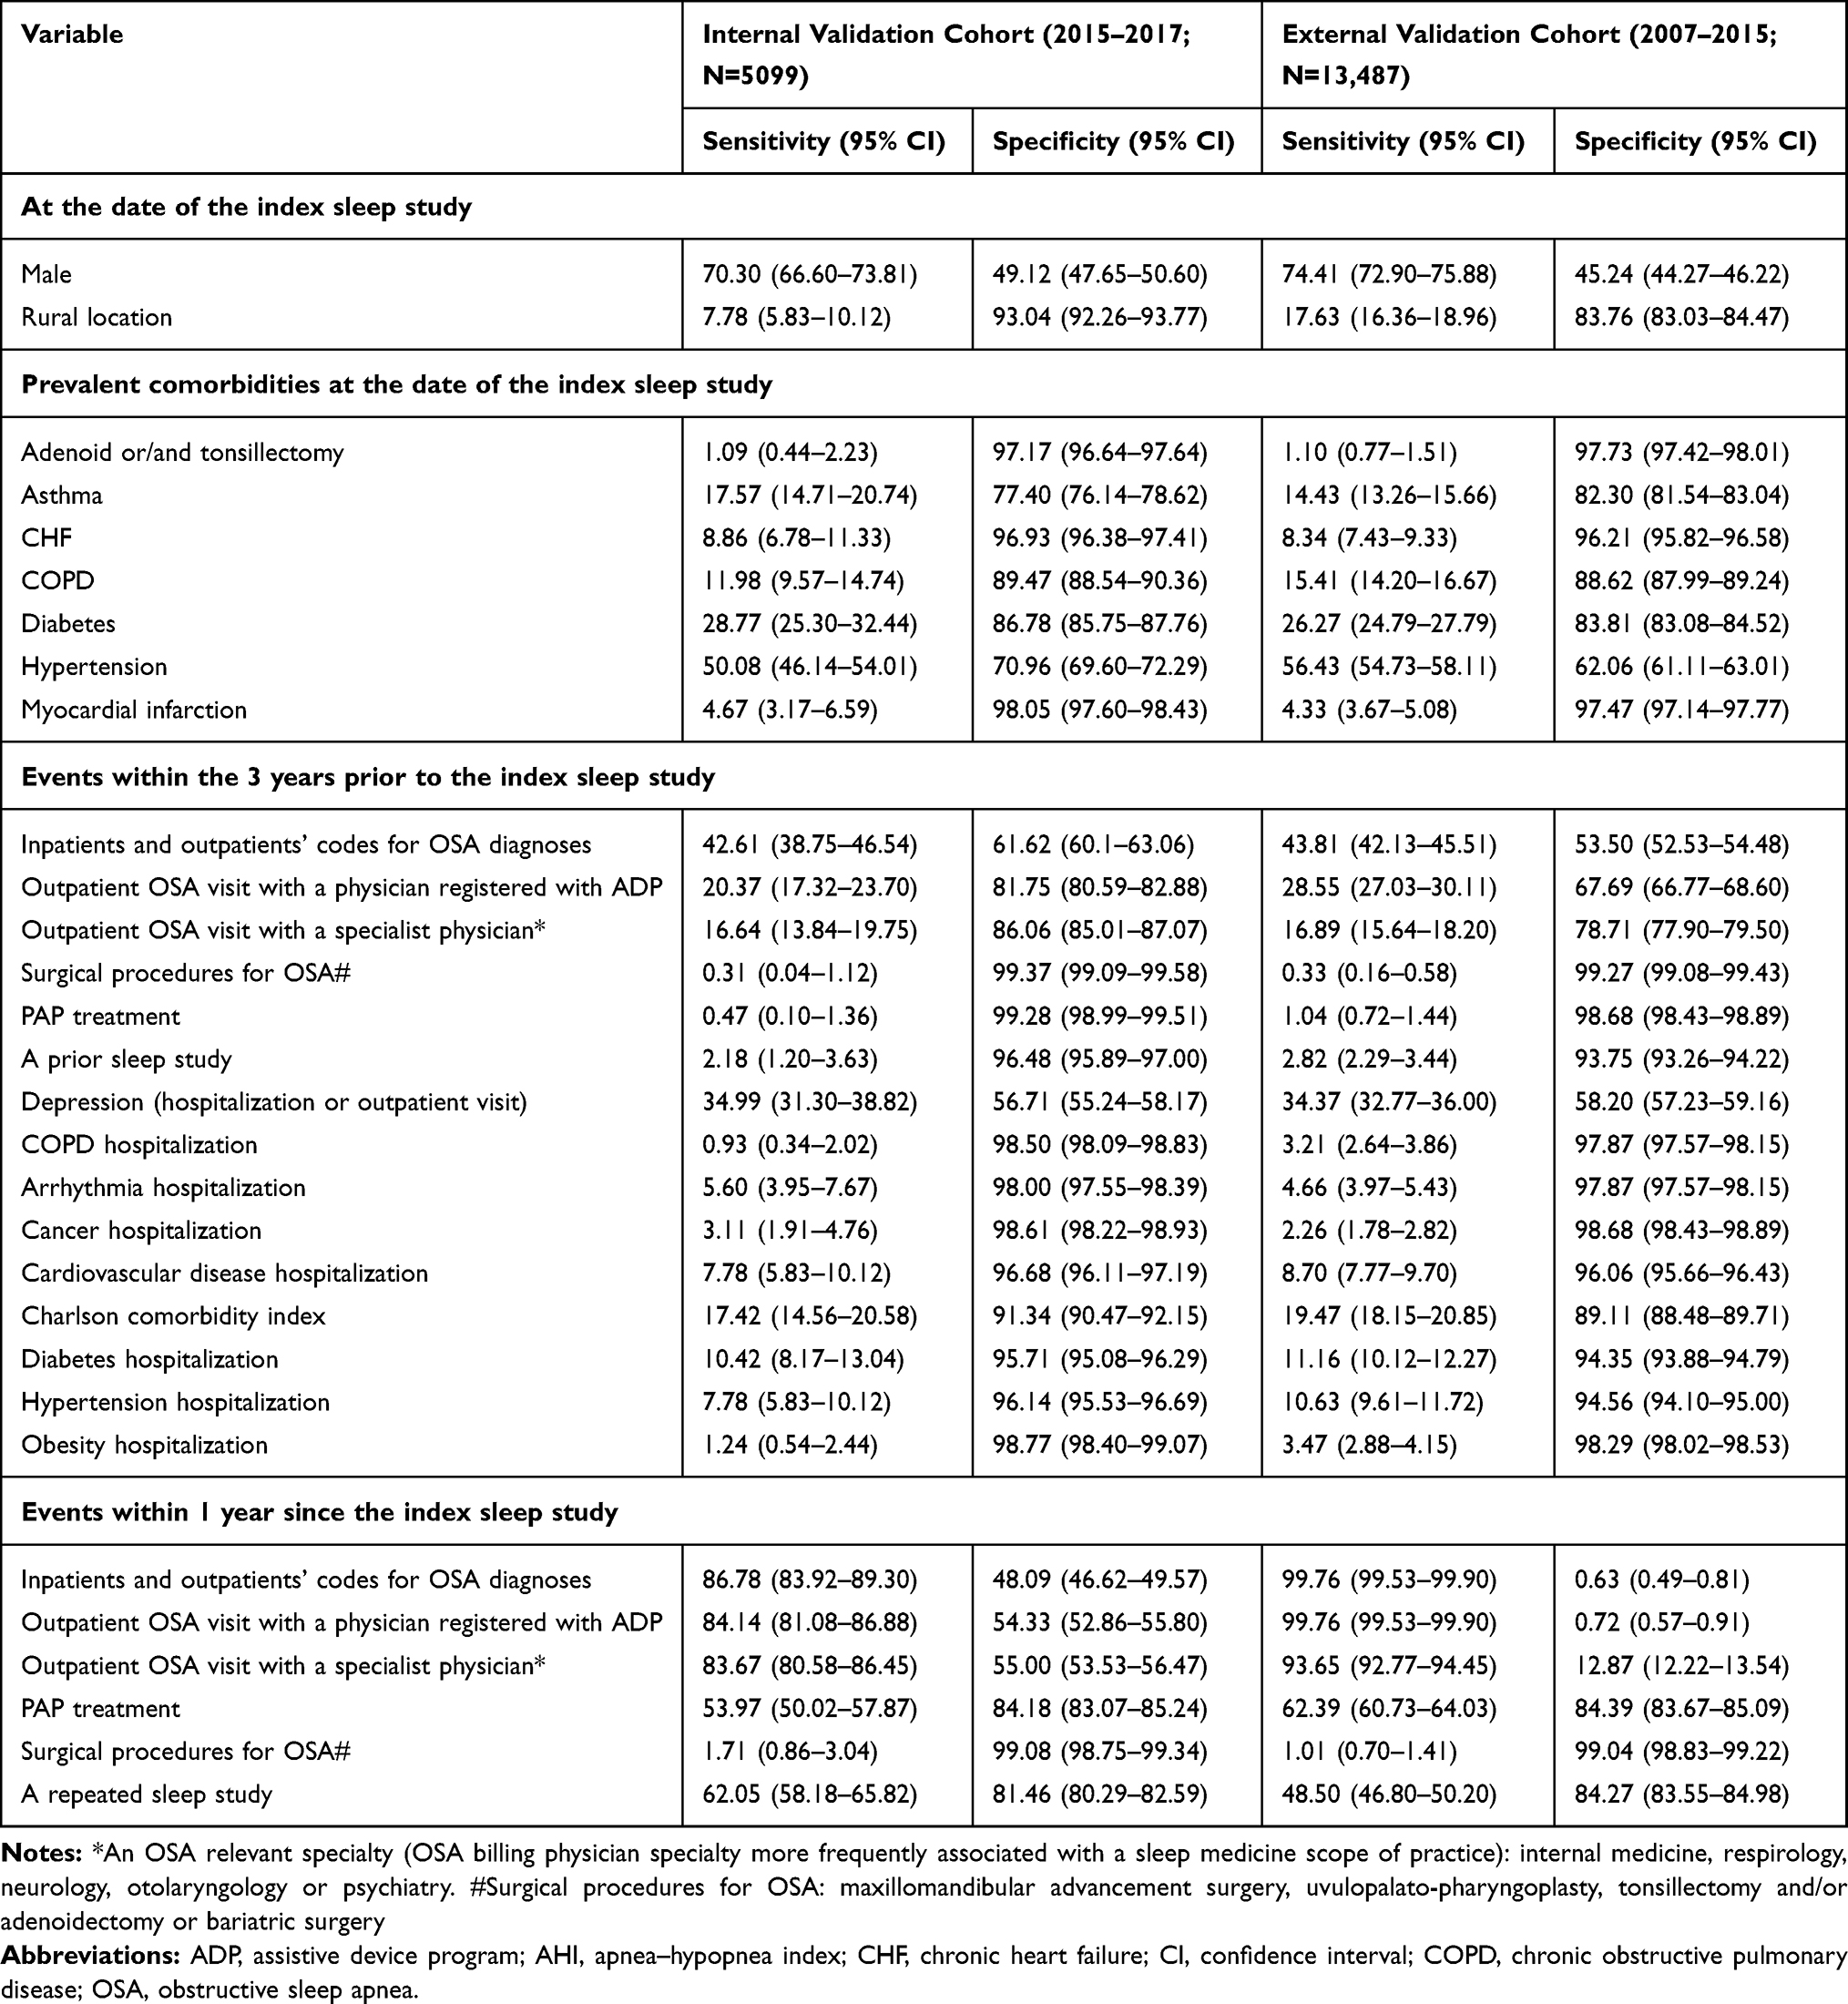 |
Table 3 Sensitivities and Specificities, %, (with 95% Confidence Intervals) for Individual Variables to Be Considered in a Case-Ascertainment Model for Severe OSA (AHI >30) |
Performance of a Case-Ascertainment Model: Model Derivation and Internal Validation
Table 4 represents performance measures for both CART and regression models to identify individuals with primary OSA case definitions. Details on variables selected, including importance, regression trees, and node information for parsimonious models, are presented in the Data Supplements (e-Tables 5 and 6). The parsimonious CART model to identify individuals with moderate to severe OSA contained six variables in relation to an index sleep study: an outpatient visit for OSA from a specialist physician, a repeated sleep study and a PAP treatment claim within 1 year of the index sleep study, patient sex and age at the index sleep study, and hospitalization with hypertension in the last 3 years prior to the sleep study (e-Table 5). For example, an individual who underwent a repeated sleep study and claimed a PAP treatment within 1 year of the index sleep study had an 80% probability of having moderate to severe OSA, while an individual who had not had a repeated sleep study and an outpatient visit for OSA from a specialist physician within 1 year of the index sleep study had a 10% probability of having OSA (e-Table 6). The parsimonious CART model for severe OSA also contained six variables: an outpatient visit for OSA from a physician registered with the ADP to prescribed PAP therapy, a repeated sleep study and a PAP treatment claim within 1 year of the index sleep study, patient age and prevalent diabetes at the index sleep study, and hospitalizations for cardiovascular comorbidities in the last 3 years prior to the sleep study (e-Table 5). For example, an individual with diabetes and older than 60 years at the index date, who underwent a repeated sleep study and had an outpatient visit for OSA from a physician registered with the ADP within 1 year since the index date, had a 78% probability of severe OSA. In contrast, an individual who had not had a repeated sleep study within 1 year since the index date, had a 6% probability of severe OSA (e-Table 6).
 |
Table 4 Internal and External Validation Measures of CARTs and Logistic Regression Models Developed to Identify Individuals with Moderate to Severe or Severe Obstructive Sleep Apnea (OSA) |
Estimates from logistic models utilizing variables derived through the CART method and from full logistic regression models are presented in the Data Supplement (e-Table 7).
All CART and logistic models demonstrated moderate to good discriminative ability to identify individuals with moderate to severe OSA (optimism corrected c-indices of 0.75–0.85). The sensitivities ranged from 61% to 66%, specificities from 87% to 89%, +LRs from 5.1 to 5.6, −LRs were 0.4, PPV from 71% to 72% and NPV from 83% to 84% (Table 4).
Logistic regression models demonstrated good discriminative ability to identify individuals with severe OSA (optimism corrected c-indices of 0.80–0.82). The sensitivities ranged from 13% to 16%, specificities from 98% to 99%, +LRs from 6.5 to 14.0, −LRs were 0.9, PPV from 53% to 61% and NPVs were 89% (Table 4).
Performance of a Case-Ascertainment Model: External Validation
e-Table 8 represents all calibration indices. Case-ascertainment models performed better to identify moderate to severe than severe OSA (mean integrated calibration indices of 0.02–0.06 and 0.08–0.12, respectively) (Figures 1 and 2). Logistic models demonstrated better model performance and discriminative ability than CART models. All logistic models had good discriminatory ability for primary OSA definitions (c-indices of 0.80–0.81; Figure 2; Table 4). Compared to the initial models, for moderate to severe OSA, and for all types of models, in general, the sensitivity decreased to approximately 60% and the specificity remained at 95% and above. We found an improvement in PPV up to 79% and a drop in NPV to 73% with +LRs of 4.1–5.0 and –LRs of 0.5 (Table 4). Compared to the initial models for severe OSA, the sensitivity decreased to 7%, while the specificity remained high at 98–99%. We found an improvement in PPV up to 65% and a drop in NPV to 76% with +LRs of 5.0–7.0 and –LRs of 0.9, suggesting moderate diagnostic accuracy for ruling-in severe OSA diagnosis, but poor ability to rule-out the diagnosis. Both parsimonious and full logistic regression models demonstrated similar measurement properties, suggesting no need to consider all variables in the predictive model.
 |
Figure 1 External validation: Calibration plots to classify individuals with moderate to severe (apnea-hypopnea index [AHI] ≥15) or severe (AHI >30) obstructive sleep apnea (OSA) for the parsimonious classification and regression tree (CART) and logistic regression models (same variables), and full logistic regression models. Perfect predictions should be on the ideal diagonal line, described with an intercept of 0 and slope of 1. Imperfect calibration can be characterized by deviations from these ideal values. |
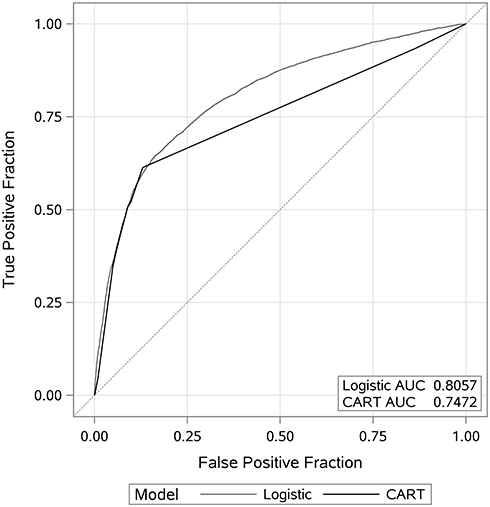 |
Figure 2 External validation: Area under the curve to classify individuals with moderate to severe obstructive sleep apnea (OSA) (apnea-hypopnea index [AHI] ≥15) utilizing parsimonious classification and regression tree (CART) and logistic regression models (same variables). |
Secondary Analyses
Alternative Definitions
Measurement characteristics for individual variables and details on parsimonious and full models to identify individuals with OSA utilizing alternative definitions are presented in the Data Supplement (e-Tables 5, 7, 9 and 10).
On the internal validation cohort, all models demonstrated moderate to good discriminatory ability to identify mild to severe OSA regardless of daytime sleepiness (optimism corrected c-indices of 0.77 to 0.84) (e-Table 11). In general, all models demonstrated similar sensitivities of 81–82%, specificities of 66–70%, PPVs of 81–83%, NPVs of 67–68%, +LRs of 2.4–2.7, and −LRs of 0.27 demonstrating small diagnostic accuracy. On the external validation cohort, all models exhibited higher sensitivities of 95–97%, lower specificities of 19–25%, PPVs of 75–76%, NPVs of 65–71%, +LR of 1.2–1.3, and −LR of 0.16–0.20 demonstrating moderate diagnostic accuracy in ruling-out the OSA diagnosis (e-Figure 2).
We were not able to identify a parsimonious model to define mild to severe OSA cases with the presence of moderate to severe daytime sleepiness. The full logistic model with all 32 variables considered did not demonstrate reasonable discriminative or diagnostic ability (e-Table 11).
Subgroup Analysis
Refitting all case-ascertainment models on subgroups demonstrated similar patterns to the entire sample among females, males, individuals aged between 30 and 69 years, with prevalent hypertension, and individuals seen by a physician registered with the ADP (e-Table 12).
Exploring Different Probability Thresholds
e-Table 13 presents the sensitivities, specificities, PPVs, NPVs, +LRs and −LRs for the different probability thresholds for the parsimonious logistic models in the external validation cohort. The largest increase in the post-test probability of moderate to severe OSA was noted for the threshold of about 90% (+LRs of 14–49), with the largest decrease in the post-test probability of the disease for the thresholds of 5% (−LR of 0.08). For severe OSA, the largest increase in the post-test probability of the disease was noted for the threshold of 66% (+LR of 7), with the largest decrease in the post-test probability of the disease for the thresholds of 2% (−LR of 0.12).
Discussion
In our retrospective cohort study of adults referred for sleep assessment (and therefore with a higher pre-test probability of having OSA than the general population), we derived and validated administrative data case-ascertainment models to identify individuals with OSA. When individuals were classified as moderate to severe OSA (model-based OSA probability exceeded 0.50), our case-ascertainment models demonstrated relatively low sensitivity, high specificity and good discriminative ability, with reasonably high PPV and NPV values. Case-ascertainment models for severe OSA demonstrated higher specificity, but had even lower sensitivity; these models had a moderate diagnostic accuracy for ruling-in severe OSA, but poor ability to rule-out a diagnosis of severe OSA. This suggests that these approaches could be used to support future research where identifying a cohort with a high probability of truly having OSA is required, such as evaluating trends and outcomes of individuals with clinically significant OSA using routinely collected health care data on the population level. However, because of misclassification risk, such approaches would not be reliable for comparing the outcomes between those classified and not classified as having severe OSA.
The case-ascertainment models developed and validated in our study demonstrated better performance than the case-ascertainment algorithms from previous studies utilizing health administrative data,24,25 confirming our hypothesis, and previous research,49 that multivariable modelling techniques can improve the accuracy of case-ascertainment algorithms. In contrast to our study, previous studies did not employ internal and external validations, which suggests that their findings may have been overly optimistic. Notably, and consistent with a previous study performed in the same jurisdiction,24 we demonstrated the importance of a repeated sleep study and a PAP claim in identifying individuals with OSA in Ontario. Further, we confirmed that inpatient and outpatient codes for OSA diagnoses cannot be utilized on their own to accurately identify OSA.16 This is likely due to several factors, including poor specificity of coding choices available in acute care discharge abstracts and physician billing records (likely due to inaccurate coding by the doctors and hospitals involved),16 as well as differences in practice and billing between institutions. As an example, the Ontario OHIP diagnostic codes for OSA, 307 and 786, represent not only OSA but also tension headaches, anorexia nervosa, or shortness of breath.16 Our study also highlights center-level variation in diagnostic coding that can lead to misclassification. For example, in one of our study centers, almost all individuals who underwent a PSG independent of the resulting AHI were assigned inpatient or outpatient codes for OSA diagnoses, whereas our other center assigned OSA diagnostic codes to only about half of individuals. This suggests that in some centers, diagnostic codes may be used to mark the indication for a PSG, whereas in others, the code may be assigned instead based on the PSG results. Finally, the cohort used for external validation was somewhat different from the derivation cohort (higher prevalence of male sex, obesity, hypertension, and severe OSA). The two cohorts were from two different sleep clinics and represented real-world variation between sleep clinics’ populations. As such, good model performance on the external cohort suggests robustness of the developed models. This again stresses the importance of multivariable models and external validation.
When comparing our case-ascertainment models to existing OSA clinical screening tools, we found, as expected, that screening tools were characterized by a higher sensitivity and lower specificity. A systematic review of eight patient-based questionnaires for OSA screening revealed a pooled sensitivity for predicting moderate OSA of 77% (73–81%) and a pooled specificity of 44% (41–47%).50 The PPV and NPV ranged from 11% to 97% and from 48% to 97%, respectively, with the prevalence of moderate to severe OSA between 8% and 70%.50 The pooled + LRs ranged from 2.0 to 2.8, and – LRs from 0.2 to 0.6.51 Importantly, test accuracy in repeated validation studies of the same screening tool was variable, suggesting an underlying heterogeneity in either measured elements of these predictive models or the clinical presentation of OSA.51 The non-specific clinical presentation of OSA requires the use of diagnostic tests among many individuals who do not in fact have OSA to identify cases. This results in a reduced specificity for administrative data codes. High heterogeneity in OSA presentation was also likely the reason our model performed poorly while incorporating measure of daytime sleepiness and highlights the challenge of using health administrative data to identify OSA clinical subtypes. To summarize, while clinical screening tools are potentially valuable to use on an individual level – especially in a certain clinical context and among specific subgroups – our ascertainment models are meant to be used on health administrative databases, rather than on an individual level, to identify a high probability OSA cohort. However, in general, to do meaningful OSA research, we need better diagnostic testing and documentation of these results.
Our study did not find that CARTs were advantageous over conventional logistic regression models for prediction.52,53 This may be because logistic regression performs better with a small sample size, and when non-linear and non-additive signals are not strong enough to make modern machine learning methods advantageous.54
The generalizability of the proposed case-ascertainment models was limited due to a higher pre-test probability of OSA in this population. Future studies should validate our models among individuals not referred for a sleep assessment, and in other jurisdictions with different clinical and billing practices. Next, moderate diagnostic accuracy demonstrated in our study can be partly explained by the main analyses being based on a 0.5 OSA probability threshold. The default of choosing p>0.5 is usually far from the best choice. Thus, additional research is warranted to test different probability thresholds for the predictive models to classify individuals with OSA and discriminate between different levels of disease severity. Finally, we were not able to improve PPV despite utilizing multivariable models, alternative definitions, and populations, suggesting that a better coding system in health administrative data for OSA may be necessary.
Conclusion
Among adults who were referred for a sleep disorder assessment and underwent a diagnostic sleep study in Ontario, case-ascertainment models derived from health administrative data for identifying moderate to severe OSA had relatively low sensitivity but high specificity and good discriminative ability. These findings could help to study trends and outcomes of individuals with OSA using routinely collected health care data. Future studies are required to validate these models among individuals not referred for a sleep assessment, to discriminate between different levels of disease severity, and to test different probability thresholds for the case-ascertainment models to classify individuals with OSA.
Abbreviations
AHI, apnea-hypopnea index; ADP, Assistive Devices Program; CART, classification and regression tree; CI, confidence intervals; DAD, Discharge Abstract Database; ESS, Epworth Sleepiness Score; IPDB, ICES Physician Database; NACRS, National Ambulatory Care Registry System; −LR, negative likelihood ratio; NPV, negative predictive value; OSA, obstructive sleep apnea; OHIP, Ontario Health Insurance Plan; OA, oral appliance; PSG, polysomnography; PAP, positive airway pressure; +LR, positive likelihood ratio; PPV, positive predictive value; RPDB, Registered Persons Database; SDS, Same Day Surgery Database; TOH, The Ottawa Hospital.
Data Sharing Statement
The dataset from this study is held securely in coded form at ICES. While data sharing agreements prohibit ICES from making the dataset publicly available, access may be granted to those who meet pre-specified criteria for confidential access, available at www.ices.on.ca/DAS. The full dataset creation plan and underlying analytic code are available from the authors upon request, understanding that the computer programs may rely upon coding templates or macros that are unique to ICES and are therefore either inaccessible or may require modification.
Acknowledgments
The authors wish to thank also the research assistants at the London Health Sciences Centre, Nariko Kuwahara and Sherry Coulson, and at the Ottawa Hospital Research Institute, Moussa Meteb, Aseel Ahmad and Randa Ahmad, for their role in databases preparation.
Author Contributions
All authors made a significant contribution to the work reported, whether that is in the conception, study design, execution, acquisition of data, analysis and interpretation, or in all these areas; took part in drafting, revising or critically reviewing the article; gave final approval of the version to be published; have agreed on the journal to which the article has been submitted; and agree to be accountable for all aspects of the work.
Funding
This study was supported by ICES, which is funded by an annual grant from the Ontario Ministry of Health and Long-Term Care (MOHLTC). This study also received funding from the University of Ottawa, the Department of Medicine (DOM) Developmental Research Grant and the Ottawa Hospital Sleep Walk. Parts of this material are based on data and information compiled and provided by the Canadian Institute for Health Information (CIHI). The opinions, results and conclusions reported in this paper are those of the authors and are independent of the funding sources. No endorsement by ICES or the Ontario MOHLTC is intended or should be inferred. Tetyana Kendzerska is supported by the PSI Foundation (the 2020 PSI Graham Farquharson Knowledge Translation Fellowship).
Disclosure
Dr Tetyana Kendzerska reports grants from the University of Ottawa, the Department of Medicine (DOM) Developmental Research Grant, grants from the Ottawa Hospital Sleep Walk, grants from the PSI Foundation (the 2020 PSI Graham Farquharson Knowledge Translation Fellowship), during the conduct of the study. The authors have no conflict of interest to disclose. Preliminary findings from this study were presented as an oral presentation during the Canadian Association for Health Services and Policy Research (CAHSPR) Scientific Conference in Halifax, Nova Scotia, from May 29 to 31, 2019: https://cahspr.ca/.
References
1. Peppard PE, Young T, Barnet JH, Palta M, Hagen EW, Hla KM. Increased prevalence of sleep-disordered breathing in adults. Am J Epidemiol. 2013;177(9):1006–1014. doi:10.1093/aje/kws342
2. Evans J, Rusu C, McRae L, Driver H, Fleetham J. The prevalence rate and risk of obstructive sleep apnea in Canada. Chest. 2010;138(4_MeetingAbstracts):702A–702A. doi:10.1378/chest.10037
3. Benjafield AV, Ayas NT, Eastwood PR, et al. Estimation of the global prevalence and burden of obstructive sleep apnoea: a literature-based analysis. Lancet Respir Med. 2019;7(8):687–698. doi:10.1016/S2213-2600(19)30198-5
4. Jordan AS, McSharry DG, Malhotra A. Adult obstructive sleep apnoea. Lancet. 2014;383(9918):736–747. doi:10.1016/S0140-6736(13)60734-5
5. Albarrak M, Banno K, Sabbagh AA, et al. Utilization of healthcare resources in obstructive sleep apnea syndrome: a 5-year follow-up study in men using CPAP. Sleep. 2005;28(10):1306–1311. doi:10.1093/sleep/28.10.1306
6. Tarasiuk A, Greenberg-Dotan S, Brin YS, Simon T, Tal A, Reuveni H. Determinants affecting health-care utilization in obstructive sleep apnea syndrome patients. Chest. 2005;128(3):1310–1314. doi:10.1378/chest.128.3.1310
7. Kendzerska T, Mollayeva T, Gershon AS, Leung RS, Hawker G, Tomlinson G. Untreated obstructive sleep apnea and the risk for serious long-term adverse outcomes: a systematic review. Sleep Med Rev. 2014;18(1):49–59. doi:10.1016/j.smrv.2013.01.003
8. Kendzerska T, Gershon AS, Hawker G, Leung RS, Tomlinson G, Patel A. Obstructive sleep apnea and risk of cardiovascular events and all-cause mortality: a decade-long historical cohort study. PLoS Med. 2014;11(2):e1001599. doi:10.1371/journal.pmed.1001599
9. Sullivan F. Hidden health crisis costing America billions. Underdiagnosing and undertreating obstructive sleep apnea draining healthcare system; 2016. Availble from: https://aasm.org/resources/pdf/sleep-apnea-economic-crisis.pdf.
10. Jonas DE, Amick HR, Feltner C, et al. Screening for obstructive sleep apnea in adults: evidence report and systematic review for the US preventive services task force. JAMA. 2017;317(4):415–433. doi:10.1001/jama.2016.19635
11. Medical Advisory Secretariat. Polysomnography in patients with obstructive sleep apnea: an evidence-based analysis. Ont Health Technol Assess Ser. 2006;6(13):1–38.
12. Patil SP. What every clinician should know about polysomnography. Respir Care. 2010;55(9):1179–1195.
13. Epstein LJ, Kristo D, Strollo PJ
14. Fleetham J, Ayas N, Bradley D, et al. Canadian Thoracic Society guidelines: diagnosis and treatment of sleep disordered breathing in adults. Can Respir J. 2006;13(7):387–392. doi:10.1155/2006/627096
15. Fleetham J, Ayas N, Bradley D, et al. Canadian Thoracic Society 2011 guideline update: diagnosis and treatment of sleep disordered breathing. Can Respir J. 2011;18(1):25–47. doi:10.1155/2011/506189
16. Anthonisen NR. Garbage in, garbage out. Can Respir J. 2010;17(5):211–212.
17. Memtsoudis SG, Stundner O, Rasul R, et al. The impact of sleep apnea on postoperative utilization of resources and adverse outcomes. Anesth Analg. 2014;118(2):407–418. doi:10.1213/ANE.0000000000000051
18. Sharafkhaneh A, Richardson P, Hirshkowitz M. Sleep apnea in a high risk population: a study of Veterans Health Administration beneficiaries. Sleep Med. 2004;5(4):345–350. doi:10.1016/j.sleep.2004.01.019
19. Diaz K, Faverio P, Hospenthal A, Restrepo MI, Amuan ME, Pugh MJ. Obstructive sleep apnea is associated with higher healthcare utilization in elderly patients. Ann Thorac Med. 2014;9(2):92–98. doi:10.4103/1817-1737.128854
20. Mokhlesi B, Hovda MD, Vekhter B, Arora VM, Chung F, Meltzer DO. Sleep-disordered breathing and postoperative outcomes after elective surgery: analysis of the nationwide inpatient sample. Chest. 2013;144(3):903–914. doi:10.1378/chest.12-2905
21. Chen YH, Keller JK, Kang JH, Hsieh HJ, Lin HC. Obstructive sleep apnea and the subsequent risk of depressive disorder: a population-based follow-up study. J Clin Sleep Med. 2013;9(5):417–423. doi:10.5664/jcsm.2652
22. Starr P, Agarwal A, Singh G, et al. Obstructive sleep apnea with chronic obstructive pulmonary disease among medicare beneficiaries. Ann Am Thorac Soc. 2019;16(1):153–156. doi:10.1513/AnnalsATS.201712-932OC
23. Cade BE, Dashti HS, Hassan SM, Redline S, Karlson EW. Sleep apnea and COVID-19 mortality and hospitalization. Am J Respir Crit Care Med. 2020;202(10):1462–1464. doi:10.1164/rccm.202006-2252LE
24. McIsaac DI, Gershon A, Wijeysundera D, Bryson GL, Badner N, van Walraven C. Identifying obstructive sleep apnea in administrative data: a study of diagnostic accuracy. Anesthesiology. 2015;123(2):253–263. doi:10.1097/ALN.0000000000000692
25. Laratta CR, Tsai WH, Wick J, Pendharkar SR, Johannson KA, Ronksley PE. Validity of administrative data for identification of obstructive sleep apnea. J Sleep Res. 2017;26(2):132–138. doi:10.1111/jsr.12465
26. Bianchi MT. Bayes’ theorem and the rule of 100: a commentary on ‘validity of administrative data for identification of obstructive sleep apnea’. J Sleep Res. 2017;26(3):401. doi:10.1111/jsr.12534
27. Walraven CV. A comparison of methods to correct for misclassification bias from administrative database diagnostic codes. Int J Epidemiol. 2018;47(2):605–616. doi:10.1093/ije/dyx253
28. Van walraven C, Colman I. Migraineurs were reliably identified using administrative data. J Clin Epidemiol. 2016;71:68–75. doi:10.1016/j.jclinepi.2015.09.007
29. Juurlink D, Preyra C, Croxford R, et al. Canadian Institute for Health Information Discharge Abstract Database: A Validation Study. Toronto: Institute for Clinical Evaluative Sciences; 2006.
30. Improving health care data in Ontario. ICES Investigative Report Toronto: Institute for Clinical Evaluative Sciences; 2005.
31. Assistive Devices Program. Respiratory equipment and supplies. Available from: https://www.ontario.ca/page/respiratory-equipment-and-supplies.
32. Johns MW. A new method for measuring daytime sleepiness: the Epworth sleepiness scale. Sleep. 1991;14(6):540–545. doi:10.1093/sleep/14.6.540
33. Littner MR. Mild obstructive sleep apnea syndrome should not be treated. J Clin Sleep Med. 2007;3(3):263–264. doi:10.5664/jcsm.26794
34. Mahfoud Y, Talih F, Streem D, Budur K. Sleep disorders in substance abusers: how common are they? Psychiatry. 2009;6(9):38–42.
35. Austin PC, Stanbrook MB, Anderson GM, Newman A, Gershon AS. Comparative ability of comorbidity classification methods for administrative data to predict outcomes in patients with chronic obstructive pulmonary disease. Ann Epidemiol. 2012;22(12):881–887. doi:10.1016/j.annepidem.2012.09.011
36. Young T, Skatrud J, Peppard PE. Risk factors for obstructive sleep apnea in adults. JAMA. 2004;291(16):2013–2016. doi:10.1001/jama.291.16.2013
37. Benchimol EI, Manuel DG, To T, Griffiths AM, Rabeneck L, Guttmann A. Development and use of reporting guidelines for assessing the quality of validation studies of health administrative data. J Clin Epidemiol. 2011;64(8):821–829. doi:10.1016/j.jclinepi.2010.10.006
38. Cowling TE, Cromwell DA, Sharples LD, van der Meulen S. A novel approach selected small sets of diagnosis codes with high prediction performance in large healthcare datasets. J Clin Epidemiol. 2020;128:20–28. doi:10.1016/j.jclinepi.2020.08.001
39. Breiman L, Friedman J, Olshen RA, Stone CJ. Classification and Regression Trees. CRC Press; 1984.
40. Akobeng AK. Understanding diagnostic tests 1: sensitivity, specificity and predictive values. Acta Paediatr. 2007;96(3):338–341. doi:10.1111/j.1651-2227.2006.00180.x
41. Sackett DL, Straus SE, Richardson WS, Rosenberg W, Haynes RB. Evidence-Based Medicine: How to Practice and Teach EBM. London: Churchill-Livingstone; 2000. Available from: https://www.amazon.ca/Evidence-Based-Medicine-How-Practice-Teach/dp/0443062404.
42. Hosmer DW, Lemeshow S, Sturdivant RX. Applied logistic regression. In: Wiley Series in Probability and Statistics.
43. McGee S. Simplifying likelihood ratios. J Gen Intern Med. 2002;17(8):646–649. doi:10.1046/j.1525-1497.2002.10750.x
44. van Walraven C. Bootstrap imputation with a disease probability model minimized bias from misclassification due to administrative database codes. J Clin Epidemiol. 2017;84:114–120. doi:10.1016/j.jclinepi.2017.01.007
45. Harrell FE. Regression Modeling Strategies: With Applications to Linear Models, Logistic Regression, and Survival Analysis. New York: Springer; 2001.
46. Steyerberg EW, Vergouwe Y. Towards better clinical prediction models: seven steps for development and an ABCD for validation. Eur Heart J. 2014;35(29):1925–1931. doi:10.1093/eurheartj/ehu207
47. Austin PC, Steyerberg EW. The Integrated Calibration Index (ICI) and related metrics for quantifying the calibration of logistic regression models. Stat Med. 2019;38(21):4051–4065. doi:10.1002/sim.8281
48. Austin PC, Steyerberg EW. Graphical assessment of internal and external calibration of logistic regression models by using loess smoothers. Stat Med. 2014;33(3):517–535. doi:10.1002/sim.5941
49. van Walraven C, McAlister FA, Bakal JA, Hawken S, Donze J. External validation of the Hospital-patient One-year Mortality Risk (HOMR) model for predicting death within 1 year after hospital admission. CMAJ. 2015;187(10):725–733. doi:10.1503/cmaj.150209
50. Abrishami A, Khajehdehi A, Chung F. A systematic review of screening questionnaires for obstructive sleep apnea. Can J Anaesth. 2010;57(5):423–438. doi:10.1007/s12630-010-9280-x
51. Ramachandran SK, Josephs LA. A meta-analysis of clinical screening tests for obstructive sleep apnea. Anesthesiology. 2009;110(4):928–939. doi:10.1097/ALN.0b013e31819c47b6
52. Austin PC, Tu JV, Lee DS. Logistic regression had superior performance compared with regression trees for predicting in-hospital mortality in patients hospitalized with heart failure. J Clin Epidemiol. 2010;63(10):1145–1155. doi:10.1016/j.jclinepi.2009.12.004
53. Christodoulou E, Ma J, Collins GS, Steyerberg EW, Verbakel JY, Van Calster B. A systematic review shows no performance benefit of machine learning over logistic regression for clinical prediction models. J Clin Epidemiol. 2019;110:12–22. doi:10.1016/j.jclinepi.2019.02.004
54. Faisal M, Scally A, Howes R, Beatson K, Richardson D, Mohammed MA. A comparison of logistic regression models with alternative machine learning methods to predict the risk of in-hospital mortality in emergency medical admissions via external validation. Health Informatics J. 2020;26(1):34–44. doi:10.1177/1460458218813600
 © 2021 The Author(s). This work is published and licensed by Dove Medical Press Limited. The
full terms of this license are available at https://www.dovepress.com/terms
and incorporate the Creative Commons Attribution
- Non Commercial (unported, 3.0) License.
By accessing the work you hereby accept the Terms. Non-commercial uses of the work are permitted
without any further permission from Dove Medical Press Limited, provided the work is properly
attributed. For permission for commercial use of this work, please see paragraphs 4.2 and 5 of our Terms.
© 2021 The Author(s). This work is published and licensed by Dove Medical Press Limited. The
full terms of this license are available at https://www.dovepress.com/terms
and incorporate the Creative Commons Attribution
- Non Commercial (unported, 3.0) License.
By accessing the work you hereby accept the Terms. Non-commercial uses of the work are permitted
without any further permission from Dove Medical Press Limited, provided the work is properly
attributed. For permission for commercial use of this work, please see paragraphs 4.2 and 5 of our Terms.