")
Back to Journals » International Journal of General Medicine » Volume 14
CARS as a Prognosis Factor in Clear Cell Renal Cell Carcinoma and Its Association with Tumor Immunity
Received 30 April 2021
Accepted for publication 11 June 2021
Published 6 July 2021 Volume 2021:14 Pages 3197—3211
DOI https://doi.org/10.2147/IJGM.S318278
Checked for plagiarism Yes
Review by Single anonymous peer review
Peer reviewer comments 2
Editor who approved publication: Dr Scott Fraser
Quan Meng,1 Can-Xuan Li,2 Dan Long3
1Department of Clinical Laboratory, Shenzhen Traditional Chinese Medical Hospital, Shenzhen, Guangdong, People’s Republic of China; 2Department of Urology, Shenshan Central Hospital, Sun Yat-sen Memorial Hospital, Sun Yat-sen University, Shanwei, Guangdong, People’s Republic of China; 3Respiratory Medicine, Shenshan Central Hospital, Sun Yat-sen Memorial Hospital, Sun Yat-sen University, Shanwei, Guangdong, People’s Republic of China
Correspondence: Can-Xuan Li
Department of Urology, Shenshan Central Hospital, Sun Yat-sen Memorial Hospital, Sun Yat-sen University, Shanwei, 516600, Guangdong, People’s Republic of China
Email [email protected]
Aim: The aim of this study was to investigate the expression of CARS (cysteinyl-tRNA synthetase) in clear cell renal cell carcinoma (ccRCC) and its biological action mechanisms.
Methods: Expression profiles and clinical information were obtained from The Cancer Genome Atlas (TCGA) to estimate the CARS expression patterns in ccRCC, its relationship with clinicopathological variables, and prognosis of ccRCC and potential biological mechanisms in ccRCC.
Results: CARS was significantly elevated in ccRCC. Overexpression of CARS indicated disease progression. Univariate and multivariate Cox regression analyses identified CARS as an independent prognostic factor for overall survival (OS) in renal clear cell carcinoma. Mechanically, CARS influenced the progression of ccRCC through several tumor-related pathways. Additionally, we found that CARS was significantly associated with tumor mutational burden, tumor-infiltrating immune cells, immunosuppressive molecules, methyltransferases, and mismatch repair proteins.
Conclusion: CARS could serve as a promising prognostic biomarker and therapeutic target for ccRCC.
Keywords: CARS, clear cell renal cell carcinoma, prognosis
Introduction
Renal cell carcinoma (RCC) is a heterogeneous tumor whose incidence is rising, of which clear cell renal cell carcinoma (ccRCC) is the most prevalent pathological subtype, accounts for 70–85% of all renal tumors.1 Considerable progress has been made in ccRCC treatment; the prognosis of this disease is still poor, especially for metastasis and advanced patients of ccRCC.2 Additionally, The molecular mechanisms of ccRCC initiation and progression still elusive.3 Targeted therapy and immunotherapy are deemed to be promising cancer treatment options, but the existing treatment has limitations, such as drug resistance and side effects.4 It is imperative to search out novel targeted biomarker and to investigate its mechanisms in ccRCC.
CARS (cysteinyl-tRNA synthetase) is a protein-coding gene located on chromosome band 11p15.5. It is a kind of Aminoacyl-tRNA synthetases; in addition to its traditional role in protein synthesis, new functions have been discovered in inflammation, angiogenesis and tumorigenesis.5–7 Tian et al8 demonstrated that Polymorphisms (rs384490, rs729662, rs2071101, and rs7394702) in CARS are significantly associated with gastric cancer risk. Cho et al found that CARS would be secreted under the stress of the local microenvironment that tumors often encounter and thus activated antigen-presenting cells (APCs) such as macrophages, indicating its great potential as an immune enhancement platform for various cancer vaccines with checkpoint inhibitors.9 Loss of CARS inhibits ferroptosis induced by cystine deprivation, a form of regulated non-apoptotic cell death that has been implicated in several cancers. Although CARS has demonstrated its potential as a tumor target. Yet little is known about its action mechanisms and biological functions in the initial and development of ccRCC. The principal objective of this work was to investigate the expression patterns, clinical significance, and underlying biological functions and action mechanisms of CASR in ccRCC.
With the development and application of high-throughput sequencing technology, large amounts of oncology data are stored in public databases. We can use these data to find novel molecular targets for oncology drug therapy through bioinformatics approaches. In the present study, we used data from multiple databases, including TCGA, ICGC, and GEO databases, to comprehensively analyze the expression patterns of CARS in ccRCC, its correlation with clinical traits, and survival prognosis. Besides, we identified the independent prognostic factors associated with the overall survival of ccRCC patients and construct a nomogram. Then, we performed functional enrichment analysis to investigate the potential biological processes and signaling pathways. Furthermore, we performed analyses to assess the association of CARS with microsatellite instability (MSI), Tumor mutational burden (TMB), tumor-infiltrating immune cells (TIICs), immunosuppressive molecules, methyltransferases, and mismatch repair proteins in ccRCC. These results elucidate the critical role of CARS in ccRCC, and we hope that our findings can provide a theoretical reference for further preclinical research.
Materials and Methods
Data Collection
Standardized RNA-seq data (HTSeq-FPKM data) was downloaded from the TCGA database (https://portal.gdc.cancer.gov/)10 The patients with incomplete clinicopathological features or survival time were excluded, and finally we included 530 ccRCC samples and 72 matched adjacent normal renal samples in our study. Related clinical information of ccRCC patients was listed in Table 1. Moreover, Transcriptome data from the ICGC database, GSE15641, GSE36895, GSE53757, and GSE66272 datasets were employed for external expression validation. The ICGC database collects tumor data for 50 different cancer types (or subtypes), including abnormal gene expression, somatic mutations, epigenetic modifications, and clinical data.11 GSE53757 and GSE36895 were from the Gene Expression Omnibus, a public functional genomics data repository. Among them, the GSE15641 dataset was from the GPL96 platform ([HG-U133A] Affymetrix Human Genome U133A Array), containing 32 ccRCC tissues and 23 noncancerous tissues.12 GSE36895, GSE53757 and GSE66272 datasets were all from the GPL570 platform ([HG-U133_Plus_2] Affymetrix Human Genome U133 Plus 2.0 Array), including 23 normal renal specimens and 32 ccRCC specimens.13,14 Seventy-two normal samples and 72 ccRCC samples,15 and 27 normal renal specimens and 27 ccRCC specimens,16,17 respectively.
 |
Table 1 Characteristics of Clear Cell Renal Cell Carcinoma Patients in the TCGA Database |
Co-Expressed Genes with CARS and Functional Enrichment Analysis
Genes associated with CARS were obtained by calculating the Spearman correlation coefficient; genes that meet the criteria Spearman correlation coefficients>0.4 and p<0.001 were applied for further investigation. To better understand the potential action mechanisms of CARS, we performed functional enrichment analysis of CARS and its functional partners using the Metascape. Metascape (https://metascape.org/gp/maintenance.html#/main/step1), a robust online database, integrates GO, KEGG, UniProt, and Drugbank to complete not only pathway enrichment and biological process annotation, but also gene-related protein network analysis and drug analysis.18
Association of CARS with Microsatellite Instability (MSI) and Tumor Mutational Burden (TMB)
With the help of Misa (http://pgrc.ipk-gatersleben.de/misa/misa.html), we screened all autosomal microsatellite regions containing five or more repeat subunits of 1–5 bp in length.19 Based on the number of somatic non-synonymous mutations (NSM), we performed mutation burden analysis by comparing sequence data between tumor tissue and its blood samples.20 Also, seq2HLA version 2.2 was used to obtain 4-digit typing data for various tumors without changing the default settings in the TCGA database.
Associations of CARS with Tumor-Infiltrating Immune Cells (TIICs), Immunosuppressive Molecules, Methyltransferases, and Mismatch Repair Proteins in ccRCC
TIMER (https://cistrome.shinyapps.io/timer/) is a web server for comprehensive analysis of tumor-infiltrating immune cells.21 The “DiffExp” module allows users to study the differential expression of any gene of interest in all TCGA tumors between the tumor and adjacent normal tissues. In the present study, we used the “DiffExp” module to determine differences CARS of expression in tumor and normal samples. The “Gene” module allows the user to select any gene of interest and visualize its expression concerning the level of immune infiltration in different cancer types. We used the “Gene” module to assess the relationship between CARS expression and six immune cell infiltration levels. Additionally, we analyzed the associations of CARS and immune immunosuppressive molecules, DNA methyltransferases, and mismatch repair proteins in ccRCC.
Statistical Analysis
The Wilcoxon signed-rank test was utilized to compare the expression levels of CARS in ccRCC samples with that in normal renal samples. Receiver operating characteristic curve (ROC) for assessing the ability of CARS to identify ccRCC and normal renal tissues. The Wilcoxon signed-rank test and logistic regression were used to explore the association between clinicopathological variables and CARS expression. Kaplan–Meier survival method with Log rank test was used to estimate the effect of CARS on overall survival of ccRCC patients. Univariate Cox regression and multivariate Cox analyses were performed to screen the independent prognostic factors. P < 0.05 was regarded as statistically significant. All statistical analyses were carried out using R 3.6.1 software.
Results
CARS Was Highly Expressed in ccRCC
In this study, we found that CARS was highly expressed in most malignancies, including BRCA, CHOL, COAD, ESCA, HNSC, KICH, KIRC, KIRP, LIHC, LUAD, LUSC, PCPG, PRAD, READ, STAD, and UCEC (Figure 1A). However, lower expression was found in THCA. Transcriptome data from TCGA, ICGC, GSE15641, GSE36895, GSE53757, and GSE66272 demonstrated that CARS was remarkably higher in ccRCC specimens than in adjacent normal renal samples (Figure 1B–G). The areas under ROC curve (AUC) were 0.940, 0.998, 0.984, 0.969, 0.959 and 0.940 in GSE66272, GSE53757, GSE36895, GSE15641, TCGA, and ICGC datasets, respectively (both p < 0.001) (Figure 2A–G), indicating the ability of CARS to differentiate cancer from normal tissues.
 |
Figure 1 CARS were highly expressed in ccRCC samples. (A) CARS expression levels in different tumor types from TCGA database were determined by TIMER (*p < 0.05, **p < 0.01, ***p < 0.001); (B–G) data from TCGA, ICGC, GSE15641, GSE36895, GSE53757 and GSE66272 showed that CARS were highly expressed in ccRCC samples (both p < 0.001). |
 |
Figure 2 CARS had an excellent ability to distinguish ccRCC tissue from normal tissues. (A) Forest plot showing AUC values for CARS across all datasets; (B–G) the areas under ROC curve (AUC) were 0.940, 0.998, 0.984, 0.969, 0.959 and 0.940 in GSE66272, GSE53757, GSE36895, GSE15641, TCGA, and ICGC datasets, respectively (both p < 0.001). |
Association of CARS Expression with Clinicopathologic Features
To investigate the association between CARS expression and ccRCC progression, we investigate the relationship between CARS expression and clinicopathologic features in ccRCC patients. Using the Wilcoxon signed-rank test, we found no statistically significant differences in CARS expression by age and gender (Figure 3A and B). Whereas, CARS was significantly elevated in ccRCC patients of high histologic grade (p < 0.001), clinical stage (p < 0.001), T classification (p < 0.001), N classification (p = 0.001), and M classification (p < 0.001) (Figure 3C–G). The logistic regression analysis results showed that increased expression level of CARS was significantly associated with stage (OR = 1.609 for stage III vs I, p < 0.05; OR = 3.067 for stage IV vs I, p < 0.001); grade (OR = 4.917 for grade 4 vs 1, p < 0.01); T classification (OR = 1.784 for T3 vs T1, p < 0.01); N classification (OR = 4.751 for N1 vs N0, p < 0.05); and M classification (OR =2.786 for M1 vs M0, p = p < 0.001) (Table 2).
 |
Table 2 Association of CARS Expression with Clinicopathological Characteristics (Logistic Regression Analysis) |
 |
Figure 3 The relationship between CARS expression levels with clinical features of ccRCC. (A) Age; (B) gender; (C) stage; (D) grade; (E) T stage; (F) N stage; (G) M stage. |
Survival Outcomes and Cox Regression Analyses
To explore the link between CARS expression and ccRCC prognosis, we investigate the relationship between CARS expression and the overall survival of ccRCC patients. Based on the median expression value of CARS, all patients were categorized as low- and high subgroups, Kaplan–Meier survival analysis with Log rank test was used to assess the prognosis value of CARS in ccRCC. Results indicate that its overexpression was significantly linked with a poorer prognosis in ccRCC (p < 0.001) (Figure 4A). Moreover, the AUCs (Area under the ROC curve) for 1-year, 3-year, and 5-year OS were 0.752, 0.679, and 0.678 (Figure 4B), indicating a good CARS performance for overall survival prediction. The univariate Cox regression and multivariate Cox analyses revealed that CARS expression and age were independent prognostic factors for OS of ccRCC (both p < 0.001) (Figure 4C and Table 3).
 |
Table 3 Association with Overall Survival and Clinicopathological Characteristics in Patients from the TCGA Database Using Cox Regression |
 |
Figure 4 Survival analysis and Cox regression analysis. (A) Kaplan–Meier survival analysis showed that patients of the high-CARS expression subgroup had a worse overall survival rate; (B) time-dependent ROC analyses at 1-, 3-, and 5- year OS prediction for CARS expression in ccRCC; (C) independent prognostic factors identified by multivariate Cox regression analysis. Note: ***p < 0.001. |
Development and Validation a Nomogram for Predicting OS of ccRCC
Then, we used independent prognostic factors, including age and CARS expression to construct nomogram to predict 1-year, 3-year, and 5-year OS of ccRCC patients (Figure 5A). Additionally, calibration curves indicated that actual and predicted survival matched very well in terms of 1-year (Figure 5B), 3-year (Figure 5C), and 5-year OS (Figure 5D). Taken together, the nomogram-based results confirmed a very effective accuracy for predicting the 1-, 3- and 5-year survival of ccRCC patients.
 |
Figure 5 A nomogram consisting of independent clinical features for predicting 1-, 3-, and 5-year OS of ccRCC. (A) Construction of a predictive nomogram; (B–D) calibration curves revealed that actual and predicted survival matched very well in terms of 1-year, 3-year and 5-year OS of ccRCC. |
Co-Expression and Functional Enrichment Analyses
To investigate the biological action mechanisms of CARS. We first find out its co-expressed genes by calculating the Spearman correlation coefficients; genes that meet the criteria Spearman correlation coefficients>0.4 and p < 0.001 were regarded as co-expressed genes with CARS. Results showed that 37 genes were considerably correlated with CARS, including 35 positively related genes and two negatively related genes. Figure 6A showed all positively and negatively related genes. Then, we perform functional enrichment analysis of CARS and its co-expressed genes through Metascape database. Functional enrichment analysis uncovered that CARS and its co-expressed genes were mainly enriched in cytosolic tRNA aminoacylation, collagen biosynthesis and modifying enzymes, cell–cell junction organization, and nuclear chromosome segregation (Figure 6B).
 |
Figure 6 Co-expression and functional enrichment analyses. (A) The top 20 positively and negatively genes associated with CARS; (B) heatmap of the biological processes enriched terms colored by P-values; (C) heatmap of the pathways enriched terms colored by P-values. |
Construction of Interaction Network and Association of CARS with MSI, TMB in ccRCC
We utilized the GeneMania database to build the gene–gene interaction network for CARS and its altered neighboring genes. The results showed that the 20 most frequently altered genes were considerably associated with CARS (Figure 7A). A protein–protein interaction (PPI) network of CARS was generated by applying the STRING database (Figure 7B). CARS was connected to 10 different genes in the PPI network. Microsatellite instability (MSI), a molecular fingerprint of a defect mismatch repair system, is an effective phenotype in tumor diagnosis and prognosis.22 Tumor mutational burden (TMB) is the total number of somatic coding mutations in cancer, which has gradually become a promising biomarker for immunotherapy response of tumor patients.23 Based on the ccRCC samples in the TCGA database, we further explored whether CARS was associated with MSI and TMB. The results showed that CARS was not related with MSI (p = 0.43, Figure 7C), but significantly associated with TMB (p = 0.0093, Figure 7D).
 |
Figure 7 Gene-gene interact network and protein-protein interact network of CARS (A and B); associations of CARS with MSI, TMB (C and D). |
Relationship Between CARS and Tumor-Infiltrating Immune Cells (TIICs), Immunosuppressive Molecules, Methyltransferases, and Mismatch Repair Proteins
We estimated the association of CARS expression and six immune cell infiltration levels via the TIMER database, and we found that CARS was positively associated with the immune infiltration levels of B cells, CD 4+ T cells, CD 8+ T cells, neutrophils, macrophages, and dendritic cells (both p < 0.001) (Figure 8A). Moreover, we found that CARS was significantly associated with 23 immunosuppressive molecules in ccRCC (Figure 8B), including NRP1, LAIR1, TNFSF4, LAG3, ICOS, CTLA4, CD28, CD276, CD80, PDCD1, LGALS9, ICOSLG, PDCD1LG2, TNFRSF8, VSIR, CD40, TNFRSF18, TNFSF15, TIGIT, CD274, CD86, CD44, and TNFRSF9. Additionally, the DNA methyltransferase DNMT1 (p < 0.001), DNMT2 (p < 0.001), DNMT3A (p < 0.001), DNMT3B (p < 0.001) were likewise significantly correlated with the expression level of CARS in ccRCC (Figure 8C). Furthermore, we also found that CARS was significantly related to mismatch repair proteins, including MLH1, MSH2, MSH6, and PNS2 (both p < 0.001) in ccRCC (Figure 8D)
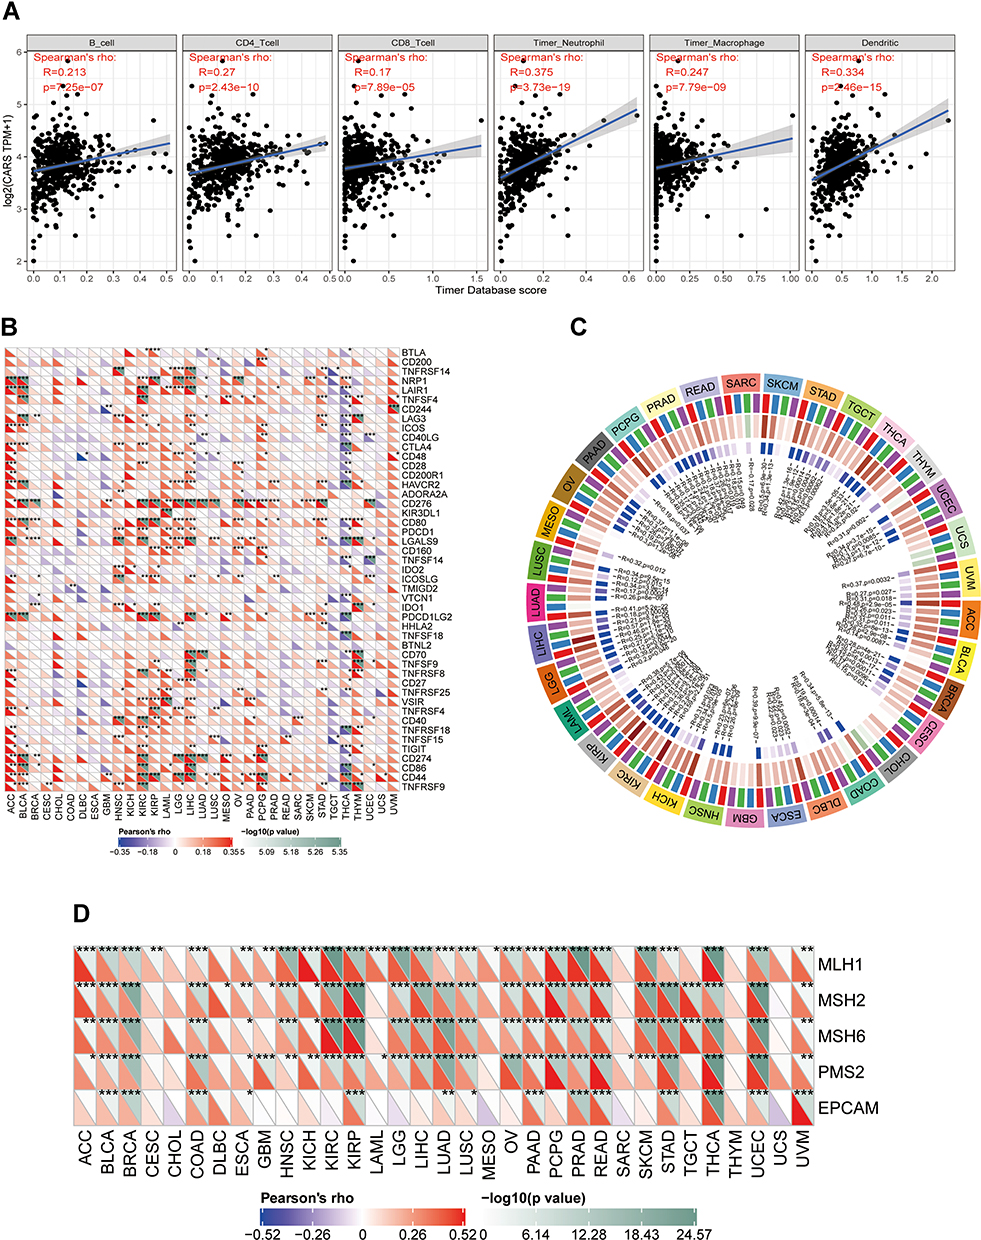 |
Figure 8 Associations of CARS with immune infiltrations, immune checkpoint molecules, methyltransferases and mismatch repair proteins in ccRCC. (A) Association of CARS with six immune cell infiltration levels in ccRCC (TIMER database); (B) associations of CARS with immune infiltrations, immune checkpoint molecule (*P < 0.05, **P < 0.01, ***P < 0.001); (C) associations of CARS with methyltransferases in ccRCC; (D) associations of CARS with mismatch repair proteins in ccRCC. |
Discussion
Clear cell renal cell carcinoma is one of the most lethal malignant tumors. Its treatment faces significant challenges, and the prognosis of this disease is unsatisfactory, especially for patients with advanced and metastatic diseases. Cysteinyl-tRNA synthetase is a member of a gene family encoding proteins, which plays a crucial role in the initial and development of cancer. However, there are few reports on the role of CARS in ccRCC.
Hence, we comprehensively and systematically explored the roles CARS in ccRCC. First, we confirmed that CARS was highly expressed in ccRCC tissues, and CARS had an excellent ability to distinguish ccRCC tissue from normal tissues. Then, we found that elevated CARS expression was markedly associated with advanced clinicopathologic variables and unfavorable prognosis. Besides, univariate Cox regression and multivariate Cox regression analyses demonstrated that CARS was an independent risk factor for ccRCC patients. All of the results suggested that CARS might serve as an oncogene in ccRCC. Additionally, we built a nomogram using the identified independent prognostic factors to assess the overall survival of ccRCC patients, and calibration plots showed that the nomogram performed well at predicting 1-year, 3-year, and 5-year overall survival in ccRCC patients.
To better explore the potential mechanisms of CARS in ccRCC. First, we obtained the co-expressed genes of CARS in the TCGA database. Then, we perform functional enrichment analysis to explore the biological processes and signaling pathways of CARS in ccRCC. Results showed that CARS and its co-expressed genes were significantly enriched in several cancer-related biological processes and pathways, including cytosolic tRNA aminoacylation, collagen biosynthesis and modifying enzymes, cell–cell junction organization, and nuclear chromosome segregation. Cytosolic tRNA aminoacylation is an important step in blocking protein synthesis and plays an important role in regulating the growth of tumor cells.24 Collagen biosynthesis and modifying enzymes is a group of proteins that plays a role in the synthesis and modification of collagen, and collagen is the crucial element of the tumor microenvironment and partakes in tumor fibrosis.25 Cell–cell junction organization plays a key role in normal cellular physiological processes including tissue barrier function, cell proliferation and migration; Defects in cell–cell junction organization can cause a wide range of tissue abnormalities, which could disrupt homeostasis and are common in cancer.26 Many aspects of nuclear chromosome segregation are closely related to cell cycle control, abnormalities in the regulation of nuclear chromosome segregation would lead to carcinogenesis.27 Collectively, the above results suggested that these biological processes and pathways were associated ccRCC and also were the breakthrough point to understand the pathophysiological mechanisms of CARS in ccRCC.
Tumor-infiltrating lymphocytes, the hub component of the tumor microenvironment, are an independent predictor of sentinel lymph node status and survival in malignancies.28 Another interesting aspect of the present study is that CARS expression is associated with distinct immune infiltration levels in ccRCC. We found that CARS was positively correlated with the immune infiltration levels of B cells, CD 4+ T cells, CD 8+ T cells, neutrophils, macrophages, and dendritic cells, indicating that CARS plays a specific role in immune infiltration in ccRCC, especially those of neutrophils and dendritic cells. Additionally, the association between CARS expression and immunosuppressive molecules implies CARS’ role in modulating tumor immunology in ccRCC. Immunosuppressive molecules could help tumor cells evade immune surveillance by inhibiting the activation of immunocompetent cells (such as CD8 T cells). Herein, we found that CARS is significantly related to various tumor-related immunosuppressive molecules, including several immune checkpoint inhibitors, such as PDCD1, CTLA4, LAG3, CD276, VSIR, TIGIT, and so on. PDCD1 and CTLA-4 were two of the first and most promising targets to be identified. PDCD1 (PD-1) could inhibit CD8 T cell activation and promote depletion.29 CTLA-4, expressed in activated CD 4 and CD 8 T cells, suppresses the activated T cell response and mediates the immunosuppressive function of Tregs.30 Recently research found that blocking LAG-3 resulted in higher T cell activation by comparing PD-1/PD-L1.31 In various malignancies, the CD274 (PD-L1) immune checkpoint ligand inhibits anti-tumor immunity by interacting with the PDCD1 receptor of T lymphocytes.32 CD276 (B7-H3) served as another key immune checkpoint member. Compared with other immune checkpoints, B7-H3 pathway modulated innate and adaptive immunity and promoted the invasiveness of cancer cells through various non-immune functions.33 Therefore, B7-H3 represented an attractive target for cancer immunotherapy. VISTA (V-domain immunoglobulin suppressor of T cell activation) is a member of the B7 family of NCR (negative checkpoint regulator) and serves as a novel target for immunotherapy. A number of preclinical studies have confirmed the potential role of VISTA in mediating immunosuppressive TME (Tumor microenvironment).34 As to TIGIT, it could inhibit immune cell function at multiple steps in the tumor immune cycle.35 All the above analyses suggested that ccRCC patients with high CARS expression had a strong immunosuppressive effect, indicated its important potential functions in cancer immunity.
This study comprehensively compared the differential expression of CARS between ccRCC and normal renal samples. Elevated CARS expression is significantly connected with disease progression of ccRCC. CARS may be correlated with cell proliferation, post-transcriptional and immune infiltration of ccRCC. In conclusion, CARS may as a promising biomarker and potential therapeutic target in ccRCC. Nevertheless, several limitations should be overlooked. First, due to the retrospective data and limited clinical information from TCGA, a larger sample size and sufficient clinical information were required to validate our results. Second, there is a lack of evidence of CARS protein levels in ccRCC. Third, the precise mechanism of CARS impact ccRCC patient prognosis has not been fully illustrated (related to tumor proliferation, or abnormal post-transcriptional, or immune suppression, or both?) Further advanced studies were required to validate our conclusions.
Data Sharing Statement
The RNA-seq and clinical data of the 530 ccRCC patients from TCGA database were downloaded from https://portal.gdc.cancer.gov/.
Ethical Approval and Consent to Participate
The public database mentioned in this study is publicly available for re-analyzing, and no ethical approval was required by the local ethics committees, so that this study does not require the ethics approval.
Acknowledgments
We thank the reviewers for their constructive comments.
Author Contributions
All authors made substantial contributions to conception and design, acquisition of data, or analysis and interpretation of data; took part in drafting the article or revising it critically for important intellectual content; agreed to submit to the current journal; gave final approval of the version to be published; and agreed to be accountable for all aspects of the work.
Funding
There is no funding to report.
Disclosure
The authors report no competing interests in this work.
References
1. Grignon DJ, Che M. Clear cell renal cell carcinoma. Clin Lab Med. 2005;25(2):305–316. doi:10.1016/j.cll.2005.01.012
2. Perazella MA, Dreicer R, Rosner MH. Renal cell carcinoma for the nephrologist. Kidney Int. 2018;94(3):471–483. doi:10.1016/j.kint.2018.01.023
3. Barata PC, Rini BI. Treatment of renal cell carcinoma: current status and future directions. CA Cancer J Clin. 2017;67(6):507–524. doi:10.3322/caac.21411
4. Escudier B, Porta C, Schmidinger M, et al. Renal cell carcinoma: ESMO clinical practice guidelines for diagnosis, treatment and follow-up. Ann Oncol. 2019;30(5):706–720. doi:10.1093/annonc/mdz056
5. Kim S, You S, Hwang D. Aminoacyl-tRNA synthetases and tumorigenesis: more than housekeeping. Nat Rev Cancer. 2011;11(10):708–718. doi:10.1038/nrc3124
6. Park SG, Schimmel P, Kim S. Aminoacyl tRNA synthetases and their connections to disease. Proc Natl Acad Sci U S A. 2008;105(32):11043–11049. doi:10.1073/pnas.0802862105
7. Kwon NH, Fox PL, Kim S. Aminoacyl-tRNA synthetases as therapeutic targets. Nat Rev Drug Discov. 2019;18(8):629–650. doi:10.1038/s41573-019-0026-3
8. Tian T, Xiao L, Du J, et al. Polymorphisms in CARS are associated with gastric cancer risk: a Two-Stage Case-Control Study in the Chinese population. Gastric Cancer. 2017;20(6):940–947. doi:10.1007/s10120-017-0717-6
9. Cho S, Kim SB, Lee Y. Endogenous TLR2 ligand embedded in the catalytic region of human cysteinyl-tRNA synthetase 1. J Immunother Cancer. 2020;8(1):e000277. doi:10.1136/jitc-2019-000277
10. Hutter C, Zenklusen JC. The cancer genome atlas: creating lasting value beyond its data. Cell. 2018;173(2):283–285. doi:10.1016/j.cell.2018.03.042
11. Zhang J, Bajari R, Andric D. The international cancer genome consortium data portal. Nat Biotechnol. 2019;37(4):367–369. doi:10.1038/s41587-019-0055-9
12. Jones J, Otu H, Spentzos D, et al. Gene signatures of progression and metastasis in renal cell cancer. Clin Cancer Res. 2005;11(16):5730–5739. doi:10.1158/1078-0432.CCR-04-2225
13. A-llopis PE, Vega-Rub N-de-Celis S, Liao A. BAP1 loss defines a new class of renal cell carcinoma. Nat Genet. 2012;44(7):751–759. doi:10.1038/ng.2323
14. A-llopis PE, Brugarolas J. Simultaneous isolation of high-quality DNA, RNA, miRNA and proteins from tissues for genomic applications. Nat Protoc. 2013;8(11):2240–2255. doi:10.1038/nprot.2013.141
15. Von Roemeling CA, Radisky DC, Marlow LA, et al. Neuronal pentraxin 2 supports clear cell renal cell carcinoma by activating the AMPA-selective glutamate receptor-4. Cancer Res. 2014;74(17):4796–4810. doi:10.1158/0008-5472.CAN-14-0210
16. Wotschofsky Z, Gummlich L, Liep J, et al. Integrated microRNA and mRNA signature associated with the transition from the locally confined to the metastasized clear cell renal cell carcinoma exemplified by miR-146-5p. PLoS One. 2016;11(2):e0148746. doi:10.1371/journal.pone.0148746
17. Liep J, Kilic E, Meyer HA, et al. Cooperative effect of miR-141-3p and miR-145-5p in the regulation of targets in clear cell renal cell carcinoma. PLoS One. 2016;11(6):e0157801. doi:10.1371/journal.pone.0157801
18. Zhou Y, Zhou B, Pache L, et al. Metascape provides a biologist-oriented resource for the analysis of systems-level datasets. Nat Commun. 2019;10(1):1523. doi:10.1038/s41467-019-09234-6
19. Timmermann B, Kerick M, Roehr C, et al. Somatic mutation profiles of MSI and MSS colorectal cancer identified by whole exome next generation sequencing and bioinformatics analysis. PLoS One. 2010;5(12):e15661. doi:10.1371/journal.pone.0015661
20. Chalmers ZR, Connelly CF, Fabrizio D, et al. Analysis of 100,000 human cancer genomes reveals the landscape of tumor mutational burden. Genome Med. 2017;9(1):34. doi:10.1186/s13073-017-0424-2
21. Li T, Fan J, Wang B, et al. TIMER: a web server for comprehensive analysis of tumor-infiltrating immune cells. Cancer Res. 2017;77(21):e108–e10. doi:10.1158/0008-5472.CAN-17-0307
22. Vilar E, Gruber SB. Microsatellite instability in colorectal cancer-the stable evidence. Nat Rev Clin Oncol. 2010;7(3):153–162. doi:10.1038/nrclinonc.2009.237
23. Fancello L, Gandini S, Pelicci PG, et al. Tumor mutational burden quantification from targeted gene panels: major advancements and challenges. J Immunother Cancer. 2019;7(1):183. doi:10.1186/s40425-019-0647-4
24. Jia J, Li B, Jin Y, et al. Expression, purification, and characterization of human tyrosyl-tRNA synthetase. Protein Expr Purif. 2003;27(1):104–108. doi:10.1016/S1046-5928(02)00576-4
25. Xu S, Xu H, Wang W, et al. The role of collagen in cancer: from bench to bedside. J Transl Med. 2019;17(1):309.
26. Garcia MA, Nelson WJ, Chavez N. Cell-cell junctions organize structural and signaling networks. Cold Spring Harb Perspect Biol. 2018;10(4):a029181. doi:10.1101/cshperspect.a029181
27. Hämälistö S, Stahl JL, Favaro E. Spatially and temporally defined lysosomal leakage facilitates mitotic chromosome segregation. Nat Commun. 2020;11(1):229. doi:10.1038/s41467-019-14009-0
28. Gajewski TF, Schreiber H, Fu YX. Innate and adaptive immune cells in the tumor microenvironment. Nat Immunol. 2013;14(10):1014–1022. doi:10.1038/ni.2703
29. Par L, Pascual T, Segu E, et al. Association between PD1 mRNA and response to anti-PD1 monotherapy across multiple cancer types. Ann Oncol. 2018;29(10):2121–2128. doi:10.1093/annonc/mdy335
30. Rowshanravan B, Halliday N. CTLA-4: a moving target in immunotherapy. Blood J Am Soc Hematol. 2018;131(1):58–67.
31. Lichtenegger FS, Rothe M, Schnorfeil FM, et al. Targeting LAG-3 and PD-1 to enhance T cell activation by antigen-presenting cells. Front Immunol. 2018;9(385).
32. Masugi Y, Nishihara R, Yang J, et al. Tumour CD274 (PD-L1) expression and T cells in colorectal cancer. Gut. 2017;66(8):1463–1473. doi:10.1136/gutjnl-2016-311421
33. Picarda E, Ohaegbulam KC, Zang X. Molecular pathways: targeting B7-H3 (CD276) for human cancer immunotherapy. Clin Cancer Res. 2016;22(14):3425–3431. doi:10.1158/1078-0432.CCR-15-2428
34. Nowak EC, Lines JL, Varn FS, et al. Immunoregulatory functions of VISTA. Immunol Rev. 2017;276(1):66–79. doi:10.1111/imr.12525
35. Anderson AC, Joller N, Kuchroo VK. Lag-3, Tim-3, and TIGIT: co-inhibitory receptors with specialized functions in immune regulation. Immunity. 2016;44(5):989–1004. doi:10.1016/j.immuni.2016.05.001
 © 2021 The Author(s). This work is published and licensed by Dove Medical Press Limited. The full terms of this license are available at https://www.dovepress.com/terms.php and incorporate the Creative Commons Attribution - Non Commercial (unported, v3.0) License.
By accessing the work you hereby accept the Terms. Non-commercial uses of the work are permitted without any further permission from Dove Medical Press Limited, provided the work is properly attributed. For permission for commercial use of this work, please see paragraphs 4.2 and 5 of our Terms.
© 2021 The Author(s). This work is published and licensed by Dove Medical Press Limited. The full terms of this license are available at https://www.dovepress.com/terms.php and incorporate the Creative Commons Attribution - Non Commercial (unported, v3.0) License.
By accessing the work you hereby accept the Terms. Non-commercial uses of the work are permitted without any further permission from Dove Medical Press Limited, provided the work is properly attributed. For permission for commercial use of this work, please see paragraphs 4.2 and 5 of our Terms.