Back to Journals » Diabetes, Metabolic Syndrome and Obesity » Volume 12
Cardiovascular risk profile, oxygen uptake, and perceived exertion rate in children with obesity: the interactive effect of exercise intensity and duration
Authors Elnaggar RK ![]() , Elshazly FA
, Elshazly FA ![]() , Abdelbasset WK
, Abdelbasset WK ![]() , Ahmed AS
, Ahmed AS ![]()
Received 10 December 2018
Accepted for publication 11 February 2019
Published 17 April 2019 Volume 2019:12 Pages 527—536
DOI https://doi.org/10.2147/DMSO.S197642
Checked for plagiarism Yes
Review by Single anonymous peer review
Peer reviewer comments 3
Editor who approved publication: Dr Konstantinos Tziomalos
Ragab K Elnaggar,1,2 Fathy A Elshazly,1,2 Walid K Abdelbasset,2,3 Ahmed S Ahmed2,4
1Department of Physical Therapy for Pediatrics, Faculty of Physical Therapy, Cairo University, Giza, Egypt; 2Department of Physical Therapy and Health Rehabilitation, College of Applied Medical Sciences, Prince Sattam bin Abdulaziz University, Al-Kharj, Saudi Arabia; 3Department of Physical Therapy, Kasr Al-Aini Hospital, Cairo University, Giza, Egypt; 4Department of Physical Therapy for Cardiovascular, Respiratory Disorders, and Geriatrics, Faculty of Physical Therapy, Cairo University, Giza, Egypt
Background: Although physical exercise is a crucial element in the management of childhood obesity, the most effective training intensity and duration remain controversial. The primary purpose of this study was to analyze the interaction effects of exercise intensity and duration on cardiovascular risk profile, maximum oxygen uptake (VO2max), and rating of perceived exertion (RPE) in obese children.
Methods: Eighty obese children were allocated evenly to four groups (20 in each group): groups I and II performed 20 -minute and 40-minute constant-load treadmill training, respectively, with the intensity set at running speed, corresponding to 100% of first ventilatory threshold (VT1), and groups III and IV performed 20 -minute and 40-minute training, respectively, with the intensity set at running speed, corresponding to 80% of VT1. Training was conducted every other day for eight consecutive weeks. Blood lipids, VO2max, and RPE were assessed pre- and postintervention.
Results: Postintervention, significant between-group differences regarding all outcome measures (P<0.05) were indicated. Total cholesterol level had dropped significantly in group II compared to the other groups (adjusted P<0.05), and low-density lipoprotein and triglycerides had decreased significantly in group II compared to group III (adjusted P=0.003 and 0.007, respectively). VO2max had increased significantly in group II compared to group I (adjusted P=0.008). RPE had decreased significantly in group II in comparison to other groups (adjusted P<0.05).
Conclusion: Intensity and duration are essential factors in aerobic-exercise prescription to reduce cardiovascular risk factors, increase oxygen uptake, and improve perceived exertion in obese children.
Keywords: childhood obesity, aerobic exercises, cholesterol, lipoproteins, oxygen consumption, effort perception
Introduction
Pediatric obesity is a mounting global nutritional disorder that has a high morbidity and mortality rate among children and adolescents and is consequently a supreme public health concern.1 Children are frequently becoming obese or overweight when they inherit the traits of obesity from their parents, have bad nutritional behaviors, particularly consume high-calorie diets and beverages, and/or when they engage in a sedentary lifestyle with an extremely low level of physical activity.2 Though current trends in childhood obesity remained unchecked, the combination of many sources of data indicates an increase in global prevalence of pediatric obesity of ~47.1% in the last few decades.3 Additionally, international reports have indicated comparable increasing rates worldwide.4
Pediatric obesity is a complex condition that has deleterious effects, and it is well recognized that the condition may be associated with a plethora of cardiovascular hazards in the short, intermediate, or long term.5 Pediatric obesity is consistently linked with hypertension, hypercholesterolemia, abnormal lipoprotein, and triglyceride (TG) levels.6 Also, it has been clearly demonstrated that maximum oxygen uptake (VO2max) is significantly higher in overweight or obese individuals compared to their normal-weight counterparts, which becomes lower only when expressed proportionally with body weight.7 In addition, obese children usually experience significantly higher exertion rates with a standard workload than their peers of normal weight.7 With the initial effort to raise the level of physical activities, obese children may report an uncomfortable perception of exertion, discouraging them from getting engaged in future physical activities.8,9
Various interventions have been proposed for combating this epidemic including dietary control or exercise programs.10,11 Despite physical activities being a crucial element in the management of pediatric obesity, the ideal exercise program to reduce body mass and thereby adiposity has yet to be identified. Lately, an increasing number of research studies have addressed the effectiveness of different exercise modalities with variable intensities in the management of childhood obesity. High intense aerobic interval exercise has traditionally been indicated to improve lipid profile, adipokine levels, and quality of life.11,12 Also, moderate-intensity aerobic exercise has been shown to improve cardiometabolic risk, VO2max,13 and lipoprotein levels.14 Aerobic exercise combined with resistive training has been indicated to generate a significant reduction in fattiness and improvement in vascular dysfunction.15,16
Owing to the heterogeneity of physical training programs for pediatric obesity, to date, no decisive evidence exists about optimal exercise intensity and duration or the most appropriate combinations to maximize the benefits of exercise intervention in the condition. To the best of the research team’s knowledge, this is the first study to analyze the interaction effects of exercise intensity and duration on the cardiovascular risk profile, VO2max, and perceived exertion ratings in obese children. We hypothesized that exercise intensity would have a significant effect on cardiovascular risk profile, VO2max, and perception of exertion in obese children, and that this would interact significantly with duration of exertion.
Methods
Experimental design and subjects
Eighty obese children were recruited from seven local schools at Al-Kharj, Saudi Arabia and volunteered to take part in the present study. Their legal guardians were contacted by the school administration after consent had been obtained from the children. Details of the study were explained thoroughly to the participants and their families. The study protocol was approved by the Physical Therapy Research Ethics Committee (RHPT2017/014) at Prince Sattam bin Abdulaziz University, Saudi Arabia. Procedures followed were in accordance with the Declaration of Helsinki. Authorized-guardian agreement was obtained by signing a consent form. Participants were recruited if they were determined as obese subjects (body-mass index [BMI] above the 95th percentile for children of the same age and sex),17 aged 10–16 years, did not suffer from endocrinal or cardiovascular abnormalities, were sedentary, had not participated in any regular exercise programs in the past 6 months except school physical education periods, and did not use any drugs or other therapies for obesity. Participants were excluded if they had bronchial asthma or other chronic obstructive pulmonary diseases, had a history of a panic/anxiety attack, or if they were recovering from a recent respiratory infection.
At entry, assessment of anthropometric characteristics and measurement of the treadmill-training speed at the first ventilatory threshold (VT1) were carried out for each participant. VT1 was marked as the point at which the breathing rate increased nonlinearly with the training time such that the subject was hardly able to speak while exercising or the point at which the ratio of ventilation to oxygen uptake was lowest.18,19
Participants were allocated in the order they were recruited in the study sequentially to perform one of four exercise protocols. They were allocated to two 20-minute and two 40-minute fixed training loads with intensity adjusted at a training speed corresponding to 100% VT1 (20 minutes’ 100% VT1 [group I], 40 minutes’ 100% VT1 [group II]) or with intensity adjusted at a training speed corresponding to 80% VT1 (20 minutes’ 80% VT1 [group III], 40 minutes’ 80% VT1 [group IV]). The number of participants in each intervention group was kept at 20. When a participant was excluded or withdrew from any group, an alternate participant was allocated to that group.
Dependent outcome measures
Anthropometry including assessment of body weight on a digital scale and height with a wall-mounted stadiometer. Next, BMI was calculated conventionally using the algorithm provided by the Centers for Disease Control and Prevention (weight/height2) at baseline and after 8 weeks at the end of the intervention program.
Cardiovascular risk profile
As an indicator of the risk of cardiovascular disorders, lipid profiles were assessed at entry and 8 weeks later following the intervention by collecting a blood sample from the dorsal or the antecubital veins. Blood samples were analyzed for total cholesterol (T-Cho), serum TGs, and high-density lipoprotein (HDL). Low-density lipoprotein (LDL) was calculated by the Friedewald formula (T-Cho minus HDL minus TGs/5).20 All samples were collected in the morning after an overnight fast of 12 hours. Children were also refrained from performing vigorous activities for 2 hours before sample collection. Procedures followed recommendations of the Centers for Disease Control and Prevention for standard laboratory investigation.21 The measures of lipid profile are expressed in milligrams per deciliter.
Oxygen-uptake and ventilatory-threshold measurement
In accordance with a protocol described in a previous study,22 a continuous graded incremental treadmill test was performed using a motor-driven treadmill (Mercury Med; HP Cosmos, Nussdorf, Germany) to determine VO2max and VT1 for each participant. After each participant had warmed up, he/she then started the test protocol with a treadmill speed of 2 km/h and progressively increased by 1 km/h every 2 minutes with no inclination until he/she volitionally reported exhaustion. Pulmonary exercise ventilation (VE) and VO2 were continuously measured breath by breath using a portable gas analyzer (Fitmate Pro; Cosmed, Rome, Italy). VO2max was taken as baseline VO2max (mL/kg/min). Following this procedure, one administrator identified the VT1 for each participant and subsequently the corresponding maximum aerobic training speed once at entry by plotting VE/VO2. Oxygen consumption at which VE/VO2 was lowest in the plot was the VT1.19 Heart rate (HR) was checked constantly at 5-second intervals and HR at VT1 recorded. The test was repeated once again after 8 weeks to determine posttreatment VO2max. Participants were observed closely and asked continuously about any adverse effects during the assessment. The test was promptly terminated if any effects were reported or observed.
Perceived exertion
The assessment was performed using the children’s Omni scale of perceived exertion for walking and running. The Omni walk/run scale has been indicated as a valid and reliable measure of perceived exertion over a wide range of intensity of dynamic exercise training in children and adolescents.23,24 It uses a 0–10 numeric rating with a pictorial descriptor that represents a child at different exertion levels walking/running, and exertion levels range from “not tired at all” to “very, very tired”. Prior to undertaking the assessment, participants were oriented to the perceived exertion definition and to the scaling instructions of the Omni walk/run scale. Immediately after the baseline stress test and completing the intervention sessions, each participant rated the perceived exertion and how he/she felt by the last minute of the stress test.
Exercise-training protocol
In four fixed-period treadmill training sessions, children were generally warmed up through submaximal aerobic and stretching activities almost for 10 minutes. The training protocol started initially by walking up the treadmill, and the speed progressively increased until reaching the target speed for each participant. Following that, the training time count commenced. The training speed was adjusted by group: 100% VT1 for 20 minutes in group I, 100% VT1 for 40 minutes in group II, 80% VT1 for 20 minutes in group III, and 80% VT1 for 40 minutes in group IV. Training for all groups was interspersed with 1 minute’s 50% VT1 training intensity at 10-minute intervals. Throughout the training, the participant’s HR was measured continuously at 5-second intervals with an HR monitor (S810i; Polar, Kempele, Finland). Participants in all intervention groups were trained three times a week for 8 consecutive weeks under close supervision by four rehabilitation experts. Before each session, participants were instructed to avoid eating for at least 2 hours before exercise and to avoid engagement in any strenuous activity.
Dietary control
A nutritional specialist held four meetings (biweekly) with the participants and their families during the study period. In the first meeting, participants were asked about the last 24-hour diet intake. Meetings were 30–45 minutes long and dedicated to learning about factors that contribute to pediatric obesity, getting feedback about food choices and dietary habits, and motivating participants and their families to enroll in the diet-control program. Subsequent meetings were ~30 minutes each and devoted basically to education about the food pyramid, appropriate food choices, food labels, healthy eating habits, regular meals, and how they could control the excessive-eating stimuli. Participants received a balanced hypocaloric dietary plan consisted of 15% protein, 30% fats, and 55% carbohydrates and fibers. Regular intervals of 4 hours were allowed between meals. Families were taught to keep the daily caloric intake of their children to a minimum of 900 calories and a maximum of 1,200 calories. This was achieved using the Traffic Light diet, where the food was categorized based on its calorie content into three colors: green for low-calorie food, yellow for low-calorie food that includes diet staples and provides basic nutrition, and red for high-calorie food.25 A list of foods according to color, food group, and calorie content was provided as a reference guide. In addition, a calorie-counting book was provided, which was reviewed by the dietitian with each family to use in calculation of calorie intake and monitoring adherence. Families were instructed to decrease access to high-fat, low-sugar products and increase access to high-fiber foods. They were also asked to reinforce and praise targeted behaviors of their children. Data about calorie intake was reported to the dietitian daily.
Sample-size determination
To protect against the probability of type II error, a preliminary power analysis was conducted using power-analysis and sample-size software (PASS15; NCSS Statistical Software). A proportion of the total variance equal to 0.2 was calculated from a small pilot study of eight children who received the same treatment (two children for each exercise level) with analysis of effects on VO2max. The actual effect size was estimated as 0.5, and fixed-effect ANOVA (α=0.05, power 0.9%) was used. The analysis indicated that a minimum sample of 64 participants was needed (16 participants for each group). However, we increased the sample size by 25% and recruited up to 60 to account for dropout rates and retain study power.
Data analysis
Normal distribution of all dependent outcome measures was verified by D’Agostino–Pearson test. Subsequently, arithmetic log or square-root data transformation was applied when necessary. ANOVA was used to compute differences among intervention groups. Pairwise comparisons with Tukey’s post hoc correction were applied whenever statistically significant differences were verified. Paired-sample t-tests were used to determine changes within each group. For perceived exertion ratings, we used the Kruskal–Wallis test to compute the differences between groups, Mann–Whitney U test pairwise comparison, and Wilcoxon signed-rank test for determining changes within each group. Data were assumed significant at P<0.05. Data analysis was performed using SPSS for Windows version 23.
Results
Participant characteristics
Participant demographic and anthropometric characteristics at baseline are presented in Table 1. No significant differences were recorded among the intervention groups with regard to age, weight, height, BMI, or sex (P>0.05). The mean walking speed corresponding to VT1 during the initial exercise test and average exercise HR were comparable in the four groups (P>0.05).
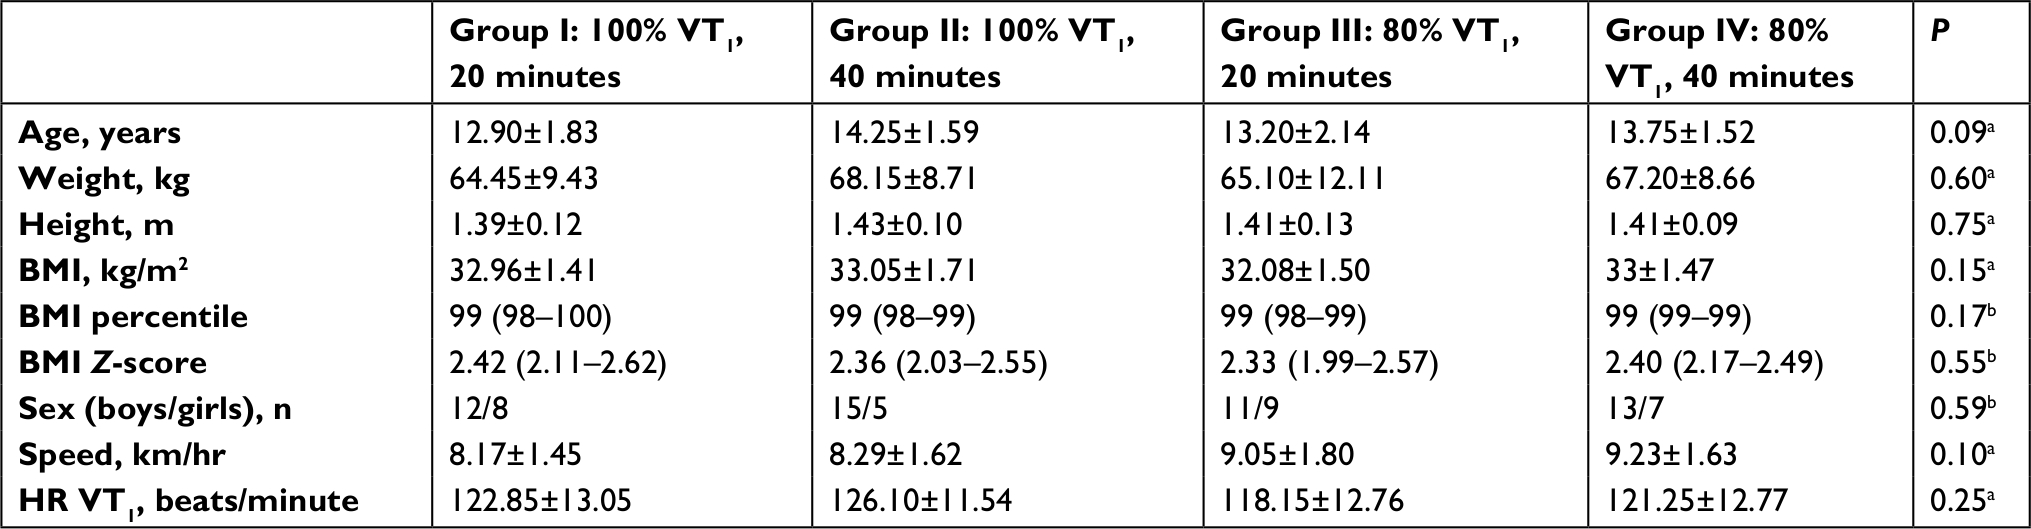 | Table 1 Demographic and anthropometric characteristics of the intervention groups at baseline Notes: aANOVA test; bKruskal–Wallis. BMI percentiles and Z-scores expressed as median (range). Age, weight, height, BMI, speed, and HR VT1 expressed as means ± SD. Abbreviations: BMI, body-mass index; VT, ventilatory threshold; HR, heart rate. |
Adherence to exercise training and dietary plan
The median exercise-training adherence was 85.42% (IQR 83.33%–90.63%) in group I, 91.67% (IQR 84.38%–94.79%) in group II, 87.50% (IQR 83.33%%–91.67%) in group III, and 91.67% (IQR 87.50%–95.83%%) in group IV, with no significant difference among the groups (P=0.149). Also, no significant between-group difference was observed in mean calorie intake reported over the study period (P=0.124). From baseline to week 8, the mean calorie intake was 1,064.45±65.86 in group I, 1,028.50±73.79 in group II, 1,073.35±70.54 in group III, and 1069.40±48.65 in group IV.
Evaluation of intervention effects
The evolution of weight loss from baseline to 8 weeks’ exercise training is shown in Figure 1. Although a significant reduction in body weight was indicated within all groups (P<0.05), the analysis revealed that all training groups had the same trends for weight loss from inception until week 8, and no detectable between-group differences were recorded (P>0.05) after they had completed the training period. BMI from pre- to postintervention reduced significantly in all groups (P<0.05). Also, between-group analysis revealed a significant postintervention difference (P=0.035, Figure 2). Pairwise comparison indicated that participants in group II had a tendency for lower BMI compared to those in group IV (adjusted P=0.049), with no other differences among the study groups (adjusted P>0.05).
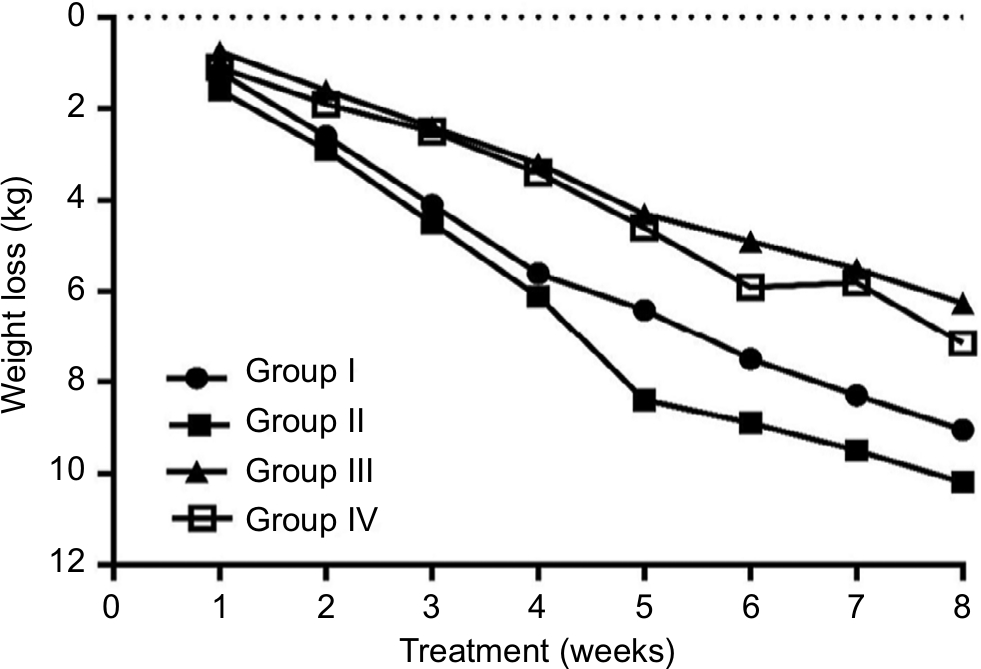 | Figure 1 Changes in body weight from baseline to 8 weeks in exercise training in all groups. |
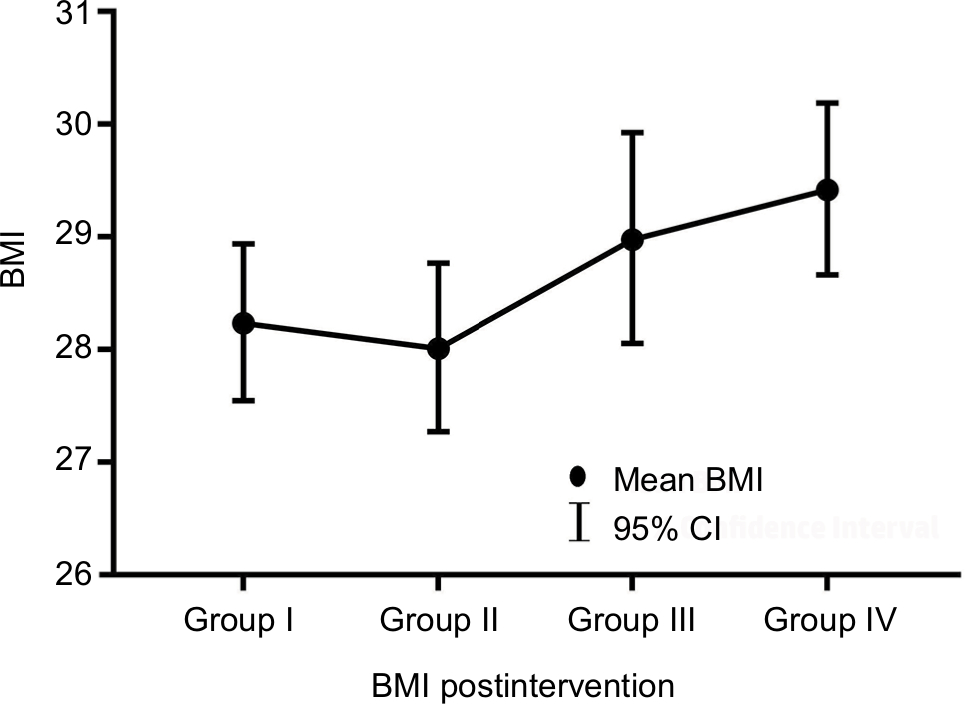 | Figure 2 Postintervention body-mass index (BMI) for the study groups. |
Cardiovascular risk indicators are shown in Table 2. At baseline, groups were homogeneous as regards data on T-Cho, HDL, LDL, and TGs (P>0.05). After 8 weeks in training, T-Cho, HDL, LDL, and TGs had changed significantly in groups I, II, and III (P<0.05) compared to preintervention values, whereas no detectable changes were indicated within group IV (P>0.05). Noticeably, T-Cho, HDL, LDL, and TGs varied significantly among the intervention groups postintervention (P<0.05). Pairwise analysis (Figure 3A) revealed a significant reduction in T-Cho in group II when compared to group I (adjusted P=0.006), group III (adjusted P=0.008), and group IV (adjusted P=0.015). Changes in T-Cho among groups I, III, and IV were not significant when comparing every pair together (adjusted P>0.05). Analysis of HDL levels (Figure 3B) demonstrated that there was no significance for any of the groups over others (adjusted P>0.05). Except for the significant reduction in LDL and TGs in group II when compared to group III (adjusted P=0.003 and 0.007, respectively). No other differences were indicated between groups (adjusted P>0.05, Figure 3C and D).
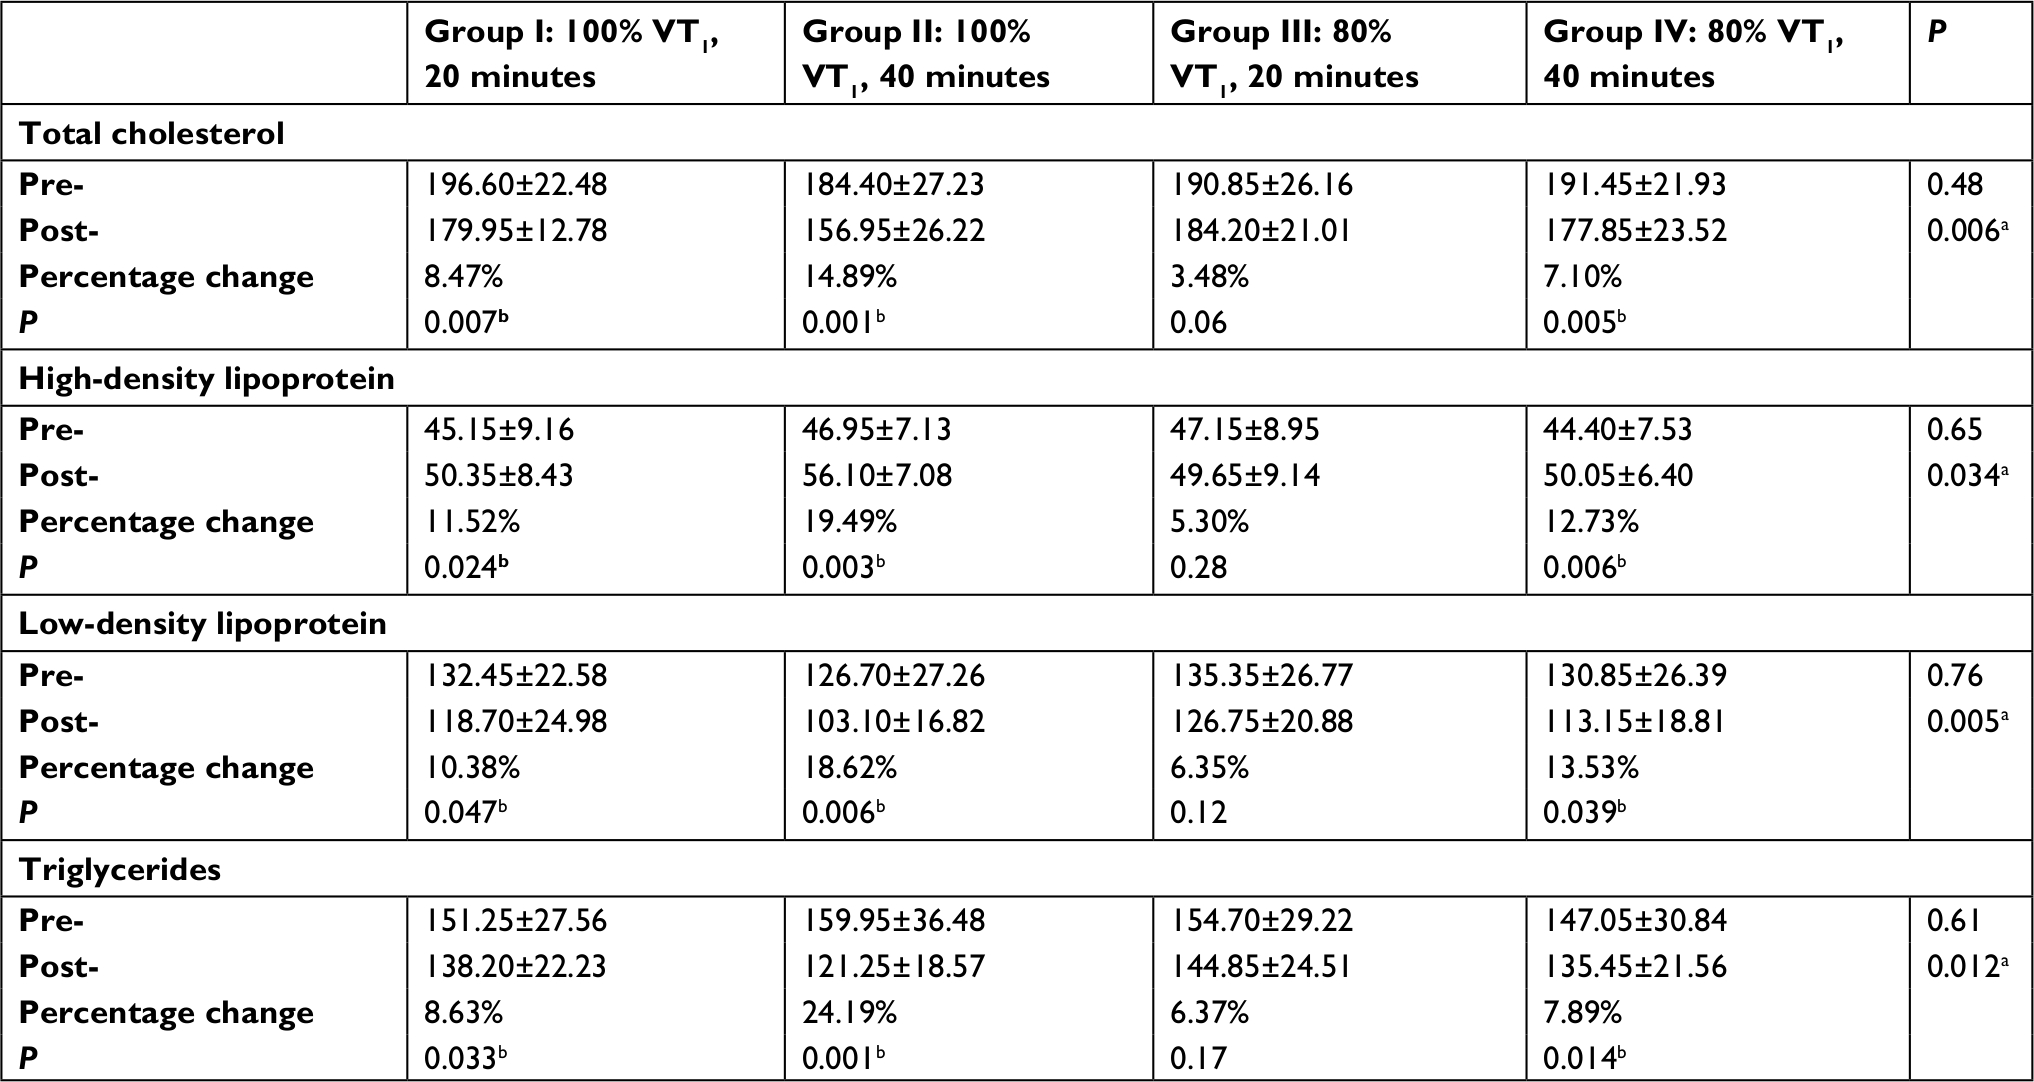 | Table 2 Lipid-profile measures among and within all intervention groups Notes: aSignificant between-group difference (one-way ANOVA); bsignificant within-group difference (paired-sample t-test). Abbreviation: VT, ventilatory threshold. |
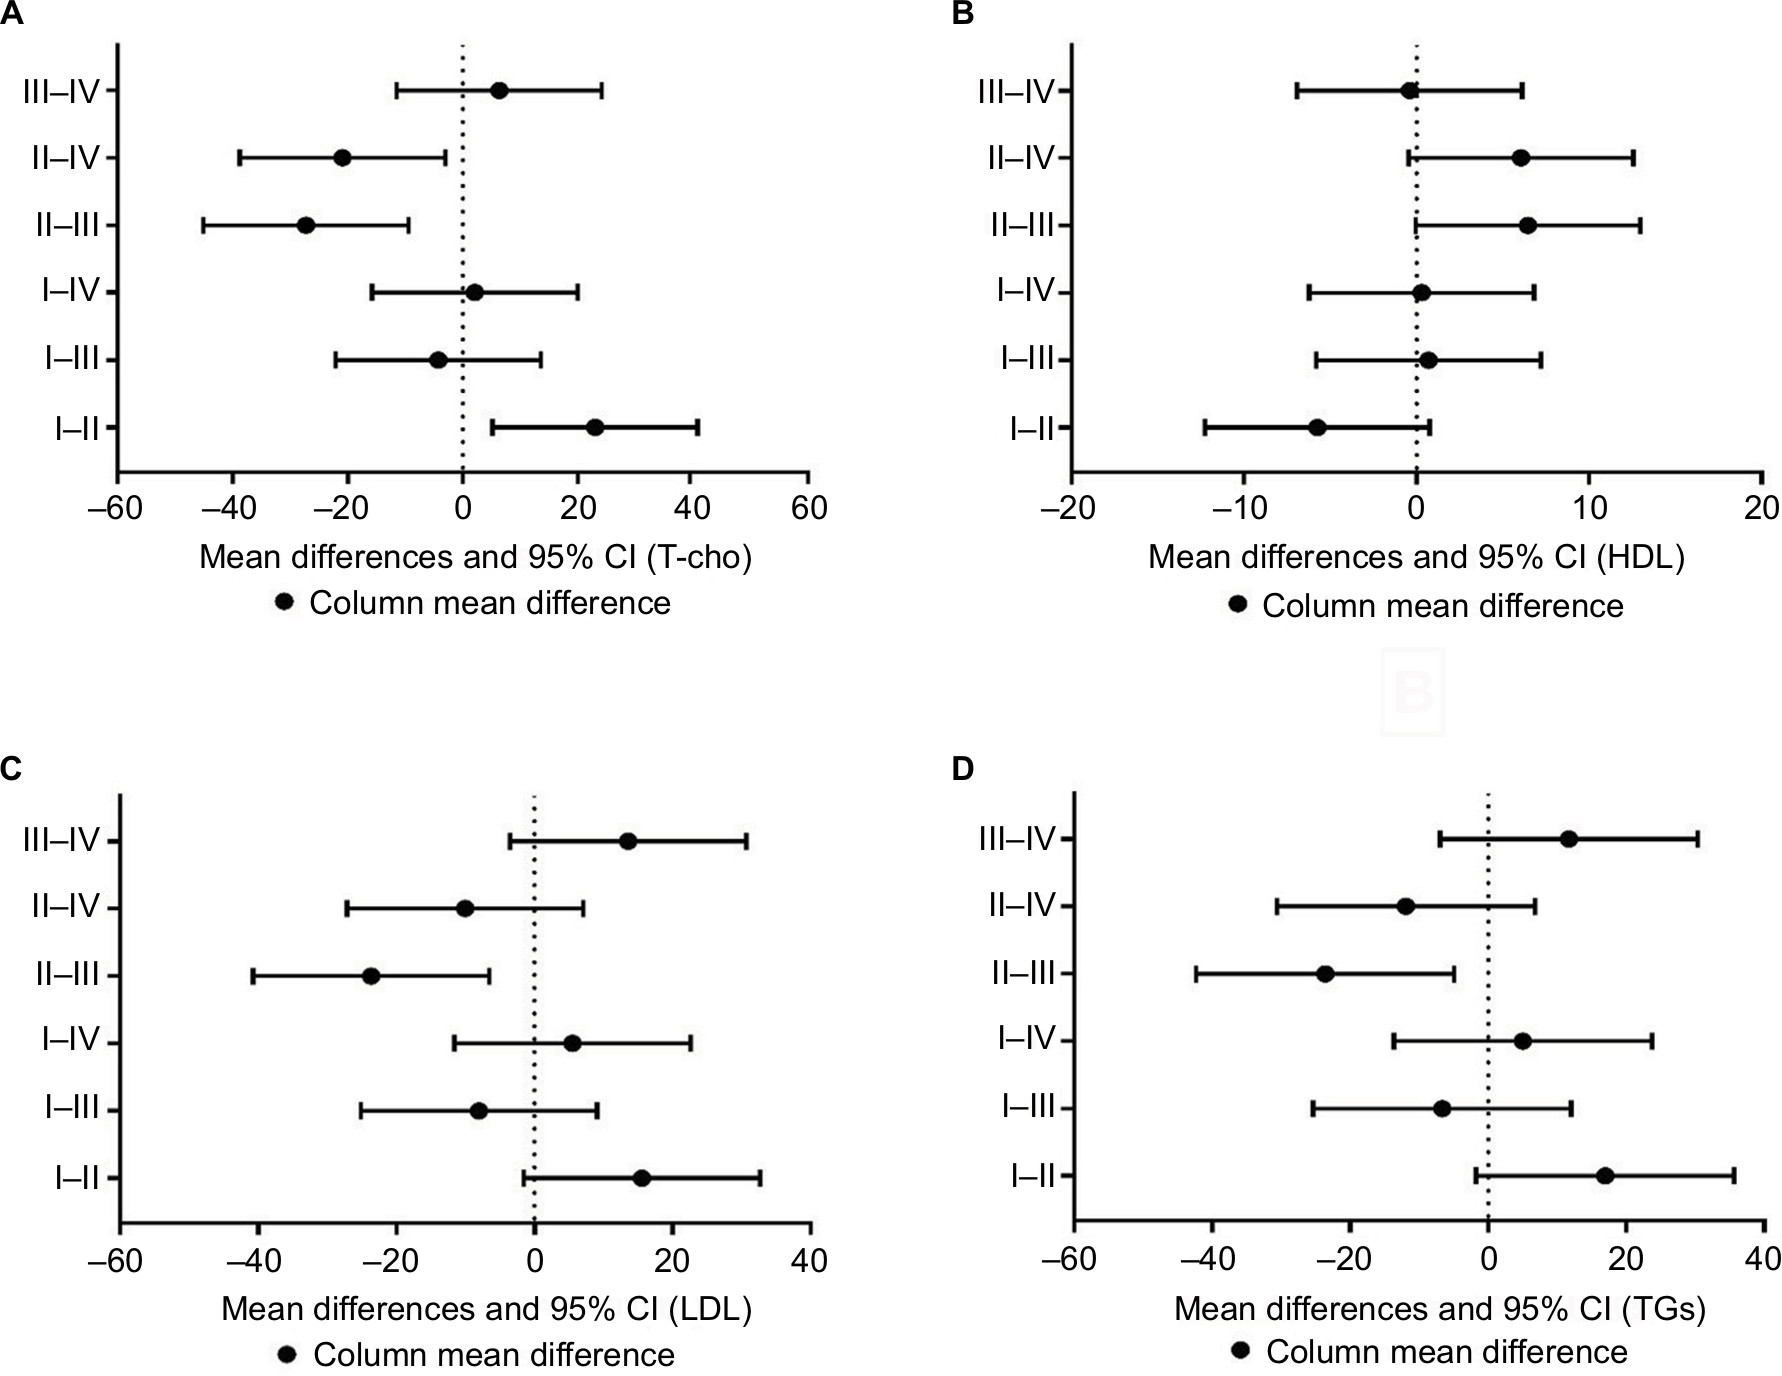 | Figure 3 Lipid profile pairwise comparisons among intervention groups. Notes: T-cho, Total cholesterol (A); HDL, high-density lipoprotein (B); LDL, low-density lipoprotein (C); TGs, triglycerides (D). |
Changes in VO2max are displayed in Table 3. There was no significant between-group difference preintervention (P>0.05). Compared to preintervention values, VO2max had increased significantly postintervention in groups I, II, and IV (P<0.05), but not in group III (P>0.05). A significant between-group difference was detected postintervention (P<0.05); pairwise analysis indicated a significant difference only between group I and group II, favoring the latter over the former (adjusted P=0.008); and no perceptible differences were indicated when comparing other pairs (adjusted P>0.05).
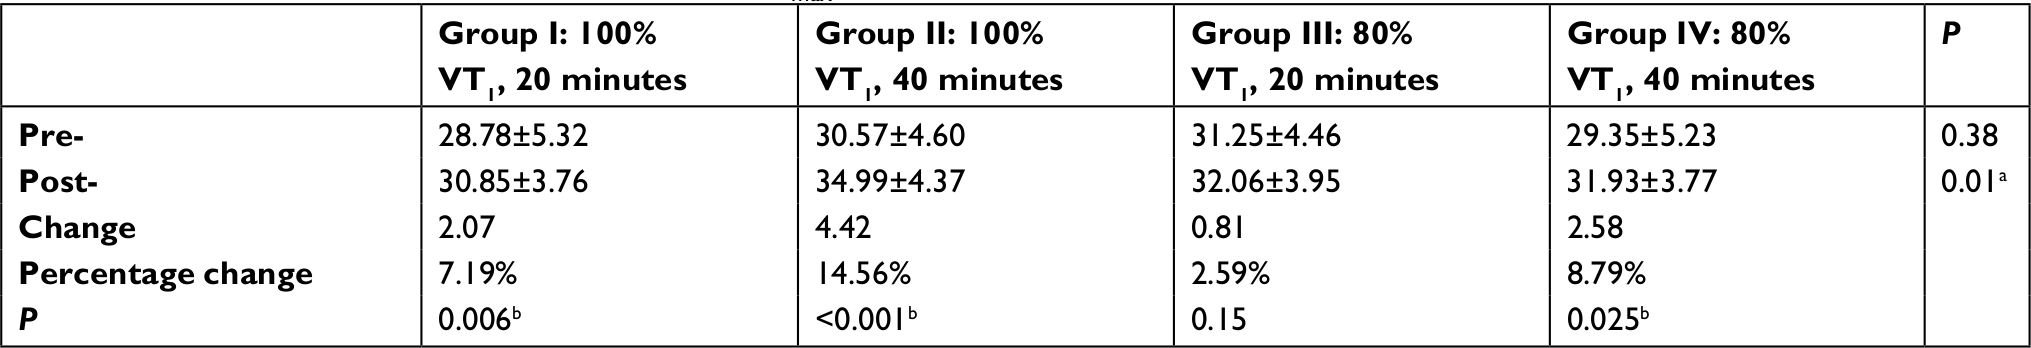 | Table 3 Changes in maximum oxygen uptake (VO2max) in the intervention groups Notes: aSignificant between-group difference (Kruskal–Wallis test); bsignificant within-group difference (Wilcoxon). Abbreviations: VT, ventilatory threshold. |
Perceived exertion rates are shown in Figure 4. Preintervention, participants in all groups reported similar exertion rates (P=0.07). Rates reduced significantly in all intervention groups (P=0.001 for group I, <0.001 for group II, 0.004 for group III, and 0.002 for group IV). The terminal rating of perceived exertion postintervention varied significantly among the training groups (P=0.003). A wider range of differences was demonstrated by pairwise comparisons postintervention. Participants in group II had significantly lower exertion rates than group I (adjusted P=0.019), group III (adjusted P=0.04), and group IV (adjusted P=0.046), whereas groups I and III were not different when compared with group I or with each other (adjusted P>0.05).
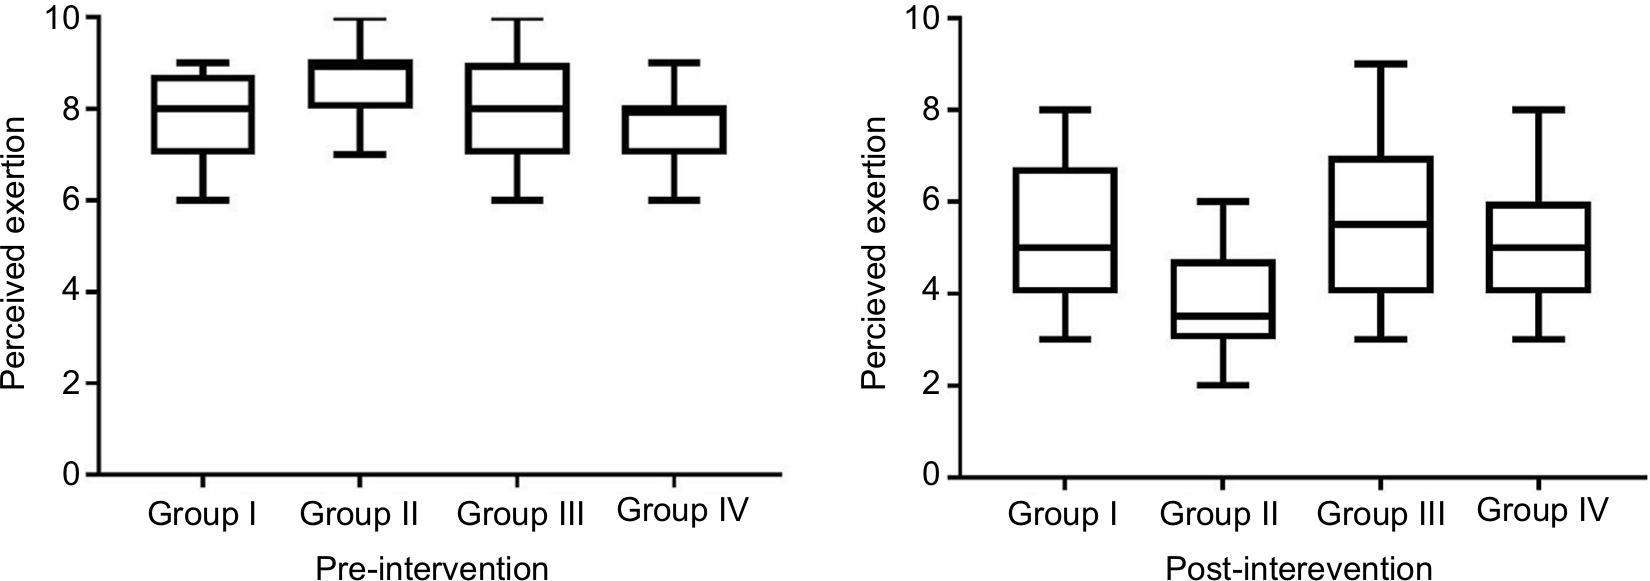 | Figure 4 Perceived exertion rating in the study groups before intervention. Notes: Data shown as median (IQR), and the error bar represents min-max score. |
Discussion
Physical activity is a crucial element in combating pediatric obesity. Recently, a considerable number of studies have investigated how effective exercise is the management of pediatric obesity.10–16,26 Although these studies provided evidence on the effectiveness of exercise in the management of pediatric obesity, most analyzed only the effect of exercise intensity independently of exercise duration. The intention behind this study was to analyze how exercise intensity would interact with exercise duration in the treatment of pediatric obesity within the framework of cardiovascular risk profile, oxygen uptake, and perceived exertion rates.
The principal findings of the present study were that augmentation of exercise intensity has the potential to produce an improvement in blood lipids and lipoproteins, to increase oxygen uptake, and to reduce perceived exertion rates. Additionally, these positive effects were enhanced by elongation of exercise duration. Nevertheless, the effect of moderate exercise intensity over a long duration (40 minutes’ 80% VT1) cannot be disregarded, as it produced a significant improvement in all outcomes, but to a lesser extent than high-intensity exercise, while moderate exercise over a short duration (20 minutes’ 80% VT1) was found ineffective, except for improvement in perceived exertion.
Besides the high-intensity training, the significant changes in T-Cho, LDL, TGs, and VO2max observed in group II might also be attributed to the extended exercise duration. Changes in serum lipids, lipoproteins, and oxygen uptake could be postulated as a result of the increased body and skeletal muscle capacity for oxidation of fatty acids.27 Indeed, it could be presumed that reduced body mass assisted the skeletal muscle to exert greater effort that allowed the improvement in VO2max, as lately established after high-intensity training.28,29 It has commonly been observed that high-intensity aerobic training (70%–170% VO2max) for 30–60 minutes over 6–7 weeks can simultaneously increase oxidation of fats and increase aerobic capacity.30 However, the results coincided with those reported by Gutin et al, who demonstrated that significant changes in body fat and cardiovascular fitness in obese adolescents are obtainable when they exercise as energetically as they can sustain.31 Heydari et al investigated the effect of 20 minutes’ high-intensity aerobic training applied three times per week for 12 consecutive weeks, and reported significant improvement in oxygen uptake and reduction in total body fat without any noticeable changes in serum lipids.32 Racil et al also demonstrated that a 12-session progressive high-intensity aerobic training with an intensity of 100%–110% of maximum aerobic speed can preferably produce significant changes in T-Cho, HDL, LDL, and TGs in comparison with moderate-intensity exercise in obese young females.29 More recently, Racil et al examined the effect of high- (100% maximum aerobic speed) vs moderate-intensity (80% maximal aerobic speed) in obese adolescent girls (aged 14.2±1.2 years). They collected data related to body mass, VO2max, perceived exertion, and glucose levels after thrice-weekly training through a 12-week program, and the findings suggested that high-intensity exercise training produced a more positive impact on body mass and other health determinants in comparison with moderate-intensity exercise training.33
In the same regard, two meta-analyses analyzed cardiovascular risk factors in response to high-intensity vs moderate-intensity aerobic exercise, and suggested that high-intensity exercise seems to convey greater improvement in cardioprotective risk factors (blood pressure, T-Cho, HDL, LDL, TGs, glucose level, and insulin sensitivity) and improve aerobic capacity than moderate-intensity training.34,35 Just recently, a review evaluated the effectiveness of high-intensity aerobic exercise on VO2max and cardiovascular risk in comparison with other forms of exercise, and showed that high-intensity aerobic training generated a greater increase in VO2max, induced better cardiovascular adaptations, and produced a preferable improvement in other health indices.36 By contrast, a parallel-arm randomized clinical trial on sedentary obese or overweight young males (aging 20±1.5 years) compared the effect of high- vs moderate-intensity exercise over 6 weeks and indicated similar results regarding blood lipids, specifically concentration of HDL and LDL. The trial further indicated a significant improvement in VO2max after both exercise regimens, with a clear advantage for moderate-intensity training.37 Also, Kong et al studied the effect of 5 weeks of high-intensity exercise training in obese young women, and the findings showed comparable results to moderate-intensity training as regards VO2max, T-Cho, HDL, LDL, and TGs, while high-intensity training achieved lower rates of perceived exertion.38
Exactly how exercise works in improving blood lipids is still not totally clear. It has been suggested that 8–12 weeks of exercise may reduce cholesterol absorption from the small intestine to the bloodstream.39 Also, exercise has been proven to change the size of lipoprotein particles. This leads to a reduction in small LDL, which is associated with high cardiovascular risks of up to 17%, and an increase in the size of LDL, which reduced those risks.40 In vivo studies on mice have shown that exercises can reverse cholesterol transmission and enhance cholesterol transport from the bloodstream to the liver, where it eventually filters out of the body.41 The changes in VO2max associated with high-intensity exercises might be explained by the increased oxygen availability associated with higher levels of cardiac output and total hemoglobin,42 improved mitochondrial enzyme activities, and increased oxidative capacity of the skeletal muscles, which leads to peripheral adaptation with an improvement in ability to extract and use oxygen.43 In addition, all groups perceived the stress test as being less difficult postintervention, regardless of the training protocol. These results seem to be mainly linked to the significant within-subject changes in BMI.
While exercise is established as an essential element of obesity management, there is limited evidence about the impact of exercise intensity and duration on different health-related factors in obese children. The findings of this study have a significant implication independently of the efficacy of various exercise paradigms on weight reduction. The results suggest that all levels of exercise training that were prescribed (with the exception of short-duration moderate exercise) resulted in significant improvement in blood lipids, VO2max, and perceived exertion. Further, long-duration high-intensity exercise produced greater effects on many health-related factors.
The present study had some limitations. First, the lack of a diet-only control group limits the ability to identify the effect of exercise intensity and duration vs nonexercise intervention. Second, lacking follow-up, the authors of this work are not sure if the high-intensity training efficacy will be sustained in the long term. Therefore, further studies should consider evaluating effect sustainability. Third, even though the present study proved that the effect of high-intensity exercise was preferable, some questions still need to be explored: “Is high-intensity training safe?”; “ To what extent is it preferred by obese children?”; “Do energy cost–matched exercises of different modes produce similar results?” To answer these questions, additional research with large and varied cohorts will be necessary. Fourth, the sample was not recruited to be representative of a specific sex, and there were no sex differences among the intervention groups. However, the authors’ clinical impression is that boys and girls may respond differently to the intervention, and future research should involve subgroups based on sex distribution to provide a clear conclusion about the findings. Lastly, this study did not assess the pubertal status of the participants, which may affect BMI and change metabolic health. Therefore, the results should be interpreted with caution, and future studies should evaluate the effect of exercise in obese children while controlling for pubertal status.
Conclusion
The findings of the present study suggest that exercise intensity and duration are essential factors in exercise prescription for obese children. Also, exercise intensity and duration can interactively elicit pronounced responses. Furthermore, high-intensity aerobic exercises are likely more effective than moderate-intensity aerobic exercises to improve blood lipids, increase oxygen uptake, and reduce exertion, particularly when sustained for a long duration.
Disclosure
The authors report no conflicts of interest in this work.
References
Rome ES. Obesity prevention and treatment. Pediatr Rev. 2011;32(9):363–373. | ||
Xu S, Xue Y, Causes pediatric obesity: symptoms, prevention and treatment. Exp Ther Med. 2016;11(1):15–20. | ||
Ng M, Fleming T, Robinson M, et al. Global, regional, and national prevalence of overweight and obesity in children and adults during 1980–2013: a systematic analysis for the Global Burden of Disease Study 2013. Lancet. 2014;384(9945):766–781. | ||
Drewnowski A, Popkin BM. The nutrition transition: new trends in the global diet. Nutr Rev. 1997;55(2):31–43. | ||
Must A, Strauss RS. Risks and consequences of childhood and adolescent obesity. Int J Obes Relat Metab Disord. 1999;23(Suppl 2):S2–S11. | ||
Juonala M, Magnussen CG, Berenson GS, et al. Childhood adiposity, adult adiposity, and cardiovascular risk factors. N Engl J Med. 2011;365(20):1876–1885. | ||
Marinov B, Kostianev S, Turnovska T. Ventilatory efficiency and rate of perceived exertion in obese and non-obese children performing standardized exercise. Clin Physiol Funct Imaging. 2002;22(4):254–260. | ||
Thivel D, Isacco L, O’Malley G, Duché P. Pediatric obesity and perceived exertion: difference between weight-bearing and non-weight-bearing exercises performed at different intensities. J Sports Sci. 2016;34(5):389–394. | ||
Robbins LB, Pender NJ, Ronis DL, Kazanis AS, Pis MB. Physical activity, self-efficacy, and perceived exertion among adolescents. Res Nurs Health. 2004;27(6):435–446. | ||
Kelishadi R, Azizi-Soleiman F. Controlling childhood obesity: a systematic review on strategies and challenges. J Res Med Sci. 2014;19(10):993. | ||
Elnaggar RK, Shendy MA. Aerobic interval exercises versus dietary control induced changes of adipokines levels, lipid profile and quality of life in overweight or obese children. Int J Physiother. 2016;3(5):587–593. | ||
Logan GRM, Harris N, Duncan S, Schofield G. A review of adolescent high-intensity interval training. Sports Med. 2014;44(8):1071–1085. | ||
Saavedra JM, Escalante Y, Garcia-Hermoso A. Improvement of aerobic fitness in obese children: a meta-analysis. Int J Pediatr Obes. 2011;6(3-4):169–177. | ||
Escalante Y, Saavedra JM, García-Hermoso A, Domínguez AM. Improvement of the lipid profile with exercise in obese children: a systematic review. Prev Med. 2012;54(5):293–301. | ||
Sigal RJ, Alberga AS, Goldfield GS, et al. Effects of aerobic training, resistance training, or both on percentage body fat and cardiometabolic risk markers in obese adolescents: the healthy eating aerobic and resistance training in youth randomized clinical trial. JAMA Pediatr. 2014;168(11):1006–1014. | ||
Watts K, Beye P, Siafarikas A, et al. Exercise training normalizes vascular dysfunction and improves central adiposity in obese adolescents. J Am Coll Cardiol. 2004;43(10):1823–1827. | ||
Barlow SE, Expert Committee. Expert Committee recommendations regarding the prevention, assessment, and treatment of child and adolescent overweight and obesity: summary report. Pediatrics. 2007;120(Supplement 4):S164–S192. | ||
Cheatham CC, Mahon AD, Brown JD, Bolster DR. Cardiovascular responses during prolonged exercise at ventilatory threshold in boys and men. Med Sci Sports Exerc. 2000;32(6):1080–1087. | ||
Baldari C, Guidetti L. VO2max, ventilatory and anaerobic thresholds in rhythmic gymnasts and young female dancers. J Sports Med Phys Fitness. 2001;41(2):177–182. | ||
Knopfholz J, Disserol CCD, Pierin AJ, et al. Validation of the Friedewald formula in patients with metabolic syndrome. Cholesterol. 2014;2014(4):1–5. | ||
Centers for Disease Control and Prevention. Laboratory quality assurance and standardization programs 2018 [cited 2018 30 September]. Available from: https://www.cdc.gov/labstandards/overview.html. | ||
Emerenziani GP, Gallotta MC, Migliaccio S, et al. Differences in ventilatory threshold for exercise prescription in outpatient diabetic and sarcopenic obese subjects. Int J Endocrinol. 2016;2016(2):1–6. | ||
Utter AC, Robertson RJ, Nieman DC, Kang J. Children’s Omni scale of perceived exertion: walking/running evaluation. Med Sci Sports Exerc. 2002;34(1):139–144. | ||
Pfeiffer KA, Pivarnik JM, Womack CJ, Reeves MJ, Malina RM. Reliability and validity of the Borg and Omni rating of perceived exertion scales in adolescent girls. Med Sci Sports Exerc. 2002;34(12):2057–2061. | ||
Epstein LH, Wing RR, Valoski A. Childhood obesity. Pediatr Clin North Am. 1985;32(2):363–379. | ||
Kraemer RR, Castracane VD. Effect of acute and chronic exercise on ghrelin and adipocytokines during pubertal development. Med Sport Sci. 2010;55:156–173. | ||
Talanian JL, Galloway SDR, Heigenhauser GJF, Bonen A, Spriet LL. Two weeks of high-intensity aerobic interval training increases the capacity for fat oxidation during exercise in women. J Appl Physiol. 2007;102(4):1439–1447. | ||
Ciolac EG, Bocchi EA, Bortolotto LA, Carvalho VO, Greve JM, Guimarães GV. Effects of high-intensity aerobic interval training vs. moderate exercise on hemodynamic, metabolic and neuro-humoral abnormalities of young normotensive women at high familial risk for hypertension. Hypertens Res. 2010;33(8):836–843. | ||
Racil G, Ben Ounis O, Hammouda O, et al. Effects of high vs. moderate exercise intensity during interval training on lipids and adiponectin levels in obese young females. Eur J Appl Physiol. 2013;113(10):2531–2540. | ||
Tabata I, Nishimura K, Kouzaki M, et al. Effects of moderate-intensity endurance and high-intensity intermittent training on anaerobic capacity and VO2max. Med Sci Sports Exerc. 1996;28(10):1327–1330. | ||
Gutin B, Barbeau P, Owens S, et al. Effects of exercise intensity on cardiovascular fitness, total body composition, and visceral adiposity of obese adolescents. Am J Clin Nutr. 2002;75(5):818–826. | ||
Heydari M, Freund J, Boutcher SH. The effect of high-intensity intermittent exercise on body composition of overweight young males. J Obes. 2012;2012(12):1–8. | ||
Racil G, Coquart JB, Elmontassar W, et al. Greater effects of high- compared with moderate-intensity interval training on cardio-metabolic variables, blood leptin concentration and ratings of perceived exertion in obese adolescent females. Biol Sport. 2016;33(2):145–152. | ||
Swain DP, Franklin BA. Comparison of cardioprotective benefits of vigorous versus moderate intensity aerobic exercise. Am J Cardiol. 2006;97(1):141–147. | ||
Kessler HS, Sisson SB, Short KR. The potential for high-intensity interval training to reduce cardiometabolic disease risk. Sports Med. 2012;42(6):489–509. | ||
García-Hermoso A, Cerrillo-Urbina AJ, Herrera-Valenzuela T, Cristi-Montero C, Saavedra JM, Martínez-Vizcaíno V. Is high-intensity interval training more effective on improving cardiometabolic risk and aerobic capacity than other forms of exercise in overweight and obese youth? A meta-analysis. Obes Rev. 2016;17(6):531–540. | ||
Fisher G, Brown AW, Bohan Brown MM, et al. High intensity Interval- vs moderate Intensity- training for improving cardiometabolic health in overweight or obese males: a randomized controlled trial. PLoS One. 2015;10(10):e0138853. | ||
Kong Z, Fan X, Sun S, Song L, Shi Q, Nie J. Comparison of high-intensity interval training and moderate-to-vigorous continuous training for cardiometabolic health and exercise enjoyment in obese young women: a randomized controlled trial. PLoS One. 2016;11(7):e0158589. | ||
Wilund KR, Feeney LA, Tomayko EJ, Weiss EP, Hagberg JM. Effects of endurance exercise training on markers of cholesterol absorption and synthesis. Physiol Res. 2009;58(4):545–552. | ||
Mann S, Beedie C, Jimenez A. Differential effects of aerobic exercise, resistance training and combined exercise modalities on cholesterol and the lipid profile: review, synthesis and recommendations. Sports Med. 2014;44(2):211–221. | ||
Meissner M, Havinga R, Boverhof R, Kema I, Groen AK, Kuipers F. Exercise enhances whole-body cholesterol turnover in mice. Med Sci Sports Exerc. 2010;42(8):1460–1468. | ||
Astorino TA, Allen RP, Roberson DW, Jurancich M. Effect of high-intensity interval training on cardiovascular function, VO2max, and muscular force. J Strength Cond Res. 2012;26(1):138–145. | ||
Burgomaster KA, Howarth KR, Phillips SM, et al. Similar metabolic adaptations during exercise after low volume sprint interval and traditional endurance training in humans. J Physiol. 2008;586(1):151–160. |
 © 2019 The Author(s). This work is published and licensed by Dove Medical Press Limited. The
full terms of this license are available at https://www.dovepress.com/terms
and incorporate the Creative Commons Attribution
- Non Commercial (unported, 3.0) License.
By accessing the work you hereby accept the Terms. Non-commercial uses of the work are permitted
without any further permission from Dove Medical Press Limited, provided the work is properly
attributed. For permission for commercial use of this work, please see paragraphs 4.2 and 5 of our Terms.
© 2019 The Author(s). This work is published and licensed by Dove Medical Press Limited. The
full terms of this license are available at https://www.dovepress.com/terms
and incorporate the Creative Commons Attribution
- Non Commercial (unported, 3.0) License.
By accessing the work you hereby accept the Terms. Non-commercial uses of the work are permitted
without any further permission from Dove Medical Press Limited, provided the work is properly
attributed. For permission for commercial use of this work, please see paragraphs 4.2 and 5 of our Terms.