Back to Journals » International Journal of Chronic Obstructive Pulmonary Disease » Volume 12
Capillary PO2 does not adequately reflect arterial PO2 in hypoxemic COPD patients
Authors Magnet FS ![]() , Majorski DS, Callegari J, Schwarz SB
, Majorski DS, Callegari J, Schwarz SB ![]() , Schmoor C, Windisch W
, Schmoor C, Windisch W ![]() , Storre JH
, Storre JH ![]()
Received 1 May 2017
Accepted for publication 19 June 2017
Published 6 September 2017 Volume 2017:12 Pages 2647—2653
DOI https://doi.org/10.2147/COPD.S140843
Checked for plagiarism Yes
Review by Single anonymous peer review
Peer reviewer comments 2
Editor who approved publication: Prof. Dr. Richard Russell
Friederike Sophie Magnet,1 Daniel Sebastian Majorski,1 Jens Callegari,1 Sarah Bettina Schwarz,1 Claudia Schmoor,2 Wolfram Windisch,1 Jan Hendrik Storre3,4
1Department of Pneumology, Cologne Merheim Hospital, Kliniken der Stadt Köln gGmbH Witten/Herdecke University, Faculty of Health/School of Medicine, Cologne, Germany; 2Clinical Trials Unit, Medical Center – University of Freiburg, Faculty of Medicine, University of Freiburg, Freiburg, Germany; 3Department of Intensive Care, Sleep Medicine and Mechanical Ventilation, Asklepios Fachkliniken Munich-Gauting, Gauting, Germany; 4Department of Pneumology, University Medical Hospital, Freiburg, Germany
Purpose: To compare arterial (PaO2) with capillary (PcO2) partial pressure of oxygen in hypoxemic COPD patients because capillary blood gas analysis (CBG) is increasingly being used as an alternative to arterial blood gas analysis (ABG) in a non-intensive care unit setting, although the agreement between PcO2 and PaO2 has not been evaluated in hypoxemic COPD patients.
Patients and methods: Bland–Altman comparison of PaO2 and PcO2 served as the primary outcome parameter if PcO2 values were ≤60 mmHg and the secondary outcome parameter if PcO2 values were ≤55 mmHg. Pain associated with the measurements was assessed using a 100-mm visual analog scale.
Results: One hundred and two PaO2/PcO2 measurement pairs were obtained. For PcO2 values ≤60 mmHg, the mean difference between PaO2 and PcO2 was 5.99±6.05 mmHg (limits of agreement: -5.88 to 17.85 mmHg). For PcO2 values ≤55 mmHg (n=73), the mean difference was 5.33±5.52 mmHg (limits of agreement: -5.48 to 16.15 mmHg). If PaO2 ≤55 (≤60) mmHg was set as the cut-off value, in 20.6% (30.4%) of all patients, long-term oxygen therapy have been unnecessarily prescribed if only PcO2 would have been assessed. ABG was rated as more painful compared with CBG.
Conclusions: PcO2 does not adequately reflect PaO2 in hypoxemic COPD patients, which can lead to a relevant number of unnecessary long-term oxygen therapy prescriptions.
Keywords: blood gas analysis, COPD, respiratory insufficiency, hypoxemia
Plain language summary
Patients with COPD can develop severe hypoxemia in the natural course of their disease. If the partial pressure of oxygen (PO2) is very low, long-term oxygen therapy (LTOT) is indicated in these patients. To assess PO2, arterial blood gas analysis (ABG) serves as the standard method (= gold-standard). Capillary blood gas analysis (CBG; earlobe sampling) is increasingly being used as an alternative, although the accuracy for hypoxemic patients with COPD has not been evaluated. The current trial, therefore, compared ABG with CBG in 102 severely hypoxemic COPD patients. It was shown that CBG does not adequately reflect PO2 from ABG in hypoxemic COPD patients, which can lead to a relevant number of unnecessary LTOT prescriptions. However, ABG was rated as more painful compared with CBG, although overall pain sensation was moderate.
Introduction
Blood gas analysis is an essential tool for monitoring respiratory status. The gold-standard method is arterial blood gas analysis (ABG) of blood from the patient’s radial artery, an approach that is especially useful for evaluating the partial pressure of oxygen (PO2).1,2 Arterialized capillary blood gas analysis (CBG) serves as a substitute for arterial sampling, which shows several important advantages – CBG is less invasive,3 can be performed by non-medical staff,4 requires smaller blood samples,2 and is more economical than ABG.2 However, it is less useful in the acute setting because an adequate vasodilatation needs to be ensured, which typically lasts for at least 10 minutes.1,2,5–7
Different trials have evaluated the agreement between ABG and CBG in terms of PO2 measurements, with conflicting results; whereas one trial reported close agreement between ABG- versus CBG-derived values over a wide range of PO2 values,7 other trials showed wide limits of agreement (LOA).8,9 A 2007 meta-analysis comparing ABGs to CBGs emphasized that capillary PO2 (PcO2) (earlobe sampling) may be an appropriate replacement for arterial PO2 (PaO2);2 however, the authors also pointed out that CBG might not be appropriate if precision is required, based on the fact that the residual standard error (SE) in the regression equation was 6 mmHg.2 This is of great importance, since, for example, long-term oxygen therapy (LTOT) is based on absolute values of PO2. Specifically, LTOT is indicated in patients with PO2 ≤55 or ≤60 mmHg in the presence of peripheral edema or polycythemia, or with evidence of pulmonary hypertension.10,11 Importantly, LTOT guidelines differ considerably: while the British Thoracic Society (BTS) guideline recommends ABG in preference to CBG,10 the German guideline suggests that CBG is appropriate in the non-intensive care unit setting.12 Of note, Zavorsky et al found that CBG reflects ABG more accurately for lower PO2-levels.2 However, no subgroup analysis was performed for PO2 values <60 or 55 mmHg, respectively, which are the crucial cut-off points for LTOT indication. For this reason, the present study compared PcO2 and PaO2 in these hypoxemic ranges.
Patients and methods
The study protocol was approved by the Ethics Committee at Witten/Herdecke University, Witten, Germany, and was undertaken at the Department of Pneumology, Lung Clinic, Cologne Merheim Hospital, Witten/Herdecke University, Germany. The study was performed in accordance with the ethical standards laid down in the Declaration of Helsinki. The study was registered at the German Clinical Trials Register (DRKS00010624). Informed written consent was obtained from all subjects. A recruitment period of 6 months was planned and resources calculated accordingly.
Patients
Patients ≥18 years of age with an established diagnosis of COPD GOLD ≥2 (forced expiratory volume in 1 s [FEV1] <80%, FEV1/ inspiratory vital capacity [IVC] <70%)13 and PcO2 ≤60 mmHg were included in the study. PcO2 was used as the inclusion criteria because it is the standard method in Germany for performing blood gas analysis in chronic care.12
Exclusion criteria were as follows:
- Cardiorespiratory instability (SpO2 <80%, despite supplemental oxygen therapy and any of the following: Borg dyspnea scale ≥5, heart rate >140/min, breathing frequency >25/min).
- Absolute contraindication for ABG and relative contraindication for ABG without indication for ABG beyond the present trial as defined previously.14,15
Study design and measurements
The primary aim of the study was to compare PcO2 versus PaO2 in patients with PcO2 ≤60 mmHg. The secondary aims were to compare 1) PcO2 with PaO2 measurements in patients with PcO2 ≤55 mmHg and to assess, 2) arterial (SaO2), capillary (ScO2), and peripheral oxygen saturation (SpO2), 3) arterial (aHCO3−) and capillary (cHCO3−) standard bicarbonate, 4) partial pressure of arterial to capillary carbon dioxide (PaCO2/PcCO2), as well as 5) arterial and capillary pH (apH/cpH). A further aim was to compare pain ratings from patients undergoing ABG and CBG, respectively.
Demographic data (age, height, weight, gender, and smoking status) and lung function parameters (full body plethysmography and diffusion tests) were collected from each patient, when available. Patients were seated during the blood gas analyses. If the patient was already on LTOT, supplemental oxygen therapy was stopped for at least 30 minutes, if tolerated by the patient. SpO2 was measured from the right index finger (Oximeter Wrist OX2,® model 3150, Nonin Medical Inc., Plymouth, MN, USA). If SpO2 dropped to <80% and the patient became severely dyspneic, supplemental oxygen was administered in order to achieve stable respiratory status (defined as SpO2 >80%, Borg dyspnea scale <5, heart rate <140/min, and breathing frequency <25/min). In this case, further measurements were performed at the given oxygen flow rate after a stable respiratory status was achieved for at least 30 minutes. A vasodilatory substance (Finalgon® Wärmecreme stark, Boehringer Ingelheim, Ingelheim am Rhein, Germany), was applied to one earlobe for 10 minutes before further measurements.7–9 ABG and CBG (earlobe) were then performed simultaneously by two investigators and processed within 2 minutes (ABL 800 flex, Radiometer Medical ApS, Brønshøj, Denmark). Squeezing and milking of the earlobe, as well as air bubbles in the probe, were strictly avoided. SpO2 readings were assessed at the time of puncture. ABG was performed on the radial artery according to current recommendations with a thin cannula (BD Eclipse™ Needle, BD Medical, Franklin Lakes, NJ, USA, 27 G).14,15
The intensity of pain experienced during ABG and CBG was then rated by each patient using a 100-mm visual analog scale (VAS; 0= no pain, 50= acceptable pain, 100= maximal pain).9,16
Analysis
The primary aim of the study was to compare PcO2 and PaO2. This was performed by calculating the 95% lower limit of agreement (LLA) and upper limit of agreement (ULA) for differences between methods, in accordance with the Bland and Altman method.17 The methods for PO2 measurement were considered to be in agreement when both limits were in the range of −8 to 8 mmHg.
The statistical test of agreement was then performed by calculating 95% CI for the LLA and ULA. Agreement between the two methods was established when the lower CI limit of the LLA was above −8 mmHg and the upper CI limit of the ULA was below 8 mmHg.
For sample size calculation, an SD of 3.5 mmHg was assumed (based on previous findings by Zavorsky et al2) for the subgroup of patients with PaO2 <70 mmHg (n=227, mean difference =0.7, SD =3.4). Using the assumption of perfect agreement between methods, this resulted in expected LLA and ULA values of −6.86 and 6.86 mmHg, respectively. On the basis of this, the inclusion of 220 subjects was necessary to show agreement between methods at a one-sided alpha level of 0.025 and a power of 80%. LLA and 95% CI were also calculated for the comparison of secondary endpoints. Pain ratings recorded on the 100-mm VAS were compared between methods by paired t-tests.
Results
The study was conducted from June to December 2016. Due to slow recruitment, an analysis of the first 102 patients was performed, which showed that the planned proof of agreement with limits between −8 and 8 mmHg was not possible, even with a larger sample size. As outlined above, planning of the study was based on the assumption of perfect agreement between PcO2 and PaO2 measurements (SD =3.5) leading to expected LLAs of ±6.86 mmHg, so that LLAs can be shown to be ±8 mmHg from zero with 220 patients. In the first 102 patients of our study, the observed SD was 6.05 leading to expected LLAs of ±11.86 mmHg even under the assumption of perfect agreement. Thus, with this larger SD, the desired proof of agreement within ±8 mmHg from zero would not be possible even with an infinite sample size, as the expected LLAs refer to values of individual patients which are not influenced by the number of patients under study. Therefore, the study was stopped prematurely.
The median PaO2 was 56.3 mmHg (interquartile range [IQR]: 50.7–61.4 mmHg), and the median PcO2 was 50.3 mmHg (IQR: 46.0–56.0 mmHg). Seventeen patients (16.5%) were on oxygen during the measurements (n=4: 2 L/min, n=8: 1 L/min, and n=5: 0.5 L/min). Further demographic data, ABG data, and lung function parameters are shown in Table 1.
 | Table 1 Demographic data, ABG, and lung function parameters |
Comparison of PaO2 and PcO2 for PcO2 values ≤60 mmHg (primary outcome)
The mean difference between gold-standard PaO2 and PcO2 was 5.99±6.05 mmHg, with an LLA of −5.88 mmHg (95% CI −7.92 to −3.84 mmHg) and an ULA of 17.85 mmHg (95% CI 15.81–19.89 mmHg), Table 2; Figure 1. In 31 of 102 measurements (30.4%), PaO2 was >60.0 mmHg, although PcO2 was ≤60.0 mmHg.
 | Table 2 Comparison of PaO2 and PcO2 in all patients (primary outcome) |
 | Figure 1 Bland–Altman comparison of PaO2 and PcO2 for PcO2 values ≤60 mmHg (primary outcome, n=102). |
PcO2 overestimated PaO2 in 5 of 102 measurements (4.9%). The mean overestimation in these 5 measurements was 2.98 mmHg (SD ±1.92 mmHg). Conversely, PcO2 underestimated PaO2 in 97 measurements (95.1%).
Comparison of PaO2 and PcO2 for PcO2 values ≤55 mmHg (secondary outcome)
The mean difference between gold-standard PaO2 and PcO2 when PcO2 values were ≤55 mmHg was 5.33±5.52 mmHg, with an LLA of −5.48 mmHg (95% CI −7.69 to −3.27 mmHg) and an ULA of 16.15 mmHg (95% CI 13.94 to 18.36 mmHg), Table 3; Figure 2.
 | Table 3 Comparison of blood gas measurements and peripheral saturation measurements for PcO2 ≤55 mmHg (secondary outcome) |
 | Figure 2 Bland–Altman comparison of PaO2 and PcO2 for PcO2 values ≤55 mmHg (secondary outcome, n=73). |
Comparison of other blood gas and peripheral saturation parameters for PcO2 values ≤60 mmHg, as well as for PcO2 values ≤55 mmHg, is displayed in Tables 3 and 4.
 | Table 4 Comparison of blood gas measurements and peripheral saturation measurements in all patients (secondary outcome) |
Comparison of PaO2 and PcO2 with respect to the cut-off value of PaO2 ≤55 mmHg (classic indication criteria for LTOT prescription) is displayed in Table 5.
 | Table 5 Comparison of PaO2 and PcO2 with respect to PcO2-based indication of LTOT |
Assessment of pain associated with blood gas analyses
On the basis of the 100-mm pain VAS, ABG was rated as significantly more painful than CBG (P-value <0.0001), the mean difference was 9.88 mm (±21.06 mm, 95% CI 5.75–14.02 mm), Table 6.
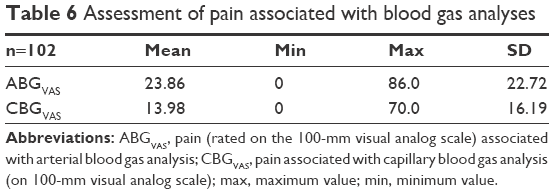 | Table 6 Assessment of pain associated with blood gas analyses |
Discussion
This is the first trial to specifically compare ABG and CBG measurements of PO2 in hypoxemic COPD patients. Bland–Altman comparison showed wide LOA for PcO2 values ≤60 mmHg (LLA −5.88 mmHg, ULA 17.85 mmHg). Therefore, the main result of the present study was that in hypoxemic COPD patients, PO2 values derived from CBG do not show an acceptable agreement with those derived from gold-standard ABG. Hereby, PcO2 underestimated PaO2 by a mean of 6 mmHg. Although the study did not reach the originally planned sample size of 220 patients, analysis of the first 102 patients showed that even with a larger sample size, proof of agreement with limits between −8 and 8 mmHg would not have been possible.
Despite there being no other study that has explicitly evaluated the agreement between ABG and CBG in the context of hypoxemia, subgroup analyses from older studies can be consulted for comparison to the current results. In 1994, Pitkin et al showed close agreement between CBG and ABG, with PcO2 underestimating PaO2 by a mean of just 1.28 mmHg (LOA −8.18 to 5.62 mmHg).7 The authors emphasized the particularly good CBG/ABG correlation at PaO2 values <60 mmHg, albeit without providing any further information.7 Also, only 40 patients were included in the study, with the absolute number of hypoxemic patients included being rather small.7 Interestingly, the German recommendation for using CBG to indicate LTOT is based solely on this trial.11,12
In 2001, Eaton et al also performed a Bland–Altman analysis of CBG versus ABG in patients undergoing assessment for potential LTOT; the mean PaO2 here was 63.0 mmHg (range 37.5–84.8 mmHg).8 Large LOA of −15.4 to 8.2 mmHg were found, where PcO2 underestimated PaO2 by a mean of 3.6 mmHg.8 Although these results are in line with the current measurements, it should be noted that only 9 of the 64 measurements were within the range of PO2 <54.8 mmHg.8 No further information about the number of measurements in the range of PO2 <60 mmHg was provided.8
The 2007 meta-analysis by Zavorsky et al included a subgroup analysis of PaO2 values <70 mmHg,2 where the mean difference between PaO2 and PcO2 in 227 measurement pairs was 0.7 mmHg and the SE 0.2 mmHg.2 PcO2 was also shown to be more accurate in predicting PaO2 for lower PO2 values. In contrast, for PaO2 values ≥120 mmHg, the mean difference between PaO2 and PcO2 was 20 mmHg (SD ±5.7 mmHg, SE 4.0 mmHg).2 This effect had been attributed by the authors to a reduced arteriovenous PO2 difference in hypoxemia.2,18 It was also mentioned that the improved accuracy observed in the range of hypoxemic values might be due to the fact that the oxyhemoglobin dissociation curve becomes more linear when PO2 values range from 20 to 60 mmHg.2 However, the authors showed that the differences between PcO2 and PaO2 increased with the year of publication. They suggested that this might be due to either a submission or a publication bias in early studies, whereby only positive trials with good levels of accuracy between ABG and CBG were submitted by authors or published by the journals, respectively.2
The most recent comparison of ABG and CBG by Ekkernkamp et al9 reported a mean difference between PaO2 and PcO2 of 5.6 mmHg (SD ±7.2 mmHg), again with wide LOA (−8.5 to 19.6 mmHg). The mean PaO2 was 80.4 mmHg (SD ±17.7 mmHg). An additional analysis of this study in the subgroup of patients with PaO2 values <60 mmHg showed a mean difference of −1.3 mmHg (SD ±3.4), but only 7/100 measurements had PaO2 values <60 mmHg (data not published). Therefore, this has to be interpreted with caution. Nevertheless, the overall agreement between PcO2 and PaO2 in the Ekkernkamp trial as well as in the current trial was lower than that reported in the meta-analysis, in line with the finding that older studies showed better agreement between CBG and ABG than more recent trials.2,9
If CBG combined with a PaO2 cut-off value of ≤55 mmHg had been used for the evaluation of LTOT in our cohort, 21 of 73 patients (28.8%) would have been prescribed LTOT unnecessarily. If a PaO2 <60 mmHg had been used as the cut-off value (in patients with the presence of secondary polycythemia and/or signs of right heart insufficiency/pulmonary hypertension),10,11 31 of 102 patients (30.4%) would have been prescribed LTOT unnecessarily. However, none of the patients would have been unnecessarily denied LTOT if CBG were used for the evaluation of LTOT, and this was true for both cut-off values. This is in line with the study by Eaton et al8 which reported that, using CBG alone to assess the need for LTOT (cutoff criteria PO2 ≤55 mmHg) would have resulted in 16% (9/55 patients) of the patients receiving LTOT unnecessarily, while no patient would have been incorrectly denied LTOT.8
LTOT has only been shown to improve survival in severe hypoxemic patients who meet the classic indication criteria.19,20 In addition, LTOT is an expensive therapy associated with psychosocial side effects such as depression, fear of dependence, lack of self-confidence, and social isolation.21–24 Therefore, overprescription of this treatment should be strictly avoided. Taken together, there is now increasing evidence to suggest that assessing the requirement for LTOT should never be based on CBG measurements alone. This has already been incorporated into the recent BTS guideline for LTOT.10
In general, PcO2 should be lower than PaO2 due to the facts that 1) the skin capillary bed consumes oxygen and 2) the blood drawn from the earlobe is a mixture of capillary and venous blood.2 Therefore, a sufficient vasodilatation (by either heat or a vasoactive ointment) to ensure a sufficient earlobe blood flow relative to oxygen consumption is needed to obtain close agreement between PcO2 and PaO2.2 Hence, one possible explanation for the poor agreement between PO2 values in our cohort despite the fact that the agreement is supposed to be more accurate in hypoxemic PO2 values (see above) could be that not all of the patients responded well to the vasodilatory ointment used to heat the earlobe. A way to quantify this would be to measure the surface temperature of the earlobe prior to puncture. It might also be possible that certain formulas of vasodilatory ointment might work better than others. Interestingly, all trials used slightly different ointments.7–9 Therefore, future trials should focus on this issue. Another explanation for the poor agreement could be the abovementioned publication bias that was reported by Zavorsky et al and is also confirmed by the latest trial by Ekkernkamp et al, which also showed worse agreement than older trials.2,9
The current cohort of advanced COPD patients reported an overall moderate level of pain with both techniques. However, ABG was rated as significantly more painful than CBG, although a very fine needle (27 G) was used in this trial. Older trials using much thicker needles (22–23 G) have previously shown that patients experience more discomfort with ABGs compared with CBGs.5,8 In contrast, a recently published trial which also used a very fine needle (26 G) showed that ABGs were subjectively less painful than CBGs, although this result might have been biased due to double sampling of CBG for each patient (compared to one ABG analysis).9
These conflicting results could be explained by the fact that whereas all of our patients were used to CBGs due to their underlying diagnosis of COPD, not all of them had previously undergone ABGs. Therefore, the technique with which the patient is more familiar (in this case, CBG) is more likely to be rated as less painful.
ABGs in the current trial were judged to be almost as painful as the AGBs carried out in the Ekkernkamp trial,9 while CBGs were considered to be much less painful in the present trial compared with the Ekkernkamp trial.9 The discrepancy between these findings might be explained by the fact that all of our patients were used to CBGs while at least 20% of the patients in the Ekkernkamp trial might not have been used to frequent blood gas analysis because they were either healthy volunteers or had diagnoses that do not necessarily require frequent CBGs (eg, sleep apnea syndrome).9
One limitation of the study was that the calculated sample size of 220 patients could not be reached due to recruitment issues. Nevertheless, the statistical analysis showed wide LOA between PaO2 and PcO2, indicating that the predicted sample size would not have resulted in better agreement between the two techniques.
Since all of our measurements were performed in COPD patients, the results are not directly applicable to other hypoxemic patients, although it is unlikely that one specific disease would lead to a worse CBG performance. Nevertheless, future trials should address this issue.
Conclusion
PcO2 did not adequately reflect PaO2 in this study, as demonstrated by the wide LOA. In fact, it was shown that a significant number of patients in this cohort would have been overprescribed LTOT if based on CBG, although patients did not meet the classic indication criteria based on ABG. ABG was rated to be more painful than CBG, but overall the level of pain sensation was moderate.
Therefore, based on the current and recent evidence,9,10 the present authors suggest that the indication for LTOT should be based on ABG, rather than CBG alone.
Acknowledgments
We acknowledge all participants for the effort they devoted to this study and Dr Sandra Dieni for proofreading the manuscript.
The Cologne study group (FSM, SBS, JC, JHS, and WW) received an open research grant from Weinmann/Germany, Vivisol/Germany, Heinen und Löwenstein/Germany, and VitalAire/Germany.
Author contributions
All authors contributed toward data analysis, drafting and critically revising the paper and agree to be accountable for all aspects of the work.
Disclosure
FSM, JC, JHS, and SBS received personal travel grants from companies dealing with LTOT. WW and JHS received speaking fees from companies dealing with LTOT. The authors report no other conflicts of interest in this work.
References
Huttmann SE, Windisch W, Storre JH. Techniques for the measurement and monitoring of carbon dioxide in the blood. Ann Am Thorac Soc. 2014;11(4):645–652. | ||
Zavorsky GS, Cao J, Mayo NE, Gabbay R, Murias JM. Arterial versus capillary blood gases: a meta-analysis. Respir Physiol Neurobiol. 2007;155(3):268–279. | ||
Fajac I, Texereau J, Rivoal V, Dessanges JF, Dinh-Xuan AT, Dall’Ava-Santucci J. Blood gas measurement during exercise: a comparative study between arterialized earlobe sampling and direct arterial puncture in adults. Eur Respir J. 1998;11(3):712–715. | ||
Hughes JM. Blood gas estimations from arterialized capillary blood versus arterial puncture: are they different? Eur Respir J. 1996;9(2):184–185. | ||
Dar K, Williams T, Aitken R, Woods KL, Fletcher S. Arterial versus capillary sampling for analysing blood gas pressures. BMJ. 1995;310(6971):24–25. | ||
Sauty A, Uldry C, Debetaz LF, Leuenberger P, Fitting JW. Differences in PO2 and PCO2 between arterial and arterialized earlobe samples. Eur Respir J. 1996;9(2):186–189. | ||
Pitkin AD, Roberts CM, Wedzicha JA. Arterialised earlobe blood gas analysis: an underused technique. Thorax. 1994;49(4):364–366. | ||
Eaton T, Rudkin S, Garrett JE. The clinical utility of arterialized earlobe capillary blood in the assessment of patients for long-term oxygen therapy. Respir Med. 2001;95(8):655–660. | ||
Ekkernkamp E, Welte L, Schmoor C, et al. Spot check analysis of gas exchange: invasive versus noninvasive methods. Respiration. 2015;89(4):294–303. | ||
Hardinge M, Annandale J, Bourne S, et al; British Thoracic Society Home Oxygen Guideline Development Group; British Thoracic Society Standards of Care Committee. British Thoracic Society guidelines for home oxygen use in adults. Thorax. 2015;70(Suppl 1):i1–i43. | ||
Magnet FS, Schwarz SB, Callegari J, Criee CP, Storre JH, Windisch W. Long-term oxygen therapy: comparison of the German and British Guidelines. Respiration. 2017;93(4):253–263. | ||
Magnussen H, Kirsten AM, Köhler D, Morr H, Sitter H, Worth H. Guidelines for long-term oxygen therapy. Pneumologie. 2008;62(12):748–756. | ||
From the Global Strategy for the Diagnosis, Management and Prevention of COPD, Global Initiative for Chronic Obstructive Lung Disease (GOLD); 2016. Available from: http://goldcopd.org/. Accessed June 22, 2016. | ||
AARC clinical practice guideline. Sampling for arterial blood gas analysis. American Association for Respiratory Care. Respir Care. 1992;37(8):913–917. | ||
UpToDate. [webpage on the Internet]. Theodore AC. Arterial blood gases. Available from: http://www.uptodate.com/contents/arterial-blood-gases. Accessed June 22, 2016. | ||
McCormack HM, Horne DJ, Sheather S. Clinical applications of visual analogue scales: a critical review. Psychol Med. 1988;18(4):1007–1019. | ||
Bland JM, Altman DG. Statistical methods for assessing agreement between two methods of clinical measurement. Lancet. 1986;1(8476):307–310. | ||
Pandit JJ. Sampling for analysing blood gas pressures. Arterial samples are the best. BMJ. 1995;310(6986):1071–1072. | ||
Continuous or nocturnal oxygen therapy in hypoxemic chronic obstructive lung disease: a clinical trial. Nocturnal Oxygen Therapy Trial Group. Ann Intern Med. 1980;93(3):391–398. | ||
Long term domiciliary oxygen therapy in chronic hypoxic cor pulmonale complicating chronic bronchitis and emphysema. Report of the Medical Research Council Working Party. Lancet. 1981;1(8222):681–686. | ||
Cullen DL. Long term oxygen therapy adherence and COPD: what we don’t know. Chron Respir Dis. 2006;3(4):217–222. | ||
Earnest MA. Explaining adherence to supplemental oxygen therapy: the patient’s perspective. J Gen Intern Med. 2002;17(10):749–755. | ||
Katsenos S, Constantopoulos SH. Long-term oxygen therapy in COPD: factors affecting and ways of improving patient compliance. Pulm Med. 2011;2011:325362. | ||
Magnet FS, Storre JH, Windisch W. Home oxygen therapy: evidence versus reality. Expert Rev Respir Med. 2017;11(6):425–441. |
 © 2017 The Author(s). This work is published and licensed by Dove Medical Press Limited. The
full terms of this license are available at https://www.dovepress.com/terms
and incorporate the Creative Commons Attribution
- Non Commercial (unported, 3.0) License.
By accessing the work you hereby accept the Terms. Non-commercial uses of the work are permitted
without any further permission from Dove Medical Press Limited, provided the work is properly
attributed. For permission for commercial use of this work, please see paragraphs 4.2 and 5 of our Terms.
© 2017 The Author(s). This work is published and licensed by Dove Medical Press Limited. The
full terms of this license are available at https://www.dovepress.com/terms
and incorporate the Creative Commons Attribution
- Non Commercial (unported, 3.0) License.
By accessing the work you hereby accept the Terms. Non-commercial uses of the work are permitted
without any further permission from Dove Medical Press Limited, provided the work is properly
attributed. For permission for commercial use of this work, please see paragraphs 4.2 and 5 of our Terms.