Back to Journals » International Journal of Women's Health » Volume 18
Calibrated and Explainable CIN2+ Risk Stratification Using Routine Clinical Data: Development and External Validation
Received 7 April 2026
Accepted for publication 1 June 2026
Published 8 June 2026 Volume 2026:18 614964
DOI https://doi.org/10.2147/IJWH.S614964
Checked for plagiarism Yes
Review by Single anonymous peer review
Peer reviewer comments 2
Editor who approved publication: Dr Matteo Frigerio
Yuzhang Wu,1,2 Aihong Wang3
1Department of Telecommunications Engineering and Management, Beijing University of Posts and Telecommunications, Beijing, People’s Republic of China; 2School of Electronic Engineering and Computer Science, Queen Mary University of London, London, UK; 3Department of Obstetrics and Gynaecology, The Second Affiliated Hospital of Shandong First Medical University, Tai’an, Shandong, People’s Republic of China
Correspondence: Aihong Wang, Department of Obstetrics and Gynaecology, The Second Affiliated Hospital of Shandong First Medical University, Tai’an, Shandong, People’s Republic of China, Email [email protected]
Purpose: To develop and externally validate a calibrated, explainable CIN2+ risk-stratification model using routine structured clinical data.
Methods: This retrospective study included 879 women in a development cohort and 103 women in an independent external validation cohort. Twelve routinely available variables covering demographic status, reproductive history, HPV status, cytology, and colposcopic findings were used. Logistic regression, LightGBM, and XGBoost were compared using stratified 5-fold cross-validation with pooled out-of-fold predictions. All preprocessing, calibration, and threshold-selection steps were fitted within training folds to reduce information leakage. Performance was assessed by discrimination, probability calibration, decision curve analysis, threshold-based operating characteristics, and SHAP-based interpretability.
Results: XGBoost provided the most favorable overall balance and was selected as the primary model after isotonic calibration. In internal validation, the calibrated model achieved an AUROC of 0.720, an AUPRC of 0.496, and a Brier score of 0.172. A high-sensitivity threshold favored detection of CIN2+, whereas a balanced threshold provided a more even trade-off between sensitivity and specificity. In external validation, the model achieved an AUROC of 0.679, an AUPRC of 0.505, and a Brier score of 0.202. SHAP identified cytology grade, HPV16, overall high-risk HPV positivity, colposcopic impression, transformation zone type, and age as leading contributors.
Conclusion: A calibrated machine-learning workflow based on routine clinical variables yielded clinically interpretable CIN2+ risk estimates with supportive internal and external validation. By combining calibration, threshold-based reporting, and decision utility, this workflow may support risk-based colposcopy triage by helping identify women who require closer evaluation while providing a basis for subsequent prospective assessment.
Keywords: cervical precancer, CIN2+, risk stratification, calibration, decision curve analysis, SHAP, external validation
Introduction
Cervical cancer remains a substantial public-health burden, and its prevention still turns, to a large extent, on whether high-grade precancerous lesions can be identified and managed in time.1 Persistent infection with high-risk human papillomavirus (HPV) is a necessary cause of cervical cancer.2 Cervical intraepithelial neoplasia grade 2 or worse (CIN2+) has therefore come to serve as a clinically meaningful threshold for intensified surveillance and treatment decisions.3 This threshold-based perspective is also reflected in risk estimates supporting contemporary management frameworks.4 Yet at the point of evaluation, risk is still often inferred from a fragmented reading of cytology terminology and colposcopic findings, rather than from an integrated and individualized estimate.5,6
Clinical prediction models offer an obvious means by which heterogeneous structured variables may be assembled into patient-specific estimates of risk. For a threshold-dependent task such as colposcopy triage, however, discrimination alone is not enough. A model intended for clinical use must also yield probabilities of acceptable quality and remain reasonably well calibrated.7,8 This matters particularly in cervical disease management, where management choices are inherently threshold dependent. Evaluation should therefore extend beyond rank performance and include calibration, threshold-based operating characteristics, and decision-curve-based assessment of clinical usefulness. In this setting, the clinical value of a prediction model is therefore shaped not only by its ability to rank patients, but also by whether its estimated risks can be interpreted at thresholds that are meaningful for referral, surveillance, or follow-up.
Structured prediction for cervical precancer is methodologically appealing, not least because many relevant predictors are already available at the index visit.9 Gradient-boosted tree methods such as XGBoost and LightGBM have performed well on structured clinical data,10,11 and recent work has begun to apply such methods to cervical precancer prediction with encouraging results.12,13 Explainable machine-learning methods such as SHAP have further made tree-based models more auditable at both the cohort and individual levels.14 At the same time, reporting frameworks such as TRIPOD and PROBAST have shifted attention toward reproducibility, calibration, and external validation.15,16 More recent guidance has extended this emphasis to machine-learning reporting.17 Structured appraisal of bias and implementation readiness has been further strengthened by DECIDE-AI and ROBUST-ML.18,19
Despite that progress, several practical gaps remain. In cervical prediction studies, discrimination metrics are still commonly foregrounded, whereas calibration quality and clinically relevant operating thresholds often receive less sustained attention. External validation is frequently absent, or else too limited to support confident claims of transportability. Variables that approximate clinician judgment may also improve apparent performance, while their role in a portable and standardized model remains insufficiently defined. What would be required, therefore, is not merely model development, but a coherent workflow in which leakage control, calibration, threshold selection, sensitivity analysis, and external validation are handled with equal care.
In the present study, a leakage-controlled machine-learning workflow for CIN2+ risk stratification was developed and externally validated using routinely collected structured clinical variables. Candidate models were compared through pooled out-of-fold evaluation, and the final model was selected by a composite view of discrimination, calibration, decision utility, and implementation practicality. The incremental value of a clinician-recorded image-based assessment variable was examined in sensitivity analysis, whereas SHAP was used to characterize model behavior at both the global and the individual level. By bringing these components into a single workflow, the present study was designed to move from model comparison toward a clinically interpretable framework in which calibration, decision utility, external validation, explainability, and prototype translation could be considered together. The aim was not simply to identify the strongest classifier, but to construct a calibrated and clinically legible prediction workflow suitable for future risk-based colposcopy triage.
Methods
Study Design and Data Source
This retrospective study drew on structured clinical data from the Second Affiliated Hospital of Shandong First Medical University. The development cohort comprised women evaluated between December 2024 and December 2025 who underwent colposcopic assessment and for whom histopathology was available as the reference standard. An independent external validation cohort of 103 women was analyzed using the same endpoint definition and predictor schema, with no overlap in patients relative to the development cohort. From the outset, the study was organized as a clinically oriented prediction workflow in which leakage control, probability calibration, threshold-based reporting, and external validation were treated as core analytic elements rather than as secondary add-ons.
All predictors were extracted from structured records available at the index visit, before final histopathologic adjudication of outcome. Histopathology served as the reference standard for endpoint definition. A cohort flow diagram was used to summarize the exclusion of cases with missing or invalid reference outcome labels and to show the final analytic sample retained for internal model development.
Predictors and Feature Sets
The primary feature set comprised 12 routinely available structured variables spanning demographic status, reproductive history, HPV-related indicators, cytology, and colposcopic findings: age, menopausal status, gravidity, parity, at least one living child, overall high-risk HPV positivity, HPV16 status, HPV18 status, cytology grade, colposcopic impression, transformation zone type, and iodine test negativity. Other high-risk HPV and atypical vessels were excluded from formal primary modeling owing to their extremely low prevalence in the development dataset, although they were retained in descriptive audit outputs. Patient identifiers were used solely for record linkage and were never entered into model development.
An exploratory clinician-recorded binary variable, referred to here as clinician image-based assessment, was evaluated only in sensitivity analysis. This variable captured the clinician’s image- or colposcopy-based judgment documented at the index visit before histopathology became available. It was intentionally excluded from the primary model so that the core pipeline would remain portable and independent of a near-decision variable whose standardization varies across settings. The final variable dictionary and the modeling role of each variable are summarized in Table 1.
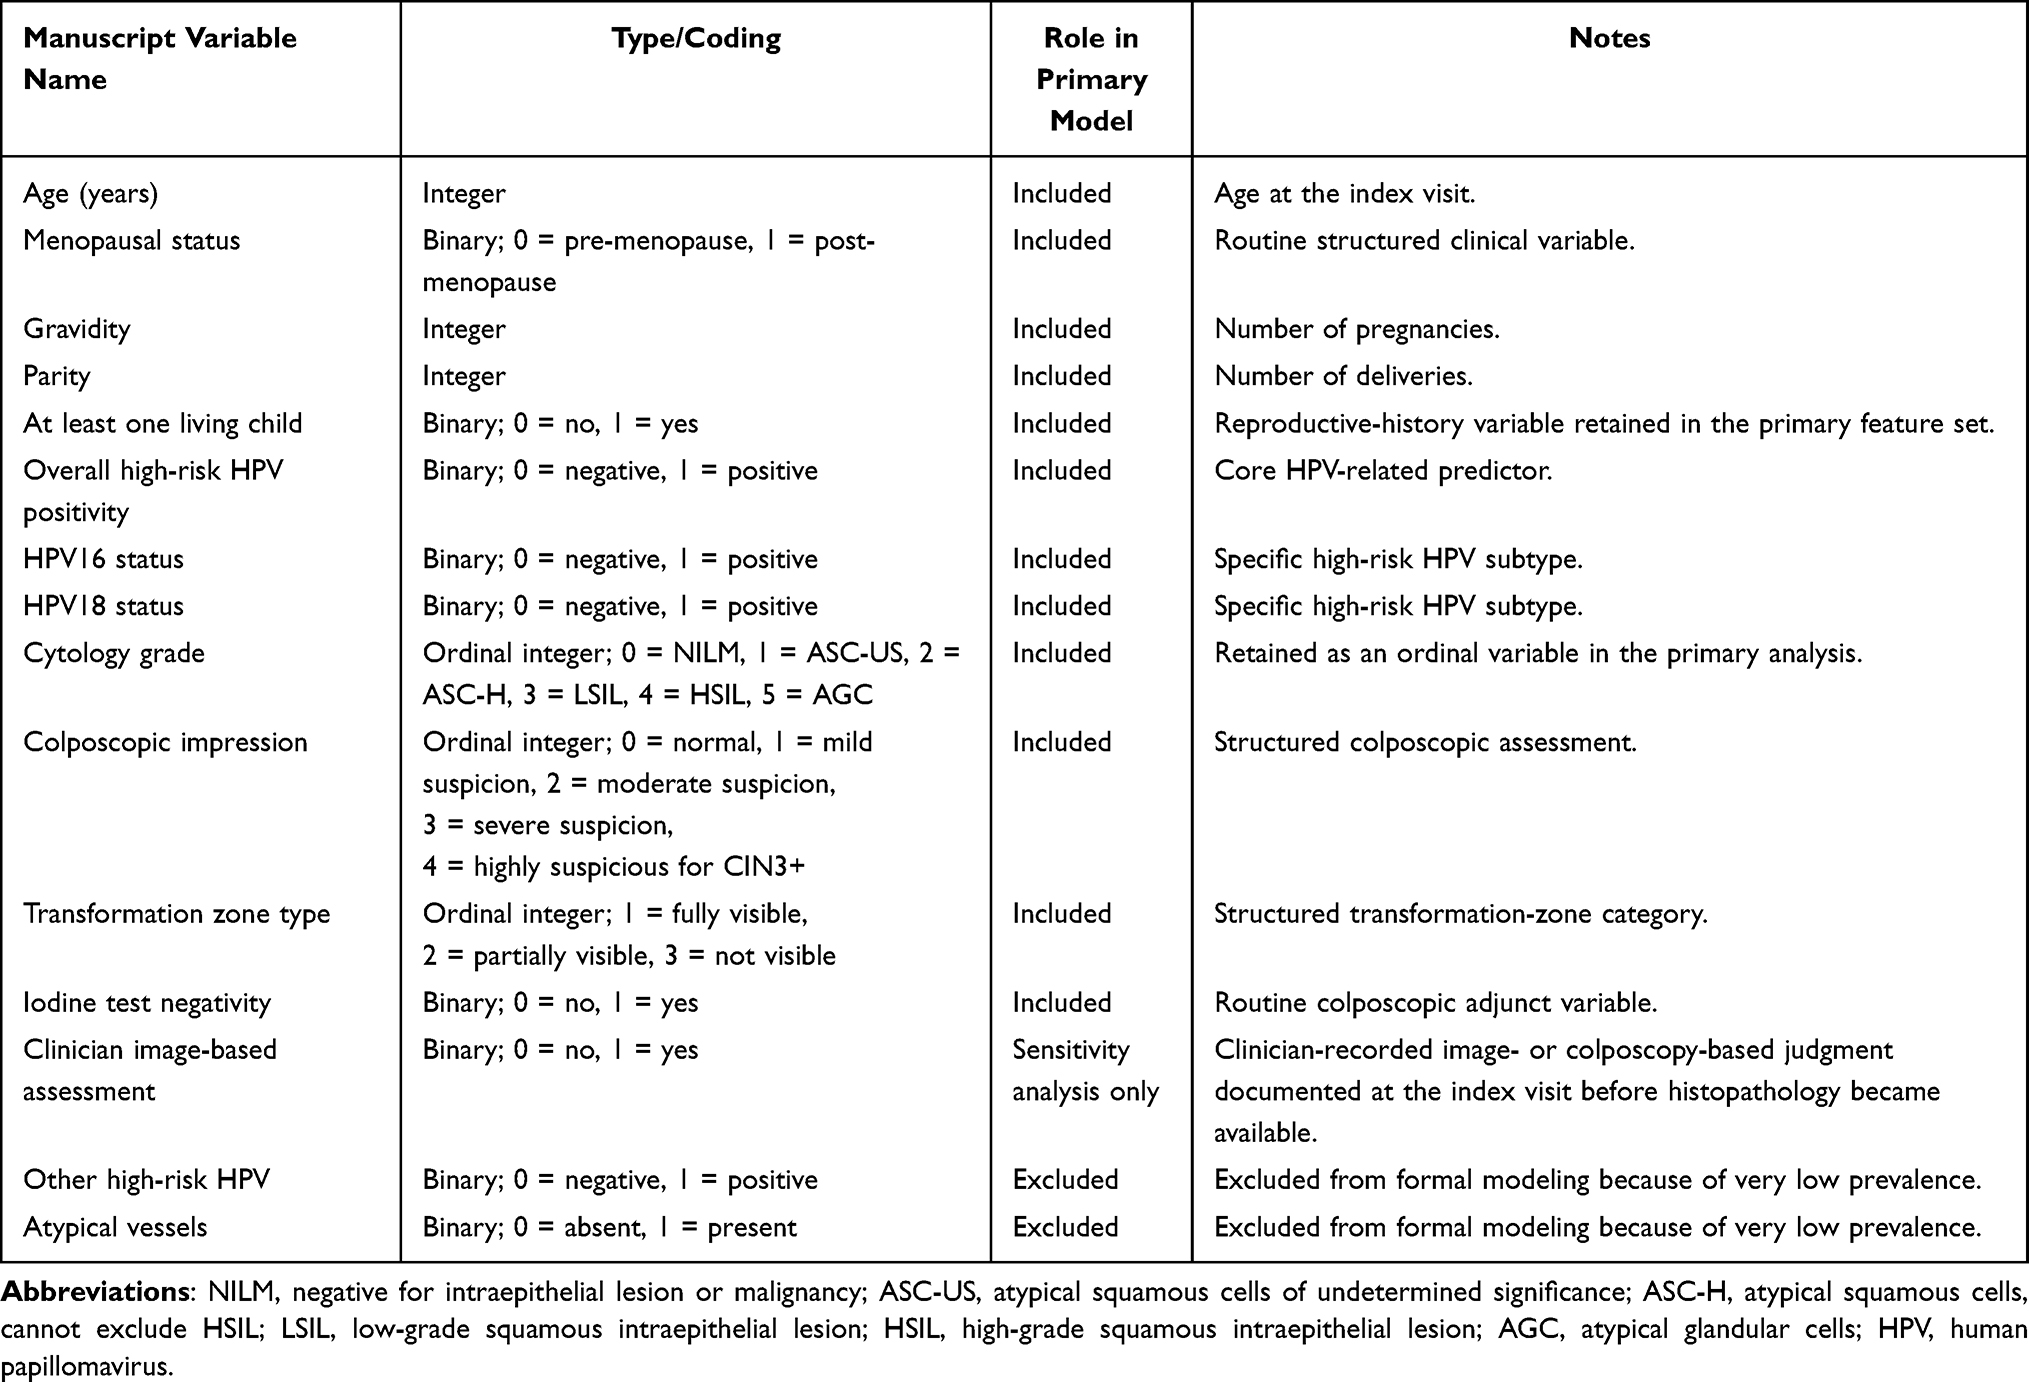 |
Table 1 Final Variable Dictionary and Modeling Role |
Model Development, Leakage Control, and Model Selection
Stratified 5-fold cross-validation was used to generate pooled out-of-fold (OOF) predicted probabilities. Within each fold, all preprocessing steps, including missing-value handling, encoding, calibration, and threshold selection, were fitted exclusively on the training split and were then applied to the held-out split. This fold-wise design was intended to minimize optimistic bias in performance estimation. Given the moderate outcome imbalance, stratified cross-validation was used to preserve the outcome distribution across folds, and model performance was interpreted using AUPRC, calibration metrics, threshold-based operating characteristics, and decision curve analysis in addition to AUROC.
The candidate models were logistic regression, LightGBM, and XGBoost. Logistic regression served as a transparent linear benchmark, whereas LightGBM and XGBoost were used as nonlinear tree-based learners capable of capturing higher-order interactions among structured clinical variables. XGBoost was configured with 120 boosting rounds, a learning rate of 0.05, a maximum tree depth of 3, a subsample ratio of 0.9, a column-sampling ratio of 0.9, and an L2 regularization term (lambda) of 1.0. LightGBM was configured with 120 boosting rounds, a learning rate of 0.05, 15 maximum leaves, and column-sampling and subsample ratios of 0.9. These hyperparameters were fixed a priori and were not subjected to further tuning within the cross-validation loop, in order to reduce the risk of overfitting on a moderate-sized dataset and to improve reproducibility. Missing values in continuous variables (age, gravidity, parity) were imputed with the within-fold training-set median, whereas missing categorical variables were imputed with the within-fold training-set mode; both imputation steps were fitted exclusively on the training split and applied to the held-out split to prevent information leakage. For logistic regression, continuous features were additionally standardized using within-fold z-score scaling. The final model was not selected by AUROC alone. Rather, discrimination (AUROC and AUPRC), probability quality (Brier score and ECE), calibration-curve behavior, decision-curve analysis, threshold operating characteristics, external validation results, interpretability, and implementation practicality were all considered jointly.
Post-hoc probability calibration was evaluated with sigmoid scaling and isotonic regression for the most competitive candidate models. For the selected model, two clinically relevant operating points were prespecified: a balanced threshold and a high-sensitivity triage threshold intended to minimize missed CIN2+ cases.
Sensitivity, Subgroup, and Explainability Analyses
Sensitivity analysis addressed two practical questions. First, it was assessed whether incorporation of the clinician image-based assessment variable materially improved discrimination and probability quality. Second, model robustness was examined after exclusion of the at-least-one-living-child variable, exclusion of broader reproductive-history variables, and restriction to routine clinic variables. Prespecified subgroup analyses considered age, menopausal status, overall high-risk HPV status, and transformation zone type.
Explainability for the final tree-based model was examined with Shapley additive explanations (SHAP), including a global importance summary, a beeswarm plot depicting the distribution of per-feature contributions, and an individual waterfall plot for a representative high-risk case. These analyses were intended to support model auditing and clinical face validity rather than to redefine the predictor set.
Statistical Analysis and Software
Categorical variables were summarized as frequencies and percentages, and continuous variables were summarized as mean ± standard deviation or median [Q1–Q3], as appropriate. Model performance was summarized with pooled OOF predictions generated under stratified 5-fold cross-validation.20 Discrimination was assessed by AUROC and AUPRC. Probability quality was assessed by the Brier score and expected calibration error (ECE).21 Clinical utility was examined with decision curve analysis (DCA).22 Post-hoc calibration was implemented with standard probability-calibration approaches.23,24 The development workflow was implemented as a reproducible project pipeline using Python 3.10 with scikit-learn (≥1.3), XGBoost (≥2.0), LightGBM (≥4.0), and SHAP (≥0.44). Between-group comparisons of baseline characteristics were performed using the chi-square test or Fisher exact test for categorical variables and the independent-samples t-test or Mann–Whitney U-test for continuous variables, as appropriate. A two-sided P value below 0.05 was considered statistically significant. The selected model was packaged into a prototype clinical interface built with Streamlit (≥1.31).
Results
Study Cohort
The cohort flow diagram is presented in Figure 1. Of 887 screened records in the development dataset, 8 were excluded owing to missing or invalid histopathology outcome labels, leaving 879 analyzable cases. CIN2+ prevalence in the development cohort was 27.5% (242/879). The external validation cohort comprised 103 cases, of which 34 (33.0%) had CIN2+.
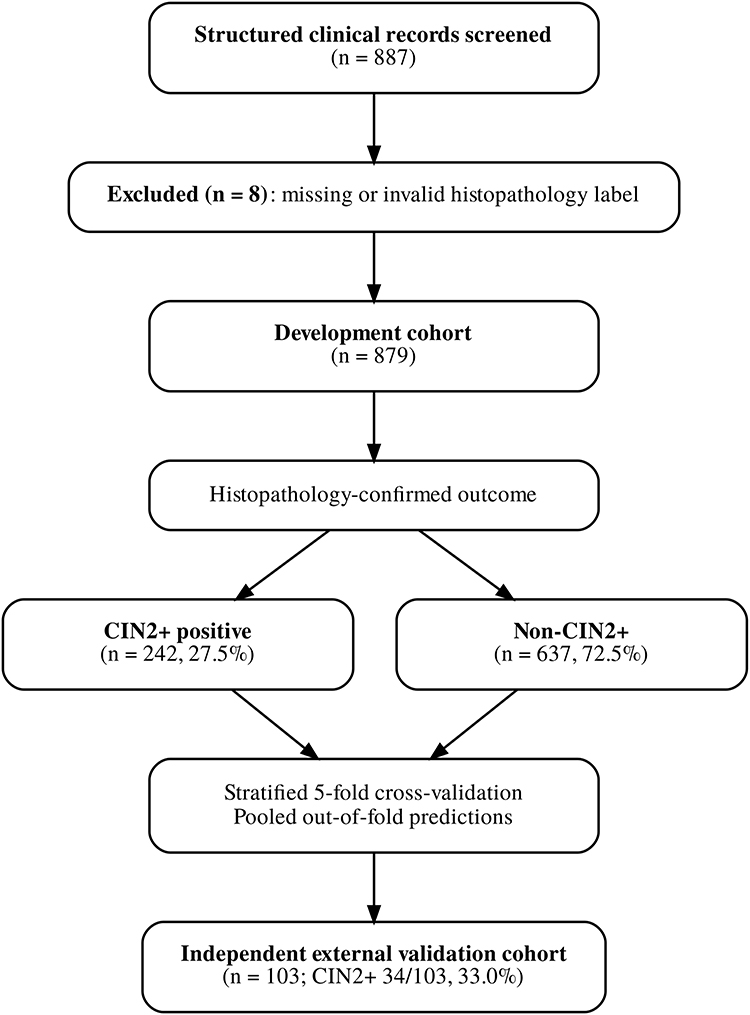 |
Figure 1 Study cohort flow diagram. Structured clinical records screened for eligibility are shown together with exclusions due to missing or invalid histopathology outcome labels. The final development cohort comprised 879 analyzable cases, including 242 women with CIN2+ and 637 without CIN2+. The independent external validation cohort included 103 cases, of whom 34 had CIN2+. |
Baseline characteristics of the development cohort are presented in Table 2. Meaningful between-group differences were observed for overall high-risk HPV positivity (195/242, 80.6% vs 413/637, 64.8%; P<0.001), HPV16 positivity (75/242, 31.0% vs 93/637, 14.6%; P<0.001), cytology grade (P<0.001), colposcopic impression (P=0.002), and transformation zone type (P<0.001). By contrast, age, menopausal status, gravidity, parity, at least one living child, HPV18 status, and iodine test negativity showed less pronounced between-group differences. Of note, the “normal” category of colposcopic impression contained no observations, because referral to colposcopy in this setting typically presupposed an abnormal screening result. Additionally, the “highly suspicious for CIN3+” category was numerically more frequent in the non-CIN2+ group (76/637, 11.9%) than in the CIN2+ group (20/242, 8.3%). This counterintuitive pattern likely reflects the recognized imperfect specificity of subjective colposcopic grading, whereby a proportion of women with highly suspicious findings are ultimately confirmed as having benign or low-grade histopathology upon biopsy.
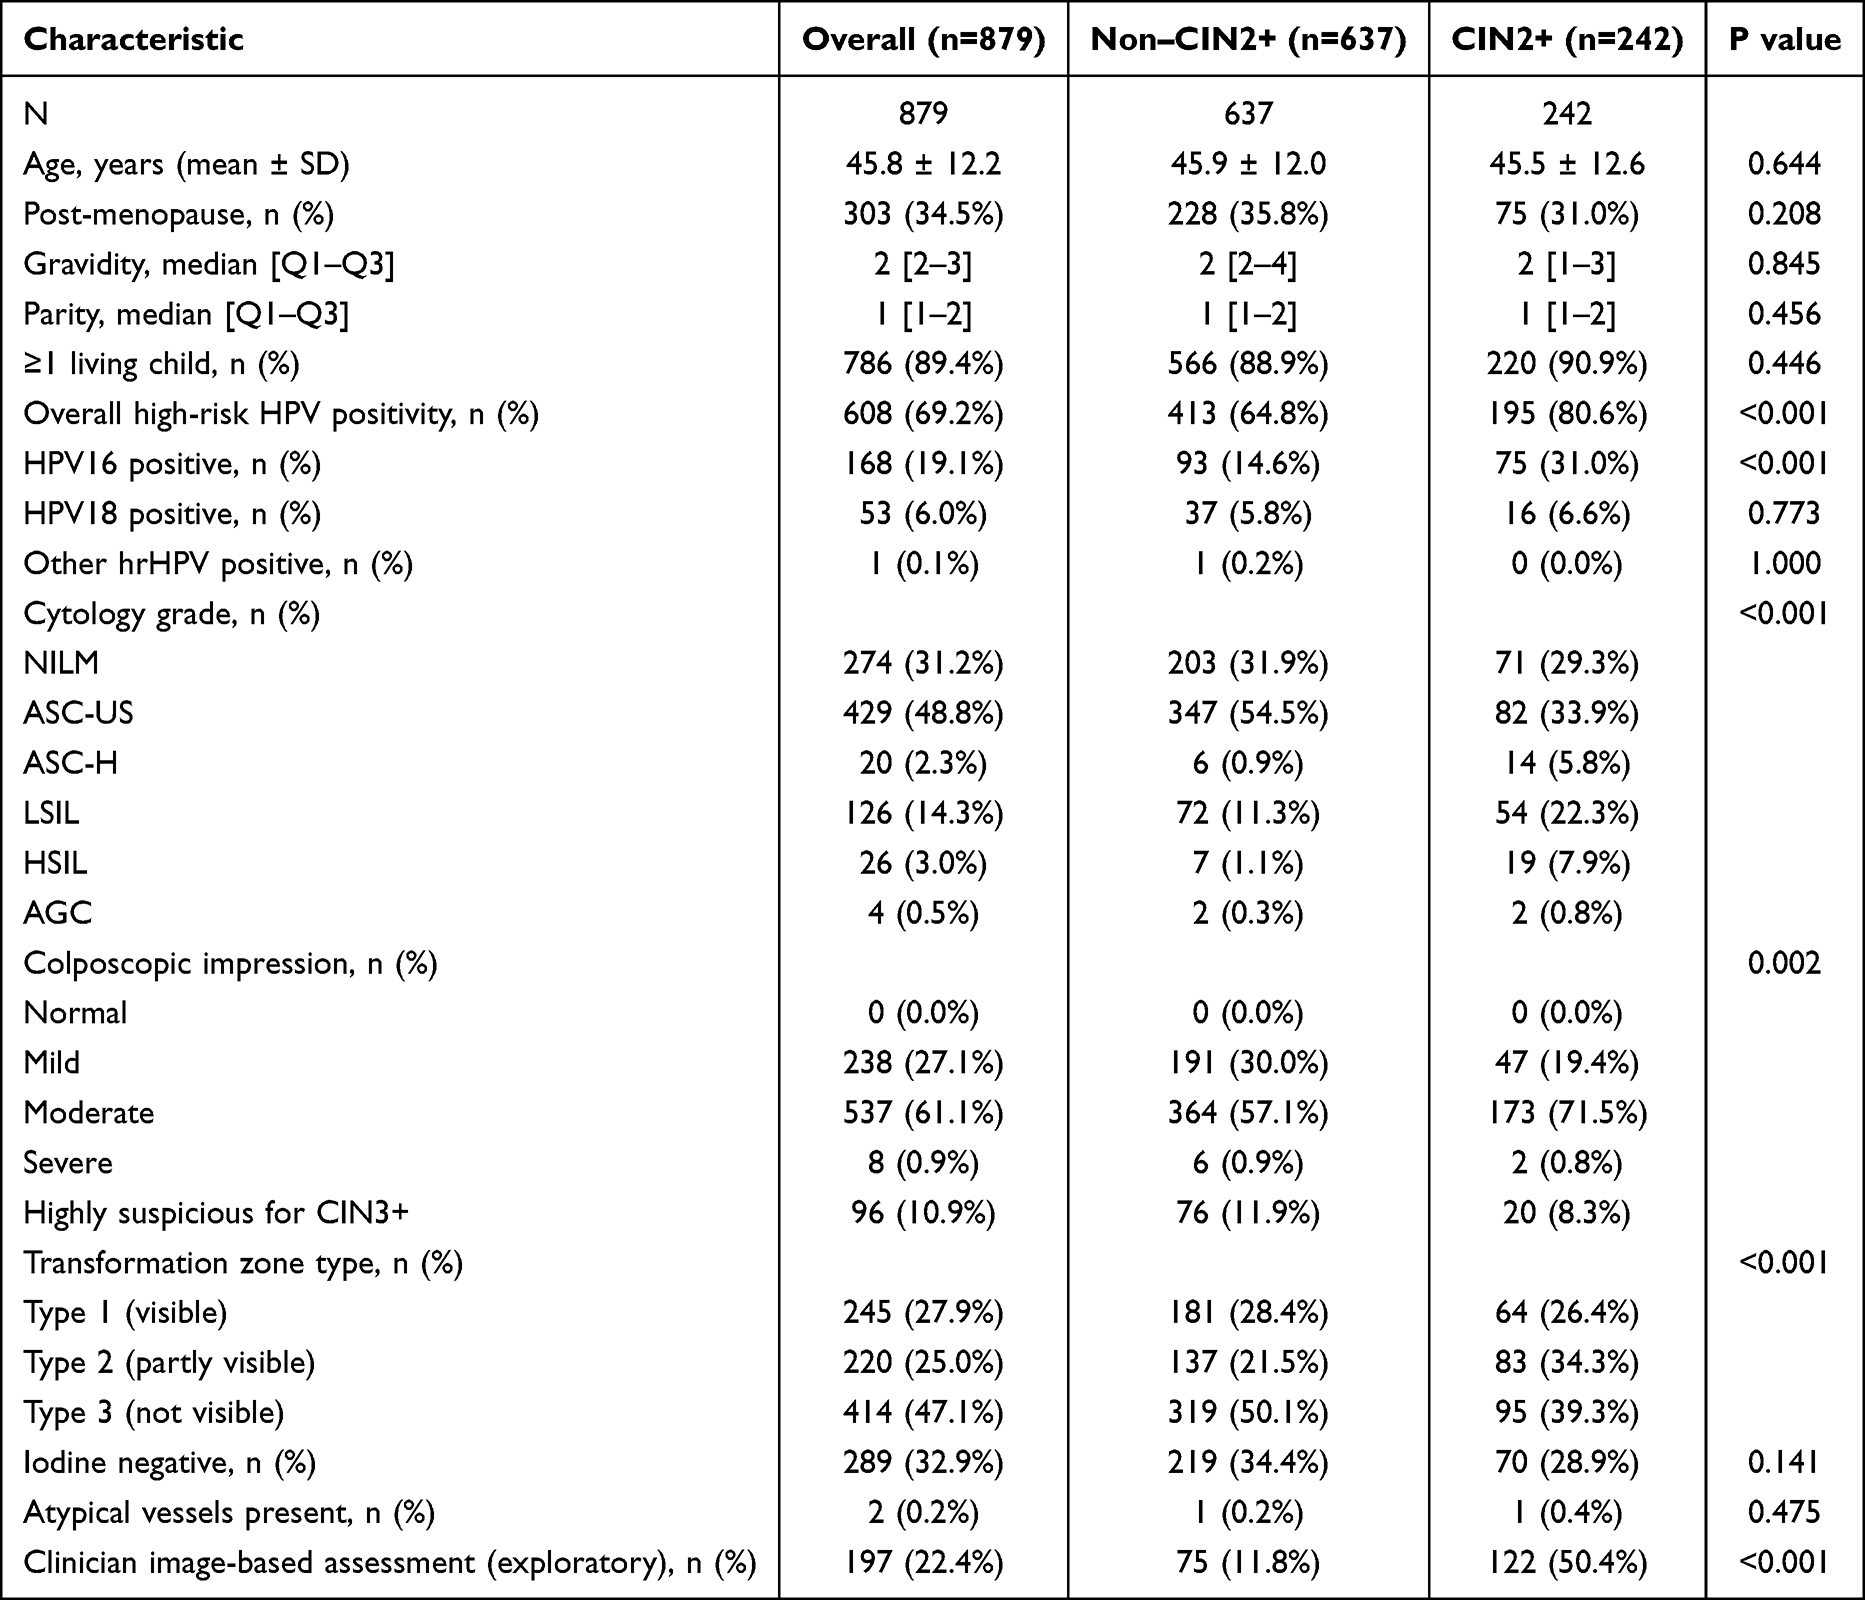 |
Table 2 Baseline Characteristics of the Development Cohort |
Model Comparison and Selection of the Primary Model
Internal model performance based on pooled OOF predictions is summarized in Table 3. Among the uncalibrated candidates, XGBoost achieved the most favorable overall balance between discrimination and calibration, with an AUROC of 0.709, an AUPRC of 0.496, a Brier score of 0.175, and an ECE of 0.017. The corresponding values for LightGBM were 0.679, 0.461, 0.186, and 0.067, whereas logistic regression yielded 0.653, 0.447, 0.228, and 0.201. Although logistic regression remained informative as a transparent benchmark, it proved distinctly less competitive in terms of probability quality.
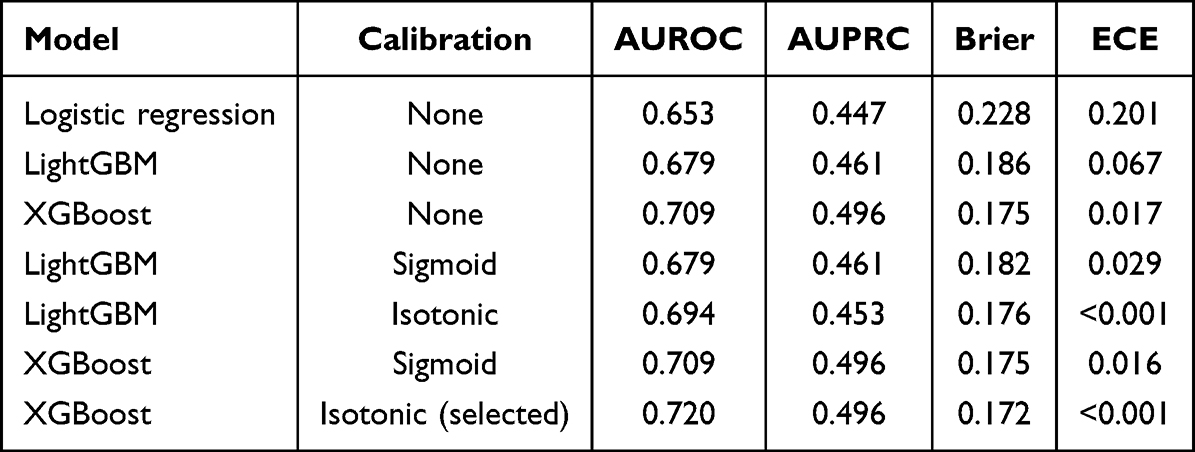 |
Table 3 Internal Pooled Out-of-Fold Performance of Candidate and Calibrated Models |
For the final model, isotonic calibration was selected for XGBoost, since probability quality improved without any meaningful penalty in discrimination. After isotonic calibration, XGBoost achieved an AUROC of 0.720, an AUPRC of 0.496, a Brier score of 0.172, and essentially zero ECE. LightGBM also improved after isotonic calibration, yet remained inferior to XGBoost in the overall composite assessment. On that basis, isotonic-calibrated XGBoost was selected as the primary model for external validation, threshold analysis, explainability assessment, and prototype translation.
Calibration Performance
Internal calibration curves are shown in Figure 2. Although the uncalibrated XGBoost model already displayed reasonably good probability quality, isotonic regression yielded the most favorable overall calibration profile among the calibrated candidates. In particular, isotonic-calibrated XGBoost reduced the Brier score from 0.175 to 0.172 and lowered ECE from 0.017 to essentially zero, thereby strengthening its suitability for threshold-based risk estimation rather than rank-only classification.
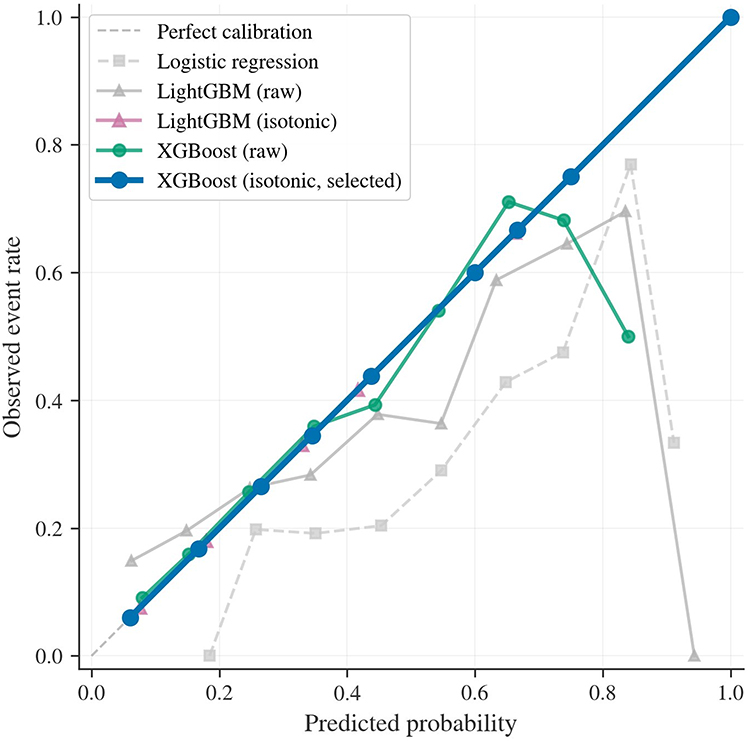 |
Figure 2 Internal calibration curves for candidate and selected models. Calibration performance is shown for logistic regression, raw LightGBM, isotonic-calibrated LightGBM, raw XGBoost, and isotonic-calibrated XGBoost on pooled out-of-fold predictions from stratified 5-fold cross-validation. The dashed diagonal line indicates perfect calibration. The selected isotonic-calibrated XGBoost model showed the closest overall agreement between predicted probabilities and observed event rates. |
Internal Clinical Utility and Threshold-Based Operating Points
Internal decision curve analysis is shown in Figure 3. Across a broad clinically relevant threshold range (0.05–0.95), the selected XGBoost model yielded positive net benefit over both treat-all and treat-none strategies, which supports its potential usefulness for risk-based triage rather than uniform management.
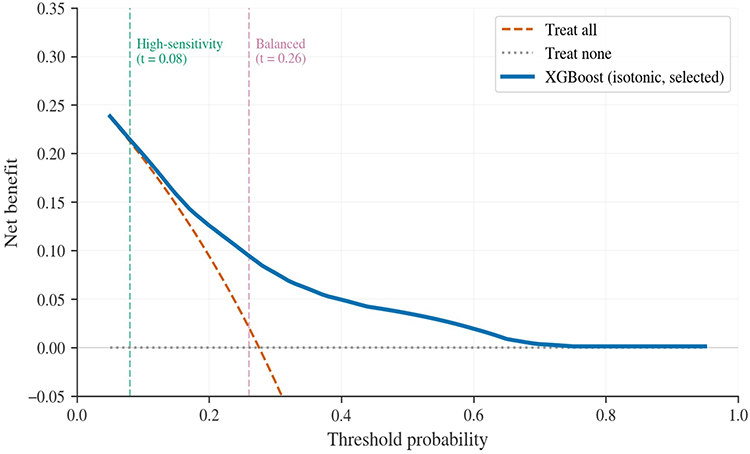 |
Figure 3 Internal decision curve analysis for the selected XGBoost model. Decision curve analysis compares the net benefit of the selected isotonic-calibrated XGBoost model with treat-all and treat-none strategies across threshold probabilities. Vertical dashed lines indicate the prespecified high-sensitivity threshold (0.08) and balanced threshold (0.26). Positive net benefit over both default strategies supports the potential clinical utility of threshold-based CIN2+ triage. |
Threshold-based operating characteristics for the selected model are summarized in Table 4. At the balanced threshold of 0.26, sensitivity was 0.686 and specificity was 0.630, with PPV of 0.413 and NPV of 0.841. At the high-sensitivity threshold of 0.08, sensitivity rose to 0.979 and NPV to 0.940, although specificity fell to 0.122. These operating points therefore served different clinical aims: the high-sensitivity threshold was more suitable for conservative triage when missed CIN2+ lesions should be minimized, whereas the balanced threshold offered a more workable trade-off for settings in which unnecessary referral or follow-up also carries clinical and resource costs.
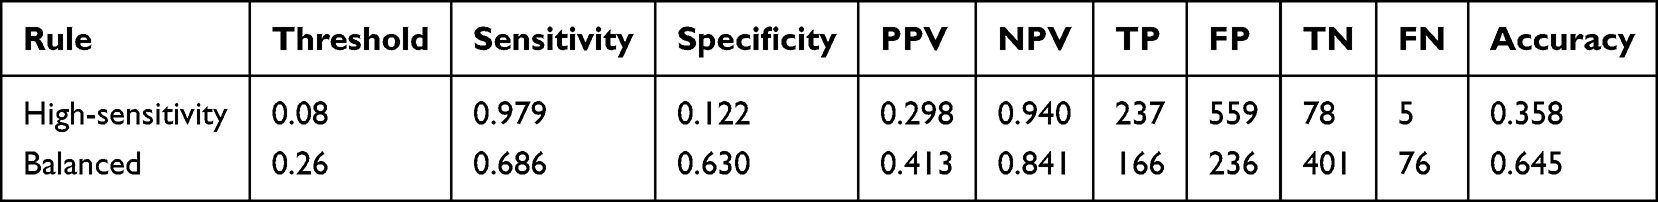 |
Table 4 Threshold-Based Operating Characteristics of the Selected Model |
Sensitivity and Subgroup Analyses
Key sensitivity analyses are summarized in Table 5. When the clinician image-based assessment variable was added to the primary feature set, internal performance improved substantially, with AUROC increasing from 0.704 to 0.758 and AUPRC increasing from 0.485 to 0.598. This finding suggests that clinician-recorded visual judgment carries meaningful additional signal at the index visit. The variable was nevertheless excluded from the primary model so that the main pipeline might remain more portable, more standardized, and less dependent on a near-decision clinician-derived input.
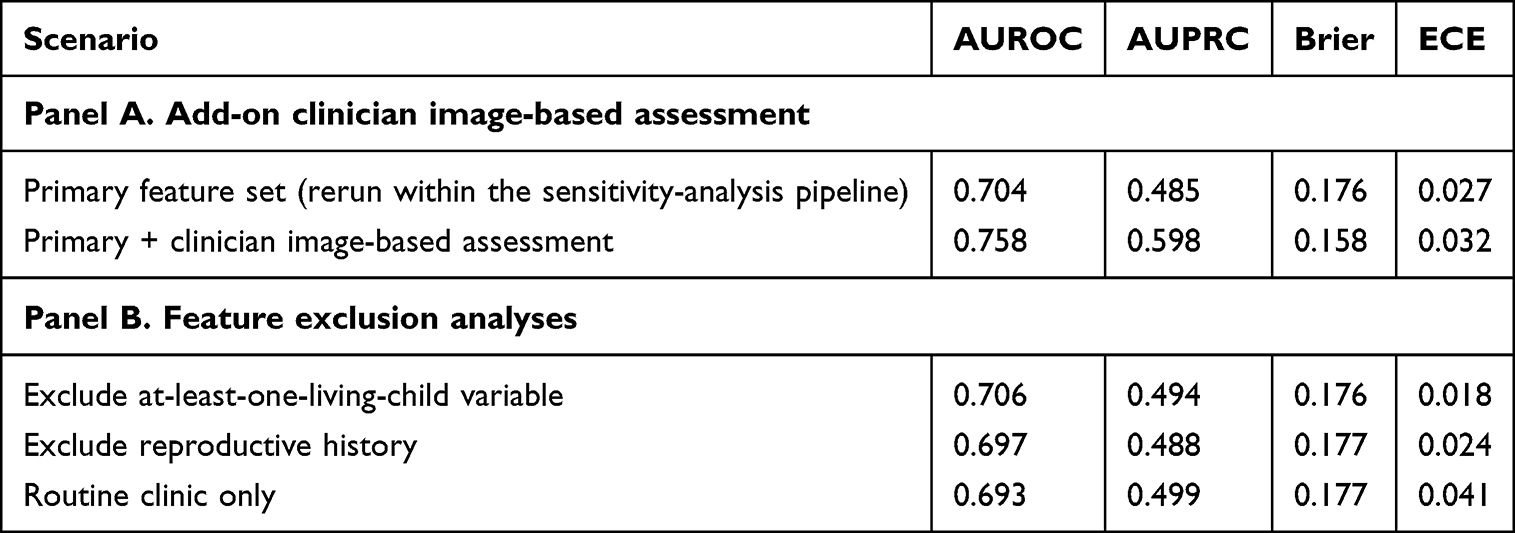 |
Table 5 Sensitivity Analyses |
Feature exclusion analyses suggested that the primary model was reasonably robust. Removal of the at-least-one-living-child variable or of broader reproductive-history variables produced only modest changes in AUROC and Brier score, while a routine-clinic-only feature subset still achieved an AUROC of 0.693 and an AUPRC of 0.499. Exploratory subgroup analyses suggested directionally consistent performance across age, menopausal status, HPV status, and transformation zone type.
The slight numerical differences between Table 5 (Panel A, primary feature set: AUROC 0.704) and Table 3 (uncalibrated XGBoost: AUROC 0.709) arise because the sensitivity-analysis pipeline was executed as a separate prespecified run with a distinct random seed and without post-hoc calibration, rather than being extracted from the primary evaluation pipeline. They do not indicate contradictory estimates.
Model Interpretability
SHAP-based interpretability of the final XGBoost model is presented in Figure 4. At the cohort level, the dominant contributors were cytology grade, HPV16 status, overall high-risk HPV positivity, colposcopic impression, transformation zone type, and age, with additional contributions from gravidity, iodine test negativity, parity, and the at-least-one-living-child variable. The ranking is clinically plausible and supports the face validity of the learned risk signals.
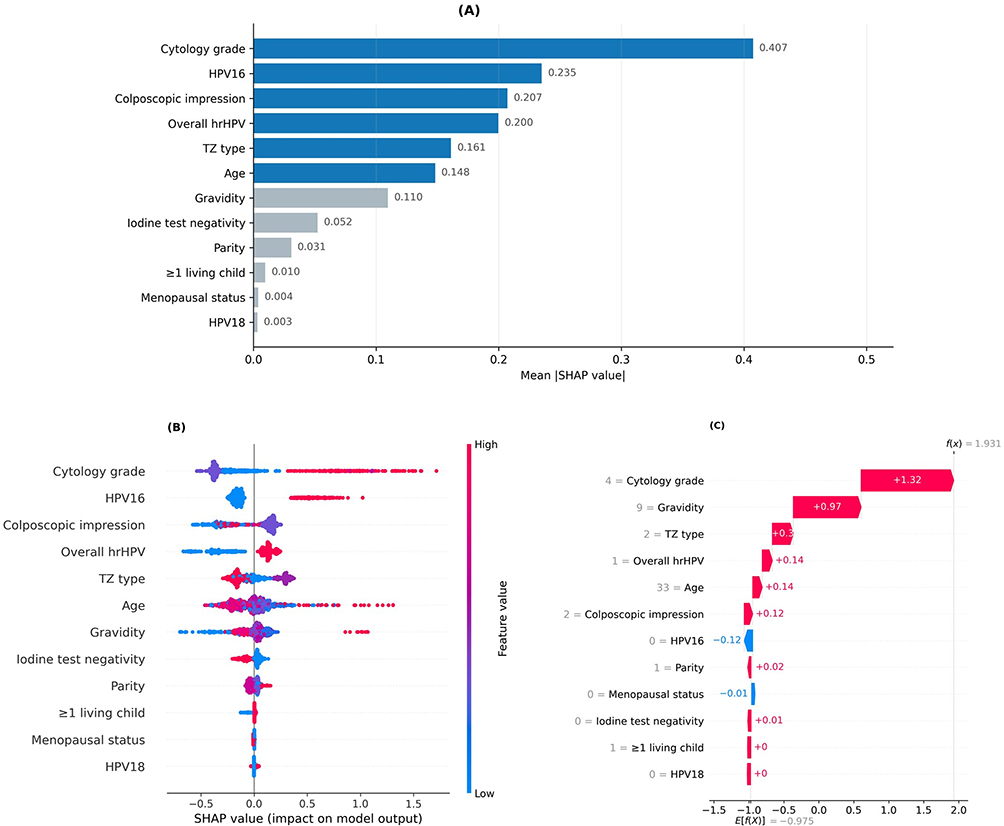 |
Figure 4 SHAP-based interpretability of the selected XGBoost model. (A) Shows global feature importance ranked by mean absolute SHAP value. (B) Presents the SHAP beeswarm plot, in which each point represents one individual prediction and color reflects the underlying feature value. (C) Shows an individual waterfall explanation for a representative high-risk case, illustrating how feature-specific contributions combine to produce the final model output. |
At the individual level, the representative waterfall plot illustrates how the model aggregates multiple structured inputs into a patient-specific prediction. In the example shown, higher cytology grade, greater gravidity, transformation zone type, overall high-risk HPV positivity, and colposcopic impression all contributed positively to the final model output, whereas HPV16 negativity offset the score to a limited extent. Such patient-level decomposition may assist auditing, communication, and threshold-based interpretation of model outputs.
External Validation
External validation confirmed that the calibrated XGBoost model retained moderate, albeit attenuated, performance beyond the development cohort. In the independent external dataset, AUROC was 0.679, AUPRC was 0.505, the Brier score was 0.202, and ECE was 0.106. Overall external performance and threshold transferability are summarized in Table 6.
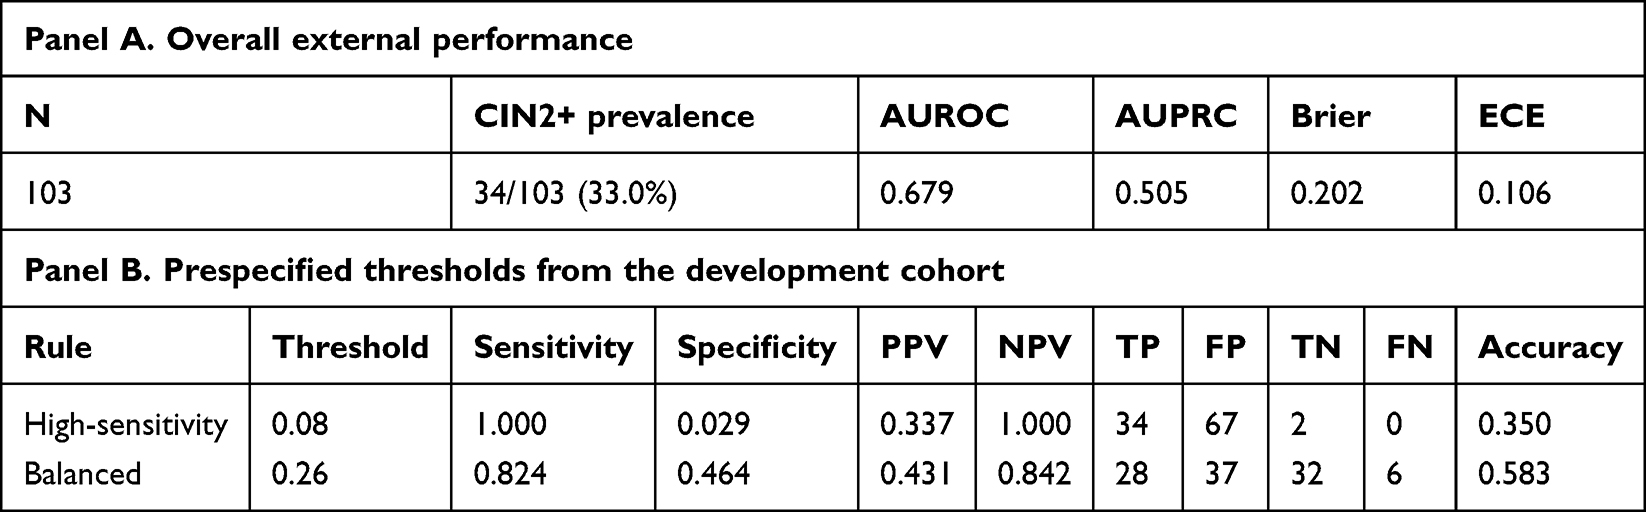 |
Table 6 External Validation Performance and Threshold Transferability |
External calibration and DCA are presented in Figures 5 and 6, respectively. The model continued to show positive net benefit over treat-all across threshold probabilities from 0.08 to 0.74. At the same time, threshold transferability illustrated how strongly operating-point choice affected workload. At the development-derived high-sensitivity threshold of 0.08, external sensitivity reached 1.000 while specificity fell to 0.029. At the development-derived balanced threshold of 0.26, sensitivity was 0.824 and specificity was 0.464, representing a more workable trade-off for selective follow-up or referral.
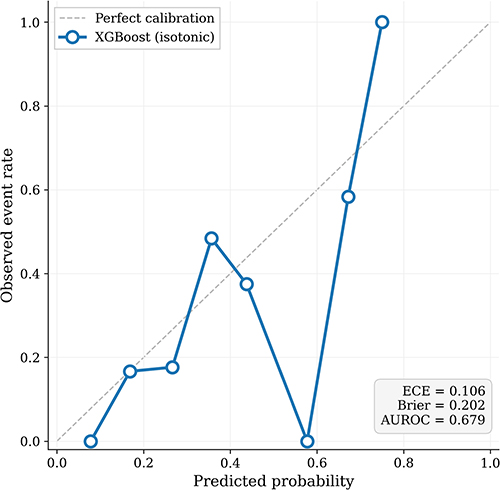 |
Figure 5 External calibration of the selected XGBoost model. Calibration performance of the isotonic-calibrated XGBoost model is shown in the independent external validation cohort. The dashed diagonal line indicates perfect calibration, and the plotted points summarize observed event rates within probability bins. External calibration is presented together with the model’s overall probability-quality profile in the validation dataset. |
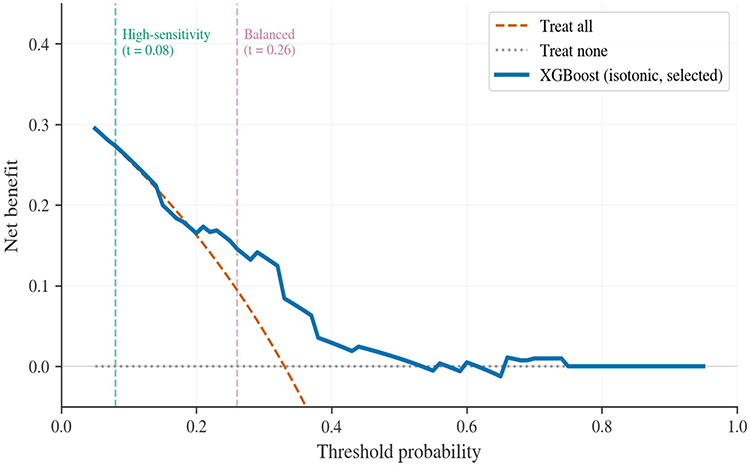 |
Figure 6 External decision curve analysis for the selected XGBoost model. Decision curve analysis in the independent external cohort compares the net benefit of the selected isotonic-calibrated XGBoost model with treat-all and treat-none strategies across threshold probabilities. Vertical dashed lines indicate the development-derived high-sensitivity threshold (0.08) and balanced threshold (0.26), thereby illustrating threshold transferability in external validation. |
Discussion
In this study, an explainable CIN2+ risk-stratification workflow was developed and externally validated using routine structured clinical variables. XGBoost provided the most favorable overall balance of discrimination, probability quality, decision utility, and implementation practicality among the candidate models. Rather than emphasizing discrimination alone, the final workflow was framed around clinically interpretable risk estimation and threshold-based triage.
The central point of the present work is that a clinically relevant cervical prediction model should not be judged by AUROC alone. In the current dataset, XGBoost outperformed logistic regression and LightGBM in overall internal performance, but the more consequential gain arose from calibration and threshold-based framing rather than from discrimination considered in isolation. The selected model not only ranked patients reasonably well, but also produced probabilities better suited to risk-based decision-making once isotonic calibration had been applied. That distinction matters, since colposcopy and follow-up decisions are threshold-dependent and therefore require calibrated risks rather than ranks alone.
The discrimination observed in the present study may be placed in the context of comparable structured-data models for cervical precancer. In a large-scale Chinese screening cohort of over 250,000 women, Dong et al developed the SMART-HPV model using XGBoost with full HPV genotyping, cytology, and clinical variables, achieving AUROCs exceeding 0.90 for CIN2+ prediction across multiple validation cohorts.12 That substantially higher discrimination likely reflects the use of detailed genotype-level data and a development cohort two orders of magnitude larger. In a more comparable clinical setting, Zhai et al used XGBoost with six structured predictors to predict residual or recurrent CIN2+ after LEEP, reporting favorable discrimination with calibration and SHAP analysis in a cohort of 532 women.13 Lee et al reported an accuracy of 0.875 for CIN2+ prediction using logistic regression on clinical data from 1523 subjects,25 while Rothberg et al achieved an AUC of 0.81 for cervical cancer risk using a generalized linear model in a population-based cohort of over 99,000 women.26 Taken together, these comparisons suggest that the AUROC of 0.720 obtained here falls within the moderate range typically seen for structured clinical prediction models when applied to CIN2+ in colposcopy-referred populations. Models with substantially higher discrimination generally incorporate image-level features, detailed genotyping, or are developed in much larger cohorts with lower CIN2+ prevalence.
These findings also speak to a broader point now emphasized in reporting guidance for prediction models that use machine learning: on moderate-sized and heterogeneous clinical tables, algorithmic complexity is not, in itself, a sufficient claim to value. A more complex model becomes worth defending only when it yields practical gains in reliability, transparency, and transportability. XGBoost was selected here for that reason, not merely because it represented the most technically sophisticated candidate. The decision is also consistent with the larger aim of producing a reproducible workflow that might be reused on similar tabular datasets through configuration-driven adaptation.
The sensitivity analysis involving the clinician image-based assessment variable warrants a layered reading. Its inclusion improved discrimination and AUPRC, which suggests that clinician-recorded visual judgment carries substantial incremental signal at the point of care. Yet the variable was kept outside the primary model, not because it lacked value, but because it answered a somewhat different question. The core model was intended as a portable structure built from routinely standardized variables, whereas clinician image-based assessment is better understood as an optional augmentation layer whose usefulness will depend on local documentation quality and interobserver consistency.
SHAP analysis further supported the face validity of the selected model. Cytology grade, HPV16, overall high-risk HPV positivity, colposcopic impression, and transformation zone type emerged as dominant contributors to model output, which is clinically coherent with current understanding of cervical precancer risk. The individual waterfall explanation additionally showed that the prediction for a representative case can be decomposed into intelligible feature-level contributions rather than received as an opaque score. This kind of interpretability is increasingly important for auditability and clinician trust.
External validation offered a more sober account of transport than the internal results alone might suggest. Although attenuation in performance was observed, the model retained moderate discrimination and favorable decision-curve behavior across a clinically meaningful threshold range. This lends preliminary support to transportability, while also underscoring that calibration drift and imperfect threshold transfer should be expected when a model is moved into a new population. It should be acknowledged that the small external sample (n = 103, with only 34 CIN2+ cases pooled from two independent institutions) limits the statistical precision of calibration assessment; several probability bins in Figure 5 contained fewer than five observations, which contributes to the irregular calibration curve and the elevated ECE of 0.106. Larger and more diverse multi-center validation cohorts will be needed to obtain stable estimates of calibration performance. Separately, threshold transferability merits comment: the high-sensitivity threshold preserved sensitivity only at the cost of very poor specificity, whereas the balanced threshold yielded a more workable compromise. Thresholds should therefore be selected in light of clinical objectives and resource constraints rather than imported uncritically.
Several strengths deserve emphasis. The study was conducted within a reproducible and leakage-controlled pipeline that used pooled out-of-fold predictions rather than a single train-test split. Calibration, DCA, threshold reporting, sensitivity analysis, subgroup analysis, SHAP-based interpretability, and external validation were incorporated as integral parts of the analytic strategy rather than appended as afterthoughts. The selected model was also translated into a prototype clinical interface, which illustrates a plausible path from structured clinical data to usable decision support. The principal limitations remain equally clear: the retrospective design, the single-center development cohort, the moderate sample size, the small two-center external validation cohort (which constrained the precision of external calibration estimates), the absence of image-level features, and the use of fixed hyperparameters without systematic tuning, which, although intentional to reduce overfitting risk on a moderate-sized dataset, may have left discriminative potential unexploited. The findings should therefore be read as evidence of feasibility and preliminary transportability, not as proof of readiness for routine clinical adoption.
Taken together, the present work supports the feasibility of calibrated structured-data prediction for CIN2+ risk stratification. What is being argued is not that increasing algorithmic complexity must necessarily yield better medicine, but that a clinically legible risk workflow can be assembled from variables already available at the index visit while keeping calibration, thresholds, and transportability in view. That is arguably the more durable route by which such models can become useful in practice.
Conclusion
A calibrated XGBoost model built from routine structured clinical variables yielded clinically interpretable CIN2+ risk estimates in both internal and external evaluation, supported by SHAP-based explanations and a prototype interface. By placing calibration, threshold-based reporting, decision utility, and external assessment alongside discrimination, the present study provides a more clinically usable foundation for future prospective validation and, if confirmed in larger multicenter cohorts, risk-based colposcopy triage and individualized follow-up.
Data Sharing Statement
The dataset contains sensitive clinical information and is not publicly available. De-identified data may be made available by the corresponding author upon reasonable request, subject to institutional approvals and data-sharing agreements.
Ethics Approval and Consent to Participate
This study was conducted using retrospectively collected clinical data and in accordance with the principles of the Declaration of Helsinki. Ethical approval was obtained from the Ethics Review Committee of the Second Affiliated Hospital of Shandong First Medical University (Approval No. 2026-H-053). The requirement for informed consent was waived in accordance with the committee’s regulations. All data were de-identified prior to analysis and used solely for research purposes.
Disclosure
The authors declare no competing interests in this work.
References
1. Sung H, Ferlay J, Siegel RL, et al. Global Cancer Statistics 2020: GLOBOCAN estimates of incidence and mortality worldwide for 36 cancers in 185 countries. CA Cancer J Clin. 2021;71(3):209–14.
2. Walboomers JMM, Jacobs MV, Manos MM, et al. Human papillomavirus is a necessary cause of invasive cervical cancer worldwide. J Pathol. 1999;189(1):12–19. doi:10.1002/(SICI)1096-9896(199909)189:1<12::AID-PATH431>3.0.CO;2-F
3. Perkins RB, Guido RS, Castle PE, et al. 2019 ASCCP Risk-Based Management Consensus Guidelines for abnormal cervical cancer screening tests and cancer precursors. J Low Genit Tract Dis. 2020;24(2):102–131. doi:10.1097/LGT.0000000000000525
4. Egemen D, Cheung LC, Chen X, et al. Risk estimates supporting the 2019 ASCCP Risk-Based Management Consensus Guidelines. J Low Genit Tract Dis. 2020;24(2):132–143. doi:10.1097/LGT.0000000000000529
5. Nayar R, Wilbur DC, eds.. The Bethesda System for Reporting Cervical Cytology: Definitions, Criteria, and Explanatory Notes.
6. Bornstein J, Bentley J, Bösze P, et al. 2011 colposcopic terminology of the International Federation for Cervical Pathology and Colposcopy. Obstet Gynecol. 2012;120(1):166–172. doi:10.1097/AOG.0b013e318254f90c
7. Steyerberg EW, Vickers AJ, Cook NR, et al. Assessing the performance of prediction models: a framework for traditional and novel measures. Epidemiology. 2010;21(1):128–138. doi:10.1097/EDE.0b013e3181c30fb2
8. Van Calster B, McLernon DJ, van Smeden M, Wynants L, Steyerberg EW. Calibration: the Achilles heel of predictive analytics. BMC Med. 2019;17(1):230. doi:10.1186/s12916-019-1466-7
9. Wentzensen N, Massad LS, Mayeaux EJ, et al. Evidence-based consensus recommendations for colposcopy practice for cervical cancer prevention in the United States. J Low Genit Tract Dis. 2017;21(4):216–222. doi:10.1097/LGT.0000000000000322
10. Chen T, Guestrin C. XGBoost: a scalable tree boosting system. In:
11. Ke G, Meng Q, Finley T, et al. LightGBM: a highly efficient gradient boosting decision tree. Adv Neural Inf Process Syst. 2017;30:3146–3154.
12. Dong B, Lu Z, Yang T, et al. Development, validation, and clinical application of a machine learning model for risk stratification and management of cervical cancer screening based on full-genotyping hrHPV test (SMART-HPV): a modelling study. Lancet Reg Health West Pac. 2025;55:101480. doi:10.1016/j.lanwpc.2025.101480
13. Zhai F, Mu S, Song Y, Zhang M, Zhang C, Lv Z. Machine learning prediction of residual and recurrent high-grade CIN post-LEEP. Cancer Manag Res. 2024;16:1175–1187. doi:10.2147/CMAR.S484057
14. Lundberg SM, Lee SI. A unified approach to interpreting model predictions. Adv Neural Inf Process Syst. 2017;30:4765–4774.
15. Collins GS, Reitsma JB, Altman DG, Moons KGM. Transparent Reporting of a multivariable prediction model for Individual Prognosis or Diagnosis (TRIPOD): the TRIPOD statement. Ann Intern Med. 2015;162(1):55–63. doi:10.7326/M14-0697
16. Moons KGM, Wolff RF, Riley RD, et al. PROBAST: a tool to assess risk of bias and applicability of prediction model studies. Ann Intern Med. 2019;170(1):W1–W33.
17. Collins GS, Moons KGM, Dhiman P, et al. TRIPOD+AI statement: updated guidance for reporting clinical prediction models that use regression or machine learning methods. BMJ. 2024;385:e078378.
18. Vasey B, Nagendran J, Campbell B, et al. Reporting guideline for the early-stage clinical evaluation of decision support systems driven by artificial intelligence: DECIDE-AI. Nat Med. 2022;28(5):924–933. doi:10.1038/s41591-022-01772-9
19. Al-Zaiti SS, Alghwiri A, Hu X, et al. A clinician’s guide to understanding and critically appraising machine learning studies: a checklist for ruling out bias using standard tools in machine learning (ROBUST-ML). Eur Heart J Digit Health. 2022;3(2):125–140. doi:10.1093/ehjdh/ztac016
20. Kohavi R. A study of cross-validation and bootstrap for accuracy estimation and model selection. In:
21. Brier GW. Verification of forecasts expressed in terms of probability. Mon Weather Rev. 1950;78(1):1–3. doi:10.1175/1520-0493(1950)078<0001:VOFEIT>2.0.CO;2
22. Vickers AJ, Elkin EB. Decision curve analysis: a novel method for evaluating prediction models. Med Decis Making. 2006;26(6):565–574. doi:10.1177/0272989X06295361
23. Platt JC. Probabilistic outputs for support vector machines and comparisons to regularized likelihood methods. In: Smola A, Bartlett P, Schölkopf B, Schuurmans D, editors. Advances in Large Margin Classifiers. MIT Press; 1999:61–74.
24. Zadrozny B, Elkan C. Transforming classifier scores into accurate multiclass probability estimates. In:
25. Lee CH, Peng CY, Li RN, et al. Risk evaluation for the development of cervical intraepithelial neoplasia: development and validation of risk-scoring schemes. Int J Cancer. 2015;136(2):340–349. doi:10.1002/ijc.28982
26. Rothberg MB, Hu B, Lipold L, et al. A risk prediction model to allow personalized screening for cervical cancer. Cancer Causes Control. 2018;29(3):297–304. doi:10.1007/s10552-018-1013-4
 © 2026 The Author(s). This work is published and licensed by Dove Medical Press Limited. The
full terms of this license are available at https://www.dovepress.com/terms
and incorporate the Creative Commons Attribution
- Non Commercial (unported, 4.0) License.
By accessing the work you hereby accept the Terms. Non-commercial uses of the work are permitted
without any further permission from Dove Medical Press Limited, provided the work is properly
attributed. For permission for commercial use of this work, please see paragraphs 4.2 and 5 of our Terms.
© 2026 The Author(s). This work is published and licensed by Dove Medical Press Limited. The
full terms of this license are available at https://www.dovepress.com/terms
and incorporate the Creative Commons Attribution
- Non Commercial (unported, 4.0) License.
By accessing the work you hereby accept the Terms. Non-commercial uses of the work are permitted
without any further permission from Dove Medical Press Limited, provided the work is properly
attributed. For permission for commercial use of this work, please see paragraphs 4.2 and 5 of our Terms.
Recommended articles
External Validation of Models for Predicting Disability in Community-Dwelling Older People in the Netherlands: A Comparative Study
van der Ploeg T, Schalk R, Gobbens RJJ
Clinical Interventions in Aging 2023, 18:1873-1882
Published Date: 14 November 2023
Machine-Learning Based Prognostic Model for Predicting Early Recurrence in HCC Patients After Hepatectomies: An Explainable AI Approach
Hsu HY, Lin JC, Huang CW, Huang SF, Wu CY, Huang TS, Lai HF, Yu MC
Journal of Hepatocellular Carcinoma 2026, 13:618264
Published Date: 24 June 2026