Back to Journals » Clinical Interventions in Aging » Volume 18
External Validation of Models for Predicting Disability in Community-Dwelling Older People in the Netherlands: A Comparative Study
Authors van der Ploeg T ![]() , Schalk R
, Schalk R ![]() , Gobbens RJJ
, Gobbens RJJ ![]()
Received 17 August 2023
Accepted for publication 7 November 2023
Published 14 November 2023 Volume 2023:18 Pages 1873—1882
DOI https://doi.org/10.2147/CIA.S428036
Checked for plagiarism Yes
Review by Single anonymous peer review
Peer reviewer comments 2
Editor who approved publication: Dr Maddalena Illario
Tjeerd van der Ploeg,1 René Schalk,2– 4 Robbert J J Gobbens1,2,5,6
1Faculty of Health, Sports and Social Work, Inholland University of Applied Sciences, Amsterdam, the Netherlands; 2Tranzo, Tilburg University, Tilburg, the Netherlands; 3Human Resource Studies, Tilburg University, Tilburg, the Netherlands; 4Economic and Management Science, North West University, Potchefstroom, South Africa; 5Zonnehuisgroep Amstelland, Amstelveen, the Netherlands; 6Department Family Medicine and Population Health, Faculty of Medicine and Health Sciences, University of Antwerp, Antwerp, Belgium
Correspondence: Tjeerd van der Ploeg, Inholland University of Applied Sciences, Faculty of Health, Sports and Social Work, De Boelelaan 1109, Amsterdam, 1081 HV, the Netherlands, Tel +31 6 53519264, Email [email protected]
Background: Advanced statistical modeling techniques may help predict health outcomes. However, it is not the case that these modeling techniques always outperform traditional techniques such as regression techniques. In this study, external validation was carried out for five modeling strategies for the prediction of the disability of community-dwelling older people in the Netherlands.
Methods: We analyzed data from five studies consisting of community-dwelling older people in the Netherlands. For the prediction of the total disability score as measured with the Groningen Activity Restriction Scale (GARS), we used fourteen predictors as measured with the Tilburg Frailty Indicator (TFI). Both the TFI and the GARS are self-report questionnaires. For the modeling, five statistical modeling techniques were evaluated: general linear model (GLM), support vector machine (SVM), neural net (NN), recursive partitioning (RP), and random forest (RF). Each model was developed on one of the five data sets and then applied to each of the four remaining data sets. We assessed the performance of the models with calibration characteristics, the correlation coefficient, and the root of the mean squared error.
Results: The models GLM, SVM, RP, and RF showed satisfactory performance characteristics when validated on the validation data sets. All models showed poor performance characteristics for the deviating data set both for development and validation due to the deviating baseline characteristics compared to those of the other data sets.
Conclusion: The performance of four models (GLM, SVM, RP, RF) on the development data sets was satisfactory. This was also the case for the validation data sets, except when these models were developed on the deviating data set. The NN models showed a much worse performance on the validation data sets than on the development data sets.
Keywords: prediction models, modeling techniques, external validation, performance, calibration, correlation coefficient, root of the mean squared error
Introduction
Prediction of continuous and binary outcomes has since long received much attention in medical research.
Prediction is a complex process because the specification of the model structure requires the inclusion of main effects, potential nonlinearities and statistical interactions.1–3 While most prediction models for continuous and binary outcomes are still based on regression analysis, there is an increasing interest in more advanced techniques, such as support vector machines, neural nets, and tree models. These more advanced methods hold the promise of better capturing nonlinearities and interactions in medical data.4 Some examples are: the use of support vector machines for the classification of breast cancer,5 the application of neural networks for the analysis of censored survival data,6 the prediction of frailty with Bayesian networks,7 and risk prediction of type II diabetes based on a random forest model.8
The performance of a prediction model at internal and external validation is a decisive factor in choosing a modeling technique for prediction. Many studies compared advanced modeling techniques with classical techniques, but mostly the resulting models were only validated internally.9 External validation was used in only a few comparisons of classification trees, neural networks and logistic regression,10–12 and in a comparative study on stroke patients.13 External validation is necessary to assess the reproducibility and the generalizability of a model.14
The performance of a prediction model can be assessed using various measures,15 but the focus is commonly on discrimination. When the performance of a model is assessed in a new data set, estimates can be influenced in several ways. The model parameters may be incorrect, which results in a poorly fitting model. However, the distribution of patient characteristics (case-mix) may also differ, which directly influences the performance of the model.16 Less heterogeneity at external validation implies lower performance compared to the model development setting. Therefore, benchmark values were recently proposed to disentangle a case-mix effect from incorrect regression coefficients, when interpreting the performance of a model in a validation set.17
In this study, we aimed to compare the external validity of five modeling techniques in predicting the disability score as measured with the Groningen Activity Restriction Scale (GARS) for community-dwelling older people18 with items of the Tilburg Frailty Indicator (TFI).19 We choose this patient group because the Netherlands is aging and, as a result, the number of community-dwelling older people is increasing. This increase has a major impact on the healthcare system in the Netherlands and the care that needs to be given to this group.20 Many studies therefore focus on this patient group. For example, a study concerning factors associated with falls among community-dwelling older adults.21
The preferred technique for the prediction of the GARS score for this patient group is still under debate, and preference for a technique varies among investigators. Various statistical techniques have been used in this area. Nowadays, a wide array of advanced learning techniques is available, including tree modeling techniques, support vector machines, and neural networks.
Methods
Data
In this study, we used five data sets for the development and the validation of the models. The five data sets included data from community-dwelling older people that filled in the Tilburg Frailty Indicator (TFI)19 for assessing frailty among community-dwelling older people and eighteen items as measured with the Groningen Activity Restriction Scale (GARS)18 by which the total disability score was calculated. The B-part of the TFI consists of fifteen items, but one item was left out because this item was not present in all data sets. We used the fourteen remaining items as dichotomized predictors to predict the total disability score.
The first data set contained data from a sample that was randomly drawn in 2008 from the municipality Roosendaal, the Netherlands. Of the 1154 people aged 75 years or older who received the questionnaires (TFI, GARS), a total of 484 people decided to participate in the study (response rate 42%). In addition, we used three data sets from the “Senioren Barometer”. This was a web-based questionnaire to assess opinions of Dutch people aged 50 years or older about different aspects of their life. For this study, we included data collected in 2009, 2010, and 2012 with 1492, 1302, and 661 participants, respectively. The subjects were invited to participate in different ways and through multiple sources. For instance, organizations for older people were asked to issue an announcement about completing the “Senioren Barometer” on their websites. The fifth data set contained data collected in 2015 among people who received homecare from Zonnehuisgroep Amstelland. This sample included 142 people referring to a response rate 24.2%.
For each data set, we deleted the subjects which had missing values for the GARS or for at least one of the fourteen dichotomized predictors of the TFI. For the final number of subjects of each data set we used for the modeling, we refer to Table 1.
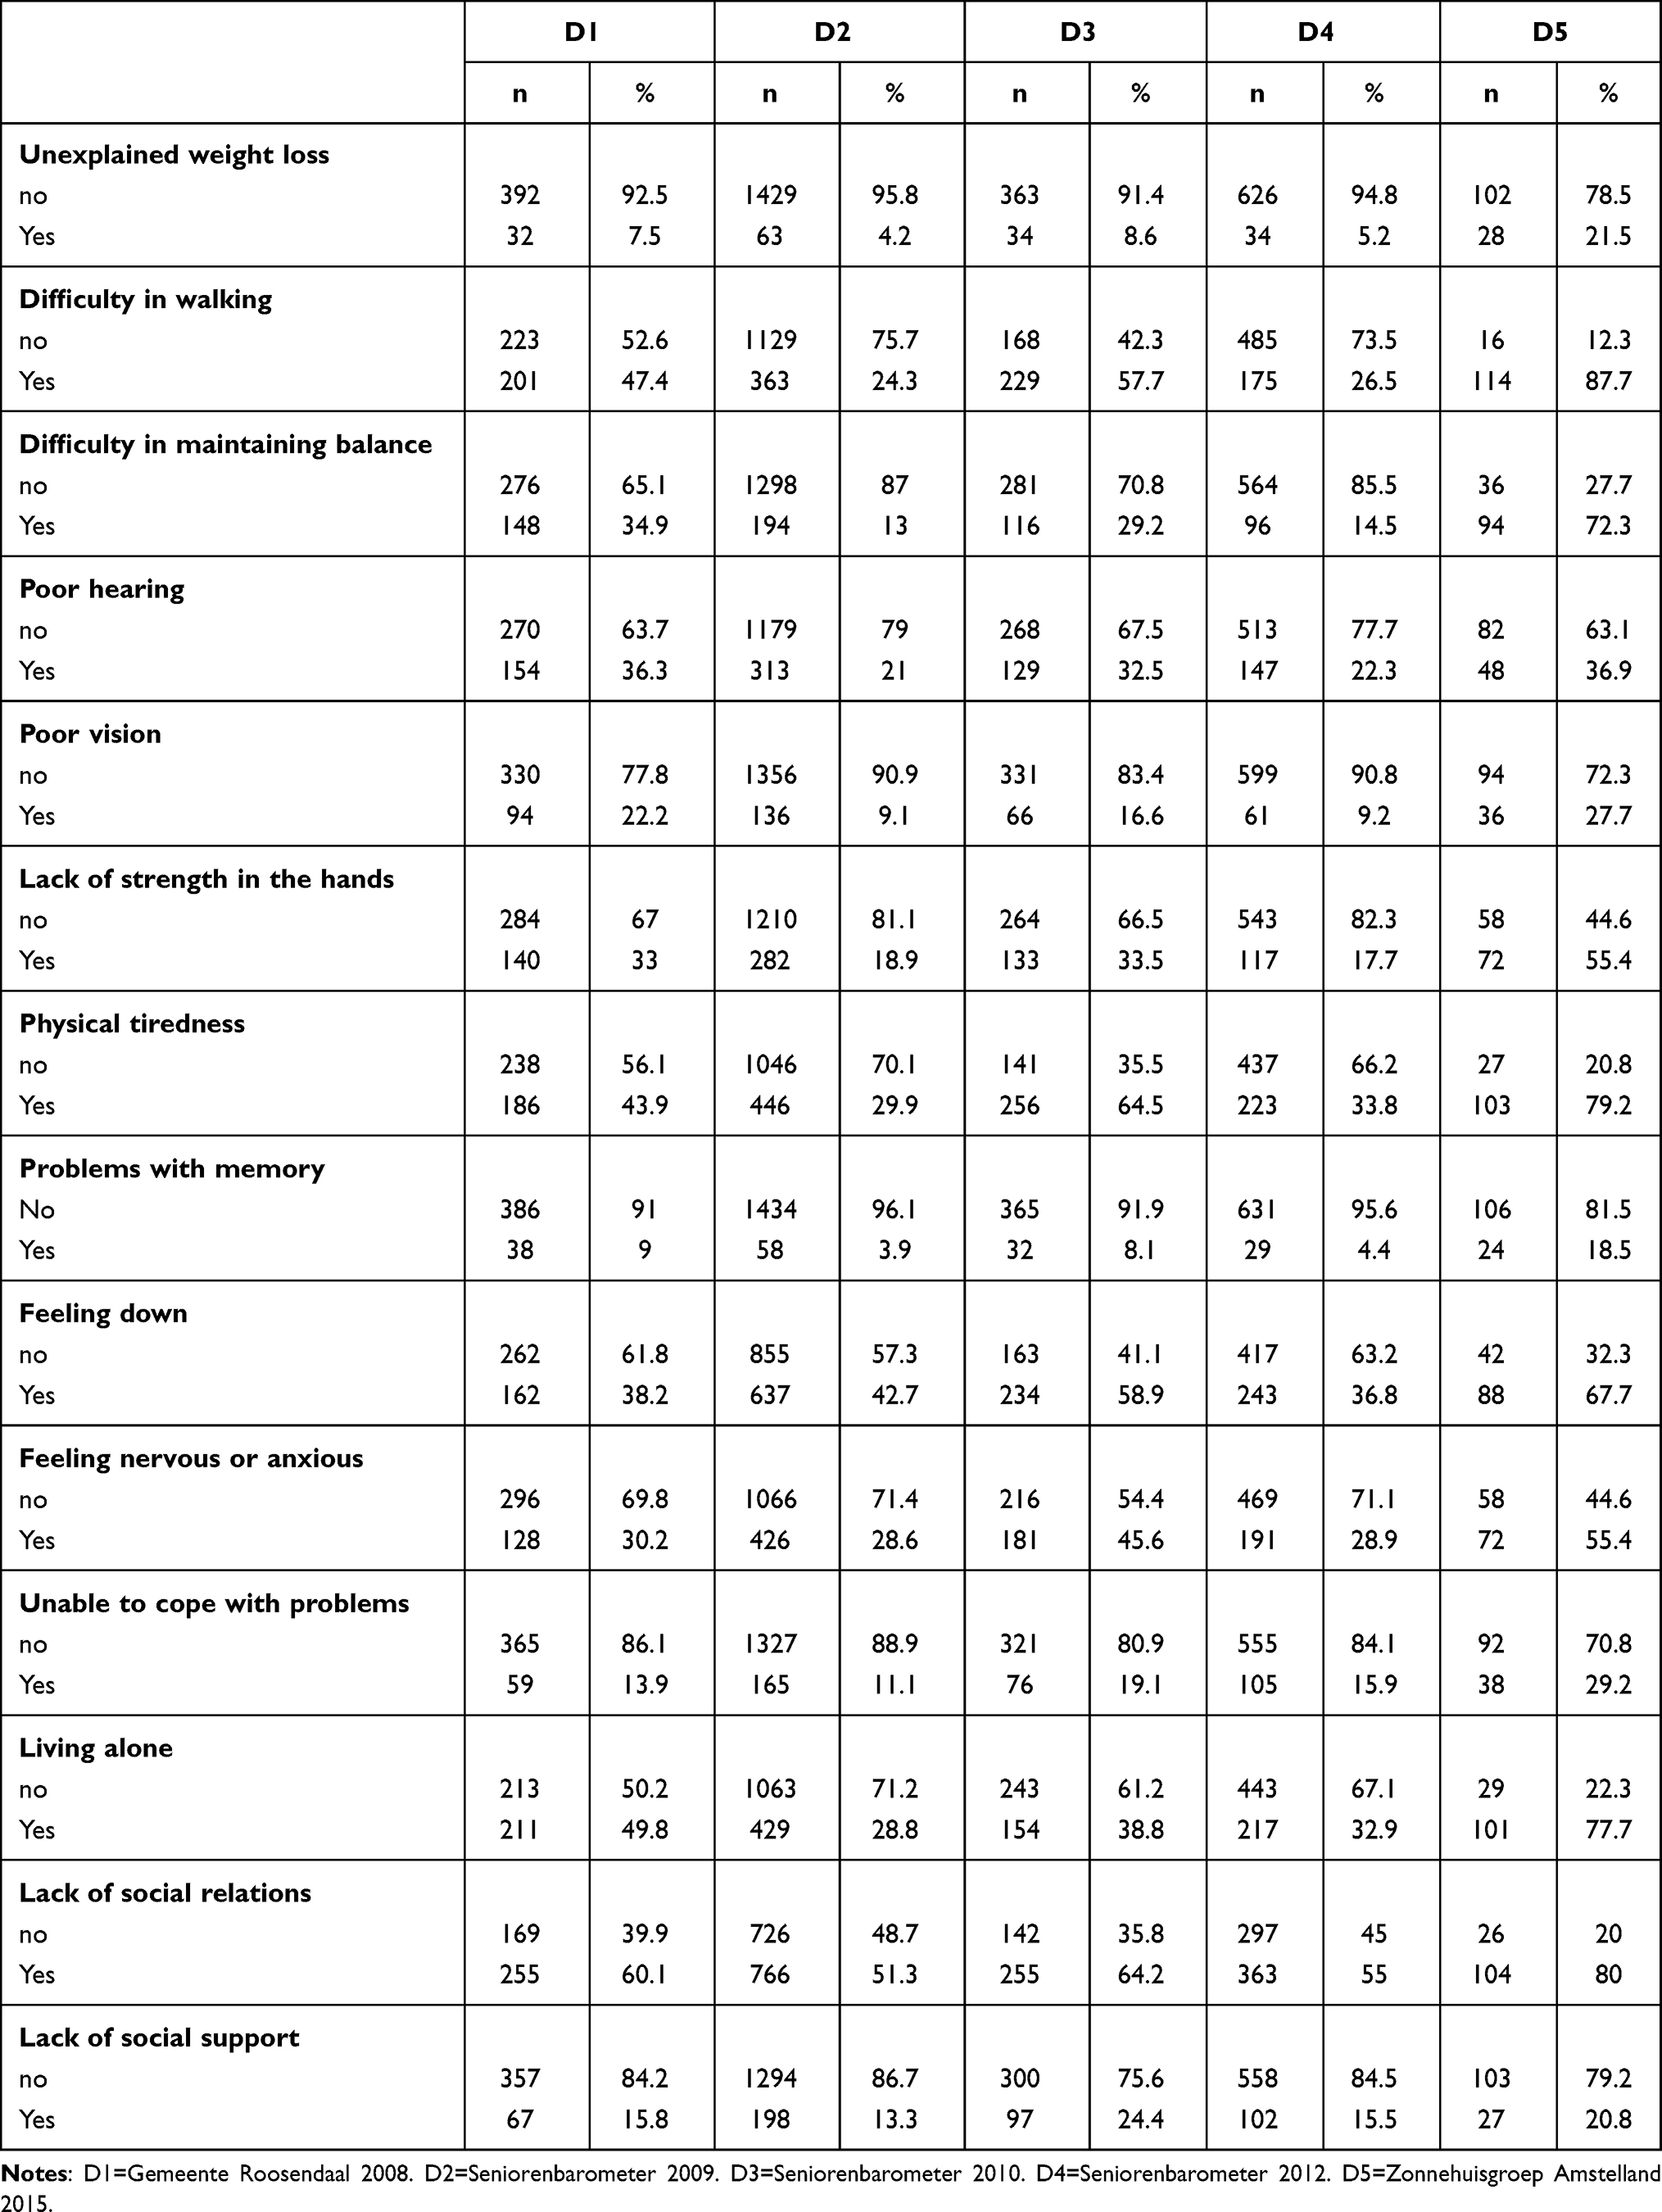 |
Table 1 Characteristics Predictors |
Modeling Techniques
We compared five statistical modeling techniques to predict the GARS score: general linear model (GLM), support vector machine (SVM), neural net (NN), recursive partitioning (RP), and random forest (RF). We here summarized the main characteristics of the evaluated modeling techniques, based on the work of several authors3,22–27 and also earlier publications of the first author.28,29
GLM
GLM includes linear regression we used in our study. Linear regression is often used in medical research and uses a linear function of the predictors. By minimizing the sum of the least squared error, the regression coefficients are estimated.1,3,23
SVM
SVM can perform classification tasks by constructing hyperplanes with a margin in a multidimensional space that separates cases from different classes. An SVM uses different kernels (radial, linear, and polynomial) to perform a non-linear classification or regression task. The hyperparameters for SVMs are the C-parameter (cost), which regulates the margin width, and the gamma parameter for the kernel calculation. SVMs are suited to analyze data with large numbers of predictor variables. For most researchers, an SVM is a “black box” because the underlying algorithm is complicated.25,30,31 The C-parameter was set at 1 and the gamma parameter was set at 0.067 in our study.
NN
NN uses interconnected processing units that are arranged in layers: an input layer, one or more hidden layers, and an output layer. The units in the layers are connected with varying connection strengths. Data are propagated from the input layer to the hidden layer(s) and from there to the output layer. The prediction, delivered from the output layer, is then compared to the actual value. The NN makes adjustments to the weights whenever the prediction is incorrect. The gradient descent algorithm is used to minimize the prediction error. This process is repeated many times and stops when the magnitude of the gradient is less than a certain threshold (eg 0.00005). The key parameters of a NN are the number of units in the layer, and the decay parameter that penalizes large weights to avoid overfitting.24,32 In our study, we set the number of hidden layers at 1, the number of units in the layer at 20, and the decay parameter at 0.
RP
RP uses recursive partitioning to split the training data into subsets with similar endpoint values. The process of partitioning starts by finding the best split based on the input variables. The reduction in an impurity index is used to find the best split. The split consists of two subgroups and each subgroup is split into two new subgroups until a stopping criterion for the impurity index is met. The key parameter for RP is the cp-parameter (cost complexity factor).22,29 In our study, we set the cp-value at 0.01.
RF
RF is a modeling technique based on many decision trees. For categorical output variables, RF outputs the class that is the mode among the classes from individual trees. For continuous output variables, RF outputs the value that is the mean of the values output from individual trees. A bootstrap sample from the original data set is used to construct each tree by RP as described earlier. For continuous output variables, the split rule is based on minimizing the mean squared error. For categorical outcomes, the Gini index is commonly used. At each split, a subset of candidate variables is tested for the split rule optimization. The number of trees and the number of candidate variables are the key parameters.22,30,33 In our study, we set the number of trees at 500 and the number of candidate variables at 4.
External Validation Procedure
We developed each model on one of the five data sets and then applied the resulting model to each of the four remaining data sets for validation. As a result, each model was developed five times and validated twenty times. For the performance of the models, we used the measures as mentioned in “Performance Measures” section below.
Performance Measures
For assessing the performance of the models, we calculated the correlation coefficient (r) and the root of the mean squared error (rmse). The correlation coefficient measures the association between the actual total disability score and the predicted total disability score. We considered a value of r >0.5 as indication for good association. The root of the mean squared error (rmse) measures the typical distance between the actual total disability score and the predicted total disability score. Values of the rmse towards zero indicate good fit of the model. For the calculation of r and rmse, we refer to (1) and (2). For assessing the calibration of the models, we used the calibration characteristics intercept (b0) and slope (b1). The calibration characteristics b0 and b1 were calculated using linear regression on the predicted total disability score with the actual total disability score as dependent variable. A value of b0 <0 indicates a systematic underestimation of the actual total disability score by the model, whereas a value of b0 >0 indicates systematic overestimation. A value of b1 <1 indicates that the predicted values are too low for low actual values and too high for high actual values, whereas b1 >1 indicates the opposite.34
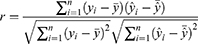
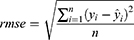
In (1) and (2), y is the actual value, ŷ is the predicted value,  is the mean of y,
  is the mean of ŷ, and n is the number of observations.
Analysis
For all analyses, we used R version 3.4.435 and in particular the libraries “e1071”, “nnet”, “rpart”, and “randomForest” for the calculation of the models.
Results
Table 1 shows the distribution of the predictor variables for the five data sets. For almost all predictors, the distribution within data set D5 differed considerably from that within the other data sets.
Table 2 shows the characteristics of our outcome variable (GARS score). Again, the characteristics of our outcome variable within data set D5 differed considerably from those within the other data sets.
 |
Table 2 Characteristics GARS Scores |
The performance of the five models for the five data sets, as measured by the calibration characteristics b0 and b1, the correlation coefficient r, and the rmse is shown in Table 3. For example, the GLM model, as developed on data set D3, showed for the validation data sets D1, D2, D4, and D5 the correlation coefficients 0.63, 0.64, 0.64, and 0.57, respectively. For the visualisation of the calibration of the models, we refer to Figures S1–S5.
 |
Table 3 Performance Characteristic Models |
Discussion
In this study, we aimed to compare the external validity of five modeling techniques in predicting the disability score for community-dwelling older people as measured with the Groningen Activity Restriction Scale (GARS) with fourteen dichotomized items of the B-part of the Tilburg Frailty Indicator (TFI). External validation addresses the performance of a model on different but plausibly related data sets, which still represent the underlying community-dwelling older people domain. This validation step is widely considered important and necessary before implementing a developed prediction model.36,37 However, only 5% of the developed prediction models were subject to external validation.38 Prediction models generally perform more poorly in external validation than in development.39 Our study supports this notion.
Principal Findings
The data sets used for this validation study had as common feature the inclusion of community-dwelling older people in the Netherlands who completed both the Tilburg Frailty Indicator (TFI) and the Groningen Activity Restriction Scale (GARS). The data sets D1, D2, D3, and D4 were comparable, but data set D5 showed deviating distributions of the predictor variables. Despite this, we included data set D5 in our study to show the effect of a non-comparable data set in external validation, see Table 1 and Table 2.
The GLM models showed r-values >0.5 for all validation sets. For all validations on data set D5, when the models were developed on the data sets D1 to D4, the GLM model required a lot of calibration and the rmse-values were >10. The GLM model developed on D5 required a lot of calibration when validated on data sets D1 to D4, see Table 3 and Figure S1. The SVM models showed r-values >0.5 for all validation sets, except for validation set D3 when the model was developed on data set D5 (r=0.43). All SVM models required calibration, especially for the validation on data set D5 when the models were developed on the data sets D1 to D4. In the latter case, all rmse-values were >10, see Table 3 and Figure S2.
The NN models showed a lot of r-values <0.5 for the validation sets. All NN models required a lot of calibration on the validation sets, especially when the development set was data set D5. For the development sets D1 to D4, the validation on data set D5 showed rmse-values >12, see Table 3 and Figure S3.
For both tree models (RP and RF), all r-values were >0.5, except for the validation of the models on D5 when the models were developed on D1 (r-values 0.40 and 0.47 respectively). Only few calibration was required for the validation on D5 when the models were developed on data sets D1 to D4. For the validation on D1 to D4 when the models were developed on data set D5, a lot of calibration was required. For the validation on data set D5 when the models were developed on the data sets D1 to D4, the rmse-values were >11 and >12 respectively, see Table 3, and Figures S4 and S5.
If we look at the performance of the models in relation to the size of the development data set, it is noticeable that the performance at D2 (n = 1492) and D4 (n = 660) is the best. The latter means that large data sets are required for the development of good prediction models.
We have chosen the most widely used techniques for predicting medical outcomes. We are aware that there were other possibilities (eg, XGBoost) as well. Based on the obtained results, the public health implication is that GLM and SVM models are very well suited for the prediction of the disability score for community-dwelling older people in the Netherlands. In a follow-up study, a calculator based on GLM or SVM models could be developed for healthcare providers for the prediction of the disability score of community-dwelling older people in the Netherlands. This would of course require a proper tuning of the SVM technique first (C and gamma parameters). As an example, see the link to a calculator created by the authors in a previous study:40 https://tjeerd.shinyapps.io/robbert/.
Comparison to Prior Work
To our knowledge, this is the first study that evaluated models in predicting the GARS with the TFI at external validation within the domain of community-dwelling older people in the Netherlands. A validation study with the same design as our study was conducted in 2016 for traumatic brain injury (TBI) patients using modern modeling techniques.12
Limitations
Several limitations of this study should be addressed. First, for the modeling techniques, we used the default settings from the R software35 instead of tuning the techniques for the best hyperparameters. This was a conscious choice because by tuning the hyper parameters, we would do too much “justice” to the development data. In a follow-up study, it would be interesting to tune the models a priori with the development data. Second, the TFI and the GARS are self-reported data, so both are subjectively assessed. However, the construct validity of the TFI has been determined in detail using objective measurements41 and also the construct validity of the GARS was showed.42 The use of another frailty measure instead of the TFI, such as the phenotype of frailty by Fried et al,43 would have led to different results. Third, the response rates in Gemeente Roosendaal 2008 and Zonnehuisgroep 2015 were low, 42% and 24.2%, respectively. With regard to the data from the Senioren Barometer, it should be noted that people could only participate if they had access to the Internet. As a consequence, we have to be careful about generalizing the findings of our study. Fourth, for the external validation of the models, we used data sets with subjects appearing in multiple data sets. Unfortunately, those subjects were not traceable because the data was collected anonymously. Fifth, the B-part of the TFI consists of fifteen items, but one item was left out because this item was not present in all data sets. This might have led to different results.
Conclusions
The performance of four models (GLM, SVM, RP, RF) on the development data sets was satisfactory. This was also the case for the validation data sets, except when these models were developed on the deviating data set. The NN models showed a much worse performance on the validation data sets than on the development data sets.
Data Sharing Statement
The data sets used and analyzed during the current study are available from the corresponding author upon reasonable request.
Ethics Approval and Consent to Participate
All procedures performed in studies involving human participants followed the ethical standards of the institute and/or national research committee and with the 1964 Helsinki declaration and its later amendments or comparable ethical standards. For the present study, medical ethics approval was not necessary because treatments or interventions were not offered or withheld from respondents. Moreover, the integrity of respondents was not encroached upon because of participating in this study, which is the main criterion in medical-ethical procedures in the Netherlands.44 Informed consent related to detailing the study and maintaining confidentiality was observed.
Acknowledgments
We would like to thank the municipality of Roosendaal and Zonnehuisgroep Amstelland for making their data available.
Funding
The authors received no specific funding for this work.
Disclosure
The authors declare that they have no competing interests.
References
1. Hastie T, Tibshirani R, Friedman J. The Elements of Statistical Learning: Data Mining, Inference, and Prediction. Springer Science & Business Media; 2009.
2. Harrell FE. Regression Modeling Strategies: With Applications to Linear Models, Logistic Regression, and Survival Analysis. Springer; 2001.
3. Steyerberg EW. Clinical Prediction Models. Springer; 2019.
4. Young NH, Andrews PJD. Developing a prognostic model for traumatic brain injury. A missed opportunity? PLoS Med. 2008;5(8):e168. doi:10.1371/journal.pmed.0050168
5. Sewak M, Vaidya P, Chan CC, Duan ZH. SVM approach to breast cancer classification. In:
6. Biganzoli E, Boracchi P, Mariani L, Marubini E. Feed forward neural networks for the analysis of censored survival data: a partial logistic regression approach. Stat Med. 1998;17(10):1169–1186. doi:10.1002/(SICI)1097-0258(19980530)17:10<1169::AID-SIM796>3.0.CO;2-D
7. Van der Ploeg T, Gobbens RJ, Salem BE. Bayesian techniques in predicting frailty among community-dwelling older adults in the Netherlands. Arch Gerontol Geriatr. 2022;105:104836. doi:10.1016/j.archger.2022.104836
8. Xu W, Zhang J, Zhang Q, Wei X Risk prediction of type II diabetes based on random forest model. In:
9. Maroco J, Silva D, Rodrigues A, Guerreiro M, Santana I, de Mendonca A. Data mining methods in the prediction of Dementia: a real-data comparison of the accuracy, sensitivity and specificity of linear discriminant analysis, logistic regression, neural networks, support vector machines, classification trees and random forests. BMC Res Notes. 2011;4(1):1–14. doi:10.1186/1756-0500-4-299
10. Terrin N, Schmid CH, Griffith JL, D’Agostino RB Sr, Selker HP. External validity of predictive models: a comparison of logistic regression, classification trees, and neural networks. J Clin Epidemiol. 2003;56(8):721–729. doi:10.1016/S0895-4356(03)00120-3
11. Ecke TH, Hallmann S, Koch S, et al. External validation of an artificial neural network and two nomograms for prostate cancer detection. Internat Schol Res Notices. 2012;2012:1.
12. Van der Ploeg T, Nieboer D, Steyerberg EW. Modern modeling techniques had limited external validity in predicting mortality from traumatic brain injury. J Clin Epidemiol. 2016;78:83–89. doi:10.1016/j.jclinepi.2016.03.002
13. Konig IR, Malley J, Weimar C, Diener HC, Ziegler A. Practical experiences on the necessity of external validation. Statist Med. 2007;26(30):5499–5511. doi:10.1002/sim.3069
14. Debray TP, Vergouwe Y, Koffijberg H, Nieboer D, Steyerberg EW, Moons KG. A new framework to enhance the interpretation of external validation studies of clinical prediction models. J Clin Epidemiol. 2015;68(3):279–289. doi:10.1016/j.jclinepi.2014.06.018
15. Steyerberg EW, Vickers AJ, Cook NR, et al. Assessing the performance of prediction models: a framework for some traditional and novel measures. Epidemiology. 2010;21(1):128. doi:10.1097/EDE.0b013e3181c30fb2
16. Austin PC, Steyerberg EW. Predictive accuracy of risk factors and markers: a simulation study of the effect of novel markers on different performance measures for logistic regression models. Stat Med. 2013;32(4):661–672. doi:10.1002/sim.5598
17. Vergouwe Y, Moons KG, Steyerberg EW. External validity of risk models: use of benchmark values to disentangle a case-mix effect from incorrect coefficients. Am J Epidemiol. 2010;172(8):971–980. doi:10.1093/aje/kwq223
18. Kempen GIJM, Miedema I, Ormel J, Molenaar W. Groningen activity restriction scale. Soc Sci Med. 1993;1993:1.
19. Gobbens RJ, Van assen M. The prediction of quality of life by physical, psychological and social components of frailty in community-dwelling older people. Quality of Life Res. 2014;23(8):2289–2300. doi:10.1007/s11136-014-0672-1
20. AARP. Aging readiness and competitiveness; 2018. Available from: https://www.aarpinternational.org/initiatives/aging-readiness-competitiveness-arc/netherlands.
21. Bally EL, Ye L, Van Grieken A, et al. Factors associated with falls among hospitalized and community-dwelling older adults: the APPCARE study. Front Public Health. 2023;2023:11.
22. Breiman L, Friedman J, Olshen R, Stone C. Classification and Regression Trees. Whole Wadsworth; 1984:368.
23. Harrell FE Jr. Regression Modeling Strategies: With Applications to Linear Models, Logistic and Ordinal Regression, and Survival Analysis. Springer; 2015.
24. Tufféry S. Data Mining and Statistics for Decision Making. John Wiley & Sons; 2011.
25. Cortes C, Vapnik V. Support-vector networks. Mach Learn. 1995;20(3):273–297. doi:10.1007/BF00994018
26. Tsamardinos I, Aliferis CF. Towards Principled Feature Selection: Relevancy, Filters and Wrappers. AISTATS; 2003.
27. Aliferis CF, Tsamardinos I, Statnikov AR, Brown LE. Causal Explorer: A Causal Probabilistic Network Learning Toolkit for Biomedical Discovery. Vol. 3. METMBS; 2003:371–376.
28. Van der Ploeg T, Steyerberg EW. Feature selection and validated predictive performance in the domain of Legionella pneumophila: a comparative study. BMC Res Notes. 2016;9(1):1–7. doi:10.1186/s13104-016-1945-2
29. Van der Ploeg T, Gobbens R, et al. A comparison of different modeling techniques in predicting mortality with the Tilburg frailty indicator: longitudinal study. JMIR Med Inform. 2022;10(3):e31480. doi:10.2196/31480
30. Gareth J, Daniela W, Trevor H, Robert T. An Introduction to Statistical Learning: With Applications in R. Spinger; 2013.
31. Boser BE, Guyon IM, Vapnik VN A training algorithm for optimal margin classifiers. In:
32. Ripley BD. Neural networks and related methods for classification. J Royal Stat Soc. 1994;56(3):409–437.
33. Cutler A, Cutler DR, Stevens JR. Random forests. Ensemble Mach Learn. 2012;2012:157–175.
34. Van Calster B, McLernon DJ, Van Smeden M, Wynants L, Steyerberg EW. Calibration: the Achilles heel of predictive analytics. BMC Med. 2019;17(1):1–7. doi:10.1186/s12916-019-1466-7
35. Team RC. R: A Language and Environment for Statistical Computing [Software]. Vienna: R Foundation for Statistical Computing; 2019.
36. Bleeker SE, Moll HA, Steyerberg EW, et al. External validation is necessary in prediction research: a clinical example. J Clin Epidemiol. 2003;56(9):826–832. doi:10.1016/S0895-4356(03)00207-5
37. Justice AC, Covinsky KE, Berlin JA. Assessing the generalizability of prognostic information. Ann Intern Med. 1999;130(6):515–524. doi:10.7326/0003-4819-130-6-199903160-00016
38. Ramspek CL, Jager KJ, Dekker FW, Zoccali C, van Diepen M. External validation of prognostic models: what, why, how, when and where? Clin Kidney J. 2021;14(1):49–58. doi:10.1093/ckj/sfaa188
39. Siontis GC, Tzoulaki I, Castaldi PJ, Ioannidis JP. External validation of new risk prediction models is infrequent and reveals worse prognostic discrimination. J Clin Epidemiol. 2015;68(1):25–34. doi:10.1016/j.jclinepi.2014.09.007
40. Gobbens RJ, Van der Ploeg T. Frailty at Risk Scale (FARS): development and application. Eur J Ageing. 2022;19(2):301–308. doi:10.1007/s10433-021-00628-4
41. Gobbens RJ, Van Assen MA, Luijkx KG, Wijnen-Sponselee MT, Schols JM. The Tilburg frailty indicator: psychometric properties. J Am Med Dir Assoc. 2010;11(5):344–355. doi:10.1016/j.jamda.2009.11.003
42. Suurmeijer T, Doeglas DM, Moum T, et al. The Groningen Activity Restriction Scale for measuring disability: its utility in international comparisons. Am J Public Health. 1994;84(8):1270–1273. doi:10.2105/AJPH.84.8.1270
43. Fried LP, Tangen CM, Walston J, et al. Frailty in older adults: evidence for a phenotype. J Gerontol a Biol Sci Med Sci. 2001;56(3):M146–M157. doi:10.1093/gerona/56.3.M146
44. CCMO. Research involving human subjects; 2016. Available from: https://english.ccmo.nl/investigators/legal-framework-for-medical-scientific-research/your-research-is-it-subject-to-the-wmo-or-not.
 © 2023 The Author(s). This work is published and licensed by Dove Medical Press Limited. The
full terms of this license are available at https://www.dovepress.com/terms
and incorporate the Creative Commons Attribution
- Non Commercial (unported, 3.0) License.
By accessing the work you hereby accept the Terms. Non-commercial uses of the work are permitted
without any further permission from Dove Medical Press Limited, provided the work is properly
attributed. For permission for commercial use of this work, please see paragraphs 4.2 and 5 of our Terms.
© 2023 The Author(s). This work is published and licensed by Dove Medical Press Limited. The
full terms of this license are available at https://www.dovepress.com/terms
and incorporate the Creative Commons Attribution
- Non Commercial (unported, 3.0) License.
By accessing the work you hereby accept the Terms. Non-commercial uses of the work are permitted
without any further permission from Dove Medical Press Limited, provided the work is properly
attributed. For permission for commercial use of this work, please see paragraphs 4.2 and 5 of our Terms.
Recommended articles
Calibrated and Explainable CIN2+ Risk Stratification Using Routine Clinical Data: Development and External Validation
Wu Y, Wang A
International Journal of Women's Health 2026, 18:614964
Published Date: 8 June 2026