Back to Journals » Cancer Management and Research » Volume 13
C8B in Complement and Coagulation Cascades Signaling Pathway is a predictor for Survival in HBV-Related Hepatocellular Carcinoma Patients
Authors Zhang Y, Chen X, Cao Y, Yang Z ![]()
Received 20 January 2021
Accepted for publication 25 March 2021
Published 22 April 2021 Volume 2021:13 Pages 3503—3515
DOI https://doi.org/10.2147/CMAR.S302917
Checked for plagiarism Yes
Review by Single anonymous peer review
Peer reviewer comments 2
Editor who approved publication: Dr Eileen O'Reilly
Yuan Zhang,1 Xiaorong Chen,1 Yajuan Cao,2 Zongguo Yang1
1Department of Integrative Medicine, Shanghai Public Health Clinical Center, Fudan University, Shanghai, 201508, People’s Republic of China; 2Clinical Translation Research Center, Shanghai Pulmonary Hospital, Tongji University School of Medicine, Shanghai, 200433, People’s Republic of China
Correspondence: Zongguo Yang
Department of Integrative Medicine, Shanghai Public Health Clinical Center, Fudan University, 2901 Caolang Road, Shanghai, 201508, People’s Republic of China
Email [email protected]
Yajuan Cao
Clinical Translation Research Center, Shanghai Pulmonary Hospital, Tongji University School of Medicine, Shanghai, 200433, People’s Republic of China
Email [email protected]
Objective: The role of the complement and coagulation cascades signaling pathway in the pathogenesis of cancers remains uncertain. This study aimed to investigate the associations between enriched differentially expressed genes (DEGs) in this pathway and hepatitis B virus (HBV)-related hepatocellular carcinoma (HCC) patients.
Materials and Methods: Clinical and gene expression data of the Gene Expression Omnibus (GEO) series profile GSE14520 were downloaded. The “Limma” package was used to screen the DEGs and the “clusterProfiler” package was used to identify the complement and coagulation cascades pathway and enriched significant genes. Cox regression analysis, the Kaplan–Meier method, and the nomogram model were used to address the correlations between significantly enriched DEGs in the complement and coagulation cascades pathway and HCC survival.
Results: A total of 220 HBV-related HCC patients were enrolled in this study. The complement and coagulation cascades pathway was significantly enriched by 37 DEGs (p-value < 0.05 and adjusted p-value < 0.05). Complement 8 beta chain (C8B) expression levels had protective effects on overall survival (OS) and recurrence-free survival (RFS) in HBV-related HCC patients. High levels of C8B contributed to favorable OS and RFS in this population (both p < 0.01), even after adjustment of clinicopathological characteristics including tumor node metastasis (TNM) staging, Barcelona Clinic liver cancer (BCLC) staging, gender, and fibrinogen beta chain (FGB) expression (all p < 0.05).
Conclusion: C8B in the complement and coagulation cascades signaling pathway serves as a predictive candidate for survival in HBV-related HCC patients.
Keywords: C8B, FGB, complement and coagulation cascades, hepatocellular carcinoma, survival
Introduction
The International Agency for Research on Cancer (IARC) report released in 2020 indicated that liver cancer is the third leading cause of cancer death.1 Hepatitis B virus (HBV)-related hepatocellular carcinoma (HCC) is the most frequent form of liver cancer and the major cause of cancer-related deaths worldwide.2–4 During the past decades, comprehensive therapeutic approaches including immunotherapy and novel targeting agents have prolonged the survival of HCC patients.5,6 Even though antiviral treatment for HBV, regular monitoring, and early screening for HCC have been proven beneficial for alleviating the burden of this disease,2,4,7 the incidence of liver cancers has continued to increase and will rise over the next two decades, and the mortality related to liver cancer has increased by more than 2% annually since 2007.8,9
Recently, public data and bioinformatic analysis methods have provided us with invaluable resources to outline the underlying mechanisms and pathogenesis of HCC development.10–12 Complement and coagulation cascades signaling, interacting at multiple levels in thrombosis and inflammatory diseases,13 was one of the most frequently enriched functional pathways in the bioinformatic studies.14,15 In soft tissue sarcoma patients, differentially expressed genes (DEGs) in complement and coagulation pathways are correlated with chemotherapy resistance and survival.16 Downregulation of alpha-2-macroglobulin (A2M), coagulation factor XIII A chain (F13A1), and G protein subunit gamma 11 (GNG11) in the complement and coagulation cascades pathway might contribute to the progression of bladder cancer.17 Dysregulation of the complement and coagulation pathway is usually triggered by dysfunctions of the innate immune system,18,19 which is mainly composed of complement, contact/coagulation, and fibrinolytic systems. Activation of these systems subsequently induces activation of endothelial cells, leukocytes, and platelets, which ultimately lead to thrombosis and inflammation reactions.19,20 Emerging evidence has indicated that thrombo-inflammation accounts for cancer progression.21–23 Hence, we conducted a bioinformatics analysis to address the potential candidates correlated with survival of HBV-related HCC patients, to draw a diagram for understanding the roles of the complement and coagulation cascades signaling pathway in the development of HCC.
Materials and Methods
Ethics Statement
This study is a secondary analysis based on the public database. As presented by Roessler et al,24,25 all the HBV-related subjects received radical resection therapy between 2002 and 2003 in Zhongshan Hospital, Fudan University. Written informed consent was provided by all participants, and reviewed and approved by the Institutional Review Board of the participating institutes.24,25
Patients
All clinical and gene expression data of HBV-related HCC patients are publicly available in the Gene Expression Omnibus (GEO) Repositories (https://www.ncbi.nlm.nih.gov/geo/, accession number: GSE14520). In this series, 247 HBV-related HCC patients were diagnosed by two independent pathologists who had detailed information on manifestations and pathological features. Outcomes including overall survival (OS) and recurrence-free survival (RFS), as well as other clinicopathological characteristics, were available for 242 subjects.24 Among these 242 cases, 22 had no gene expression data. Thus, 220 HBV-related HCC patients were finally recruited to this study. Clinicopathological data including age, gender, HBV status, alanine aminotransferase, cirrhosis status, main tumor size, alpha-fetoprotein (AFP), Barcelona Clinic liver cancer (BCLC) staging, Cancer of the Liver Italian Program (CLIP) staging, and Tumor Node Metastasis (TNM) staging were obtained.
Microarray Processing and DEGs Identification
The microarray processing approaches were presented in detail by Roessler et al.24 All the tumor and nontumor samples with good RNA quality were profiled separately using a single channel array platform. Affymetrix human genome U133A 2.0 array and Affymetrix HT human genome U133A array platforms were used to determine the fluorescent intensities of samples. Relative log expression (RLE) and normalized unscaled standard errors (NUSE) tests by the “affyPLM” package in the R program were used for quality assessment of each sample.26 The Robust Multi-array Average (RMA) method and global median centering were used to normalize the raw gene expression data.24 Missing gene expression data were imputed with the k-Nearest Neighbor (KNN) method by impute index in the R program.27 The mean gene expression was calculated for genes with more than one probe. DEGs between tumor and nontumor samples, with the criterion of a |log2FC| > 1.0 and adjusted p-value < 0.05, were addressed by the “Limma” package in the R program.26,28
Gene Set Enrichment Analysis (GSEA)
The R package “clusterProfiler”29 was used to address complement and coagulation cascades signaling pathway enrichment of DEGs between tumor and nontumor tissues in HBV-related HCC patients from GSE14520. Significant genes enriched in the complement and coagulation cascades pathway were transferred to gene symbol by “clusterProfiler”, “org.Hs.eg.db”, and “AnnotationDbi” packages in the R program.29
Outcome Definitions
The survival data of OS and RFS were available in this study. OS was defined as the period from radical resection to death from any causes. RFS was defined as new lesions found in the abdominal computed tomography (CT)/magnetic resonance imaging (MRI) examinations and an abnormal AFP value greater than 300 ng/mL; subjects with a high pretreatment AFP value that had not decreased to normal or had increased again after returning to normal were included.24,25
Nomogram Model Establishment
Variables significantly correlated with OS and/or RFS in HBV-related HCC patients in the multivariate Cox proportional hazards model were included in the risk prediction model by nomogram with the “rms” package in the R program. According to the Cox model, the “survival” package in the R program is used to calculate the cumulative risk of death. The “survcomp” package was used to calculate the concordance index and its 95% confidence intervals (CIs). The bootstrap method was used for repeated sampling for internal verification of the model. Calibration curved addressed by the “rms” package were presented for evaluating the performance of the nomogram.
Statistical Analysis
Mean ± standard deviation (SD) was used for the statistical description for normally distributed continuous data, and frequency with percentage was used for the description of the enumeration data. Parameters associated with the outcomes were assessed by univariate analysis and multivariate analysis using Cox regression. Only covariates significantly associated with outcomes according to the univariate analysis (two-sided p-value < 0.10) are shown and included in the multivariate model. The Kaplan–Meier analysis with log rank test was used to compare survival between different groups. Results were reported as hazard ratios (HR) with a 95% CI. Stata software version 16.0 (Stata Corp LLC, Texas, USA) was used for other statistics; p < 0.05 (two-sided) was considered significant for all tests.
Results
Patient Characteristics
As summarized in Table 1, of 220 HBV-related HCC patients, 190 (86.4%) cases were male, and the average age was 50.8 ± 10.6 years. Of these 220 subjects, 155 (70.5%) were HBV chronic carriers, less than half (91/220, 41.4%) had alanine aminotransferase > 50 U/L, and more than 90% had HBV-induced cirrhosis. There were 99 (45.6%) cases with an AFP > 300 ng/mL. The distribution of cancer stages, that is, BCLC staging, TNM staging, and CLIP staging, are also presented in Table 1.
 |
Table 1 Baseline Characteristics of HCC Patients Included in This Study |
Complement and Coagulation Cascades Signaling Pathway Enrichment
In the GSE14520 dataset, the complement and coagulation cascades signaling pathway was significantly enriched with DEGs between tumor and nontumor samples in HBV-related HCC patients (p-value < 0.05 and adjusted p-value < 0.05; Figure 1A). In total 37 DEGs, PROS1, FGA, C8A, C8B, C6, FGG, C4BPA, PLG, A2M, F9, SERPINC1, MASP2, C9, CPB2, MBL2, SERPINF2, PROC, C1S, C7, CFI, KLKB1, F12, FGB, F7, CFB, C5, SERPINA5, KNG1, SERPING1, VTN, F2, CLU, C1QB, C1R, CFH, C3, and F11, were significantly enriched in the complement and coagulation cascades signaling pathway (p < 0.0001 or p < 0.05; Figure 1B).
 |
Figure 1 In GSE14520 dataset, the complement and coagulation cascades signaling pathway was significantly enriched with differentially expressed genes (DEGs) in HBV-related HCC patients (p-value < 0.05 and adjusted p-value < 0.05, (A)); in total 37 DEGs were significantly enriched in the complement and coagulation cascades signaling pathway (p < 0.0001 or p < 0.05, (B). *p < 0.05, ****p < 0.0001. |
Parameters Correlated with OS in HCC Patients
When the 37 significant genes in the complement and coagulation cascades pathway andthe clinicopathological characteristics (age, gender, HBV status, cirrhosis, main tumor size, AFP level, and cancer stages) were included in the univariate Cox regression model, main tumor size, cirrhosis, BCLC staging, TNM staging, CLIP staging, AFP, C8B, PLG, SERPINC1, MASP2, CPB2, KLKB1, F12, CFB, KNG1, SERPING1, VTN, F2, and F11 were correlated with OS in HCC patients (all p < 0.10; Table 2). After adjustment in the multivariate Cox model, high levels of C8B in tumor tissues contributed to favorable OS in HCC patients compared to low levels of C8B (HR = 0.51, 95% CI = 0.29–0.92, p = 0.024; Table 2). The Kaplan–Meier plot indicated that HCC patients with high C8B in tumors had better OS than those with low C8B (p = 0.0013; Figure 2A), and similar results were obtained after adjusting TNM staging (p = 0.0108; Figure 2B).
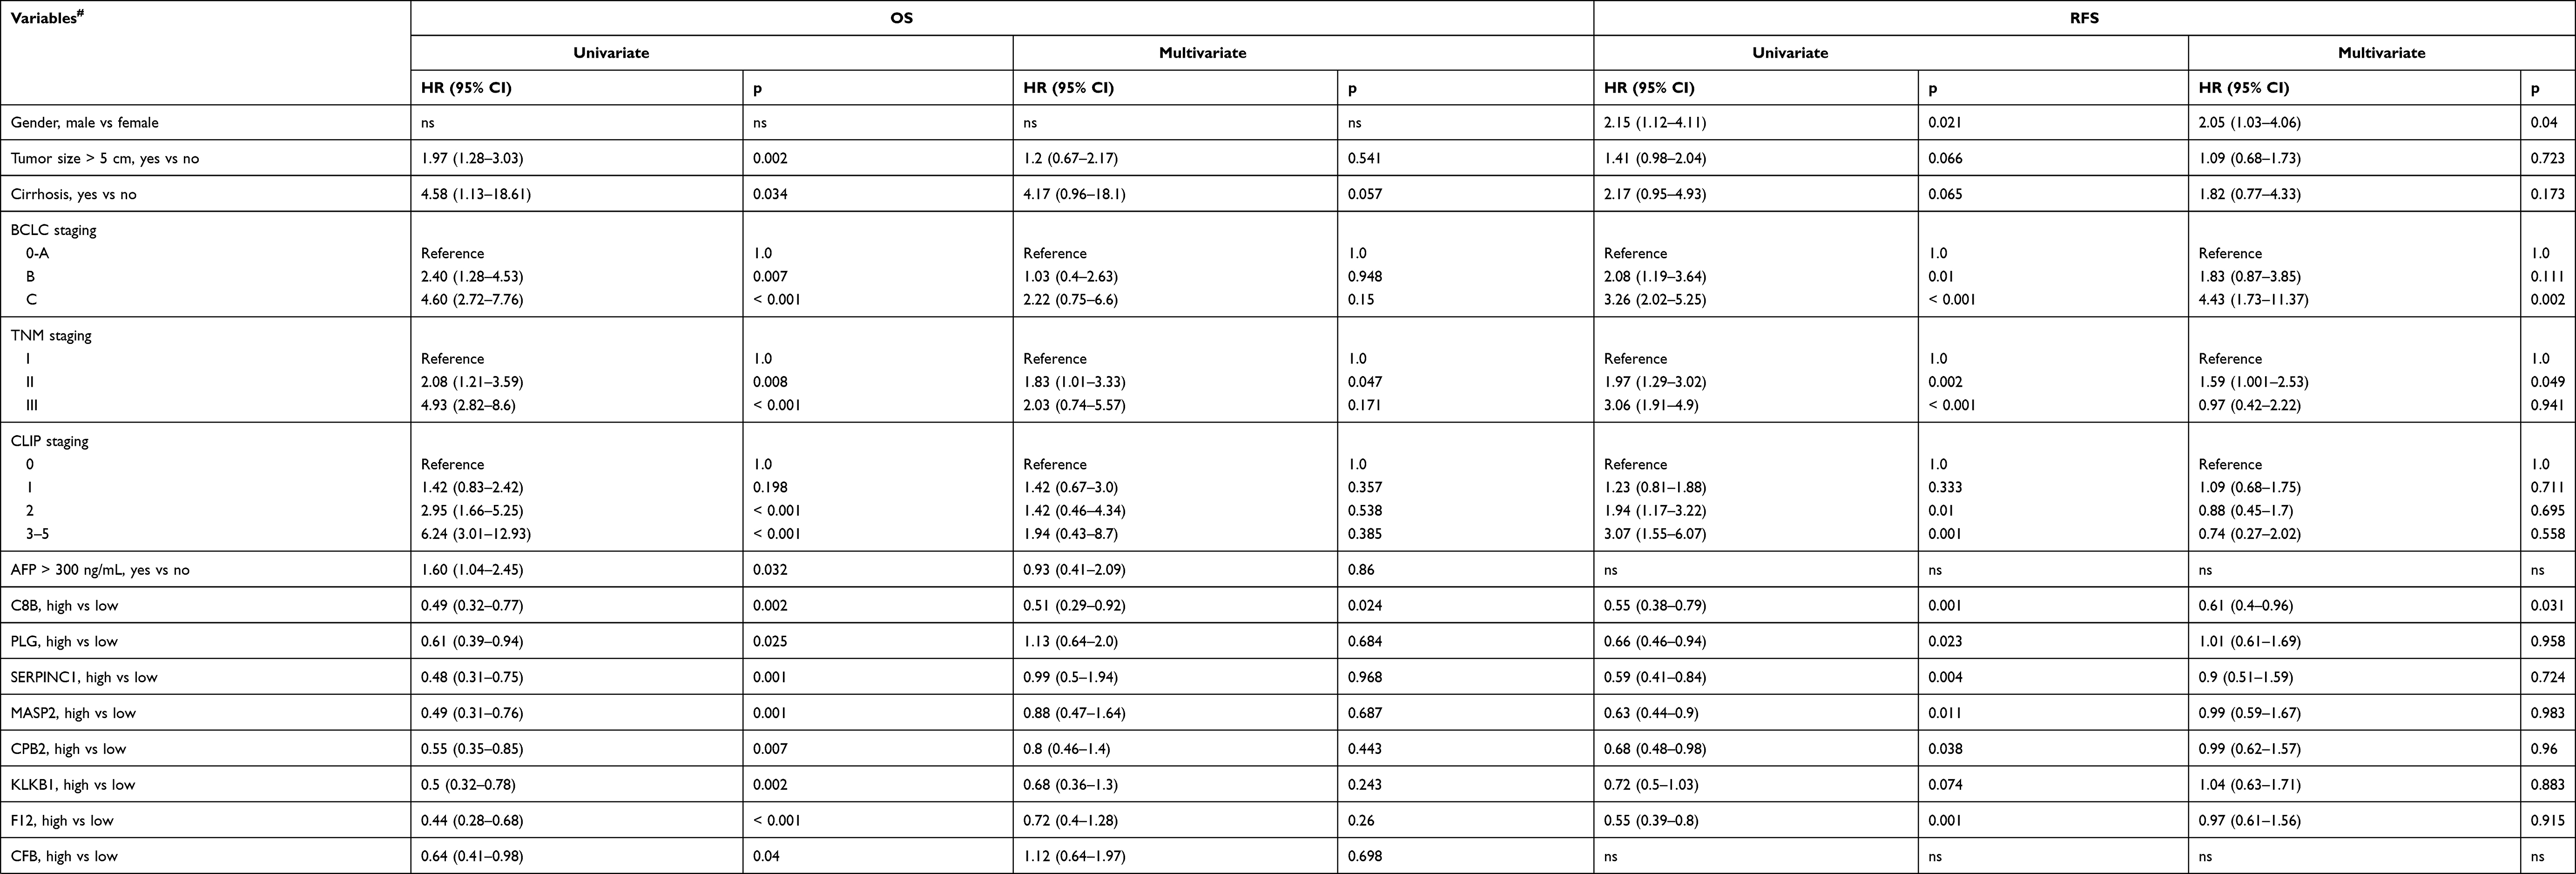 |
Table 2 Univariate and Multivariate Cox Regression Models for Screening Parameters Correlated with OS and RFS in HCC Patients |
 |
Figure 2 Kaplan–Meier method indicated that HBV-related HCC patients with high levels of C8B in tumor tissues had significantly better overall survival (OS) than those with low C8B (p = 0.0013, (A)); After adjustment of TNM staging, C8B overexpression in tumor tissues also contributed to favorable OS in HBV-related HCC patients compared to C8B downregulation (p = 0.0108, (B)). |
As summarized in Figure S1, C8B mRNA was significantly downregulated in tumor samples compared to that in non-tumor samples in four GEO series (all p < 0.05; Figure S1A). In line with the results in GSE14520, high C8B levels contributed to significantly favorable OS in HCC patients both in the Gene Expression Profiling Interactive Analysis (GEPIA) database30 and Kaplan–Meier plotter database31,32 (both p < 0.05; Figure S2).
Parameters Correlated with RFS in HCC Patients
When the parameters mentioned above were included in the univariate Cox regression model for assessing predictors of RFS in HCC patients, gender, main tumor size, cirrhosis, BCLC staging, TNM staging, CLIP staging, C8B, PLG, SERPINC1, MASP2, CPB2, KLKB1, F12, KNG1, VTN, F11, FGB, and SERPINA5 were potential biomarkers for RFS (all p < 0.10; Table 2). When these candidates were included in the multivariate Cox model, C8B, FGB, together with gender, BCLC staging, and TNM staging showed significance for predicting RFS in HCC patients (all p < 0.05; Table 2). The Kaplan–Meier method revealed that high levels of C8B in tumor tissues were significantly associated with favorable RFS in HBV-related HCC patients (p = 0.0012; Figure 3A). In addition, high levels of C8B were significantly correlated with better RFS in HBV-related HCC patients, after adjusting BCLC staging (p = 0.0081; Figure 3B), TNM staging (p = 0.0067; Figure 3C), gender (p = 0.0013; Figure 3D), and FGB expression (p = 0.0006; Figure 3E). Even when adjusted by BCLC, TNM, gender, and FGB levels, C8B upregulation also contributed to favorable RFS in this population (p = 0.0185; Figure 3F). Similarly, HCC patients with high C8B levels had significantly better RFS both in GEPIA and Kaplan–Meier plotter databases (p = 0.034 and p = 0.028, respectively; Figures S3A and S3B).
 |
Figure 3 Kapan–Meier plot revealed that high levels of C8B in tumor tissues were significantly associated with favorable recurrence-free survival (RFS) in HBV-related HCC patients (p = 0.0012, (A); high levels of C8B were significantly correlated with better RFS in HBV-related HCC patients, after adjusting BCLC staging (p = 0.0081, (B), TNM staging (p = 0.0067, (C), gender (p = 0.0013, (D), and FGB expression (p = 0.0006, (E); even adjusted by BCLC, TNM, gender, and FGB levels, C8B upregulation also contributed to favorable RFS in this population (p = 0.0185, (F)). |
On the other side, FGB was identified as a risk factor by univariate and multivariate Cox regression analysis (HR = 1.98, 95% CI = 1.32–2.97, p = 0.001; Table 2). The Kaplan–Meier method showed that high FGB expression was associated with worse RFS in HBV-related HCC patients (p = 0.0188; Figure 4A). High levels of FGB were significantly correlated with unfavorable RFS in HBV-related HCC patients, after adjusting BCLC staging (p = 0056; Figure 4B), TNM staging (p = 0.0192; Figure 4C), gender (p = 0.0219; Figure 4D), and C8B expression (p = 0.0062; Figure 4E). Even when adjusted by BCLC, TNM, gender, and C8B levels, FGB upregulation also contributed to unfavorable RFS in this population (p = 0.0136; Figure 4F). Consistent with our results, FGB was downregulated in HCC tumors in five GEO series (all p < 0.05; Figure S1B). Conversely, FGB upregulation might account for favorable RFS in HCC patients both in GEPIA and Kaplan–Meier plotter databases (p = 0.0011 and p = 0.049, respectively; Figures S3C and S3D). Considering the results above, the associations between FGB and HCC recurrence are still controversial.
 |
Figure 4 Kapan–Meier plot showed that high FGB expression was associated with worse RFS in HBV-related HCC patients (p = 0.0188, (A)); high levels of FGB were significantly correlated with unfavorable RFS in HBV-related HCC patients, after adjusting BCLC staging (p = 0056, (B), TNM staging (p = 0.0192, (C), gender (p = 0.0219, (D), and C8B expression (p = 0.0062, (E); even adjusted by BCLC, TNM, gender, and C8B levels, FGB upregulation also contributed to unfavorable RFS in this population (p = 0.0136, (F)). |
Nomogram Model for Evaluating Candidates for OS in HCC Patients
Nomogram risk models for OS were established according to independent parameters screened by multivariate Cox regression analysis (Figure 5). According to the upper scale of each independent parameter, the corresponding score could be determined and the total score was calculated by adding the scores of each parameter. Projecting downward from the total score, the corresponding mortality or recurrence risk prediction probability value could be obtained.
 |
Figure 5 Screened by Cox regression model, TNM staging and C8B were included in competing risk model with nomogram for OS from HBV-related HCC patients in GSE14520 (A); the 1-year (B), 3-year (C), and 5-year (D) calibration curves for internal verification of this nomogram with bootstrapping displayed good consistency between actual OS and predicted OS.**p < 0.01, ***p < 0.001. |
In the nomogram for OS in HCC patients, for example, in a patient with TNM stage III and low C8B expression, his/her total score was 1.24, and his/her 1-year, 3-year, and 5-year mortality risk was 0.308, 0.694, and 0.825, respectively (Figure 5A). The concordance index (C-index) of this model was 0.73 (95% CI = 0.66–0.79). One-year, 3-year, and 5-year calibration curves for internal verification of this nomogram with bootstrapping are shown in Figures 5B–D, respectively. The 1-year, 3-year, and 5-year calibration curves displayed good consistency between actual OS and predicted OS (Figures 5B–D).
Discussion
The constituent of innate immunity, complement, is present in the tumor microenvironment. The functions of complement could be anti-tumoral and pro-tumoral depending on the cancer type, even for the same type of cancer.33,34 As a member of the complement gene family, complement C8 consists of three subunits encoded by individual genes: C8A, C8B, and C8G. C8 serves as a main component of the membrane attack complex.35,36 Complement deficiency represents about 1–6% of all primary immunodeficiencies, but in some communities this proportion may be as high as 10%.37 Notably, C8 deficiency accounts for 8% of complement deficiency in Europe.38 A single C-T exchange in exon 9 and 3 leading to a premature stop codon is considered as the main cause of C8B deficiency.39,40 Currently, the C8 gene is mainly investigated in immunodeficiency diseases.41,42 One report revealed that type 2 diabetic patients had markedly increased levels of C8 compared with healthy individuals.43 In a recent bioinformatic study, C8B in peripheral blood mononuclear cells was found to have no significance in relation to normal and HCC patients, and the diagnostic value of C8B for HCC was not satisfied.44 Unfortunately, very little research has focused on the correlations between C8B and cancer survival. Our results using the multiple analysis approach demonstrated that C8B downregulation in tumor tissues accounts for unfavorable OS and RFS in HCC patients. Since complement can enhance the silent clearance of tumor cells, and play dual roles in promoting and inhibiting tumor growth, and differ between tumor types,34,45,46 we assumed that a better understanding of C8B in HCC tumor biology and pathology should be validated in larger prospective cohorts and experimental trials.
Current consensus indicated that the determination of fibrinogen content and fibrin lysate in plasma is helpful for the diagnosis of cancer, as well as evaluation of both therapeutic effects and prognosis.47 The average pre-treatment plasma fibrinogen level has been linked with a hypercoagulable status, tumor progression, and prognosis of several types of human cancers.48–51 For instance, the preoperative plasma fibrinogen content could predict cancer metastasis, tumor progression, as well as tumor stage and survival in gastric cancer.52 A model combined fibrinogen and neutrophil-to-lymphocyte ratio (F-NLR) showed significant associations with the presence of tumor thrombus, larger tumor size, vascular invasion, and advanced BCLC stage. Additionally, F-NLR was indicated as an independent predictor for OS and disease-free survival in HCC following surgical resection.53 Another cohort study found that hyperfibrinogenemia was also correlated with advanced tumor stage, portal vein invasion, larger tumor size, multiple tumors, nonresponse to transarterial chemoembolization therapy, and poor survival in HCC patients.54 A bioinformatic study revealed that FGB is involved in the advanced tumor stage and hepatic metastasis of colorectal cancer.55 The serum peptides derived from FGB increased significantly in HCC patients with bone metastasis compared to those without bone metastasis.56 All these reports have investigated plasma levels of fibrinogen in HCC patients. Since inconsistent results existed in GSE14520, GEPIA and Kaplan–Meier plotter databases, and the FGB level in tumor tissues was significantly lower than that in nontumor tissues in our analysis, we suggest further research to address the roles of FGB in the progression of HCC at multiple levels.
Our research has some limitations. Firstly, no experiments were performed to address the impact of the complement and coagulation cascades pathway on the hepatoma cellular functions of our subjects. Secondly, follow-up data on our HCC patients was not available, and our results from public datasets were not verified by prospective cohorts. However, despite these limitations, our preliminary analysis provides a clue for a deep understanding of the complement and coagulation cascades signaling pathway in HCC biology and pathology.
Data Sharing Statement
Datasets of the current study are available from the NCBI Gene Expression Omnibus (https://www.ncbi.nlm.nih.gov/geo/, GSE14520). All the datasets are available from the corresponding author (Z.Y) in response to a reasonable request.
Acknowledgments
This work was supported by the National Natural Science Foundation of China (81803901). The funders had no role in study design, data collection, and analysis, decision to publish, or preparation of the manuscript.
Author Contributions
All authors made substantial contributions to conception and design, acquisition of data, or analysis and interpretation of data; took part in drafting the article or revising it critically for important intellectual content; agreed to submit to the current journal; gave final approval of the version to be published; and agree to be accountable for all aspects of the work.
Disclosure
The authors declare no conflicts of interest in this work.
References
1. The International Agency for Research on Cancer. Latest global cancer data: cancer burden rises to 19.3 million new cases and 10.0 million cancer deaths in 2020; 2020. https://www.iarc.who.int/wp-content/uploads/2020/2012/pr2292_E.pdf.
2. Pandyarajan V, Govalan R, Yang JD. Risk factors and biomarkers for chronic hepatitis B associated hepatocellular carcinoma. Int J Mol Sci. 2021;22(2):479. doi:10.3390/ijms22020479
3. Sharma R. Descriptive epidemiology of incidence and mortality of primary liver cancer in 185 countries: evidence from GLOBOCAN 2018. Jpn J Clin Oncol. 2020;50(12):1370–1379. doi:10.1093/jjco/hyaa130
4. Yan SY, Fan JG, Qio L. Hepatitis B Virus (HBV) infection and hepatocellular carcinoma- new insights for an old topic. Curr Cancer Drug Targets. 2017;17(6):505–511. doi:10.2174/1568009616666160926124530
5. Girardi DM, Pacifico JPM, Guedes de Amorim FPL, et al. Immunotherapy and targeted therapy for hepatocellular carcinoma: a literature review and treatment perspectives. Pharmaceuticals. 2020;14(1):28. doi:10.3390/ph14010028
6. Kudo M. Recent Advances in Systemic Therapy for Hepatocellular Carcinoma in an Aging Society: 2020 Update. Liver Cancer. 2020;9(6):640–662. doi:10.1159/000511001
7. Omata M, Cheng AL, Kokudo N, et al. Asia-Pacific clinical practice guidelines on the management of hepatocellular carcinoma: a 2017 update. Hepatol Int. 2017;11(4):317–370.
8. Mejia JC, Pasko J. Primary Liver Cancers: intrahepatic Cholangiocarcinoma and Hepatocellular Carcinoma. Surg Clin North Am. 2020;100(3):535–549. doi:10.1016/j.suc.2020.02.013
9. Petrick JL, Kelly SP, Altekruse SF, McGlynn KA, Rosenberg PS. Future of Hepatocellular Carcinoma Incidence in the United States Forecast Through 2030. J Clin Oncol. 2016;34(15):1787–1794. doi:10.1200/JCO.2015.64.7412
10. Teufel A. Bioinformatics and database resources in hepatology. J Hepatol. 2015;62(3):712–719. doi:10.1016/j.jhep.2014.10.036
11. Wang L, Yang Z, Cao Y. Regulatory T cell and activated natural killer cell infiltration in hepatocellular carcinoma: immune cell profiling using the CIBERSORT. Ann Transl Med. 2020;8(22):1483. doi:10.21037/atm-20-5830
12. Zhang Y, Yang L, Shi J, Lu Y, Chen X, Yang Z. The Oncogenic Role of CENPA in hepatocellular carcinoma development: evidence from bioinformatic analysis. Biomed Res Int. 2020;2020:3040839.
13. Muller-Calleja N, Ritter S, Hollerbach A, Falter T, Lackner KJ, Ruf W. Complement C5 but not C3 is expendable for tissue factor activation by cofactor-independent antiphospholipid antibodies. Blood Adv. 2018;2(9):979–986. doi:10.1182/bloodadvances.2018017095
14. Chen L, Yue J, Han X, Li J, Hu Y. Ouabain rescues rat nephrogenesis during intrauterine growth restriction by regulating the complement and coagulation cascades and calcium signaling pathway. J Dev Orig Health Dis. 2016;7(1):91–101. doi:10.1017/S2040174415007242
15. Liu W. Complement proteins detected through iTRAQ-based proteomics analysis of serum from black carp Mylopharyngodon piceus in response to experimentally induced Aeromonas hydrophila infection. Dis Aquat Organ. 2020;140:187–201. doi:10.3354/dao03497
16. Zhang J, Chen M, Zhao Y, et al. Complement and coagulation cascades pathway correlates with chemosensitivity and overall survival in patients with soft tissue sarcoma. Eur J Pharmacol. 2020;879:173121. doi:10.1016/j.ejphar.2020.173121
17. Liu Y, Xiong S, Liu S, et al. Analysis of gene expression in bladder cancer: possible involvement of mitosis and complement and coagulation cascades signaling pathway. J Comput Biol. 2020;27(6):987–998. doi:10.1089/cmb.2019.0237
18. Castiblanco-Valencia MM, Fraga TR, Pagotto AH, et al. Plasmin cleaves fibrinogen and the human complement proteins C3b and C5 in the presence of Leptospira interrogans proteins: a new role of LigA and LigB in invasion and complement immune evasion. Immunobiology. 2016;221(5):679–689. doi:10.1016/j.imbio.2016.01.001
19. Ekdahl KN, Teramura Y, Asif S, Jonsson N, Magnusson PU, Nilsson B. Thromboinflammation in Therapeutic Medicine. Adv Exp Med Biol. 2015;865:3–17.
20. Nilsson B, Teramura Y, Ekdahl KN. The role and regulation of complement activation as part of the thromboinflammation elicited in cell therapies. Mol Immunol. 2014;61(2):185–190. doi:10.1016/j.molimm.2014.06.009
21. Palacios-Acedo AL, Mege D, Crescence L, Dignat-George F, Dubois C, Panicot-Dubois L. Platelets, Thrombo-Inflammation, and Cancer: collaborating With the Enemy. Front Immunol. 2019;10:1805. doi:10.3389/fimmu.2019.01805
22. Schattner M, Jenne CN, Negrotto S, Ho-Tin-Noe B. Editorial: platelets and immune responses during thromboinflammation. Front Immunol. 2020;11:1079. doi:10.3389/fimmu.2020.01079
23. Suzuki-Inoue K. Platelets and cancer-associated thrombosis: focusing on the platelet activation receptor CLEC-2 and podoplanin. Blood. 2019;134(22):1912–1918. doi:10.1182/blood.2019001388
24. Roessler S, Jia HL, Budhu A, et al. A unique metastasis gene signature enables prediction of tumor relapse in early-stage hepatocellular carcinoma patients. Cancer Res. 2010;70(24):10202–10212. doi:10.1158/0008-5472.CAN-10-2607
25. Roessler S, Long EL, Budhu A, et al. Integrative genomic identification of genes on 8p associated with hepatocellular carcinoma progression and patient survival. Gastroenterology. 2012;142(4):957–966 e912. doi:10.1053/j.gastro.2011.12.039
26. Gautier L, Cope L, Bolstad BM, Irizarry RA. affy–analysis of Affymetrix GeneChip data at the probe level. Bioinformatics. 2004;20(3):307–315. doi:10.1093/bioinformatics/btg405
27. Dong X, Lin L, Zhang R, et al. TOBMI: trans-omics block missing data imputation using a k-nearest neighbor weighted approach. Bioinformatics. 2019;35(8):1278–1283. doi:10.1093/bioinformatics/bty796
28. Ritchie ME, Phipson B, Wu D, et al. limma powers differential expression analyses for RNA-sequencing and microarray studies. Nucleic Acids Res. 2015;43(7):e47. doi:10.1093/nar/gkv007
29. Yu G, Wang LG, Han Y, He QY. clusterProfiler: an R package for comparing biological themes among gene clusters. OMICS. 2012;16(5):284–287. doi:10.1089/omi.2011.0118
30. Tang Z, Li C, Kang B, Gao G, Li C, Zhang Z. GEPIA: a web server for cancer and normal gene expression profiling and interactive analyses. Nucleic Acids Res. 2017;45(W1):W98–W102. doi:10.1093/nar/gkx247
31. Menyhart O, Nagy A, Gyorffy B. Determining consistent prognostic biomarkers of overall survival and vascular invasion in hepatocellular carcinoma. R Soc Open Sci. 2018;5(12):181006. doi:10.1098/rsos.181006
32. Nagy A, Lanczky A, Menyhart O, Gyorffy B. Validation of miRNA prognostic power in hepatocellular carcinoma using expression data of independent datasets. Sci Rep. 2018;8(1):9227. doi:10.1038/s41598-018-27521-y
33. Revel M, Daugan MV, Sautes-Fridman C, Fridman WH, Roumenina LT. Complement system: promoter or suppressor of cancer progression? Antibodies. 2020;9(4). doi:10.3390/antib9040057
34. Thurman JM, Laskowski J, Nemenoff RA. Complement and Cancer-A Dysfunctional Relationship? Antibodies. 2020;9(4). doi:10.3390/antib9040061
35. Li L, Yang W, Shen Y, Xu X, Li J. Fish complement C8 evolution, functional network analyses, and the theoretical interaction between C8 alpha chain and CD59. Mol Immunol. 2020;128:235–248. doi:10.1016/j.molimm.2020.10.013
36. Plumb ME, Scibek JJ, Barber TD, Dunlap RJ, Platteborze PL, Sodetz JM. Chimeric and truncated forms of human complement protein C8 alpha reveal binding sites for C8 beta and C8 gamma within the membrane attack complex/perforin region. Biochemistry. 1999;38(26):8478–8484. doi:10.1021/bi9904858
37. Grumach AS, Kirschfink M. Are complement deficiencies really rare? Overview on prevalence, clinical importance and modern diagnostic approach. Mol Immunol. 2014;61(2):110–117. doi:10.1016/j.molimm.2014.06.030
38. Turley AJ, Gathmann B, Bangs C, et al. Spectrum and management of complement immunodeficiencies (excluding hereditary angioedema) across Europe. J Clin Immunol. 2015;35(2):199–205. doi:10.1007/s10875-015-0137-5
39. Kaufmann T, Hansch G, Rittner C, Spath P, Tedesco F, Schneider PM. Genetic basis of human complement C8 beta deficiency. J Immunol. 1993;150(11):4943–4947.
40. Rao L, Li YB, Chen GD, Zhou B, Schneider PM, Zhang L. [Further study on heterogeneic basis of complement C8 beta deficiency]. Zhonghua Yi Xue Yi Chuan Xue Za Zhi. 2004;21(1):10–13. Chinese.
41. Bradley DT, Bourke TW, Fairley DJ, et al. Susceptibility to invasive meningococcal disease: polymorphism of complement system genes and Neisseria meningitidis factor H binding protein. PLoS One. 2015;10(3):e0120757. doi:10.1371/journal.pone.0120757
42. Dellepiane RM, Dell’Era L, Pavesi P, et al. Invasive meningococcal disease in three siblings with hereditary deficiency of the 8(th) component of complement: evidence for the importance of an early diagnosis. Orphanet J Rare Dis. 2016;11(1):64. doi:10.1186/s13023-016-0448-5
43. Karlsson E, Shaat N, Groop L. Can complement factors 5 and 8 and transthyretin be used as biomarkers for MODY 1 (HNF4A-MODY) and MODY 3 (HNF1A-MODY)? Diabet Med. 2008;25(7):788–791. doi:10.1111/j.1464-5491.2008.02467.x
44. Ye Z, Zeng Z, Shen Y, Chen Z. Identification of hub genes in peripheral blood mononuclear cells for the diagnosis of hepatocellular carcinoma using a weighted gene co-expression network analysis. Exp Ther Med. 2020;20(2):890–900. doi:10.3892/etm.2020.8736
45. Akhir FNM, Noor MHM, Leong KWK, et al. An Immunoregulatory role for complement receptors in murine models of breast cancer. Antibodies. 2021;10(1). doi:10.3390/antib10010002
46. Kavvadas E. Autoantibodies specific for C1q, C3b, beta2-glycoprotein 1 and annexins may amplify complement activity and reduce apoptosis-mediated immune suppression. Med Hypotheses. 2020;144:110286. doi:10.1016/j.mehy.2020.110286
47. Repetto O, Maiero S, Magris R, et al. Quantitative Proteomic Approach Targeted to Fibrinogen beta Chain in Tissue Gastric Carcinoma. Int J Mol Sci. 2018;19(3). doi:10.3390/ijms19030759
48. Feng Z, Wen H, Bi R, Duan Y, Yang W, Wu X. Thrombocytosis and hyperfibrinogenemia are predictive factors of clinical outcomes in high-grade serous ovarian cancer patients. BMC Cancer. 2016;16(1):43. doi:10.1186/s12885-016-2070-2
49. Lee KW, Bang SM, Kim S, et al. The incidence, risk factors and prognostic implications of venous thromboembolism in patients with gastric cancer. J Thromb Haemost. 2010;8(3):540–547. doi:10.1111/j.1538-7836.2009.03731.x
50. Li H, Zhao T, Ji X, et al. Hyperfibrinogenemia predicts poor prognosis in patients with advanced biliary tract cancer. Tumour Biol. 2016;37(3):3535–3542. doi:10.1007/s13277-015-4184-6
51. Wang H, Gao J, Bai M, et al. The pretreatment platelet and plasma fibrinogen level correlate with tumor progression and metastasis in patients with pancreatic cancer. Platelets. 2014;25(5):382–387. doi:10.3109/09537104.2013.827782
52. Repetto O, De Re V. Coagulation and fibrinolysis in gastric cancer. Ann N Y Acad Sci. 2017;1404(1):27–48. doi:10.1111/nyas.13454
53. Kong W, Xu H, Cheng J, et al. The Prognostic role of a combined fibrinogen and neutrophil-to-lymphocyte ratio score in patients with resectable hepatocellular carcinoma: a Retrospective Study. Med Sci Monit. 2020;26:e918824. doi:10.12659/MSM.918824
54. Zhang X, Long Q. Elevated serum plasma fibrinogen is associated with advanced tumor stage and poor survival in hepatocellular carcinoma patients. Medicine. 2017;96(17):e6694. doi:10.1097/MD.0000000000006694
55. Yang W, Shi J, Zhou Y, et al. Co-expression network analysis identified key proteins in association with hepatic metastatic colorectal cancer. Proteomics Clin Appl. 2019;13(6):e1900017. doi:10.1002/prca.201900017
56. He J, Zeng ZC, Xiang ZL, Yang P. Mass spectrometry-based serum peptide profiling in hepatocellular carcinoma with bone metastasis. World J Gastroenterol. 2014;20(11):3025–3032. doi:10.3748/wjg.v20.i11.3025
 © 2021 The Author(s). This work is published and licensed by Dove Medical Press Limited. The
full terms of this license are available at https://www.dovepress.com/terms
and incorporate the Creative Commons Attribution
- Non Commercial (unported, 3.0) License.
By accessing the work you hereby accept the Terms. Non-commercial uses of the work are permitted
without any further permission from Dove Medical Press Limited, provided the work is properly
attributed. For permission for commercial use of this work, please see paragraphs 4.2 and 5 of our Terms.
© 2021 The Author(s). This work is published and licensed by Dove Medical Press Limited. The
full terms of this license are available at https://www.dovepress.com/terms
and incorporate the Creative Commons Attribution
- Non Commercial (unported, 3.0) License.
By accessing the work you hereby accept the Terms. Non-commercial uses of the work are permitted
without any further permission from Dove Medical Press Limited, provided the work is properly
attributed. For permission for commercial use of this work, please see paragraphs 4.2 and 5 of our Terms.