Back to Journals » Diabetes, Metabolic Syndrome and Obesity » Volume 17
Body Composition Indicators Jointly Predict Metabolic Unhealthy Phenotypes in Young and Middle-Aged Obese Individuals: A Cross-Sectional Quantitative Computed Tomography Study
Authors Zhan H, Chen Q, Liu T, Shi Y, Pei J, Zou L, Wang L
Received 3 November 2023
Accepted for publication 19 February 2024
Published 29 February 2024 Volume 2024:17 Pages 1069—1079
DOI https://doi.org/10.2147/DMSO.S447847
Checked for plagiarism Yes
Review by Single anonymous peer review
Peer reviewer comments 2
Editor who approved publication: Prof. Dr. Juei-Tang Cheng
Hao Zhan,1,2 Qichun Chen,1,2 Tiantian Liu,1,2 Yuting Shi,1,2 Jinxia Pei,1,2 Liwei Zou,1,2 Longsheng Wang1,2
1Department of Radiology, the Second Affiliated Hospital of Anhui Medical University, Hefei, 230601, People’s Republic of China; 2Medical Imaging Research Center of Anhui Medical University, Hefei, 230601, People’s Republic of China
Correspondence: Liwei Zou; Longsheng Wang, Email [email protected]; [email protected]
Purpose: The main aim of this study is to analyze the relationship between body composition indices and metabolic unhealthy phenotypes in young and middle-aged obese patients and to assess their joint predictive ability.
Patients and Methods: A cross-sectional study method was used to select 207 patients who were proposed to undergo weight loss surgery for morbid obesity from March to November 2022. Total adipose tissue (TAT), visceral adipose tissue (VAT), subcutaneous adipose tissue (SAT), liver fat content (LFC), cross-sectional area (CSAmuscle), and intermuscular adipose tissue (CSAIMAT) of paraspinal muscles were measured using quantitative computed tomography. Participants were categorized into two groups: metabolically healthy obesity (MHO) and metabolically unhealthy obesity (MUO). The receiver operating characteristic curve comprised body composition variables that correlated with MUO, and the area under the curve (AUC) was calculated to compare their prediction capacity for MUO.
Results: There were 71 patients with MHO (34.3%) and 136 patients with MUO (65.7%). The VAT, VAT/TAT ratio, LFC, and CSAmuscle was higher in MUO patients than in MHO (all P < 0.001), and SAT was lower than in MHO (P = 0.008). And all of these metrics were correlated with MUO (all P < 0.05). Inclusion of these body composition metrics in the ROC analysis showed that the AUC values for SAT, VAT, VAT/TAT ratio, LFC and CSAmuscle were 0.615, 0.663, 0.727, 0.694, 0.671, respectively, and the combination of the VAT/TAT ratio and the LFC had the ability to predict MUO best (AUC=0.746, P = 0.025).
Conclusion: The combined use of VAT/TAT ratio and LFC is superior to the use of these two metrics alone in terms of their ability to predict the MUO, providing a more accurate approach to the management and prevention of obesity-related metabolic risk.
Keywords: metabolically unhealthy, obesity, body composition, quantitative computed tomography
Introduction
Obesity is a global epidemic, with approximately 200 million adults overweight and 65.02 billion obese, according to the World Health Organization.1 Obesity is a major risk factor for the progression of prediabetes to diabetes, and it confers a risk of cardiovascular disease in patients with prediabetes and diabetes.2 A meta-analysis showed that obesity is highly associated with the development of cardiovascular disease (CVD), with CVD mortality in the general population being 1.37–3.10 times higher in obese individuals than in non-obese individuals, and the risk of CVD death being highest in morbidly obese patients (risk ratio=10.40).3 A large UK cohort study showed that 8.68% of patients had a non-fatal CVD event and 1.37% died of CVD during the 11 years of follow-up. Obesity is associated with a high prevalence of impaired glucose tolerance (IGT or prediabetes) and is an independent risk factor for type 2 diabetes (T2D).4 Given these premises, in obesity, it seems crucial to prevent progression to diabetes while treating the comorbidities of obesity, mainly manifested as T2D, metabolic syndrome (MS, a group of disorders strictly related to insulin resistance, elevated triglyceride levels, hyperglycemia and hypertension), CVD and malignancy.
However, the individual risk of developing obesity-related comorbid disorders varies greatly, which cannot be explained just by the degree of adiposity. Some obese individuals have a significantly lower cardiometabolic risk and are considered to have a “metabolically healthy or insulin-insensitive obesity” phenotype, on the contrary, metabolically unhealthy or insulin-resistant obese individuals present with MS.5 Therefore, some studies have defined obese patients with or without cardiometabolic risk factors by combining body mass index and metabolic characteristics to categorize individuals into metabolically healthy obese (MHO) phenotypes and metabolically unhealthy obese (MUO) phenotypes.6 Previous studies have shown that patients with MUO are exposed to more severe adverse outcomes than patients with MHO, including a higher risk of cancer7 and cardiovascular disease.8
Studies have shown that the metabolic health phenotype in obese individuals may be a transient state, influenced by age, environmental factors, lifestyle and body composition changes.9,10 Therefore, identifying factors that contribute to metabolic disturbances in normal weight and overweight individuals may be important for the prevention of future CVD.11 Body mass index (BMI) is a simple metric that takes into account weight and height and is commonly used to classify obesity, but is difficult to accurately reflect it. Body composition may contribute to understanding the increased cardiovascular risk observed in metabolically unhealthy highly obese subjects.12,13 The body composition index helps discriminate lean tissue from fat tissue and improve the assessment of the metabolic phenotype of obesity. Human ectopic fat accumulation is hypothesized to be connected to an increased metabolic risk in obese people, probably due to adipokine dysregulation, which results in more pro-inflammatory adipokine synthesis and less anti-inflammatory adipokine production, as well as greater lipolysis in that tissue. Wherein, increased visceral fat plays a key role in the metabolic deterioration of the individual,14 and is a major determinant of increased cardiometabolic risk.15 In addition, liver ectopic fat16 and muscle mass17 play an important role in identifying beneficial phenotypes of obesity. However, the predictive ability of body composition indicators such as liver fat content (LFC), visceral adipose tissue (VAT), subcutaneous adipose tissue (SAT), and muscle mass to jointly identify MUO phenotypes in young and middle-aged obese patients has rarely been investigated in the past.
Therefore, the aim of this study was to assess the distribution of body composition such as LFC, abdominal VAT, SAT and skeletal muscle mass in young and middle-aged obese patients by quantitative computed tomography (QCT) and to investigate the correlation of these indicators with metabolically unhealthy phenotypes for their predictive value.
Materials and Methods
Subjects
The cross-sectional study population was taken from patients who were proposed for bariatric surgery for morbid obesity at the Second Affiliated Hospital of Anhui Medical University from March to November 2022. The patients are all Han Chinese. Inclusion criteria: (1) age 20–40 years; (2) BMI ≥ 30 kg/m2; exclusion criteria: (1) inability to measure abdominal fat content due to artifacts, incomplete abdominal image acquisition; (2) incomplete clinical data; (3) malignant thyroid tumor. Finally, 207 obese patients were included in the study (Figure 1). The study was conducted in compliance with the Declaration of Helsinki and was approved by the hospital ethics committee (SL-YX [YS] 2023–010).
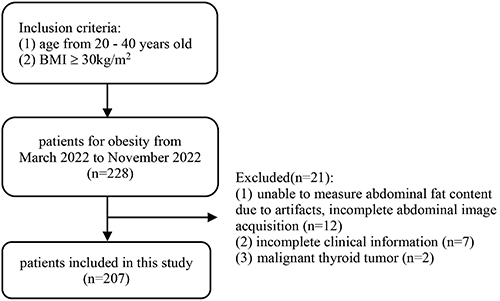 |
Figure 1 Flow chart of the study. |
Biochemical Tests
Patients’ blood indices, which included fasting total cholesterol (TC), triglycerides (TG), fasting plasma glucose (FPG), C-peptide, fasting insulin (FINS), 25-(OH) vitamin D (VD), and vitamin B12 (V-B12), were retrospectively collected at the time of admission examination. The patients’ fasting venous blood was collected in the morning and sent to the laboratory for examination and analysis. During the testing session, TC, TG, FPG and V-B12 were measured using a fully automated chemiluminescent immunoassay analyzer (IMMULITE 2000XPI, Siemens, Germany). Among these, TC, TG and FPG were detected by enzyme immunoassay technique and V-B12 by atomic absorption spectrophotometry. Furthermore, the levels of C-peptide, FINS, and 25-(OH)-VD were assessed through the utilization of a fully automated biochemical instrument (Cobas e 601, Roche, Switzerland). Among them, C-peptide and FINS were detected by chemiluminescence, while 25-(OH)-VD was detected by high performance liquid chromatography.
Body Composition Measurement
A Dual Source CT scanner (SOMATOM Force, Siemens, German) was used to obtain raw CT images of the patient’s abdomen. Monthly phantom scanning is a widely adopted quality assurance standard for routine QCT scans in clinical trials. The standard reconstructed scan protocol of QCT was as follows: scanning table height 150 cm; tube voltage 120 kVp; tube current 150 mA; rotation time 0.5 s/revolution; reconstructed slice thickness 1 mm; matrix 512×512. The raw CT data were transferred into QCT Pro 6.1 software (Mindways, USA) for body composition measurements.
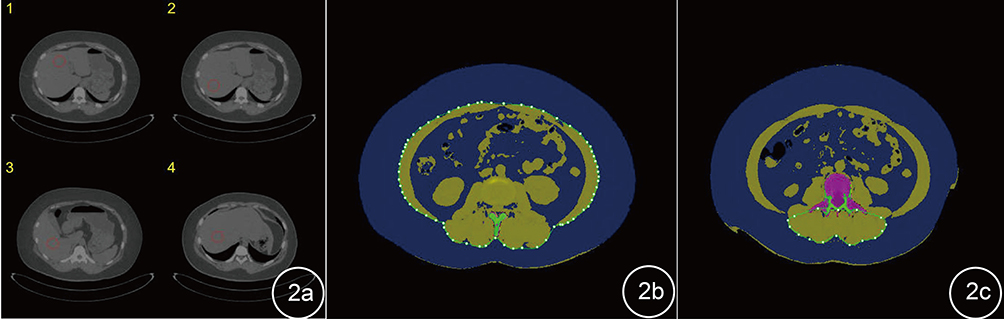 |
Figure 2 Diagram of abdominal fat measurement. ((a) shows the LFC; (b and c) the blue area within the green line in the diagram is visceral fat, and the blue area outside the green line is subcutaneous fat). |
Concept
According to the MS diagnostic criteria of the Chinese Diabetes Society (CDS),18 subjects who met one of the following four criteria were considered to have MS: (1) FPG ≥ 6.1 mmol/L or 2hPG ≥ 7.8 mmol/L or have been diagnosed with diabetes; (2) systolic blood pressure (SBP) ≥ 130 mmHg or diastolic blood pressure (DBP) ≥ 85 mmHg or have been diagnosed with hypertension; and (3) TG ≥1.7 mmol/ L or high-density lipoprotein cholesterol (HDL-C) <1.04 mmol/L or taking any medication. We classified participants into MHO and MUO based on BMI and metabolic health status. Diabetes is defined as fasting blood glucose ≥7 mmol/L or previous use of glucose-lowering medication. Hypertension is defined as systolic blood pressure ≥140 mmHg and/or diastolic blood pressure ≥90 mmHg or previous use of antihypertensive medication. 30 kg/cm2 <BMI <35 kg/cm2 was defined as obesity grade I; 35 kg/cm2 ≤ BMI <40 kg/cm2 was defined as obesity grade II; BMI ≥ 40 kg/cm2 was defined as obesity grade III.
Statistical Analysis
SPSS 23.0 was used for data analysis. Kolmogorov–Smirnov test was used to verify the normal or skewed distribution of continuous variables. Normally distributed measures were expressed as mean ± standard deviation ( ), and non-normally distributed measures were expressed as median (interquartile spacing). The Student’s t-test was used to compare the difference between two groups of normally distributed measures, and Mann–Whitney U-test was used to compare the difference between two groups of non-normally distributed measures. The chi-square test was used to assess the differences between the categorical variables between the groups. Body composition indicators (VAT, SAT, VAT/TAT ratio, LFC, and CSAmuscle) that differed between the MHO and MUO groups (P<0.1) were included in the binary logistic regression analysis, adjusted for age and gender, to test the odds ratio (OR) and 95% confidence interval (CI) of body composition indicators in obese patients with MUO. Further statistically significant (P<0.05) indicators were included in the receiver operating characteristic (ROC) curve analysis to explore the ability of these body composition indicators to discriminate between metabolically unhealthy and metabolically healthy subjects, and finally to compare the diagnostic efficacy of the combined indicators to find the optimal body composition predictors. P<0.05 indicates statistical significance.
Results
Comparison of the Differences Between the MHO and MUO Groups
A total of 207 participants were included in the final analysis with a mean age of 29.73 ± 4.72 years and 154 (74.4%) female patients. 71 (34.3%) of all patients were MHO and 136 (65.7%) were MUO. Patients with MUO had significantly higher systolic blood pressure, diastolic blood pressure, triglycerides, total cholesterol, fasting glucose, 25-(OH)-VD, V-B12, C-peptide, and insulin compared to patients with MHO (all P<0.001). Participants with MUO had higher age and male proportion than MHO (P<0.05). MUO patients had higher VAT, VAT/TAT, LFC, and CSAmuscle (all P <0.001) and lower SAT (P<0.01) compared to MHO patients (Table 1). After grouping according to different age groups, it was found that the differences between the MUO and MHO groups were similar to the overall results, whether they were 20–30 or 30–40 years old. There were no significant differences in 25-(OH)-VD and SAT between the two groups, and the V-B12 was higher in MUO patients than in MHO in the 20–30 years old group but the results were not significantly different (Table 2).
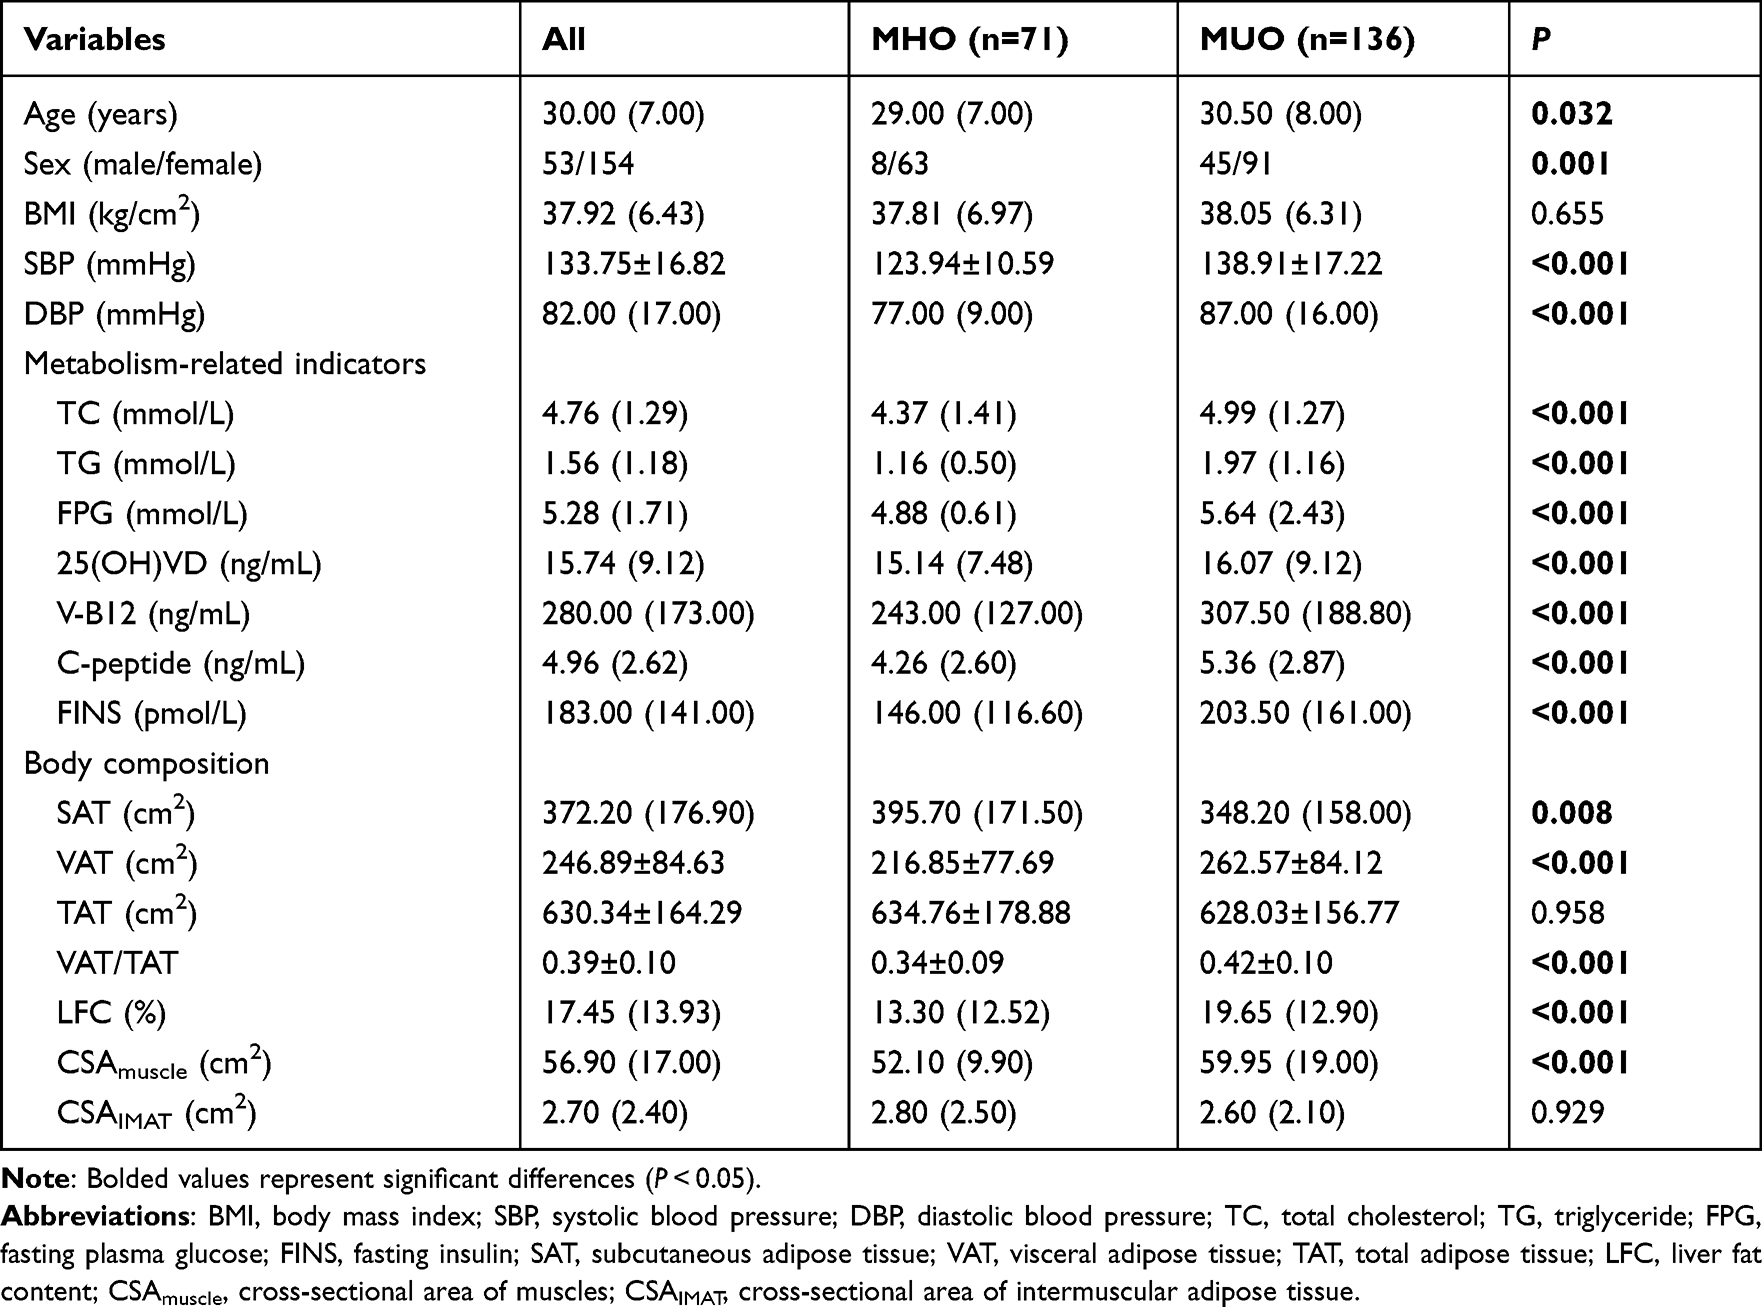 |
Table 1 Baseline Characteristics of Patients |
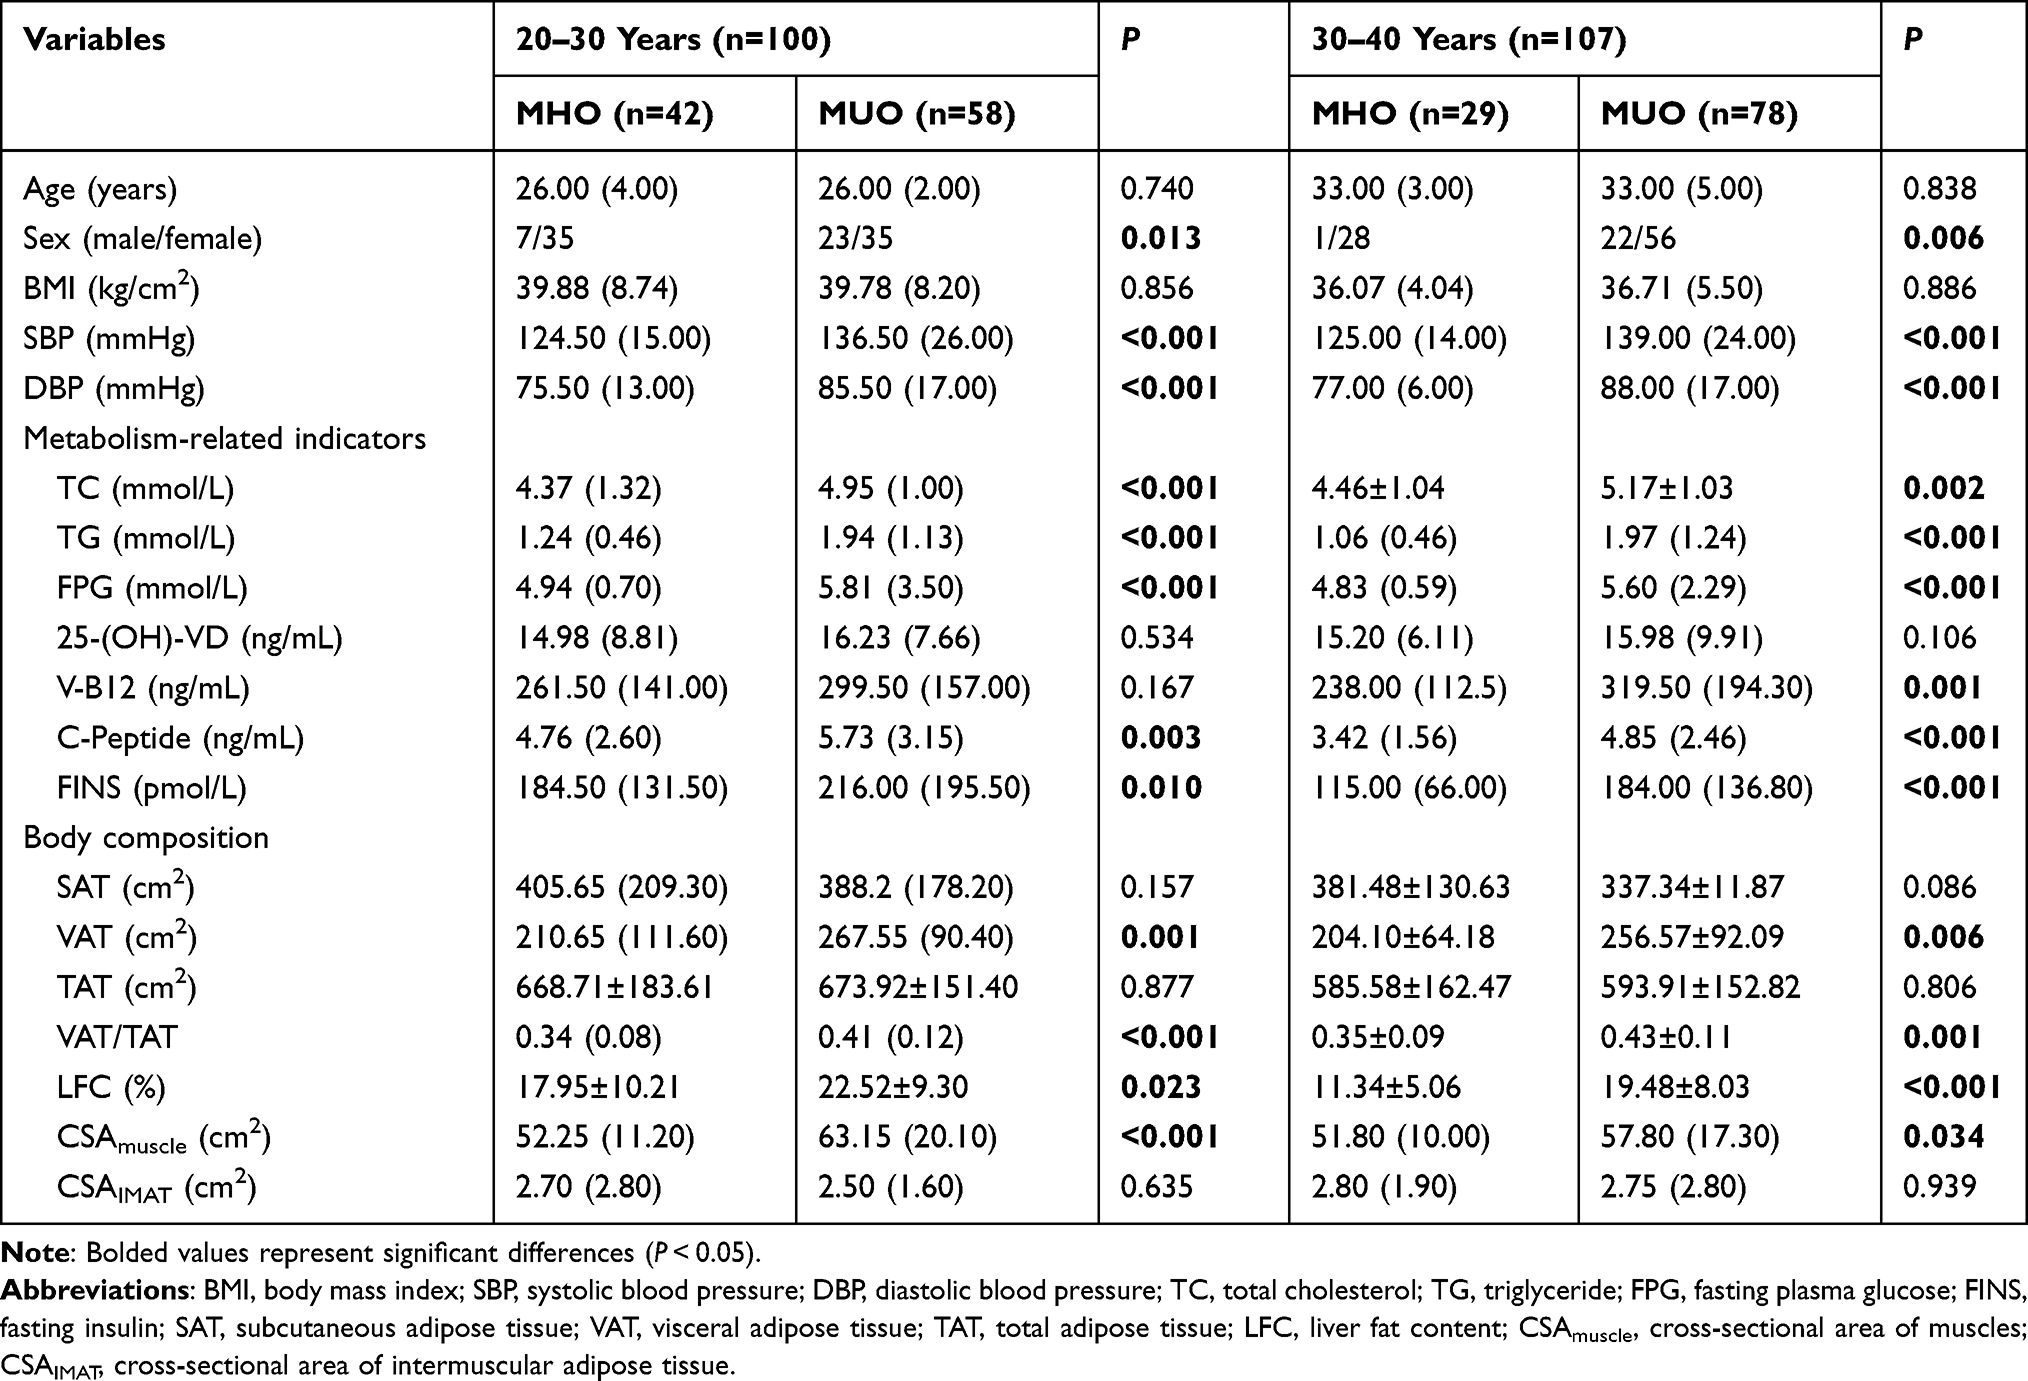 |
Table 2 Differences Between Metabolic Phenotypes in Different Age Groups |
Distribution of Body Composition Among Metabolic Phenotypes of Different Obesity Classes
According to the grouping of different grades of obesity, 49 patients (23.67%) were obesity in grade I, 88 patients (42.51%) in grade II, and 70 patients (33.82%) in grade III. The VAT/TAT and CSAmuscle were higher in MUO than in MHO in different obesity classes. The SAT was significantly lower in MUO than in MHO in both grade I and grade II obesity patients, and the LFC was significantly higher in MUO than in MHO. In terms of VAT, it was higher in MUO than in MHO only in grade II obesity patients (Figure 3).
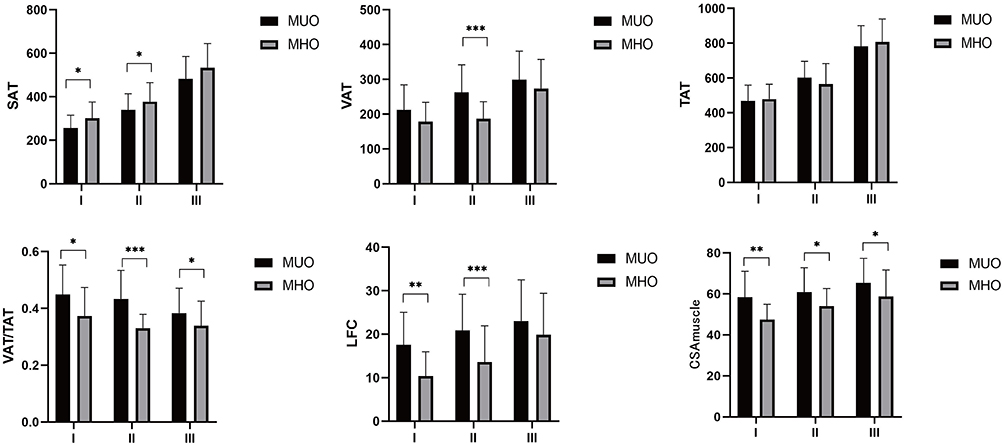 |
Figure 3 Distribution of body composition between metabolic phenotypes of different obesity classes. *P < 0.05; **P < 0.01; ***P < 0.001. Abbreviations: SAT, subcutaneous adipose tissue; VAT, visceral adipose tissue; TAT, total adipose tissue; LFC, liver fat content; CSAmuscle, cross-sectional area of muscles. |
Relationship Between Body Composition and Metabolically Unhealthy Phenotypes
Body composition, including SAT, VAT, VAT/TAT, LFC, and CSAmuscle, which were differential (P<0.05) between the MHO and MUO groups, were included in the binary logistic regression analysis, which showed that SAT, VAT, VAT/TAT, LFC, and CSAmuscle were all influential factors in the MUO after adjusting for age and gender (OR= 0.997, 1.005, 4324.784, 1.089, 1.050, all P < 0.05) (Table 3).
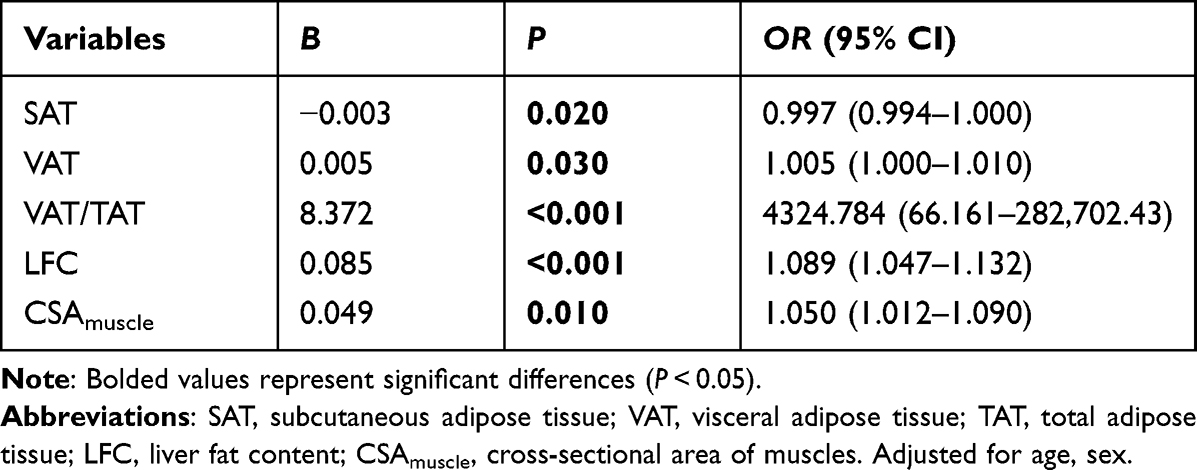 |
Table 3 Effect of Body Composition on MUO (Univariate Binary Logistic Regression) |
Diagnostic Efficacy of Body Composition and Combined Factors on MUO
The predictive ability of different body composition indicators for MUO was evaluated by ROC curve analysis, and the area under the curve (AUC) for diagnosing MUO was 0.615, 0.663, 0.727, 0.694, and 0.671 for SAT, VAT, VAT/TAT, LFC, and CSAmuscle, respectively (Figure 4, Table 4). The body composition index VAT/TAT, which has the largest AUC in diagnosing MUO, was combined with LFC and CSAmuscle to further compare the variability of its diagnostic efficacy with VAT/TAT, and the results showed that the AUC value of 0.777 was significantly higher for LFC combined with VAT/TAT (P=0.025), and LFC, CSAmuscle combined with VAT/TAT had an AUC value of 0.790, which was significantly higher than VAT/TAT (P=0.036) (Table 5).
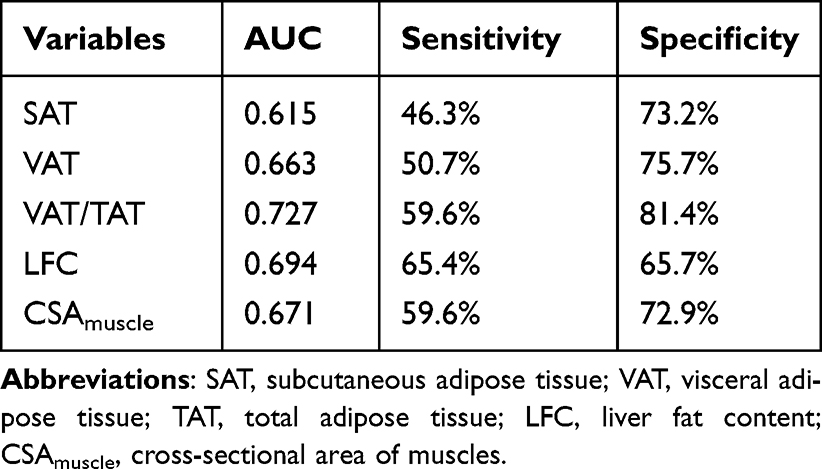 |
Table 4 AUC, Sensitivity and Specificity of Body Composition Indexes for the Diagnosis of MUO |
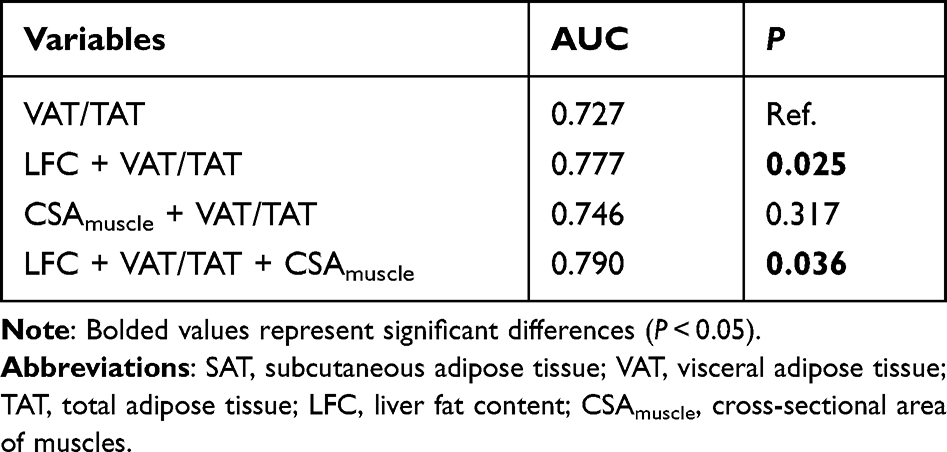 |
Table 5 Comparison of Diagnostic Efficacy of Combined Factors and VAT/TAT for MUO |
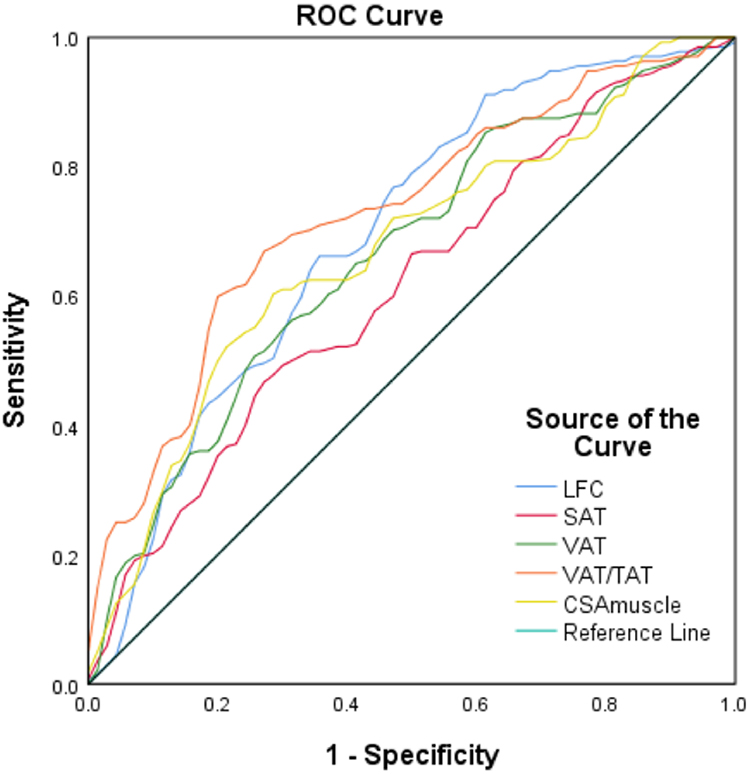 |
Figure 4 ROC curves for different body components of MUO. |
Discussion
In this study, we used QCT to determine body composition and its relationship with metabolic health status in a young and middle-aged obese population and found that 34.3% and 65.7% of patients were classified as MHO and MUO. Among the different metabolic health status in obese patients, higher LFC, VAT, VAT/TAT, and CSAmuscle were strongly associated with MUO, and SAT may be a protective factor for the metabolic health status of obesity patients. VAT/TAT was a better predictor of MUO, and when compared with other body composition indicators, it was found that VAT/TAT combined with LFC was a better predictor of MUO.
The prevalence of metabolic phenotypes has been shown to be quite variable, with the obese metabolically healthy phenotype ranging from 10–30%.19 The metabolically healthy type of obesity had the highest prevalence in the US population worldwide, and there was a large difference between the two.20 The prevalence of the metabolically unhealthy phenotype in normal weight ranged from 6.6% to 45.9%, with the highest prevalence in older adults, men, and Europeans.20 To date, there are no standardized criteria for the diagnosis of metabolic phenotypes. Studies have used different definitions of metabolically unhealthy phenotypes, which could explain the differences in phenotype prevalence estimates. In this study, we used the definition proposed by the CDS in 2008, which was created based on a set of metabolic risk factors, abnormal blood pressure, lipids, and blood glucose, and was representative for studies of the Chinese population. This resulted in a 34.3% prevalence of metabolically healthy phenotypes and 65.7% prevalence of unhealthy phenotypes in obese patients in this study.
In the present study, low SAT and high VAT were associated with MUO, suggesting that visceral fat accumulation may pose a greater metabolic risk than subcutaneous fat. Previous studies have found that individuals with MHO had significantly lower levels of visceral fat than those with MUO.21,22 A cross-sectional study in China of the Yi population showed that VAT was positively associated with MUO.23 These findings are consistent with our results that increased abdominal VAT may be detrimental to the maintenance of metabolic health status. The VAT not only serves as a site of fat deposition, but also as a secretory organ capable of producing different adipokines that regulate lipid metabolism and inflammation,24 which are closely related to insulin sensitivity and glucose metabolism.25 Subcutaneous adipocytes have high lipocalin expression and low pro-inflammatory adipokine expression, are better differentiated, and have higher adipogenic and browning potential compared to visceral adipocytes.26,27 Ryden et al demonstrated that a higher number of SAT cells correlates with favorable cardiometabolic indices in obese patients.28 Abdominal SAT was shown to be a protective factor for MHO in the present study, which may be due to adequate expansion of subcutaneous protective fat depots, remodeling of healthy adipose tissue, and limited ectopic lipid deposition in individuals with MHO.29 Observations from the Framingham Heart Study suggested that the inability to store fat in SAT depots increases the tendency to store visceral fat.30 In addition, we found that SAT and VAT increased with increasing obesity grade, but differences in VAT between metabolic subgroups were found only in grade II obesity. The possible reason for this is that the sample size has been reduced after grouping, resulting in an uneven distribution of data unable to demonstrate differences after metabolic grouping.
Increased LFC was also found to be a risk factor for the MUO phenotype in this investigation. The liver is an important site for ectopic fat deposition. Previous studies have found that hepatic fat deposition is closely associated with metabolically unhealthy phenotypes in obese patients.22 Xia et al found that metabolically healthy individuals had lower concentrations of liver enzymes, indicating lower LFC in patients.31 In addition, LFC was shown to have higher AUC values than VAT in predicting the MUO phenotype in this study, which was consistent with previous findings that ectopic fat in the liver might be more important than visceral fat in predicting healthy phenotypes of obesity.16 There is growing evidence that SAT has a limited capacity for expansion and once exceeded promotes VAT expansion or storage in non-adipose tissues such as the liver, leading to hepatic steatosis, which promotes cardiometabolic complications of obesity.32 Our study also found no significant difference in LFC between metabolic health phenotypes in class III obese patients, suggesting that the higher the degree of obesity the more severe their hepatic fat deposition, which was unable to differentiate between metabolic health phenotypes, and also validated to some extent the idea that the metabolic health phenotype is unstable.19
In this study, patients with the MHO phenotype had lower CSAmuscle of paraspinal muscle, however there was no significant difference in paraspinal muscle fat area between the two groups. Previous studies have shown that muscle mass and strength are protective factors against cardiometabolic risk and MS.11 Several studies have evaluated the relationship between muscle mass and metabolic health status, however, no consistent conclusions have been reached.17,21,23,33 The protective effect of muscle mass may be due to mechanisms involving glucose utilization, myokine secretion, and ectopic fat accumulation.34,35 In our study, we found that metabolically unhealthy individuals instead had greater muscle area, which may be related to the widely varying body sizes of the patients, so we further analyzed the relationship between CSAmuscle and CSAIMAT corrected for BMI and metabolic health status, and the results showed that there was still no significant correlation. The analysis may be related to differences in study populations and sample sizes, and the exact explanation and underlying mechanisms of the relationship between muscle mass and MUO phenotype have not been fully elucidated and still need to be further validated by joint multicenter with larger sample sizes.
Age has been one of the factors responsible for the occurrence of metabolic abnormalities in susceptible individuals and was even consistent with the hypothesis of transient metabolic stabilization in obese individuals.9,10 The results of the present study also showed that the mean age of patients with MUO phenotype was significantly higher than that of individuals with metabolically unhealthy phenotype. According to the present study, ROC curve analysis showed that abdominal VAT, VAT/TAT ratio, LFC, and CSAmuscle were useful in predicting metabolic health status, indicating that metabolic health risks may be present in obese patients if these body composition metrics are above threshold values. To shorten the screening time and prevent the risk of metabolic complications in these patients, we further evaluated the predictive efficacy of multiple body composition metrics and showed that the combination of VAT/TAT ratio and LFC was able to better predict the MUO phenotype. Therefore, monitoring the VAT/TAT ratio in parallel with LFC could contribute to the early detection of metabolically unhealthy phenotypes in patients. Furthermore, it is necessary to encourage the MHO population to exercise and dietary control to reduce body weight to prevent the transition to MUO and the development of related metabolic diseases.
However, there are some limitations of this study: firstly, this was a single-center, cross-sectional study, which does not allow for causal inference. Therefore, further clinical trials are needed for validation. Secondly, there were fewer male patients in this study, which may have resulted in data bias. Thirdly, due to the lack of universally accepted criteria for determining metabolic health status, the results of this study may not be applicable in other populations. Finally, this study did not assess some confounding factors, such as lifestyle, dietary status, and physical activity, which may have influenced our results.
Conclusion
In conclusion, our findings suggest that LFC, SAT, VAT, VAT/TAT, and CSAmuscle are strongly associated with metabolically unhealthy phenotypes by adjusting for age and sex in young and middle-aged obese patients. The combined use of VAT/TAT and LFC was superior to the use of these two metrics alone in terms of their ability to predict MUO, providing a more precise approach to the management and prevention of obesity-related metabolic risks.
Ethics Approval
This study was approved by the Ethics Committee of the Second Affiliated Hospital of Anhui Medical University (SL-YX [YS] 2023-010).
Consent to Participate
Informed consent was obtained from all individual participants included in the study.
Funding
University Natural Science Research Project of Anhui Province, Grant/Award Numbers: 2023AH040377.
Disclosure
The authors have no relevant financial or non-financial interests to disclose for this work.
References
1. Boutari C, Mantzoros CS. A 2022 update on the epidemiology of obesity and a call to action: as its twin COVID-19 pandemic appears to be receding, the obesity and dysmetabolism pandemic continues to rage on. Metabolism. 2022;133:155217. doi:10.1016/j.metabol.2022.155217
2. La Sala L, Pontiroli AE. Prevention of Diabetes and Cardiovascular Disease in Obesity. Int J Mol Sci. 2020;21(21):8178. doi:10.3390/ijms21218178
3. Dwivedi AK, Dubey P, Cistola DP, Reddy SY. Association Between Obesity and Cardiovascular Outcomes: updated Evidence from Meta-analysis Studies. Curr Cardiol Rep. 2020;22(4):25. doi:10.1007/s11886-020-1273-y
4. Schnurr TM, Jakupovic H, Carrasquilla GD, et al. Obesity, unfavourable lifestyle and genetic risk of type 2 diabetes: a case-cohort study. Diabetologia. 2020;63(7):1324–1332. doi:10.1007/s00125-020-05140-5
5. Karelis AD, Brochu M, Rabasa-Lhoret R. Can we identify metabolically healthy but obese individuals (MHO)? Diabetes Metab. 2004;30(6):569–572. doi:10.1016/S1262-3636(07)70156-8
6. Brandao I, Martins MJ, Monteiro R. Metabolically Healthy Obesity-Heterogeneity in Definitions and Unconventional Factors. Metabolites. 2020;10(2):48. doi:10.3390/metabo10020048
7. Zheng X, Peng R, Xu H, et al. The Association Between Metabolic Status and Risk of Cancer Among Patients With Obesity: metabolically Healthy Obesity vs. Metabolically Unhealthy Obesity. Front Nutr. 2022;9:783660. doi:10.3389/fnut.2022.783660
8. Lee J, Kwak SY, Park D, et al. Prolonged or Transition to Metabolically Unhealthy Status, Regardless of Obesity Status, Is Associated with Higher Risk of Cardiovascular Disease Incidence and Mortality in Koreans. Nutrients. 2022;14(8):1644. doi:10.3390/nu14081644
9. Goncalves CG, Glade MJ, Meguid MM. Metabolically healthy obese individuals: key protective factors. Nutrition. 2016;32(1):14–20. doi:10.1016/j.nut.2015.07.010
10. Stefan N, Haring HU, Hu FB, Schulze MB. Metabolically healthy obesity: epidemiology, mechanisms, and clinical implications. Lancet Diabetes Endocrinol. 2013;1(2):152–162. doi:10.1016/S2213-8587(13)70062-7
11. Lee MJ, Kim EH, Bae SJ, et al. Protective role of skeletal muscle mass against progression from metabolically healthy to unhealthy phenotype. Clin Endocrinol. 2019;90(1):102–113. doi:10.1111/cen.13874
12. Wildman RP, Muntner P, Reynolds K, et al. The obese without cardiometabolic risk factor clustering and the normal weight with cardiometabolic risk factor clustering: prevalence and correlates of 2 phenotypes among the US population (NHANES 1999-2004). Arch Intern Med. 2008;168(15):1617–1624. doi:10.1001/archinte.168.15.1617
13. De Lorenzo A, Del GV, Premrov MG, et al. Normal-weight obese syndrome: early inflammation? Am J Clin Nutr. 2007;85(1):40–45. doi:10.1093/ajcn/85.1.40
14. Iacobini C, Pugliese G, Blasetti FC, Federici M, Menini S. Metabolically healthy versus metabolically unhealthy obesity. Metabolism. 2019;92:51–60. doi:10.1016/j.metabol.2018.11.009
15. Piche ME, Tchernof A, Despres JP. Obesity Phenotypes, Diabetes, and Cardiovascular Diseases. Circ Res. 2020;126(11):1477–1500. doi:10.1161/CIRCRESAHA.120.316101
16. Stefan N, Kantartzis K, Machann J, et al. Identification and characterization of metabolically benign obesity in humans. Arch Intern Med. 2008;168(15):1609–1616. doi:10.1001/archinte.168.15.1609
17. Carvalho CJ, Longo GZ, Kakehasi AM, et al. Skeletal mass indices are inversely associated with metabolically unhealthy phenotype in overweight/obese and normal-weight men: a population-based cross-sectional study. Br J Nutr. 2021;126(4):501–509. doi:10.1017/S0007114520004262
18. Chinese Diabetes Society. Guidelines for the prevention and control of type 2 diabetes in China (2017 Edition). Chin J Pract Internal Med. 2018;38(04):292–344.
19. Bluher M. Metabolically Healthy Obesity. Endocr Rev. 2020;41(3):bnaa4. doi:10.1210/endrev/bnaa004
20. Wang B, Zhuang R, Luo X, et al. Prevalence of Metabolically Healthy Obese and Metabolically Obese but Normal Weight in Adults Worldwide: a Meta-Analysis. Horm Metab Res. 2015;47(11):839–845. doi:10.1055/s-0035-1559767
21. Lv F, Cai X, Li Y, et al. Association Between Indices of Body Composition and Metabolically Unhealthy Phenotype in China: a Cross-Sectional Study. Front Endocrinol. 2022;13:891327. doi:10.3389/fendo.2022.891327
22. Barrea L, Muscogiuri G, Pugliese G, et al. Metabolically Healthy Obesity (MHO) vs. Metabolically Unhealthy Obesity (MUO) Phenotypes in PCOS: association with Endocrine-Metabolic Profile, Adherence to the Mediterranean Diet, and Body Composition. Nutrients. 2021;13(11):3925. doi:10.3390/nu13113925
23. Wang Y, Pan L, Wan S, et al. Body fat and muscle were associated with metabolically unhealthy phenotypes in normal weight and overweight/obesity in Yi people: a cross-sectional study in Southwest China. Front Public Health. 2022;10:1020457. doi:10.3389/fpubh.2022.1020457
24. Valenzuela PL, Carrera-Bastos P, Castillo-Garcia A, et al. Obesity and the risk of cardiometabolic diseases. Nat Rev Cardiol. 2023;20(7):475–494. doi:10.1038/s41569-023-00847-5
25. Machann J, Stefan N, Wagner R, et al. Normalized Indices Derived from Visceral Adipose Mass Assessed by Magnetic Resonance Imaging and Their Correlation with Markers for Insulin Resistance and Prediabetes. Nutrients. 2020;12(7):2064. doi:10.3390/nu12072064
26. Esteve D, Boulet N, Belles C, et al. Lobular architecture of human adipose tissue defines the niche and fate of progenitor cells. Nat Commun. 2019;10(1):2549. doi:10.1038/s41467-019-09992-3
27. Antonopoulos AS, Tousoulis D. The molecular mechanisms of obesity paradox. Cardiovasc Res. 2017;113(9):1074–1086. doi:10.1093/cvr/cvx106
28. Ryden M, Andersson DP, Bergstrom IB, Arner P. Adipose tissue and metabolic alterations: regional differences in fat cell size and number matter, but differently: a cross-sectional study. J Clin Endocrinol Metab. 2014;99(10):E1870–E1876. doi:10.1210/jc.2014-1526
29. Vishvanath L, Gupta RK. Contribution of adipogenesis to healthy adipose tissue expansion in obesity. J Clin Invest. 2019;129(10):4022–4031. doi:10.1172/JCI129191
30. Yeoh AJ, Pedley A, Rosenquist KJ, Hoffmann U, Fox CS. The Association Between Subcutaneous Fat Density and the Propensity to Store Fat Viscerally. J Clin Endocrinol Metab. 2015;100(8):E1056–E1064. doi:10.1210/jc.2014-4032
31. Xia L, Dong F, Gong H, et al. Association between Indices of Body Composition and Abnormal Metabolic Phenotype in Normal-Weight Chinese Adults. Int J Environ Res Public Health. 2017;14(4):391. doi:10.3390/ijerph14040391
32. Smith U, Kahn BB. Adipose tissue regulates insulin sensitivity: role of adipogenesis, de novo lipogenesis and novel lipids. J Intern Med. 2016;280(5):465–475. doi:10.1111/joim.12540
33. Kim HK, Lee MJ, Kim EH, et al. Comparison of muscle mass and quality between metabolically healthy and unhealthy phenotypes. Obesity. 2021;29(8):1375–1386. doi:10.1002/oby.23190
34. Zisman A, Peroni OD, Abel ED, et al. Targeted disruption of the glucose transporter 4 selectively in muscle causes insulin resistance and glucose intolerance. Nat Med. 2000;6(8):924–928. doi:10.1038/78693
35. Frontera WR, Ochala J. Skeletal muscle: a brief review of structure and function. Calcif Tissue Int. 2015;96(3):183–195. doi:10.1007/s00223-014-9915-y
 © 2024 The Author(s). This work is published and licensed by Dove Medical Press Limited. The
full terms of this license are available at https://www.dovepress.com/terms
and incorporate the Creative Commons Attribution
- Non Commercial (unported, 3.0) License.
By accessing the work you hereby accept the Terms. Non-commercial uses of the work are permitted
without any further permission from Dove Medical Press Limited, provided the work is properly
attributed. For permission for commercial use of this work, please see paragraphs 4.2 and 5 of our Terms.
© 2024 The Author(s). This work is published and licensed by Dove Medical Press Limited. The
full terms of this license are available at https://www.dovepress.com/terms
and incorporate the Creative Commons Attribution
- Non Commercial (unported, 3.0) License.
By accessing the work you hereby accept the Terms. Non-commercial uses of the work are permitted
without any further permission from Dove Medical Press Limited, provided the work is properly
attributed. For permission for commercial use of this work, please see paragraphs 4.2 and 5 of our Terms.