")
Back to Journals » International Journal of General Medicine » Volume 16
Body Composition in Outpatient Children with Cerebral Palsy: A Case-Control Study
Authors Szkoda L, Szopa A , Kwiecień-Czerwieniec I, Siwiec A, Domagalska-Szopa M
Received 14 October 2022
Accepted for publication 20 December 2022
Published 24 January 2023 Volume 2023:16 Pages 281—291
DOI https://doi.org/10.2147/IJGM.S393484
Checked for plagiarism Yes
Review by Single anonymous peer review
Peer reviewer comments 2
Editor who approved publication: Dr Scott Fraser
Lawia Szkoda,1 Andrzej Szopa,1 Ilona Kwiecień-Czerwieniec,2 Andrzej Siwiec,2 Małgorzata Domagalska-Szopa3
1Department of Physiotherapy, Medical University of Silesia in Katowice, Katowice, Poland; 2John Paul II Pediatric Center in Sosnowiec, Sosnowiec, Poland; 3Department of Developmental Age Physiotherapy, Medical University of Silesia in Katowice, Katowice, Poland
Correspondence: Małgorzata Domagalska-Szopa, Department of Developmental Age Physiotherapy, Medical University of Silesia in Katowice, Katowice, Poland, Tel +48 601 516 725, Email [email protected]
Purpose: The purpose of this study was to identify quantitative (BMI z-score and BMI percentile) and qualitative (BC) differences between high functioning outpatient children with CP (GMFCS levels I/II) vs TD children, using BIA. We hypothesized that: 1) BMI z-score and BMI percentile will be lower in children with CP compared with their TD peers; and 2) body components (BC) directly associated with muscle mass (including fat free mass (FFM%) and skeletal muscle mass (SMM) and predicted muscle mass (PMM)) in children with CP will be lower than in their TD peers.
Patients and Methods: Ninety children with CP (GMFCS levels I/II) aged 8– 16 years were enrolled in this study. Due to the fact that there is lack of normative values of particular body components in the pediatric population, ninety typically developing (TD) peers were used as references. The examination consisted of two parts: 1) the height measurement and 2) body composition assessments, both using the bioelectric impedance analysis (BIA).
Results: Average values for height, weight, BMI z-score, and BMI percentile in children with CP were significantly statistically lower than in the reference group. BC’s directly associated with muscle mass (including FFM%, SMM, and PMM) in children with CP were lower than those in their TD peers.
Conclusion: Altered body compositions were evident in children with CP.
Keywords: cerebral palsy, body composition, bioelectric impedance analysis
Introduction
Ambulatory children with cerebral palsy (CP) (Gross Motor Function Classification System I and II; GMFCS I/II) cannot maintain the standing position as long as typically developing (TD) children. As a consequence, their musculoskeletal system is not under full physiological axial compression, which may result in the inabilities to obtain adequate peak bone mass and lead to muscle and fat mass deficiency.1,2 In addition, changes in motor control organization in children with CP caused by early brain damage may modify the contractility and viscosity of muscle fibers, which may result in muscle stiffness, contractures, or muscle fiber atrophy.3–7 Moreover, due to muscle paresis or/and spasticity, children with CP require more energy input to perform daily activities, such as maintaining sitting or standing positions and walking.8 In addition, in CP, as in many other chronic diseases, fat-free mass (FFM) and predicted muscle mass (PMM) are reduced due to poor physical activity.9 These factors may explain the general body mass deficiency and malnutrition in some children with CP.10,11
Although several recent studies have confirmed that children with CP have deviations from normal growth parameters, according to the World Health Organization, and from the normative body mass and height values reported by the Centers for Disease Control and Prevention in the United States,12,13 they are based on body mass index (BMI) calculation. Because BMI does not capture the high fat mass and low fat-free-mass in children with CP,13 there is no literature review on the subject and consensus that the body weight-for-age (BMI-for-age) in children with CP differs from TD peers.14–16 As BMI may not reflect the actual level of obesity or thinness in children with CP, an assessment of body composition (BC) is recommended.14–16
Gold standards for BC assessment include the doubly labeled water (DLW) and dual energy X-ray absorptiometry (DEXA) methods. However, these methods are scarcely used in clinical practice due to long and complicated measurement processes, high costs, and radiation levels involved.17 As an alternative to assessing BC in pediatric populations, including children with CP, the bioelectric impedance analysis (BIA) has recently been introduced.8,13 Although several previous studies have reported altered BC in children with CP, these results were based on selected parameters of BC and they related to mixed population of children with CP representing differential functional level.7,18–21
Therefore, the purpose of this study was to identify quantitative (BMI z-score and BMI percentile) and qualitative (BC) differences between high functioning outpatient children with CP (GMFCS levels I/II) vs TD children, using BIA. We hypothesized that: 1) BMI z-score and BMI percentile will be lower in children with CP compared with their TD peers; and 2) body components (BC) directly associated with muscle mass (including fat free mass (FFM%) and skeletal muscle mass (SMM) and predicted muscle mass (PMM)) in children with CP will be lower than in their TD peers.
Materials and Methods
The study was approved by the Bioethics Committee of our institution (KNW/0022/KB1/38/18). Before examinations, parents or caregivers were informed of the confidentiality, purpose, and procedures of the study and all questions were answered. Participation in the study was voluntary, and parents or caregivers were informed of the possibility to withdraw from the study without reason. The children were tested after obtaining written parental informed consent. This study was performed in accordance with the Code of Ethics of the World Medical Association (Declaration of Helsinki). Before participant recruitment, a minimal sample size to obtain reliable results was estimated using G*Power 3.1.9.4 (power: 80%, alpha level [α] = 0.05), which showed that the required sample size, N, was 180.
Participants
One hundred children with CP who had participated in a 3-week rehabilitation program in John Paul II Pediatric Center in Sosnowiec, Poland were enrolled in this study. The inclusion criteria were: 1) diagnosed and clinically confirmed CP GMFCS levels I/II, 2) age 8–16 years, 3) ability to maintain a standing position for 10 minutes, and 4) informed consent given by parents or caregivers. The exclusion criteria were 1) severe or chronic diseases other than cerebral palsy and 2) inability to understand and execute verbal commands. As 10 participants did not come to the tests, ninety children with CP, who met the inclusion criteria were included in the study.
Due to the fact that there is lack of normative values of particular components in the total body mass in the pediatric population, typically developing (TD) peers were used as references (reference group). The reference group consisted of ninety TD children strictly matched for gender and age (in a 1:1 case-control manner) to the children from study group. They were students of local primary and secondary schools. The inclusion criteria were: 1) no neurological postural and movement disorders based on a medical booklet, 2) age from 8 to 16 years, 3) ability to maintain the standing position for 10 minutes, and 4) a conscious consent given by parents/caregivers for the child’s participation in the study. The exclusion criteria from the reference group were 1) severe or chronic diseases and 2) inability to understand and to execute commands.
Methods
The examination consisted of two parts: 1) the height measurement and 2) body composition assessments. Both measurements were performed using the TANITA scale MC-780 S MA (TANITA Corporation, Japan in Tokyo (1–14-2 Maeno-cho, Itabashi-ku, Tokyo 174–8630, Japan)).
During the measurements, participants wore underwear and stood upright on a scale in a relaxed position on the body composition analyzer. All measurements were performed in the afternoon, after the participants had consumed a light breakfast at approximately 9 o’clock and before dinner (ie, between 11 and 13:00). Based on body mass and height measurements, the following indices were calculated: 1) BMI, calculated as weight divided by height squared (kg/m2) and 2) BMI z-score and BMI percentiles, calculated using the AnthroPlus application for age and sex, according to the World Health Organization (WHO).22 Then the individual body composition parameters were calculated (Table 1).
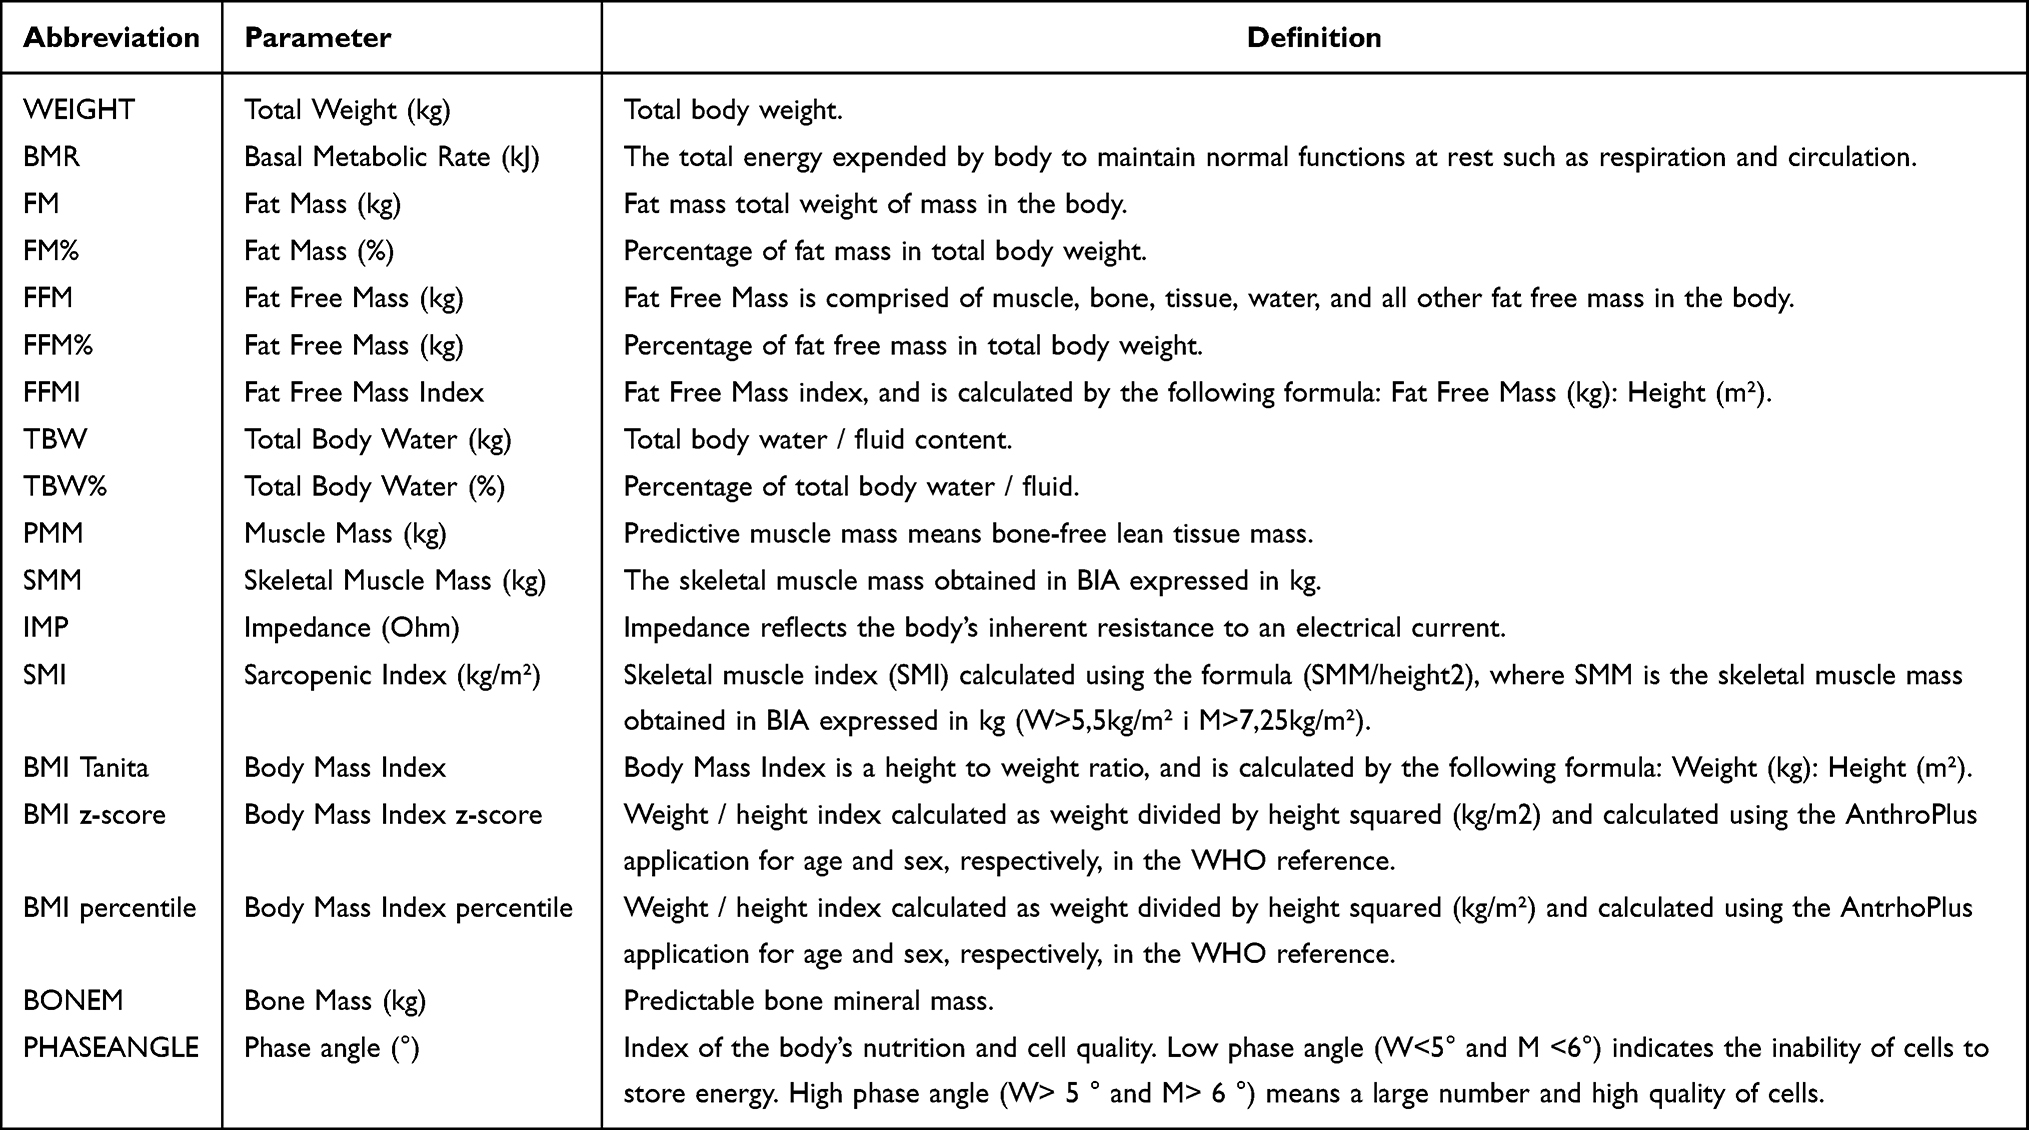 |
Table 1 Body Mass Composition Parameters |
Statistical Analysis
Normality of the data was assessed using Shapiro–Wilk tests. Basic descriptive statistics were calculated and presented in the tables as means and standard deviations and minimum and maximum values for variables with normal distributions. Non-normally distributed variables were reported as medians and upper and lower limits of confidence intervals.
A comparative analysis of the measured parameters was carried out between study and reference groups using the Student’s t-test for normally distributed variables. To assess the effect of CP on body composition rates, aligned ranks transformed multifactorial analysis of variance (ANOVA) was performed with a subsequent Bonferroni post hoc analysis. To verify the effect of CP on predictable bone mineral mass (BONEM) and on basal metabolic rate (BMR) simultaneously with growth control, multivariable regression analyses were performed. To evaluate the correlation between body composition rates and the age, height, and BMI of participants, Pearson’s correlation tests were conducted. Correlation coefficients were interpreted according to Altman’s model as follows: Rs<0.2, poor; 0.21–0.4, low; 0.41–0.6, moderate; 0.61–0.8, high; and 0.81–1.00, very high.23 All statistical analyses were performed using RStudio 1.2.1. software, and the level of significance was set at α = 0.05.
Results
Demographic and anthropometric data of the study and reference groups are presented in Table 2. Average values for height, weight, BMI z-score, and BMI percentile in children with CP were significantly statistically lower than those in the reference group (Table 2). To assess the number of children who were underweight or overweight, participants were divided into the following three categories based on BMI percentiles: 1) underweight, 2) normal weight, and 3) overweight and obesity (Figure 1). A significant number of children with cerebral palsy were underweight, 42 (47%), while the number of children who were underweight in the reference group was 21 (23%). The number of children with normal weights were similar between the children with CP (32%) and the reference group (28%). Details are presented in Figure 1.
 |
Table 2 Demographic and Antropometric Data of the Study and Reference Groups |
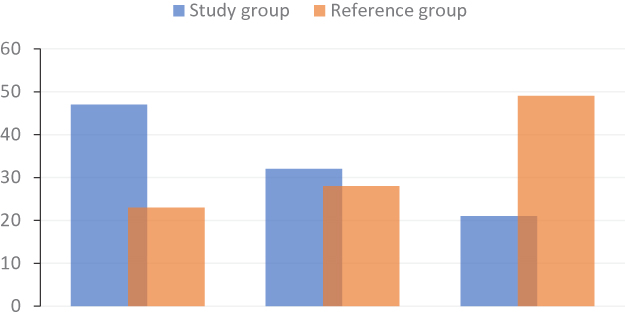 |
Figure 1 Sex-specific BMI percentiles in both groups: thinness (<10c); normal (25–75c); overweight and obese (>75c). |
The inter-group comparative analysis of individual components of BC showed that the study group significantly differed from the reference group in all assessed BC parameters, except for impedance (Table 3). The variables of body composition directly associated with muscle mass, such as fat free mass (FFM [kg]), percentage of fat free mass (FFM%), fat free mass index (FFMI [kg/m²]), predicted muscle mass (PMM [kg]), skeletal muscle mass (SMM [kg]) and skeletal muscle index (SMI [kg/m²]), were significantly lower in children with CP than in the control group (Table 3). The remaining parameters, such as basic metabolic rate (BMR [kJ]), percentage of fat mass (FM%), and fat mass (FM [kg]) were also significantly lower in children with CP, with the exception of percentage of total body water (TBW%), which measured the body water content (Table 3).
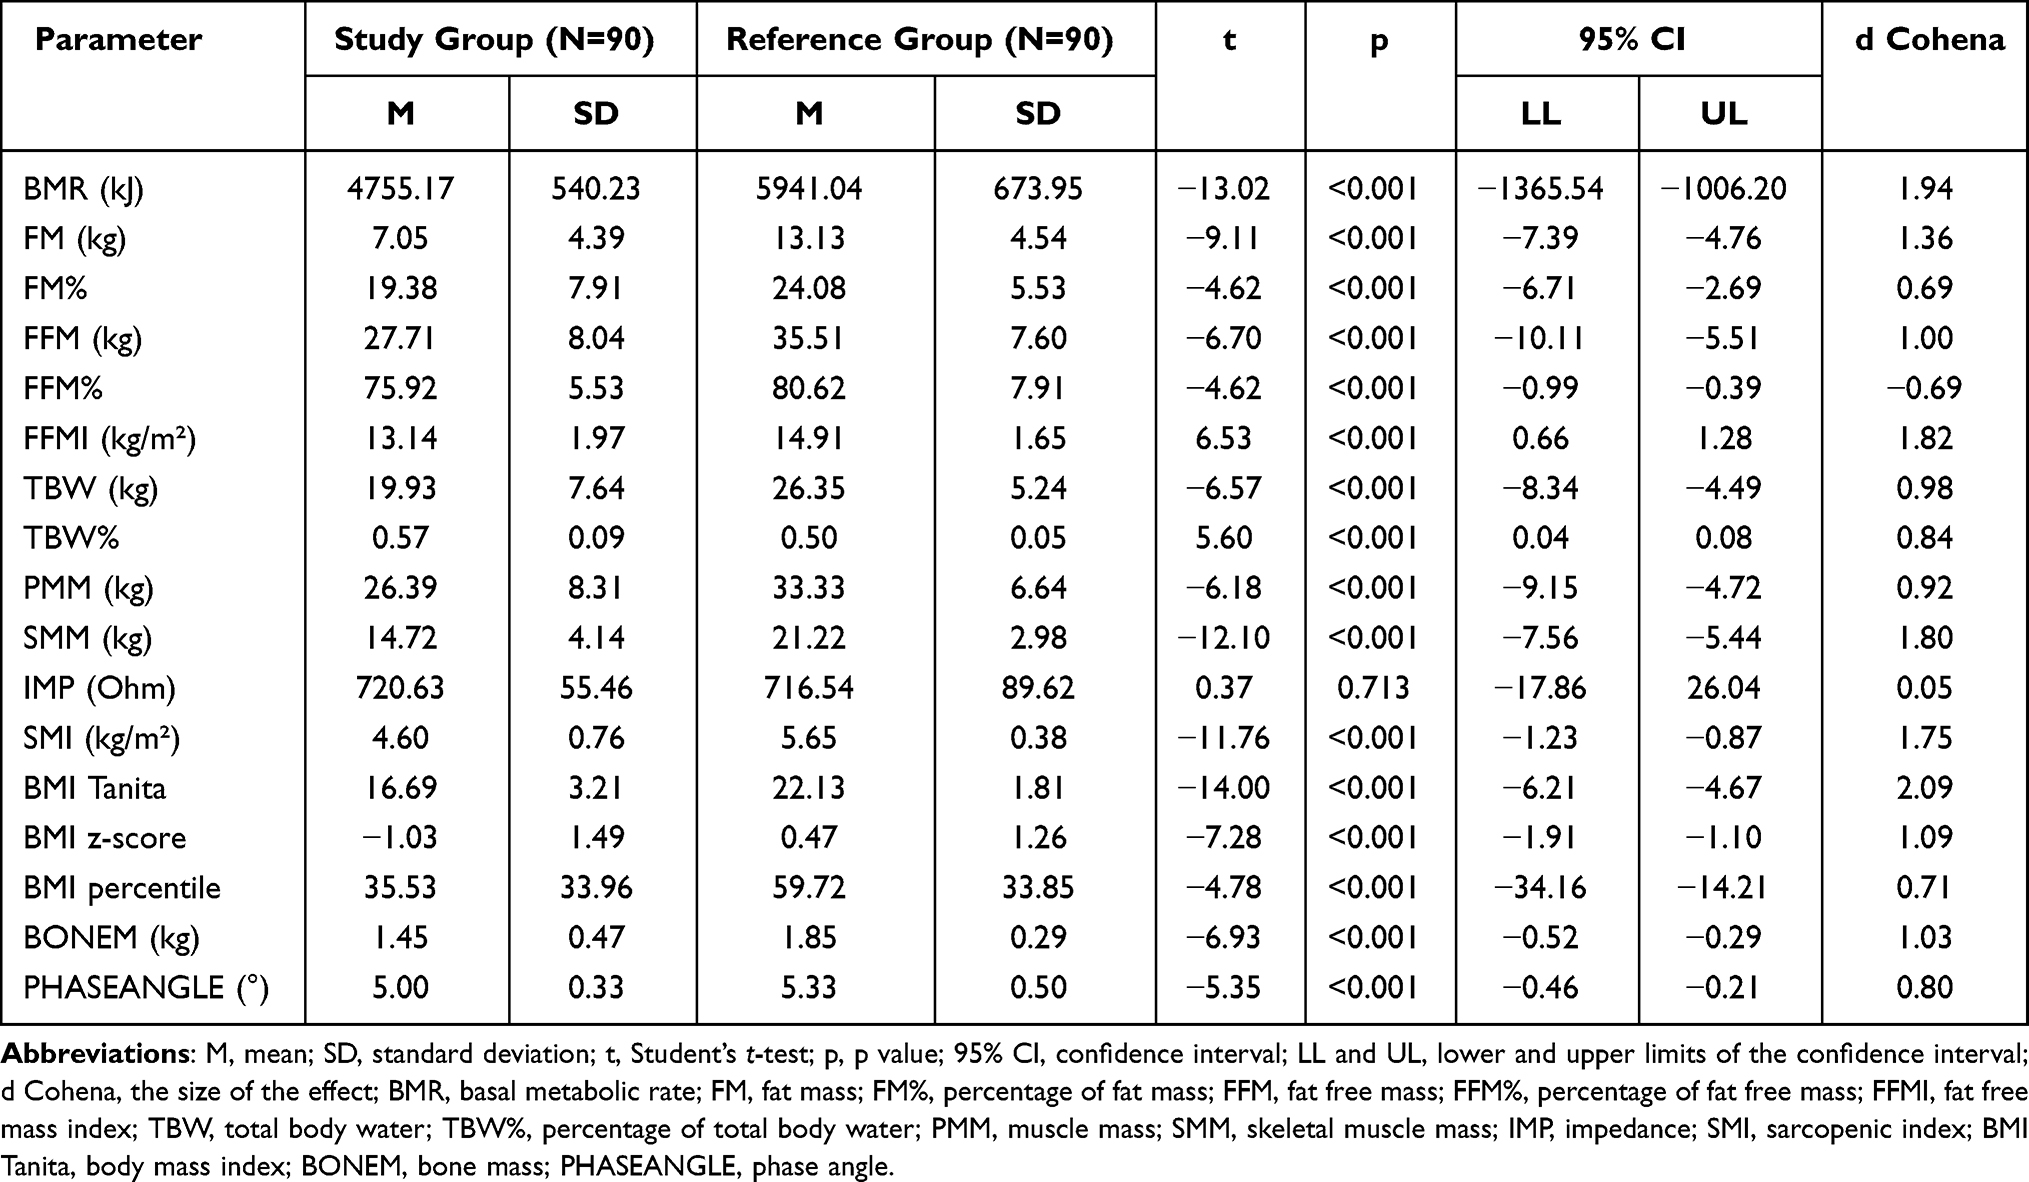 |
Table 3 Descriptive Characteristics of Individual Body Mass Components’ Parameters and Statistical Analysis |
To evaluate the influence of CP on body mass composition, in terms of the sex and age of the children, the Aligned Rank Transform (ART) ANOVA was performed, with independent variables 1) diagnosis (the study group vs the reference group), 2) sex (female/male), and 3) age of participants (younger children vs older children). The dependent variables were BMI Tanita, BMI z-score, BMI percentile, as well as parameters of body composition. The results of the main effects of group (study vs reference), gender (female and male), and ages (younger children and older children) in each component of body mass and effect of interactions are presented in Table 4. The findings confirmed that BMI z-scores and BMI percentiles in the study group were lower than those in the reference group (main group effect; F =9.43; p<0.002; F =8.35; p<0.004, respectively) (Table 4), while no significant differences were found in BMI (Table 4). Likewise, body components related to fat mass (FM [kg]; FM%) were lower in the study group (main group effect; F =53.09; p<0.001; F =12.41, p<0.001 respectively) (Table 4). Also, the majority of body components directly associated with muscle mass, including FFM (kg), PMM (kg), SMM (kg) and SMI (kg/m²) was lower in children with CP compared with their TD peers (main group effects), with the exception of the indices of fat free mass, including FFM% and FFMI (kg/m²) (Table 4). Additionally, several interaction effects between groups and age in the parameter’s analysis were noted (Table 4). These effects showed that, in children with CP, younger children generally had lower values of the abovementioned parameters compared with those that were older. This difference was not observed among children in the reference group (Table 4).
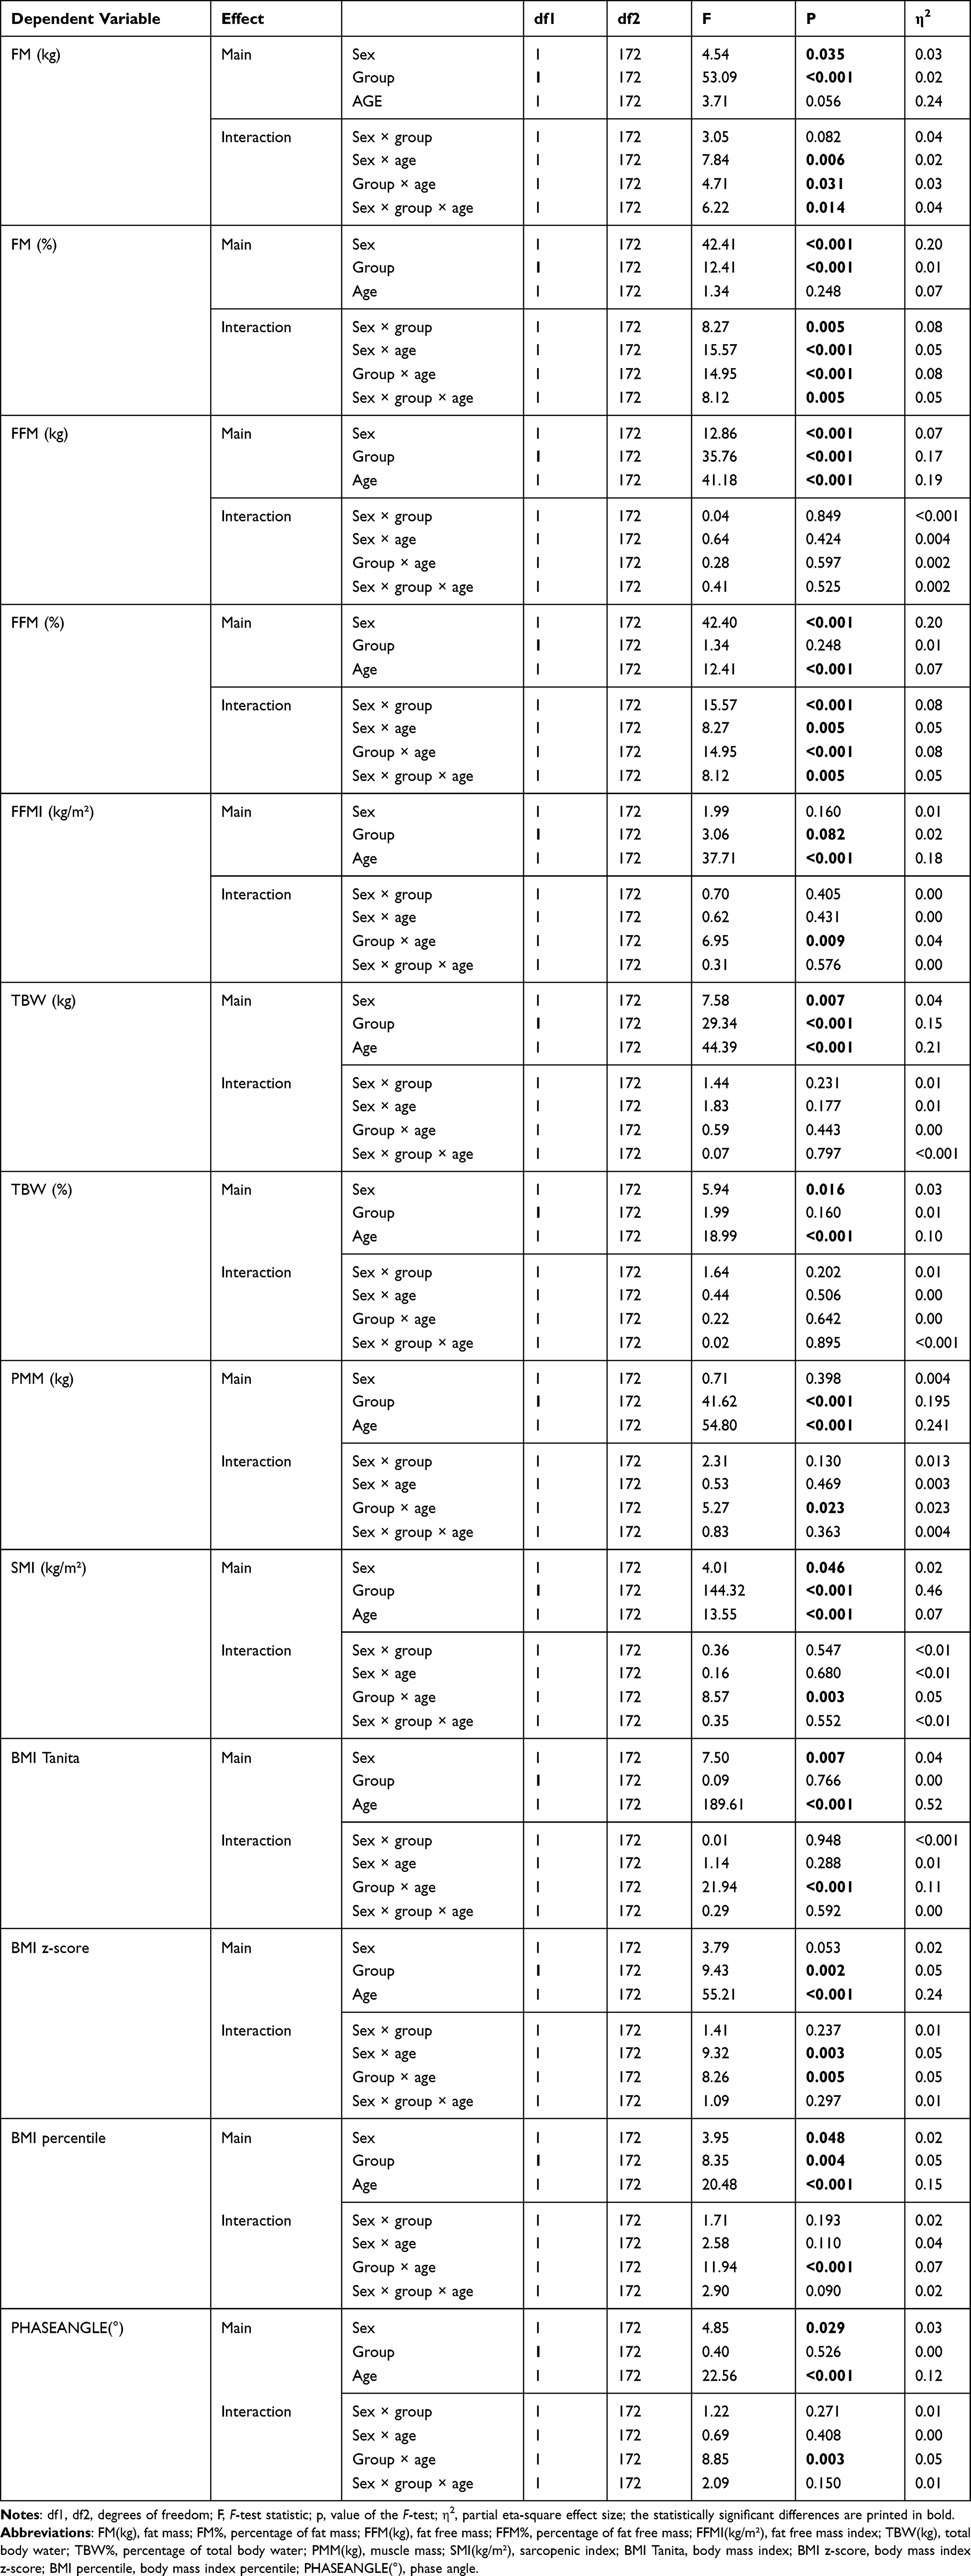 |
Table 4 Rates of Three Factorial Variation Analysis Model |
To assess the influence of CP on BMR and Predictable bone mineral mass (BONEM) in relation to body height, a multifactorial regression analysis with interactions was performed (Table 5). The results showed that, despite the statistically significant difference in BMR between the study and reference groups (Table 4), there were no group effects noted (Table 5). Moreover, in assessing the impact of CP on BONEM, poor interactions between group and height were observed, indicating that a shorter height and CP are significant predictors of low BONEM (Figure 2, Table 5). Analyses of the correlations among demographic and anthropometric parameters, such as age, height, BMI, BMI percentile, and BMI z-score, with body composition parameters showed several positive correlations (0.26<r<0.89; p<0.01) (Table 6).
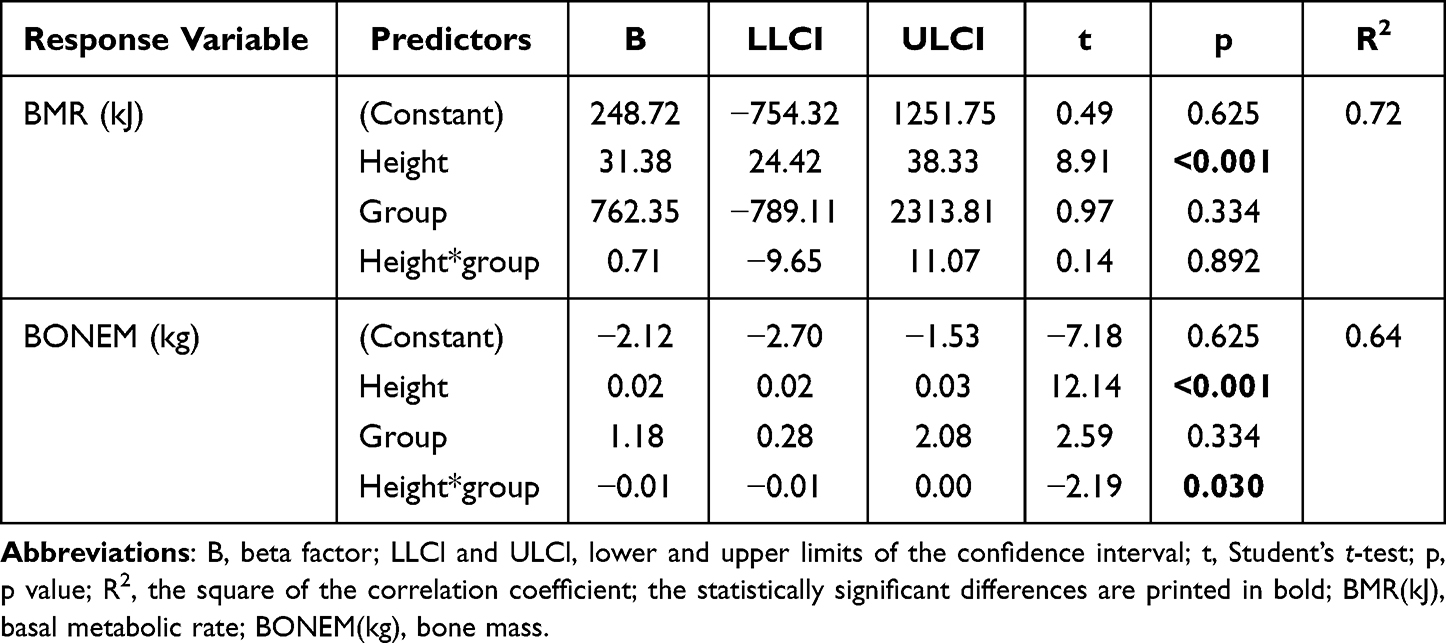 |
Table 5 Linear Regression Model Ratios |
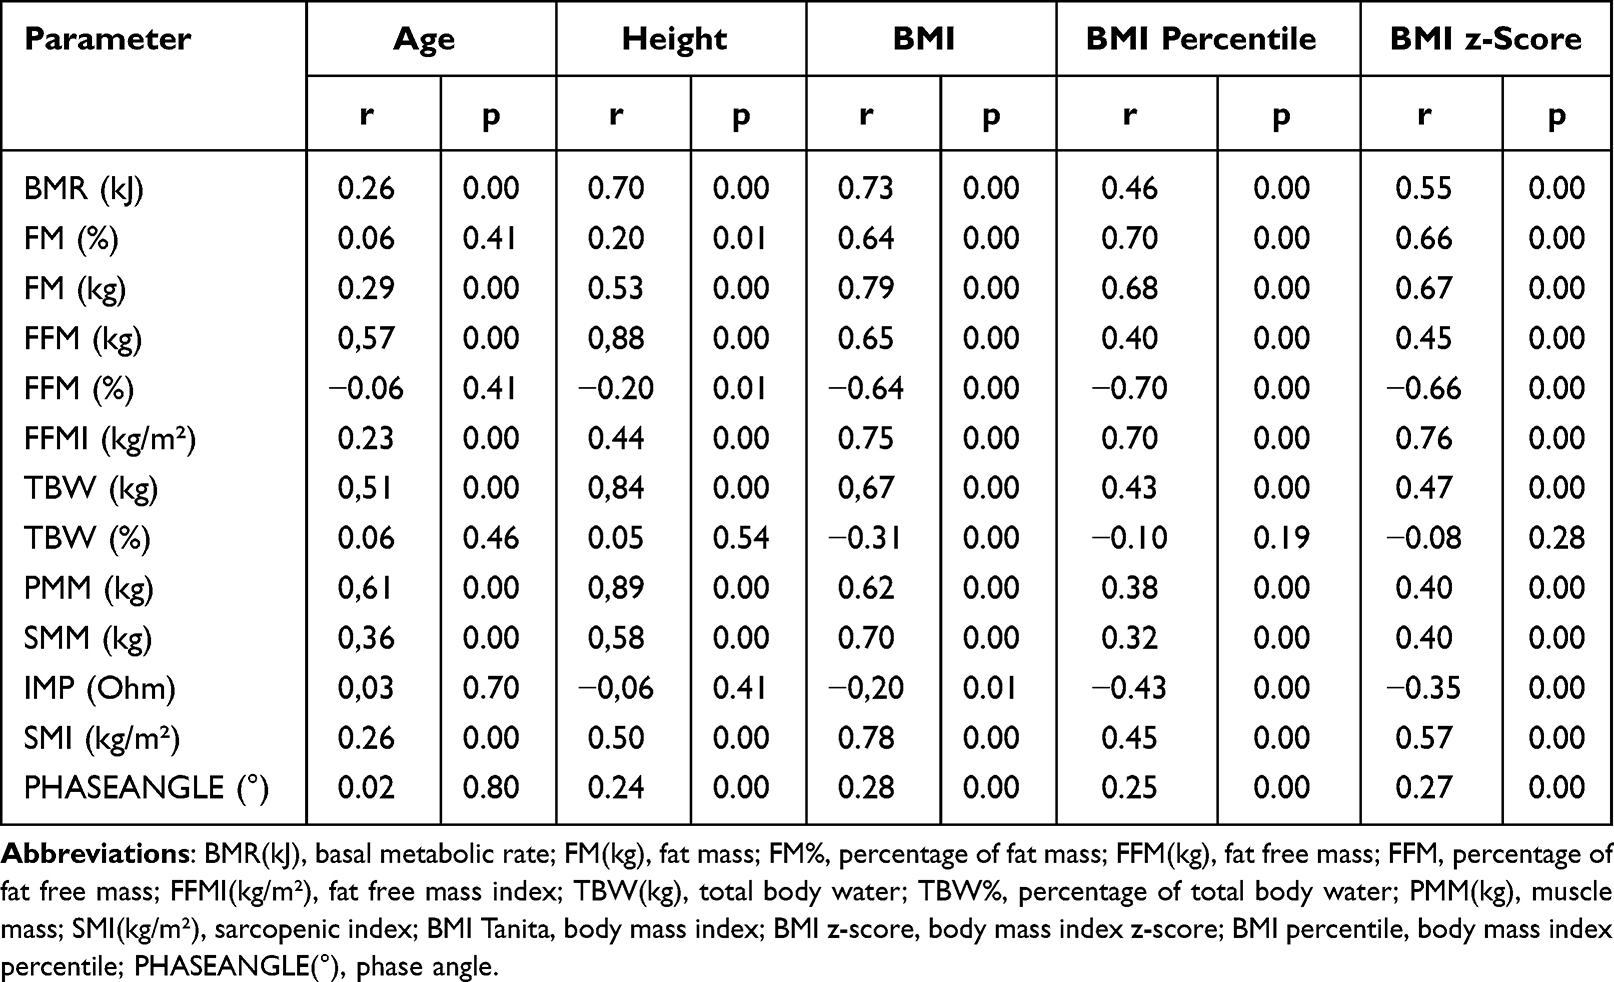 |
Table 6 Pearson’s r Correlations Between Age, Height, and BMI and Individual Quantitative Body Composition Measures Without Group Breakdown |
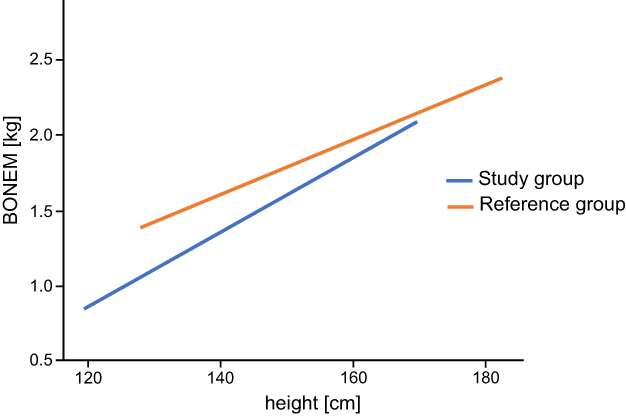 |
Figure 2 Regression line for a variable BONEM in a group division. |
Discussion
In the present study, both quantitative (BMI z-score and BMI percentile) and qualitative (individual body mass components) differences between high-functioning ambulatory children with CP and their TD peers were assessed. Although BMI z-score and BMI-for-age percentile growth charts are the most commonly used indicators, their value in measuring the size and growth patterns of children is not fully recognized. Several recent studies have suggested that children with CP, particularly those with GMFCS I and II, have high BMIs and are at risk of being overweight and obese.14,15 In contrast, other studies have suggested that even high-functioning, ambulatory patients with CP are at risk of malnutrition.16 Despite our study not resolving this particular discrepancy, our findings showed that children with CP had lower body weight and/or height in comparison with those observed in the reference group. Moreover, their body mass deficiencies were more prevalent compared with their TD peers.
Although, as reported in several previous studies,20,24,25 the BMI of children with CP did not differ from TD children, the comparison of anthropometric characteristics in our study showed that the high-functioning, Polish children with CP had significantly lower BMIs, expressed by BMI z-score and BMI percentile. Thus, our first hypothesis was confirmed.
Moreover, our results were consistent with other recent studies that showed lower BMI z-scores and BMI percentiles in children with CP.11,16,21 For instance, both Finbraten et al as well as Henderson et al reported growth suppression in children with CP, which resulted in shorter heights and decreased body mass in comparison with their TD peers.11,26 Also, Feeley et al reported the occurrence of lower body mass in ambulatory American patients with CP, which suggested that even high-functioning patients with CP may be at risk of malnutrition.16 Given that over half of the participants in our study group were children with spastic diplegia, who are often children prematurely born and with low birth weights, their growth retardation may seem justified here. However, due to concerns with the reliability of BMI measurements in children, these results may be insufficient. As both malnutrition and high BMI are often diagnosed in children with CP when based solely on BMI, assessing body mass in this population with more reliable measures is necessary.8,26,27
To dispel these doubts in our study, quantitative body mass assessments based on BMI were extended through the use of qualitative assessments of individual body components. Advanced statistical analyses including both inter-group comparative analysis and Aligned Rank Transform (ART) ANOVA, as well as a multifactorial regression analysis with the interactions, revealed altered BC in children with CP. In our study we found lower levels in the individual body components directly associated with muscle mass in the children with CP compared with the TD children. Although several previous studies confirmed altered BC in children with CP, these results were based on selected parameters of BC (mainly fat mass and low free-fat-mass) and they related to mixed population of children with CP including GMFCS levels from I to V.8,13,18,20,21 Both research teams of Walker et al and Oftedal et al reported significantly lower fat-free mass levels in children with CP with GMFCS levels III, IV, and V compared with TD children.8,20 Similarly, Więch at al recognized lower levels of FFM (kg), muscle mass (MM [kg]), and body cell mass (BCM [kg]) in children with CP GMFCS levels III, IV, and V.18 Whitney at al also noted lower FFM (kg) and FFM% levels in children with CP.13 The results of our study also confirmed our second hypothesis that body mass components directly associated with muscle mass (including FFM%, SMM, and PMM) in children with CP were lower than those in their TD peers. Additionally, children with CP had lower FFM (kg) and SMI (kg/m²) values. These findings can have a significant impact on the general health and functional abilities of children with CP, even those that may be high-functioning.
Limitations
Although presented findings may be promising, our study had several limitations. First, our study analyzed the body composition of children with CP, however the obtained results were compared with a reference group of TD equivalents as opposed to reference values. This was due to the lack of available reference data in pediatric populations. Second, although we assessed the participants according to age and sex, their stage of puberty, which can influence body mass and composition, was not assessed. Third, although the study population included high-functioning children with CP, they were heterogeneous in CP types and included both unilateral and bilateral CP.
Conclusion
Considering the limitations, we concluded:
1. the usage of bioelectric impedance may assist in identifying both quantitative and qualitative differences in body mass in children with cerebral palsy compared with their healthy peers.
2. Altered body compositions were evident in children with CP.
3. To confirm the importance of these results, further studies are needed to identify associations between FFM and SMM in homogeneous samples of children, separately analyzing those with unilateral and bilateral CP.
Data Sharing Statement
The data that support the findings of this study are available via a data access agreement. Please contact the corresponding author for this request.
Ethics Committee Approval
This study was approved by the Ethical Committee of the Medical University of Silesia (KNW/0022/KB1/38/18, approval date is 15 May 2018). All trial participants provided informed consent and the trial was conducted in accordance with the Declaration of Helsinki.
Author Contributions
All authors made a significant contribution to the work reported, whether that is in the conception, study design, execution, acquisition of data, analysis and interpretation, or in all these areas; took part in drafting, revising or critically reviewing the article; gave final approval of the version to be published; have agreed on the journal to which the article has been submitted; and agree to be accountable for all aspects of the work.
Funding
This research received no external funding.
Disclosure
The authors declare that they have no competing interests in this work.
References
1. Snik DAC, de Roos NM. Criterion validity of assessment methods to estimate body composition in children with cerebral palsy: a systematic review. Ann Phys Rehabil Med. 2021;64(3):101271. doi:10.1016/j.rehab.2019.05.003
2. García Contreras AA, Vásquez Garibay EM, Sánchez Ramírez CA, Fafutis Morris M, Delgado Rizo V. Factors associated with the stool characteristics of children with cerebral palsy and chronic constipation. Rev Esp Enferm Dig. 2020;112(1):41–46. doi:10.17235/reed.2019.6313/2019
3. Baxter P, Rosenbloom L. CP or not CP? Dev Med Child Neurol. 2005;47(8):507. doi:10.1017/S001216220500099X
4. De Graaf-Peters VB, Hadders-Algra M. Ontogeny of the human central nervous system: what is happening when? Early Hum Dev. 2006;82(4):257–266. doi:10.1016/j.earlhumdev.2005.10.013
5. Kalyani RR, Corriere M, Ferrucci L. Age-related and disease-related muscle loss: the effect of diabetes, obesity, and other diseases. Lancet Diabetes Endocrinol. 2014;2(10):819–829. doi:10.1016/S2213-8587(14)70034-8
6. Hallman-Cooper JL, Rocha Cabrero F. Cerebral palsy. In: In StatPearls [Internet]. Treasure Island (FL): StatPearls Publishing; 2021.
7. Garcia Iniguez JA, Vásquez Garibay EM, García Contreras AA, et al. Energy expenditure is associated with age, anthropometric indicators and body composition in children with spastic cerebral palsy. Nutr Hosp. 2018;35(4):909–913. doi:10.20960/nh.1696
8. Walker JL, Bell KL, Stevenson RD, et al. Differences in body composition according to functional ability in preschool-aged children with cerebral palsy. Clin Nutr. 2015;34(1):140–145. doi:10.1016/j.clnu.2014.02.007
9. Duran I, Schulze J, Martakis K, Stark C, Schoenau E. Diagnostic performance of body mass index to identify excess body fat in children with cerebral palsy. Dev Med Child Neurol. 2018;60(7):680–686. doi:10.1111/dmcn.13714
10. Keawutan P. Longitudinal physical activity and sedentary behaviour in preschool-aged children with cerebral palsy across all functional levels. Dev Med Child Neurol. 2017;59(8):852–857. doi: 10.1111/dmcn.13439
11. Finbråten AK, Martins C, Andersen GL, et al. Assessment of body composition in children with cerebral palsy: a cross-sectional study in Norway. Dev Med Child Neurol. 2015;57(9):858–864. doi:10.1111/dmcn.12752
12. Day SM, Strauss DJ, Vachon PJ, et al. Growth patterns in a population of children and adolescents with cerebral palsy. Dev Med Child Neurol. 2007;49(3):167–171. doi:10.1111/j.1469-8749.2007.00167.x
13. Whitney DG, Miller F, Pohlig RT, Modlesky CM. BMI does not capture the high fat mass index and low fat-free mass index in children with cerebral palsy and proposed sta-tistical models that improve this accuracy. Int J Obes. 2019;43(1):82–90. doi:10.1038/s41366-018-0183-1
14. Hurvitz EA, Green LB, Hornyak JE, Khurana SR, Koch LG. Body mass index measures in children with cerebral palsy related to gross motor function classification: a clinic-based study. Am J Phys Med Rehabil. 2008;87(5):395–403. doi:10.1097/PHM.0b013e3181617736
15. Pascoe J, Thomason P, Graham HK, Reddihough D, Sabin MA. Body mass index in ambulatory children with cerebral palsy: a cohort study. J Paediatr Child Health. 2016;52(4):417–421. doi:10.1111/jpc.13097
16. Feeley BT, Gollapudi K, Otsuka NY. Body mass index in ambulatory cerebral palsy patients. J Pediatr Orthop B. 2007;16(3):165–169. doi:10.1097/01.bpb.0000236230.44819.95
17. Noradilah MJ, Ang YN, Kamaruddin NA, et al. Assessing body fat of children by skinfold thickness, bioelectrical impedance analysis, and dual-energy X-ray absorptiometry: a validation study among malay children aged 7 to 11 years. Asia Pac J Public Health. 2016;28(5 Suppl):74–84. doi:10.1177/1010539516641505
18. Więch P, Ćwirlej-Sozańska A, Wiśniowska-Szurlej A, et al. The relationship between body composition and muscle tone in children with cerebral palsy: a case-control study. Nutrients. 2020;12(3):864. PMID: 32213841; PMCID: PMC7146599. doi:10.3390/nu12030864
19. Costa A, Martin A, Arreola V, et al. Assessment of swallowing disorders, nutritional and hydration status, and oral hygiene in students with severe neurological disabilities including cerebral palsy. Nutrients. 2021;13(7):2413. doi:10.3390/nu13072413
20. Oftedal S, Davies PS, Boyd RN, et al. Body composition, diet, and physical activity: a longitudinal cohort study in preschoolers with cerebral palsy. Am J Clin Nutr. 2017;105(2):369–378. doi:10.3945/ajcn.116.137810
21. Sung KH, Chung CY, Lee KM, et al. Differences in body composition according to gross motor function in children with cerebral palsy. Arch Phys Med Rehabil. 2017;98(11):2295–2300. doi:10.1016/j.apmr.2017.04.005
22. World Health Organization. AnthroPlus for Personal Computer. Software for assessing growth of the world’s children and adolescents. Available from: https://www.who.int/growthref/tools/who_anthroplus_manual.pdf.
23. Altman DG. Practical statistics for medical research chapman and hall/CRC; 1991.
24. Johnson DL, Miller F, Subramanian P, Modlesky CM. Adipose tissue infiltration of skeletal muscle in children with cerebral palsy. J Pediatr. 2009;154(5):715–720. doi:10.1016/j.jpeds.2008.10.046
25. Whitney DG, Singh H, Miller F, et al. Cortical bone deficit and fat infiltration of bone marrow and skeletal muscle in ambulatory children with mild spastic cerebral palsy. Bone. 2017;94:90–97. doi:10.1016/j.bone.2016.10.005
26. Henderson RC, Grossberg RI, Matuszewski J, et al. Growth and nutri-tional status in residential center versus home-living children and adolescents with quad-riplegic cerebral palsy. J Pediatr. 2007;151(2):161–166. doi:10.1016/j.jpeds.2007.02.060
27. Brooks J, Day S, Shavelle R, Strauss D. Low weight, morbidity, and mortality in chil-dren with cerebral palsy: new clinical growth charts. Pediatrics. 2011;128(2):299–307. doi:10.1542/peds.2010-2801
 © 2023 The Author(s). This work is published and licensed by Dove Medical Press Limited. The full terms of this license are available at https://www.dovepress.com/terms.php and incorporate the Creative Commons Attribution - Non Commercial (unported, v3.0) License.
By accessing the work you hereby accept the Terms. Non-commercial uses of the work are permitted without any further permission from Dove Medical Press Limited, provided the work is properly attributed. For permission for commercial use of this work, please see paragraphs 4.2 and 5 of our Terms.
© 2023 The Author(s). This work is published and licensed by Dove Medical Press Limited. The full terms of this license are available at https://www.dovepress.com/terms.php and incorporate the Creative Commons Attribution - Non Commercial (unported, v3.0) License.
By accessing the work you hereby accept the Terms. Non-commercial uses of the work are permitted without any further permission from Dove Medical Press Limited, provided the work is properly attributed. For permission for commercial use of this work, please see paragraphs 4.2 and 5 of our Terms.