Back to Journals » Diabetes, Metabolic Syndrome and Obesity » Volume 13
Body Composition and the Components of Metabolic Syndrome in Type 2 Diabetes: The Roles of Disease Duration and Glycemic Control
Authors Abulmeaty MMA ![]() , Aljuraiban GS
, Aljuraiban GS ![]() , Alaidarous TA
, Alaidarous TA ![]() , Alkahtani NM
, Alkahtani NM
Received 8 February 2020
Accepted for publication 24 March 2020
Published 5 April 2020 Volume 2020:13 Pages 1051—1059
DOI https://doi.org/10.2147/DMSO.S248842
Checked for plagiarism Yes
Review by Single anonymous peer review
Peer reviewer comments 2
Editor who approved publication: Dr Konstantinos Tziomalos
Mahmoud MA Abulmeaty,1,2 Ghadeer S Aljuraiban,1 Thuraya A Alaidarous,3 Noura M Alkahtani4
1Department of Community Health Sciences, College of Applied Medical Sciences, King Saud University, Riyadh, Saudi Arabia; 2Medical Physiology Department, Faculty of Medicine, Zagazig University, Zagazig, Egypt; 3Clinical Nutrition Department, King Faisal Specialist Hospital and Research Centre, Riyadh, Saudi Arabia; 4Department of Endocrinology, King Faisal Specialist Hospital and Research Centre, Riyadh, Saudi Arabia
Correspondence: Mahmoud MA Abulmeaty
Department of Community Health Sciences, College of Applied Medical Sciences, King Saud University, Riyadh 11433, Saudi Arabia
Tel +966 548155983
Fax +966 114693715
Email [email protected]
Purpose: Data about body compositional changes throughout the course of type 2 diabetes (T2D) are limited and inconsistent. We investigated the roles of the disease duration and glycemic control in T2D-associated changes of body composition and the components of metabolic syndrome (MetS).
Patients and Methods: A total of 25 non-diabetic controls and 92 individuals aged 20– 60 years with T2D were included in a case–control study conducted at King Faisal Specialist Hospital, Saudi Arabia. Based on disease duration (newly diagnosed: within the first year and long duration: ≥ 5 years) and glycemic control (glycated hemoglobin [HbA1C] level ≤ 7%), the patients were divided into the following groups: newly diagnosed and controlled (N&C, n=25), newly diagnosed and uncontrolled (N&U, n=17), old and controlled (O&C, n=25), and old and uncontrolled (O&U, n=25). Blood samples were collected to assess fasting blood glucose level, HbA1C level, and lipid profile. Anthropometric data were evaluated, and body composition was assessed using a bio-impedancemetry analyzer. Nonparametric tests and multivariable logistic regression analyses were performed.
Results: Compared to the control group, the fat mass (FM) was significantly higher in all groups; furthermore, the fat mass/fat-free mass (FM/FFM) ratio was significantly higher in the N&C. The N&U and O&U groups showed significantly higher percentages of all components of MetS. Among all selected independent factors, only age increased the likelihood of MetS diagnosis by 7% (OR: 1.07; 95% CI: 1.004– 1.149; P< 0.05). Besides, age, gender, adherence to diet regimen, and T2D duration showed lower odds of increased FM/FFM ratio.
Conclusion: This study provided evidence about the impact of T2D on body composition and the other components of MetS. Thus, further characterization of T2D contributes to defining the etiology of the disease to detect and treat poor cardiometabolic health.
Keywords: type 2 diabetes, metabolic syndrome, disease duration, HbA1C, FM/FFM ratio, HOMA-IR
Introduction
Type 2 diabetes (T2D) is a highly prevalent metabolic disorder characterized by a state of insulin resistance and relative insulin deficiency.1–3 Currently, the condition affects more than 425 million people worldwide, and the number of individuals who will develop T2D can exceed 629 million by the year 2045.2 Meanwhile, multiple lifestyle and genetic factors contribute to the pathogenesis of T2D,1,3–5 and the specific etiologies of the disease are not yet fully understood. Moreover, several cases of T2D may remain undiagnosed long after its onset, thereby leading to severe life-threatening health problems.1,3–5 Thus, it is important from a clinical perspective that studies continually evaluate factors associated with poor health outcomes in T2D. Indeed, such research is essential in the prevention, early detection, and treatment of poor cardiometabolic health.
Atherosclerotic cardiovascular disease is the leading cause of morbidity and mortality in individuals with T2D.6–8 A high risk of cardiovascular disease is correlated to obesity and the other components of metabolic syndrome (MetS), including hyperlipidemia and insulin resistance, in those with T2D.9,10 Thus, appropriate research aiming to define factors contributing to poor T2D-related health outcomes must focus particularly on these metabolic impairments. Indeed, most individuals with T2D are overweight or obese,11 and T2D patients who are not considered overweight or obese may still have a high percentage of body fat primarily in the abdominal region.11–13
Current studies have indicated that impaired glycemic control and disease duration are the two major contributing factors that affect body composition in individuals with T2D.14,15 However, data about fat distribution and variations in individuals with T2D are limited and equivocal. Besides, the impact of T2D on hyperlipidemia and insulin resistance is not fully elucidated. Considering this result, the current study investigated the roles of disease duration and glycemic control in T2D-associated changes in body composition and the other components of MetS.
Patients and Methods
Population
A total of 92 patients with known T2D and 25 healthy individuals aged 20–60 years were enrolled in a case–control study conducted at King Faisal Specialist Hospital and Research Centre in Riyadh, Saudi Arabia. The potential participants were then interviewed to collect detailed data, and a written informed consent was obtained from all those who wanted to participate. The exclusion criteria included individuals diagnosed with type 1 diabetes; those with a history of other endocrine diseases, neurological disorders, and/or renal comorbidities; and pregnant and lactating women. The study protocol was in accordance with the Declaration of Helsinki and was approved by the ethics committee of the College of Applied Medical Sciences, King Saud University (at all sites; approval letter no: CAMS 30/3536).
Patients with T2D who were enrolled in the study were grouped based on two factors: 1) duration of time since the diagnosis of T2D, categorized as either new or old cases if the diagnosis of T2D was made within a year or if the diagnosis was confirmed at least 5 years prior, respectively,16,17 and 2) hemoglobin A1C (HbA1C, %) level, categorized as either controlled or uncontrolled, which is defined as HbA1C level ≤ or >7%, respectively.18 A control group was recruited by contacting healthy visitors at the hospital or relatives of the patients. Subsequently, five groups were included in this study: the healthy control (C) group (n=25), new and controlled cases (N&C) group (n=25), new and uncontrolled (N&U) group (n=17), old and controlled (O&C) group (n=25), and old and uncontrolled (O&U) group (n=25).
The sample size was calculated using an online calculator19 with consideration of the following: 95% confidence interval (CI), power of 80%, a control-to-case ratio of 1:1, the proportion of population without T2D who developed MetS in the 30–40-year-old population in Saudi Arabia (42.7%),20 and proportion of individuals with T2D who developed MetS in Saudi Arabia (85.8%).21 Thus, the sample size was set at 20 individuals with T2D and 20 controls.
Anthropometric Measurements
Weight (kg) and height (cm) were measured twice while the patients were barefoot and wearing light clothes, and the body mass index (BMI) was calculated as weight (kg)/height2(cm). A trained nurse assessed other variables, such as waist circumference (WC in cm) and systolic blood pressure (SBP)/diastolic blood pressure (DBP).
Body Composition
Body composition was assessed using Tanita BC-418 (Tanita Corporation, Japan) – a segmental body composition analyzer used to measure the percentage of body fat (PBF), fat mass (FM), fat-free mass (FFM), total body water (TBW), and basal metabolic rate (BMR). Moreover, the FM-to-FFM ratio was calculated by dividing FM with FFM (FM/FFM ratio=FM(kg)/FFM(kg)).22
Biochemical Assessment
Fasting blood glucose (FBG) level was analyzed with Cobas c 701 module (Roche Diagnostics, the UK).23 Cobas c 311 (Roche Diagnostics, the UK) was used to analyze HbA1C level, which was measured in mmol/mol and then converted into percentages using a cutoff point of 7.0%.24 Insulin level was measured using electrochemiluminescence immunoassay (Modular Analytics E170 and Cobas e411, 601, and 602).23 Serum total cholesterol, high-density lipoprotein (HDL) cholesterol, low-density lipoprotein cholesterol, and triglyceride levels were assessed using Cobas c 701 modules (Roche Diagnostics, the UK).23 The homeostasis model assessment-insulin resistance (HOMA-IR) score was used as an indicator of insulin resistance and was calculated using the following formula: fasting insulin (mIU/mL)×fasting glucose (mg/dL)/405.25
Components of Metabolic Syndrome
Based on the consensus of the International Diabetes Federation,26 the components of MetS used in this study were as follows: 1) central obesity defined as a WC of ≥94 cm for men or ≥80 cm for women, 2) hypertension defined as SBP ≥130 and/or DBP ≥85 mmHg or if the patient was already receiving pharmacological treatment for hypertension, 3) hyperglycemia defined as an FBG level ≥100 mg/dL, 4) low HDL cholesterol level defined as <40 mg/dL in men or <50 mg/dL in women or if the patient was already receiving treatment, and 5) elevated triglyceride levels defined as ≥150 mg/dL or if the patient was already receiving treatment. MetS was defined as WC higher than the previously mentioned cutoff values plus the presence of any positive two components.26
Statistical Analysis
Descriptive statistics for non-categorical data were presented as means±standard deviations, and categorical parameters were recorded as absolute and relative frequencies. All data sets were tested for normality using the Kolmogorov–Smirnov, and Shapiro–Wilk tests, and they were found to be non-normally distributed, except for WC, BMI, FM, and creatinine level. Since most data had a non-normal distributed, all variables in the study groups were assessed using the Kruskal–Wallis test with performing multiple comparisons by the Mann–Whitney test. Categorical variables were compared using the chi-square test. The correlation between the study parameters was assessed with Spearman correlation coefficient. A multivariate binary logistic regression analysis was conducted to assess the independent factors for the risk of developing MetS (dependent variable), and a multiple linear regression analysis was performed to evaluate the association between the FM/FFM ratio and the same model of independent variables. The model included age, sex, physical activity, adherence to the dietary regimen, HbA1c levels, duration of T2D (in years), categories of glycemic control, and disease duration. A P value of ≤0.05 was considered statistically significant. Statistical analyses were conducted using the Statistical Package for the Social Sciences version 25 (SPSS Statistics, IBM Corp., the USA).
Results
The total sample comprised men (56.5%) with a mean age of 45.58±11.14 years. All patients who were assessed were instructed to follow healthy lifestyle habits, such as a balanced diet and daily physical activity for 30 min. Furthermore, they were instructed to take oral anti-diabetes agents regularly (metformin [100%], sulphonylureas [71%], and combination [56%]). Table 1 shows the general characteristics of each group included in the study. Compared to the control group, the BMI, WC, and SBP of all groups with T2D were significantly higher than those of the controls. However, further comparisons between the new and old groups, regardless of glycemic control, revealed insignificant changes in BMI, WC, and SBP.
 |
Table 1 General Characteristic Variables Among Study Groups |
The bio-impedancemetry analysis revealed that the PBF, FM, and FM/FFM ratio of the participants newly diagnosed with T2D were significantly higher than those of the controls even if the HbA1C levels were controlled (Table 2). The FM was significantly higher in all diabetic groups than in the control group. The FM of the O&C group was significantly lower than that of the N&C group. That is, in patients with controlled HbA1C levels, the FM progressively decreased with time. However, this result was not observed in the N&U and O&U groups. Interestingly, in the groups with uncontrolled HbA1C levels, the FFM and TBW significantly decreased in the O&U group compared with the N&U group. Other comparisons of the FM/FFM ratio among the diabetic groups revealed no significant changes.
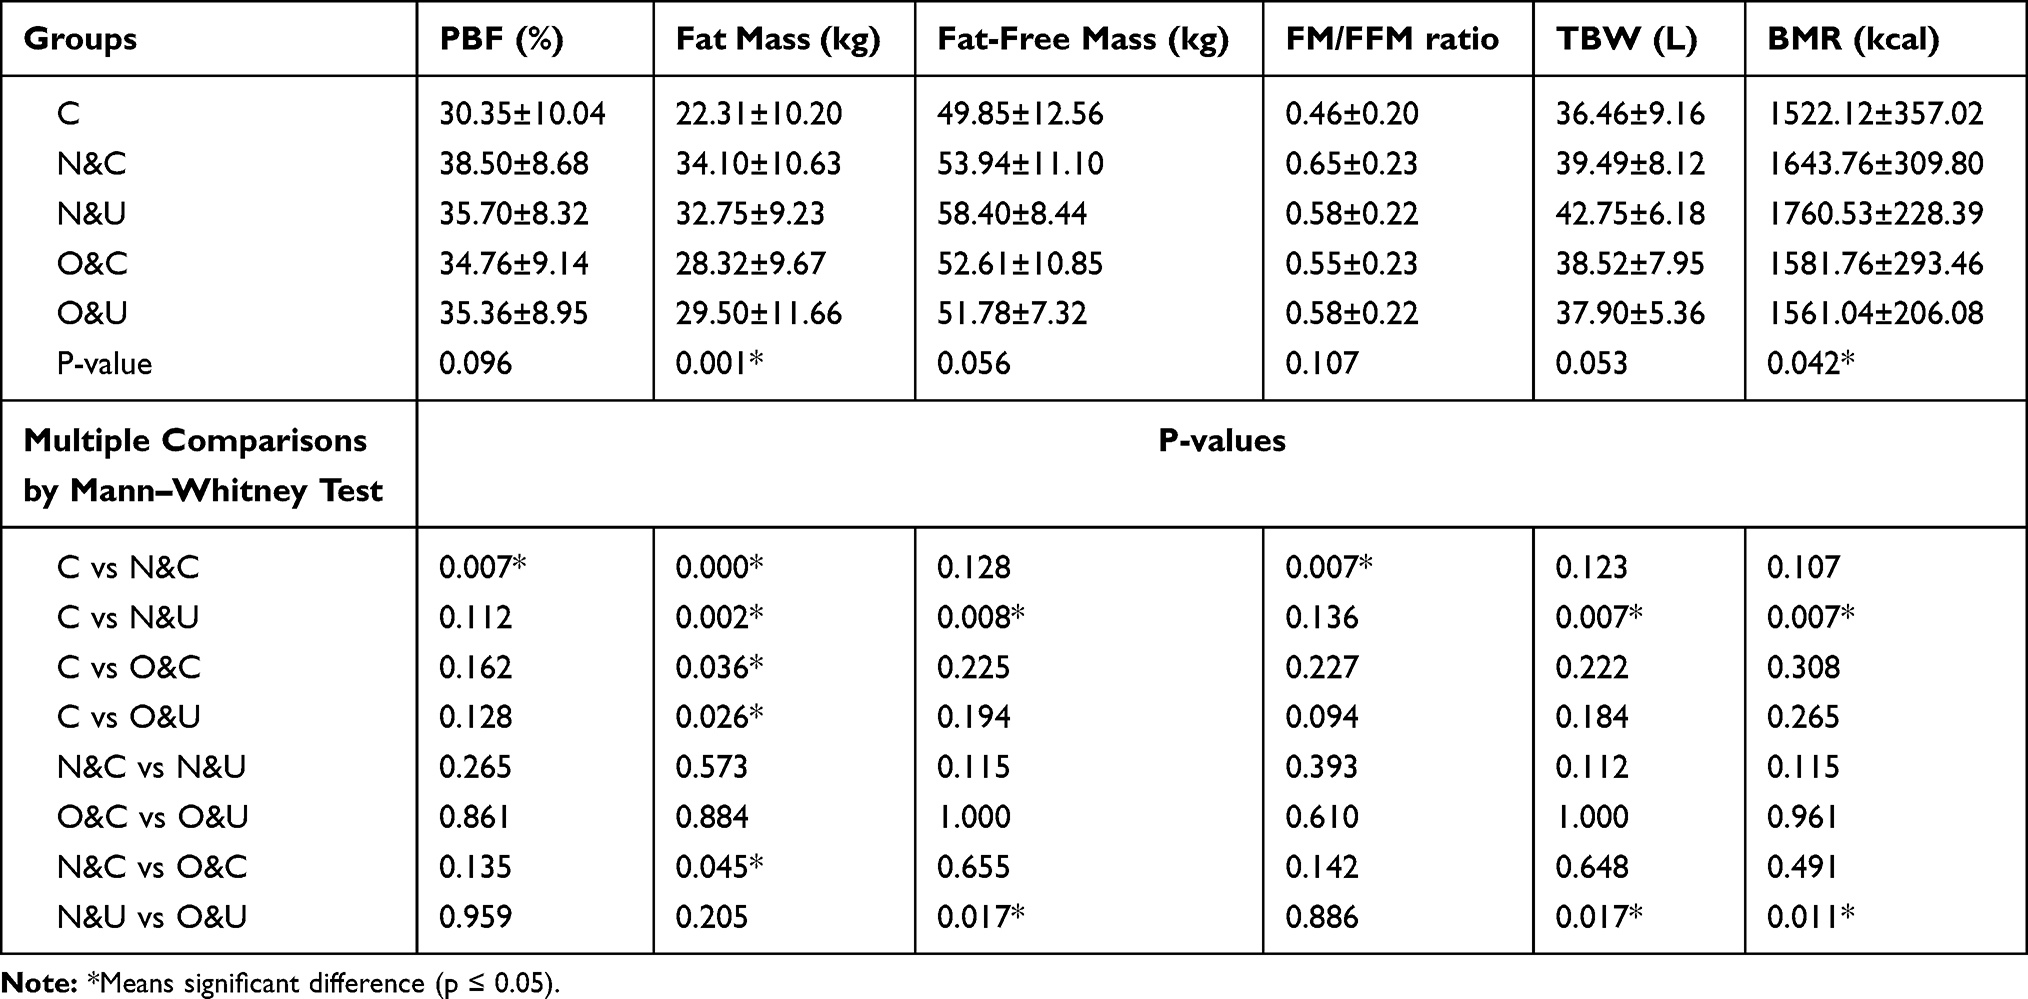 |
Table 2 Body Composition Parameters by Bio-Impedancemetry Analysis Among Study Groups |
The biochemical analysis revealed that the HOMA-IR score, which is an indicator of insulin resistance, was significantly high in all diabetic groups than in the control group. Moreover, in the groups with uncontrolled glycemic status (N&U and O&U groups), the HOMA-IR scores significantly increased (Table 3). By contrast, in the groups with controlled glycemic status (N&C and O&C groups), the duration of T2D did not cause any significant change in the HOMA-IR score (P=0.404). Regarding lipid profile, all diabetic groups had significantly higher TG levels and lower HDL levels than the control group. Moreover, the N&U group had significantly higher triglyceride and lower HDL levels than the N&C group (Table 3).
 |
Table 3 Biochemical Variables Among Study Groups |
Data about the presence of the MetS components among all the study groups are presented in Table 4. That is, all groups with T2D presented with central obesity based on WC values. Approximately 60%, 51.5%, 60%, and 59% of the participants in the N&C, N&U, O&C, and O&U groups, respectively, presented with central obesity. Both blood pressure and FBG had a similar distribution. The lipid, triglyceride, and HDL cholesterol levels were significantly higher in the N&U and O&U groups (groups with uncontrolled glycemic status, regardless of disease duration). Interestingly, compared to the control group, the percentage of participants presenting with all the components of MetS was significantly higher in the groups with uncontrolled glycemic status (the N&U and O&U groups) than in those with controlled glycemic status.
 |
Table 4 Components of MetS in Study Groups and Their Analysis by Using Chi Square Test |
The correlations between HbA1C levels as well as WC, FBG level, and the other components of MetS are presented in Table 5. In the control group, the HbA1C level was significantly correlated to WC and TG levels (r=0.483 and 0.464, respectively, P<0.05). However, no other parameters were significantly correlated in any other group. In addition, we performed a binary logistic regression analysis to identify the independent risk factors associated with the presence or absence MetS (Table 6, left side). Among all the selected independent factors, only age increased the likelihood of MetS diagnosis by 7% (OR= 1.07; 95% CI=1.004–1.149; P<0.05), and other variables, such as sex, regular physical activity, adherence to diet regimen, disease duration, and glycemic control, were not significantly associated. The efficacy of a similar independent variable model in predicting changes in the FM/FFM ratio was also assessed. Age, sex, adherence to diet regimen, and T2D duration revealed lower odds ratios (ORs) of increased FM/FFM ratio (Table 6, right side). Furthermore, the ORs for adherence to diet regimen and T2D duration were negative, which indicates that the tested variable had a protective role.
 |
Table 5 Correlation of HbA1C Level with Metabolic Syndrome Components Among Different Studied Groups |
 |
Table 6 Multiple Logistic Regression Analysis of a Model of Independent Variables as Determinants of MetS Development and the Value of FM/FFM Ratio |
Discussion
This study aimed to assess the roles of disease duration and glycemic control in T2D-associated changes in body composition and the components of MetS. Previously, the prevalence of MetS was found to be high in patients with T2D regardless of the method used to diagnose MetS.21 As expected, the patients with T2D had significant increases in FBG, insulin, and HbA1C levels and HOMA-IR scores compared to nondiabetic individuals in the control group. Similarly, patients with T2D had significantly higher body fat percentage, fat mass, lipid profile, and SBP. In the control group, a significant positive correlation was observed between HbA1C levels and the components of MetS, such as WC and FBG level. However, in the diabetic groups, this correlation was not significant.
Interestingly, via logistic regression analysis, no significant difference was observed between disease duration and glycemic control in the prediction of complete MetS diagnosis in patients with T2D. However, all the components of Mets were significantly higher in the groups with uncontrolled glycemic status than in the controls using the chi-square test (Table 4). A previous report has shown that shorter diabetes duration, lower FBG, HbA1C, and triglyceride/total cholesterol levels, and insulin treatment were the significant predictors of MetS based on the COX regression analysis. They hypothesized that a lower HbA1C level indicates higher insulin levels with a higher risk of insulin resistance.27 Another study of a large Chinese cohort with T2D28 had a different finding. That is, individuals with long duration of diabetes (≥5 years), poor glycemic control, and sedentary lifestyle were more likely to have full MetS according to multivariate logistic regression analysis.
Based on previous study results, disease duration contributes to changes in body composition as indicated by FM/FFM ratio, rather than glycemic control. Meanwhile, poorer glycemic control and partially the duration of time with T2D can, no doubt, often contribute to increased WC and the development of hypertension and/or dyslipidemia. Notably, each component of MetS may present individually before the criteria for T2D is met. Indeed, each component of MetS has an individual causal contribution to the risk of T2D and vice versa.29,30 Regardless, patients with T2D and MetS who have a higher waist circumference, SBP, DBP, and triglyceride concentrations and lower HDL levels may require more urgent treatment strategies than those with only one of the components of MetS due to a higher risk of cardiovascular disease.30
In terms of body composition parameters, patients newly diagnosed with T2D had higher WC, BMI, PBF, FM, and FM/FFM ratio. A previous report has shown that the incidence of T2D is associated with higher BMI and WC.31 The risk of exacerbating T2D and the development of Mets was also correlated to disturbances in body composition. Wang et al32 have reported that the skeletal muscle mass-to-visceral fat area (SMM/VFA) ratio was significantly lower in the population with T2D and MetS. Furthermore, the SMM/VFA ratio could be used to predict T2D and MetS with high sensitivity and specificity. Consistent with our results, Solanki et al33 have found that individuals with T2D had significantly higher PBF, FM, visceral fat, and subcutaneous fat than nondiabetic controls. Moreover, both quantitative and qualitative increases in fat mass were observed. The augmented FM, particularly the visceral part, triggers several mechanisms that result in the development of MetS, such as the development of insulin resistance, disturbed adipokine production, and visceral fat-enhanced gluconeogenesis.34 Kim and Park35 have reported that the incidence of MetS among Korean individuals with high fat/low muscle mass was 1.9 times higher than those with low fat/low muscle mass.
Our study found that when the disease duration is longer, there is a higher risk of insulin resistance, as indicated by the HOMA-IR score, and non-control of HbA1c level hastens the process of insulin resistance. Both the N&U vs N&C and O&U vs O&C groups had significantly higher HOMA-IR scores (p<0.001 and <0.01, respectively). Carrillo-Larco et al36 have concluded that the HOMA-IR score can be used to assess T2D patients. However, the ability of HbA1c levels was significantly better (more area under the curve). The participants with a higher HOMA-IR score had distinctive disturbances in about 30 metabolites, including glucose, specific amino acids, lipids, and other organic acids, compared with those with a lower HOMA-IR score.37 Insulin resistance induces the development of cardiovascular morbidity via several mechanisms, which are as follows: a) hyperglycemia-induced oxidative stress, inflammation, and endothelial cell damage,38 b) altered systemic lipid metabolism with consequent dyslipidemia,39 c) alteration of insulin signal transduction in myocardial cells,40 d) and dysregulation of substrate metabolism and altered supply of substrates to the myocardium.41
The current study had some limitations that might affect the interpretation of data. Although power calculations were conducted during the sample size calculation, the surprising insignificant difference between disease duration and glycemic control in the prediction of MetS might not be observed in a larger sample size. In particular, glycemic control has a P value of 0.06, which is extremely close to the significant value. In addition, although metabolic health may naturally worsen with age, notably, there is a significant difference in age between the T2D groups and the healthy control group included in this study.
Conclusions
Patients with early T2D had a significantly higher FM/FFM ratio. Moreover, disease duration rather than glycemic control causes further changes in the disease course. The development of MetS in patients with T2D might be strongly associated with age rather than glycemic control or T2D duration. Indeed, further characterization of T2D contributes to the development of strategies that can prevent, detect, and treat poor cardio-metabolic health in the population with T2D.
Abbreviations
DBP, Diastolic blood pressure; HbA1C, Hemoglobin A1C; HOMA-IR, Homeostasis model assessment-insulin resistance; HDL, High-density lipoprotein; MetS, Metabolic syndrome; T2D, Type 2 diabetes; SBP, Systolic blood pressure.
Data Sharing Statement
The datasets used and/or analyzed during the current study are available from the corresponding author upon reasonable request.
Ethics and Consent Statement
The study protocol was approved by the ethics committee of the College of Applied Medical Sciences, King Saud University (at all sites; approval letter no: CAMS 30/3536).
Acknowledgment
The authors thank the Deanship of Scientific Research at King Saud University, Riyadh, Kingdom of Saudi Arabia (research group no. 1439-78) for funding the current study.
Author Contributions
All authors contributed to data analysis, drafting or revising the article, gave final approval of the version to be published, and agree to be accountable for all aspects of the work.
Funding
The Deanship of Scientific Research at King Saud University, Riyadh, Kingdom of Saudi Arabia, funded this research (research group no. 1439-78).
Disclosure
The authors declare no conflicts of interest.
References
1. American Diabetes A. Classification and diagnosis of diabetes: standards of medical care in diabetes-2019. Diabetes Care. 2019;42(Suppl 1):S13–S28. doi:10.2337/dc19-S002
2. International Diabetes Federation. Chapter 1: What is diabetes? In: Karuranga S, Fernandes JDR, Huang Y, Malanda B, editors. Diabetes Atlas Eighth edition 2017. 2017:1–150.
3. Roden M, Shulman GI. The integrative biology of type 2 diabetes. Nature. 2019;576(7785):51–60. doi:10.1038/s41586-019-1797-8
4. Arneth B, Arneth R, Shams M. Metabolomics of type 1 and type 2 diabetes. Int J Mol Sci. 2019;20(10):2467. doi:10.3390/ijms20102467
5. Kong AP, Luk AO, Chan JC. Detecting people at high risk of type 2 diabetes- How do we find them and who should be treated? Best Pract Res Clin Endocrinol Metab. 2016;30(3):345–355. doi:10.1016/j.beem.2016.06.003
6. Das SR, Everett BM, Birtcher KK, et al. 2018 ACC Expert consensus decision pathway on novel therapies for cardiovascular risk reduction in patients with type 2 diabetes and atherosclerotic cardiovascular disease: a report of the american college of cardiology task force on expert consensus decision pathways. J Am Coll Cardiol. 2018;72(24):3200–3223. doi:10.1016/j.jacc.2018.09.020
7. Low Wang CC, Hess CN, Hiatt WR, Goldfine AB. Clinical update: cardiovascular disease in diabetes mellitus: atherosclerotic cardiovascular disease and heart failure in type 2 diabetes mellitus - mechanisms, management, and clinical considerations. Circulation. 2016;133(24):2459–2502. doi:10.1161/CIRCULATIONAHA.116.022194
8. Alaei Faradonbeh N, Nikaeen F, Akbari M, Almasi N, Vakhshoori M. Cardiovascular disease risk prediction among Iranian patients with diabetes mellitus in Isfahan Province, Iran, in 2014, by using Framingham risk score, atherosclerotic cardiovascular disease risk score, and high-sensitive C-reactive protein. ARYA Atheroscler. 2018;14(4):163–168. doi:10.22122/arya.v14i4.1685
9. Sherling DH, Perumareddi P, Hennekens CH. Metabolic Syndrome. J Cardiovasc Pharmacol Ther. 2017;22(4):365–367. doi:10.1177/1074248416686187
10. Samson SL, Garber AJ. Metabolic syndrome. Endocrinol Metab Clin North Am. 2014;43(1):1–23. doi:10.1016/j.ecl.2013.09.009
11. Papaetis GS, Panagiotou TN, Panagiotou TN. Central obesity, type 2 diabetes and insulin: exploring a pathway full of thorns. Arch Med Sci. 2015;11(3):463–482. doi:10.5114/aoms.2015.52350
12. Gupta P, Lanca C, Gan ATL, et al. The association between body composition using dual energy X-ray absorptiometry and type-2 diabetes: a systematic review and meta-analysis of observational studies. Sci Rep. 2019;9(1):12634. doi:10.1038/s41598-019-49162-5
13. Wells JCK. Body composition and susceptibility to type 2 diabetes: an evolutionary perspective. Eur J Clin Nutr. 2017;71(7):881–889. doi:10.1038/ejcn.2017.31
14. Jiang Y, Tan S, Wang Z, Guo Z, Li Q, Wang J. Aerobic exercise training at maximal fat oxidation intensity improves body composition, glycemic control, and physical capacity in older people with type 2 diabetes. J Exerc Sci Fit. 2020;18(1):7–13. doi:10.1016/j.jesf.2019.08.003
15. Ji M, Ren D, Dunbar-Jacob J, Gary-Webb TL, Erlen JA. Correlates of self-management behaviors, glycemic control and metabolic syndrome in patients with type 2 diabetes. Nurs Res. 2019.
16. Ravichandran S, Srivastav S, Kamble PH, et al. VEGF-A and cardiac autonomic function in newly diagnosed type 2 diabetes mellitus: a cross-sectional study at a tertiary care center. J Family Med Prim Care. 2019;8(10):3185–3190. doi:10.4103/jfmpc.jfmpc_537_19
17. Ghouse J, Isaksen JL, Skov MW, et al. Effect of diabetes duration on the relationship between glycaemic control and risk of death in older adults with type 2 diabetes. Diabetes Obes Metab. 2019.
18. Wysham CH, Pilon D, Ingham M, et al. HBA1C Control and cost-effectiveness in patients with type 2 diabetes mellitus initiated on canagliflozin or a glucagon-like peptide 1 receptor agonist in a real-world setting. Endocr Pract. 2018;24(3):273–287. doi:10.4158/EP-2017-0066
19. Dean AG, Sullivan KM, Soe MM OpenEpi: open source epidemiologic statistics for public health, version; 2013. Available from: www.OpenEpi.com.
20. Al-Rubeaan K, Bawazeer N, Al Farsi Y, et al. Prevalence of metabolic syndrome in Saudi Arabia - a cross sectional study. BMC Endocr Disord. 2018;18(1):16. doi:10.1186/s12902-018-0244-4
21. Ghamri RA, Alamri SH. Metabolic syndrome among adults with type 2 diabetes in a Saudi teaching hospital: A comparative prevalence study using WHO and ATP III definitions. Pak J Med Sci. 2019;35(4):1087–1092. doi:10.12669/pjms.35.4.199
22. Xiao J, Purcell SA, Prado CM, Gonzalez MC. Fat mass to fat-free mass ratio reference values from NHANES III using bioelectrical impedance analysis. Clin Nutr. 2018;37(6):2284–2287. doi:10.1016/j.clnu.2017.09.021
23. Bakker AJ, Mucke M. Gammopathy interference in clinical chemistry assays: mechanisms, detection and prevention. Clin Chem Lab Med. 2007;45(9):1240–1243. doi:10.1515/CCLM.2007.254
24. Holman RR, Paul SK, Bethel MA, Matthews DR, Neil HA. 10-year follow-up of intensive glucose control in type 2 diabetes. N Engl J Med. 2008;359(15):1577–1589. doi:10.1056/NEJMoa0806470
25. Matthews DR, Hosker JP, Rudenski AS, Naylor BA, Treacher DF, Turner RC. Homeostasis model assessment: insulin resistance and beta-cell function from fasting plasma glucose and insulin concentrations in man. Diabetologia. 1985;28(7):412–419. doi:10.1007/BF00280883
26. Alberti KG, Zimmet P, Shaw J. Metabolic syndrome–a new world-wide definition. A consensus statement from the international diabetes federation. Diabet Med. 2006;23(5):469–480. doi:10.1111/j.1464-5491.2006.01858.x
27. Janghorbani M, Amini M. Incidence of metabolic syndrome and its risk factors among type 2 diabetes clinic attenders in Isfahan, Iran. ISRN Endocrinol. 2012;2012:8. doi:10.5402/2012/167318
28. Jing Y, Hong T, Bi Y, et al. Prevalence, treatment patterns and control rates of metabolic syndrome in a Chinese diabetic population: china cardiometabolic registries 3B study. J Diabetes Investig. 2018;9(4):789–798. doi:10.1111/jdi.12785
29. Marott SC, Nordestgaard BG, Tybjaerg-Hansen A, Benn M. Components of the metabolic syndrome and risk of type 2 diabetes. J Clin Endocrinol Metab. 2016;101(8):3212–3221. doi:10.1210/jc.2015-3777
30. Meifang Y, Xue S, Jue H, et al. Metabolic syndrome increases Framingham risk score of patients with type 2 diabetes mellitus. Journal of Zhejiang University. Medical Sciences. 2016;45(3):268–274.
31. Yang XY, Zhang M, Luo XP, et al. Body mass index, waist circumference and waist-to-height ratio associated with the incidence of type 2 diabetes mellitus: a cohort study. Zhonghua Yu Fang Yi Xue Za Zhi. 2016;50(4):328–333. doi:10.3760/cma.j.issn.0253-9624.2016.04.009
32. Wang Q, Zheng D, Liu J, Fang L, Li Q. Skeletal muscle mass to visceral fat area ratio is an important determinant associated with type 2 diabetes and metabolic syndrome. Diabetes Metab Syndr Obes. 2019;12:1399–1407. doi:10.2147/DMSO.S211529
33. Solanki JD, Makwana AH, Mehta HB, Gokhale PA, Shah CJ. Body composition in type 2 diabetes: change in quality and not just quantity that matters. Int J Prev Med. 2015;6(1):122. doi:10.4103/2008-7802.172376.
34. Gastaldelli A, Miyazaki Y, Pettiti M, et al. Metabolic effects of visceral fat accumulation in type 2 diabetes. J Clin Endocrinol Metab. 2002;87(11):5098–5103. doi:10.1210/jc.2002-020696
35. Kim K, Park SM. Association of muscle mass and fat mass with insulin resistance and the prevalence of metabolic syndrome in Korean adults: a cross-sectional study. Sci Rep. 2018;8(1):2703. doi:10.1038/s41598-018-21168-5
36. Carrillo-Larco RM, Miranda JJ, Gilman RH, Checkley W, Smeeth L, Bernabe-Ortiz A. CRONICAS Cohort study group. the HOMA-IR performance to identify new diabetes cases by degree of urbanization and altitude in peru: the CRONICAS cohort study. J Diabetes Res. 2018;2018:8. doi:10.1155/2018/7434918
37. Hernández-Alonso P, García-Gavilán J, Camacho-Barcia L, et al. Plasma metabolites associated with homeostatic model assessment of insulin resistance: metabolite-model design and external validation. Sci Rep. 2019;9(1):13895. doi:10.1038/s41598-019-50260-7.
38. Laakso M, Kuusisto J. Insulin resistance and hyperglycaemia in cardiovascular disease development. Nat Rev Endocrinol. 2014;10(5):293–302. doi:10.1038/nrendo.2014.29
39. Ginsberg HN, Zhang YL, Hernandez-Ono A. Metabolic syndrome: focus on dyslipidemia. Obesity. 2006;14(Suppl1):41S–9S. doi:10.1038/oby.2006.281
40. Kota SK, Kota SK, Jammula S, Panda S, Modi KD. Effect of diabetes on alteration of metabolism in cardiac myocytes: therapeutic implications. Diabetes Technol Ther. 2011;13(11):1155–1160. doi:10.1089/dia.2011.0120
41. van der Vusse GJ, van Bilsen M, Glatz JF. Cardiac fatty acid uptake and transport in health and disease. Cardiovasc Res. 2000;45(2):279–293. doi:10.1016/S0008-6363(99)00263-1
 © 2020 The Author(s). This work is published and licensed by Dove Medical Press Limited. The
full terms of this license are available at https://www.dovepress.com/terms
and incorporate the Creative Commons Attribution
- Non Commercial (unported, 3.0) License.
By accessing the work you hereby accept the Terms. Non-commercial uses of the work are permitted
without any further permission from Dove Medical Press Limited, provided the work is properly
attributed. For permission for commercial use of this work, please see paragraphs 4.2 and 5 of our Terms.
© 2020 The Author(s). This work is published and licensed by Dove Medical Press Limited. The
full terms of this license are available at https://www.dovepress.com/terms
and incorporate the Creative Commons Attribution
- Non Commercial (unported, 3.0) License.
By accessing the work you hereby accept the Terms. Non-commercial uses of the work are permitted
without any further permission from Dove Medical Press Limited, provided the work is properly
attributed. For permission for commercial use of this work, please see paragraphs 4.2 and 5 of our Terms.