Back to Journals » Diabetes, Metabolic Syndrome and Obesity » Volume 14
Blood Glucose and Renal Function Evaluation in Patients with Viral Hepatitis
Authors Hsu WT, Yang DH ![]() , Liao CC
, Liao CC ![]() , Chen JW, Hsu WH, Kuo CW, Hsu HC
, Chen JW, Hsu WH, Kuo CW, Hsu HC ![]() , Chang SH, Chen LM
, Chang SH, Chen LM
Received 22 January 2021
Accepted for publication 10 May 2021
Published 20 July 2021 Volume 2021:14 Pages 3337—3344
DOI https://doi.org/10.2147/DMSO.S303252
Checked for plagiarism Yes
Review by Single anonymous peer review
Peer reviewer comments 3
Editor who approved publication: Prof. Dr. Juei-Tang Cheng
Wen-Tung Hsu,1 Deng-Ho Yang,1– 4 Chun-Cheng Liao,3,5 Jia -Wen Chen,6 Wen-Hsiu Hsu,3,7 Chia-Wen Kuo,3,8 Hung-Chang Hsu,9 Sheng-Huang Chang,10 Li-Mien Chen2,3
1Division of Laboratory, Taichung Armed Force General Hospital, Taichung, Taiwan, Republic of China; 2Department of Internal Medicine, Taichung Armed Force General Hospital, Taichung, Taiwan, Republic of China; 3School of Medicine, National Defense Medical Center, Taipei, Taiwan, Republic of China; 4Department of Medical Laboratory Science and Biotechnology, Central Taiwan University of Science and Technology, Taichung, Taiwan, Republic of China; 5Department of Family Medicine, Taichung Armed Force General Hospital, Taichung, Taiwan, Republic of China; 6Medicine Laboratory, Ministry of Health and Welfare Feng Yuan Hospital, Taichung, Taiwan, Republic of China; 7Division of Gastroenterology, Taichung Armed Force General Hospital, Taichung, Taiwan, Republic of China; 8Division of Nephrology, Taichung Armed Force General Hospital, Taichung, Taiwan, Republic of China; 9Division of Laboratory, Ching Chyuan Hospital, Taichung, Taiwan, Republic of China; 10Tsaotun Psychiatric Center, Ministry of Health and Welfare, Nantou, Taiwan, Republic of China
Correspondence: Li-Mien Chen
Department of Internal Medicine, Taichung Armed Force General Hospital, No. 348, Sec. 2, Chung-Shan Road, Taiping, Taichung, Taiwan, Republic of China
Email [email protected]
Purpose: To evaluate the blood glucose and renal function, determine the prevalence of hyperglycemia/diabetes mellitus (DM) and renal disease (nephropathy), and investigate the association between hyperglycemia/DM and renal disease in patients with viral hepatitis (VH).
Patients and Methods: A total of 491 subjects were included in the study. Patients with VH were further divided into the hepatitis B virus (HBV) infection, hepatitis C virus (HCV) infection, and HBV-HCV co-infection subgroups. Fasting blood glucose, glycated hemoglobin (HbA1c), glycated albumin (GA), glutamic oxaloacetic transaminase (GOT), creatinine (Cr), and cystatin C (Cys C) levels were measured. Urine microalbumin levels were also assessed. Formulas for estimated average glucose calculated using glycated albumin(eAG(GA)), estimated average glucose calculated using HbA1c (eAG(HbA1c)), and estimated glomerular filtration rate calculated using cystatin C (eGFRcys) were used to evaluate the average glucose and renal function.
Results: The prevalence of hyperglycemia/DM and renal disease was significantly higher in the VH group, especially in the HCV subgroup. The prevalence of renal disease was significantly higher in patients with VH with eAG(GA) ≥ 200 mg/dL.
Conclusion: Our study used multiple parameters to evaluate blood glucose and renal function in patients with VH and found that hyperglycemia/DM and renal disease are closely associated with VH, especially in subjects with HCV infection. Patients with VH, especially those with HCV infection and hyperglycemia/DM, were particularly vulnerable to renal disease.
Keywords: viral hepatitis, hyperglycemia, diabetes mellitus, renal disease, nephropathy
Introduction
Viral hepatitis (VH) is one of the most serious public health issues worldwide. Millions of people are infected each year, and 1.4 million people die from VH-related complications (such as cirrhosis and liver cancer). According to the World Health Organization (WHO), hepatitis B (HBV) and hepatitis C (HCV) viruses are the main causes of VH infection.1 It is estimated that 325 million people worldwide have hepatitis B and/or hepatitis C. Among those with VH-related complications, hepatitis B and/or C accounted for 96% of the mortality.2
VH infection often has extrahepatic manifestations (XMs), such as hyperglycemia/DM and renal disease.3 In a meta-analysis by Younossi et al the prevalence of diabetes was reported to be 15% in Western countries;4 additionally, in a systematic review with meta-analysis they reported that the pooled prevalence of type 2 diabetes mellitus (T2DM) and chronic kidney disease (CKD) was 19.0% and 9.2%, respectively, in East Asian patients with HCV.3,5
The aim of this study was to evaluate the blood glucose level and renal function, determine the prevalence of hyperglycemia/DM and renal disease (nephropathy), and investigate the association between hyperglycemia/DM and renal disease in patients with VH.
Patients and Methods
Ethics Statement and Research Data Collection
After obtaining approval from the Human Body Trials/Research Program of the Tri-Service General Hospital (Research IRB review number: TC102-01), volunteers who signed the informed consent were randomly recruited from the Department of Metabolism, Gastroenterology, and Nephrology. A preliminary screening was conducted to identify subjects as healthy controls and patients with VH and classify the disease groups according to the participant’s health status, clinical examination results (medical history and physical examination), physiological data, etc.
Testing Method
Specimen collection: Blood samples were collected, after a 10-h overnight fast, in a test tube without any anticoagulant. The samples were allowed to stand at room temperature for 30 minutes and coagulate completely; they were then centrifuged at 1800 g for 10 min. The serum was immediately separated for creatinine (Cr), glucose, glycated hemoglobin (HbA1c), glycated albumin (GA), glutamic oxaloacetic transaminase (GOT), β2 microglobulin, and cystatin C (Cys C) assays. Fresh mid-section urine samples were collected and centrifuged at 1800 g for 5 min for the microalbumin assay.
Test grouping: The study participants were divided into the control and VH groups. Patients in the VH group were divided into hepatitis B virus (HBV), hepatitis C virus (HCV), and hepatitis B+C (HBV-HCV) coinfected subgroups. Based on the estimated average glucose level calculated using glycated albumin(eAG(GA)), the HBV, HCV, and HBV-HCV subgroups were further divided into eAG(GA) ≥200mg/dL and eAG(GA) <200 mg/dL groups. Nephropathy was defined as the third stage of CKD and an estimated glomerular filtration rate (eGFR) <60 mL/min in our study.6,7 Descriptive statistical analysis was performed to compare the differences between the groups.
Testing equipment: For the urine/biochemical tests, the “Beckman Coulter” Automated Chemistry Analyzer AU680 (Beckman Coulter Mishima K.K. Shizuoka, Japan) was used; for HbA1c tests, the “TOSOH” Automated G7 HPLC Glycohemoglobin Analyzer (International Diagnostic Equipment [IDE], Temecula, CA, USA) was used.
Test reagents: The following were the test reagents used: Cr, glucose, GOT, β2 microglobulin, urine microalbumin ([MA], Olympus Diagnostic GmbH, Lismeehan, O’Callaghan’s Mills, Co. Clare, Ireland), HbA1c (Tosoh Bioscience GmbH, Griesheim, Germany), glycated albumin (Lucica GA-L) (Asahi Kasei Pharma Corporation, Tokyo, Japan), cysteine acid protein C, and “Siemens” N Latex Cystatin C (Siemens Healthcare Diagnostics Product GmbH, Marburg, Germany).
Formulas
- Estimated average glucose calculated using glycated albumin:

 8
8 - Estimated average glucose calculated using HbA1c:

 9,10
9,10 - Estimated glomerular filtration rate calculated using cystatin C (eGFRcys):
 11
11
Statistical Methods
The narrative statistical results were compared between the groups. The variables were expressed as the mean and standard deviation of concentration and dispersion to describe the characteristics of the participants. Differences between the demographic variables with respect to the dependent variable were assessed for significance using the chi-square test as appropriate. Statistical software SPSS (version 18; SPSS, Chicago, IL, USA) was used analyses. For continuous variables and normally distributed variables, Student’s t-test or analysis of variance was used to confirm the degree of difference between the groups. Univariate and multivariate logistic regression models (Enter method) were performed to investigate the association between hyperglycemia and nephropathy in both viral hepatitis and non-viral hepatitis subgroups where demographic variables were included as confounders. The logistic regression models were analyzed to determine the possible risk factors for nephropathy, and the significance was set at p <0.05.
Results
Basic Data
This study included 491 participants (221 males and 270 females). Of these, 244 healthy participants were assigned to the control group and 247 patients with VH were assigned to the VH group. (Tables 1 and 2)
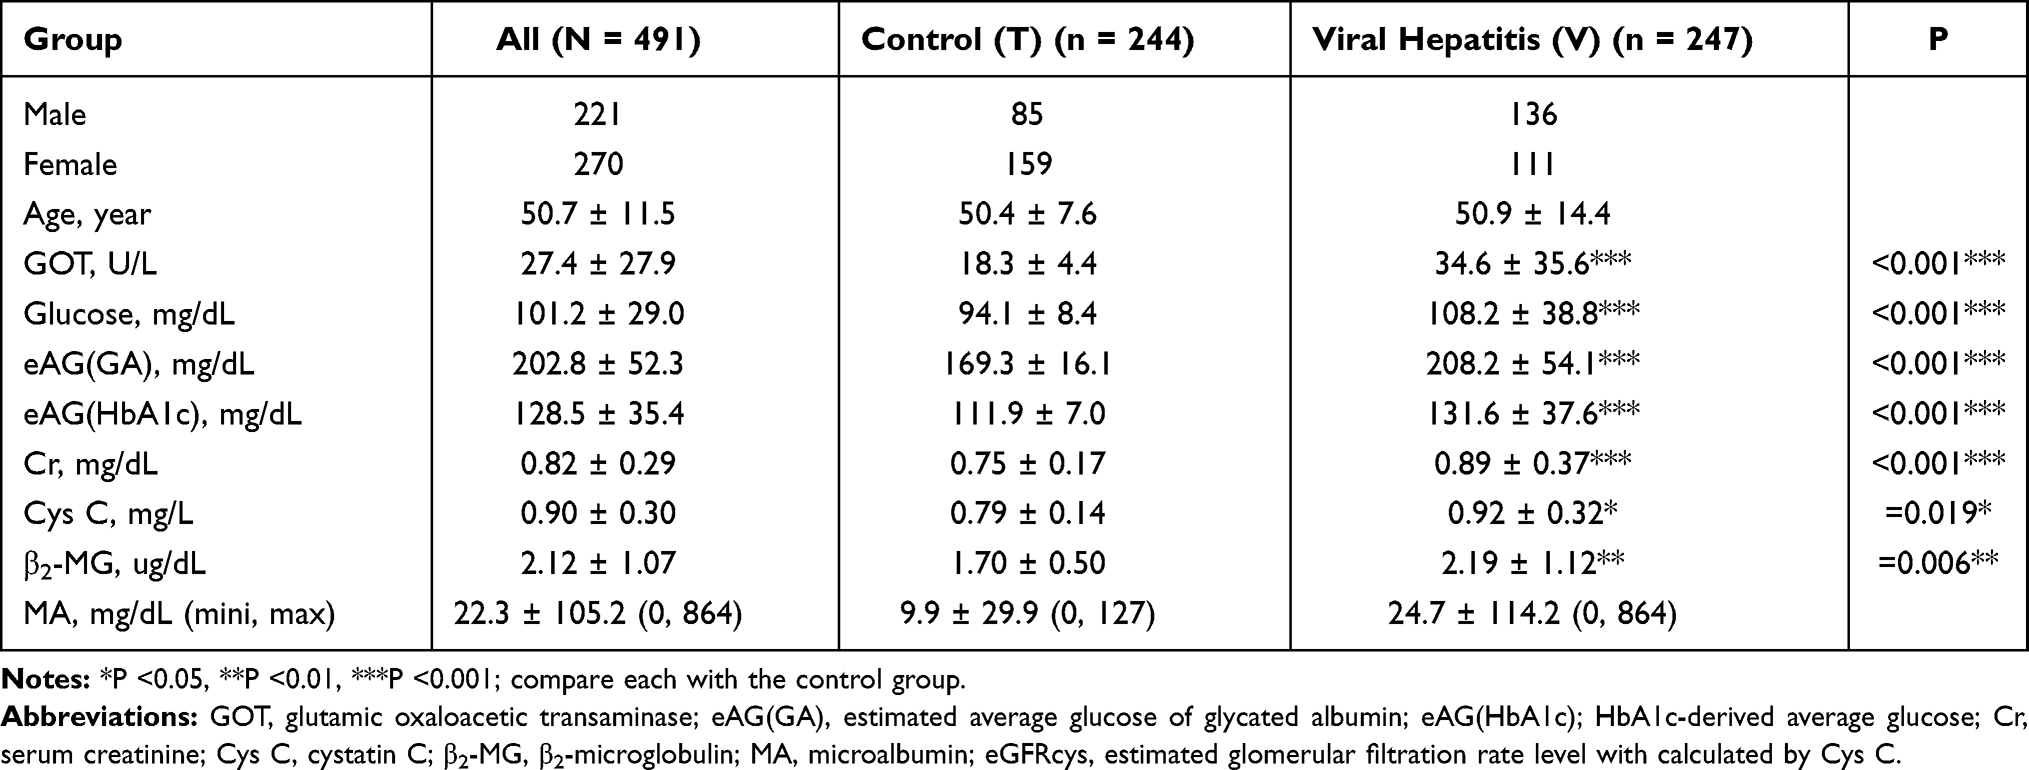 |
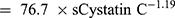
Table 1 Basic Data of the Control and VH Groups (t Test) |
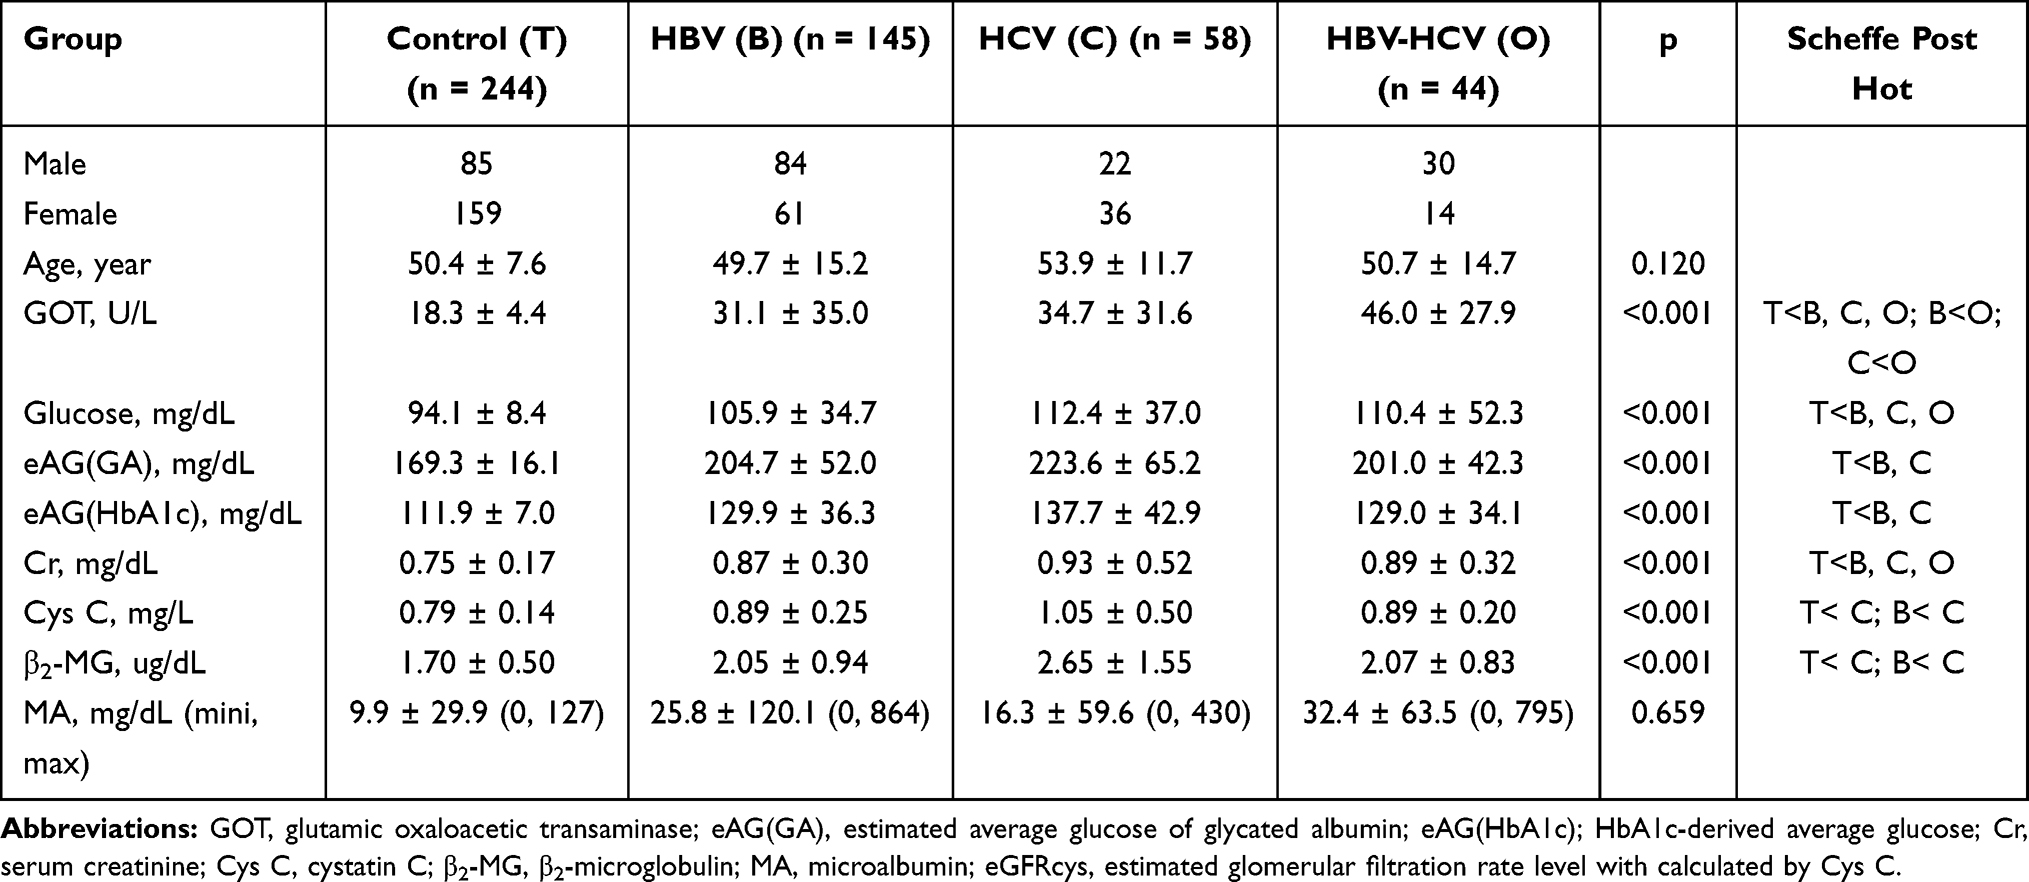 |
Table 2 Basic Data of the Three Subgroups of HBV, HCV, and HBV-HCV (ANOVA) |
Glucose, eAG(GA), and eAG(HbA1c)
The average levels of glucose, eAG(GA), and eAG(HbA1c) were significantly higher in the VH group than in the control group, with a significant difference between the HCV subgroup and control group. (Tables 1 and 2; Figure 1A)
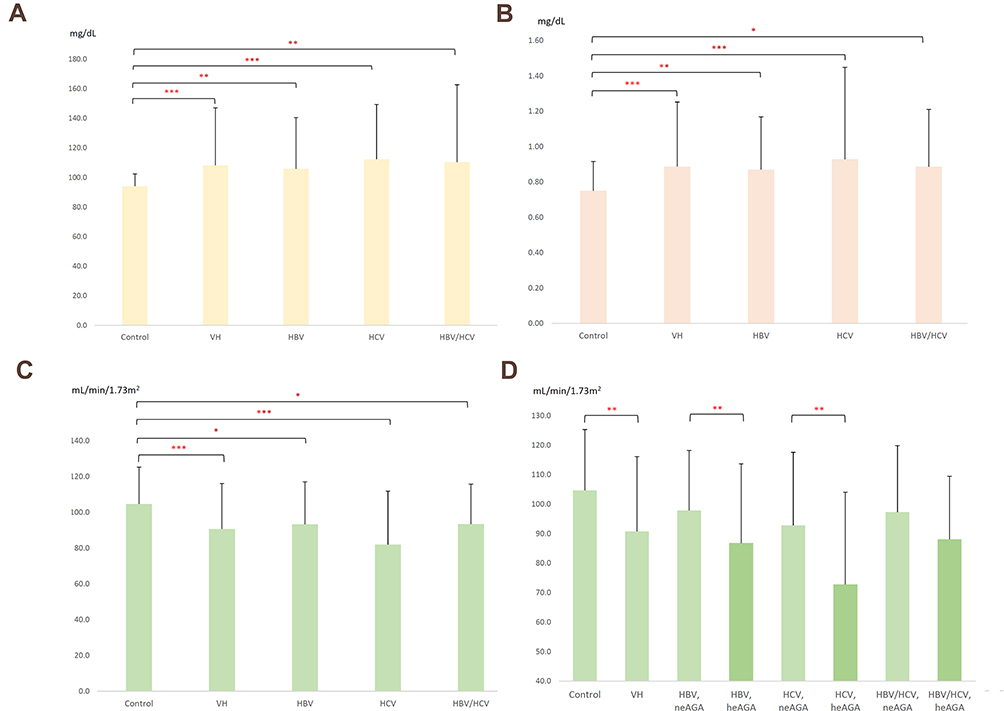 |
Figure 1 The glucose values (A) creatinine values (B) and eGFRcys (C) of the HBV, HCV, HBV-HCV subgroups and the control group showed significant differences; (D) average level of eGFRcys was different between the high eAG(GA) and low eAG(GA) groups of patients with viral hepatitis. (*P < 0.05, **P < 0.01, ***P < 0.001). |
HbA1c
The prevalence of HbA1c level > 6.5% in the VH group was 21.5% and 0 in the control group. The prevalence rates of HbA1c > 6.5% in the HBV, HCV, and HBV-HCV subgroups were 20.0%, 29.3%, and 15.9%, respectively.
Cr, Cys C, β2-Microglobulin, and Urine Microalbumin
The average levels of Cr, Cys C, and β2-microglobulin were higher in the VH group than in the control group, with a significant difference between the HCV subgroup and control group. The average level of urine microalbumin was higher in the VH group than in the control group. (Tables 1 and 2; Figure 1B)
eGFRcys
The average level of eGFRcys in the VH group was lower than that in the control group, with significant differences between the HCV subgroup and the control group. The prevalence rates of eGFRcys <60 were 10.1% and 22.4% in the VH group and HCV subgroup, respectively, and 0.4% in the control group. (Table 3; Figure 1C)
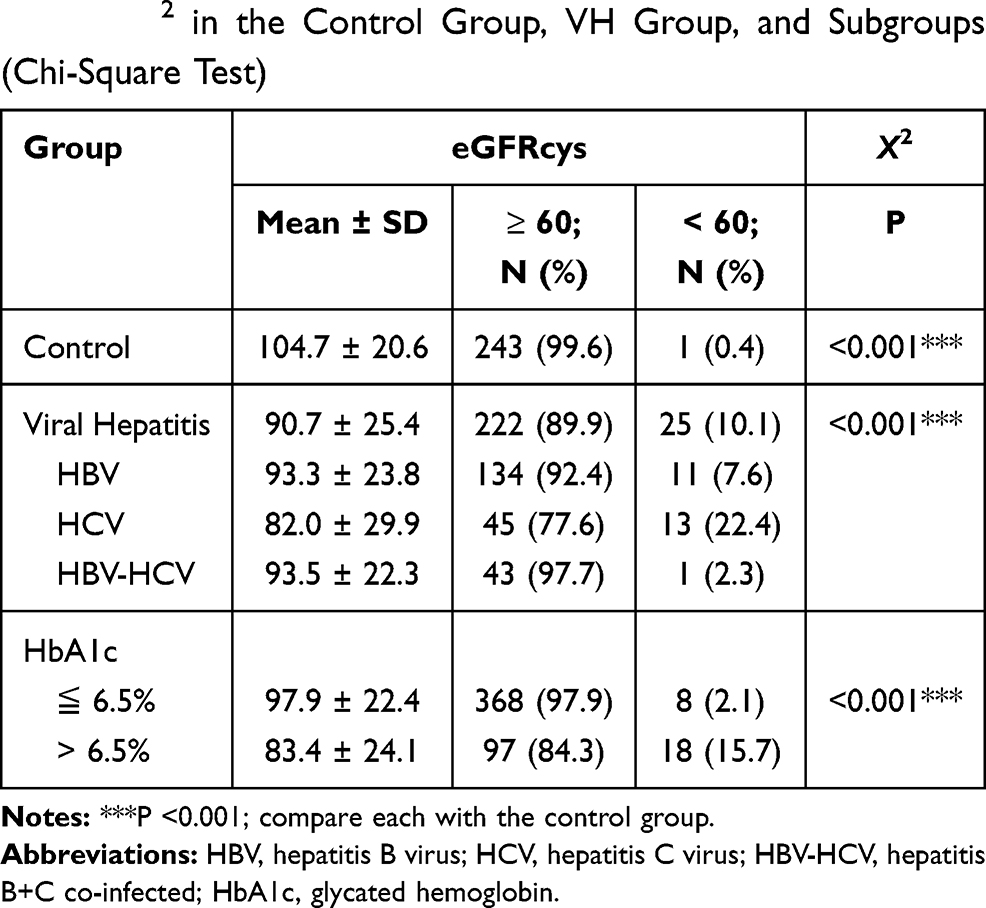 |
Table 3 The Compare of Prevalence Rates of eGFRcys <60 mL/Min/1.73m2 in the Control Group, VH Group, and Subgroups (Chi-Square Test) |
The chi-square test showed that among 247 (50.3%) patients with VH, 26 had nephropathy (eGFRcys <60). The proportion of patients with nephropathy in the VH group was 10.1% (25 patients), which was higher than the proportion of patients with nephropathy in the non-VH group at 0.4% (1 patient); the difference was statistically significant (***P < 0.001). Among the 26 patients with nephropathy (eGFRcys <60), the proportion of patients with VH with combined nephropathy and hyperglycemia was 15.7% (18 patients), while the proportion in the non-VH group was 2.1% (8 patients); the difference was statistically significant (***P < 0.001). The prevalence rates of eGFRcys <60 mL/min/1.73m2 in the HBV, HCV, and HBV-HCV subgroups were 7.6% (11 patients), 22.4% (13 patients), and 2.3% (1 patient), respectively. (Table 3).
Glucose, eAG(HbA1c), Cr, Cys C, and β2-Microglobulin in the VH Groups with eAG(GA) ≥200 mg/dL and eAG(GA) <200 mg/dL
The average glucose, eAG(HbA1c), Cr, Cys C, and β2-microglobulin levels were higher in the VH with eAG(GA) ≥200 mg/dL subgroup than in the VH with eAG(GA) <200 mg/dL subgroup. More patients with HBV, HCV, and HBV-HCV with eAG(GA) ≥200mg/dL were seen compared with those with eAG(GA) <200 mg/dL, and there were significant differences between the HBV and HCV subgroups and the control group. Marked differences also existed in this regard between the HCV subgroup and control group. (Table 4)
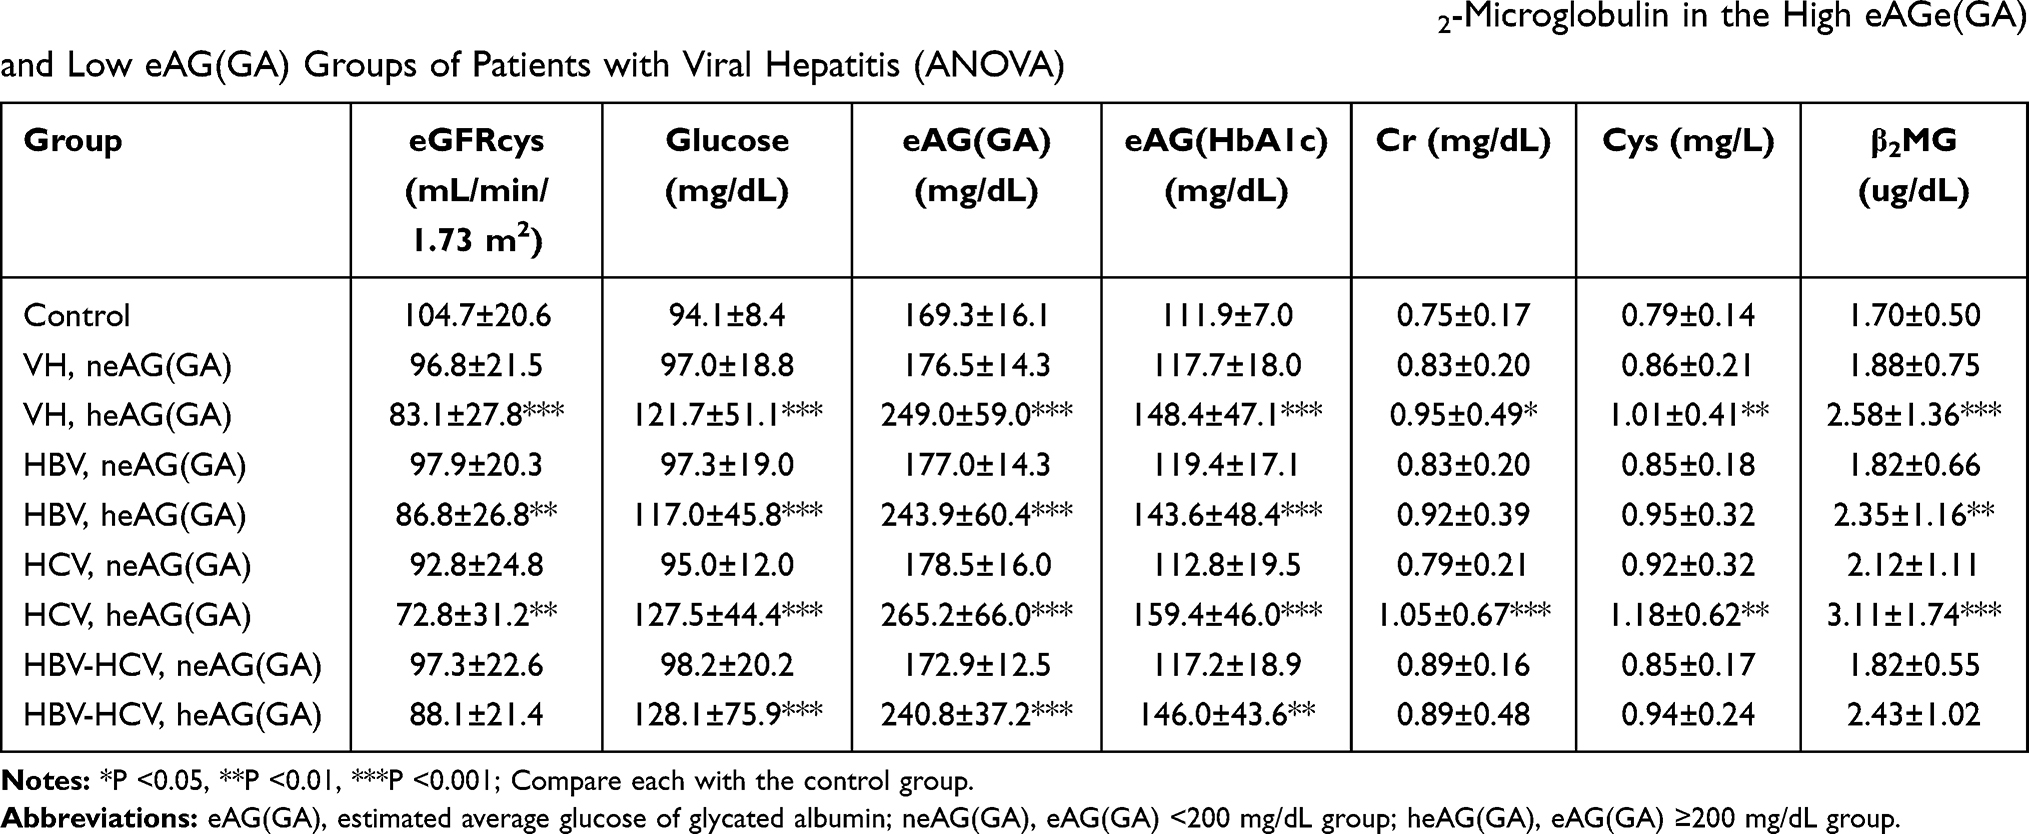 |
Table 4 The Average Levels of eGFRcys, eAG(GA), Glucose, eAG(HbA1c), Cr, Cys C, and β2-Microglobulin in the High eAGe(GA) and Low eAG(GA) Groups of Patients with Viral Hepatitis (ANOVA) |
eGFRcys in the VH with eAG(GA) ≥200 mg/dL and VH with eAG(GA) <200 mg/dL Subgroups
The average eGFRcys level in the VH with eAG(GA) ≥200 mg/dL subgroup was significantly lower than that in the VH with eAG(GA) <200 mg/dL subgroup. The average level of eGFRcys in patients with HBV, HCV, and HBV-HCV with eAG(GA) ≥200 mg/dL was lower than that in patients with eAG(GA) <200 mg/dL, with significant differences between the HBV and HCV subgroups and the control group. (Table 4; Figure 1D)
Discussion
VH reduces insulin sensitivity and increases insulin resistance, which is an important factor in the development of hyperglycemia/DM secondary to chronic liver disease.14,15,16 Approximately 80% of the patients with chronic liver diseases develop glucose intolerance, and 20–30% eventually develop frank DM.15,17,18 In one study, patients with hepatitis B with liver cirrhosis but no symptoms of DM showed impaired glucose tolerance (incidence rate, 20.53%), and patients with severe liver cirrhosis showed DM (incidence rate, 24.11%).19 Chronic hepatitis C infection is also associated with DM.20 The prevalence of CKD was reported to be higher in patients infected with HBV than in non-infected individuals.21
HbA1c, expressed as a percentage, is an important indicator of blood glucose control in patients with DM. It is widely used as a reference for evaluating the efficacy of medication and drug titration in the treatment of DM. Linear regression analysis of HbA1c and eAG(HbA1c) values showed a significant correlation; therefore, HbA1c levels can be expressed as eAG(HbA1c) for most patients with DM using the formula: eAG(HbA1c) (mg/dL) = 28.7 × HbA1c - 46.7.9,10 GA can more accurately reflect the recent blood sugar control in patients with diabetes-associated end-stage renal disease (ESRD) than HbA1c. The correlation equation used to convert GA into eAG(GA) concentration, ie, eAG(GA) (mg/dL) = 4.71×GA%+73.35, provides an easy-to-understand blood glucose level for the patients’ reference.8 Therefore, we used the average glucose, HbA1c, eAG(GA), and eAG(HbA1c) levels to evaluate the glucose status of patients in our study.
Testing for proteinuria is useful in the diagnosis of CKD. The National Kidney Foundation’s “K/DOQI Clinical Practice Guidelines for Chronic Kidney Disease: Evaluation, Classification, and Stratification” recommend using eGFR for the assessment of kidney function.22 eGFR and urine microalbumin (MA) are also validated as useful tools for the evaluation of renal insufficiency in patients with peripheral arterial disease.23 Five-stage eGFR is considered the best indicator of renal function and is widely used in screening patients with CKD.24 Usually, the eGFR is based on the patient’s serum creatinine (Cr) level.25,26 However, eGFRcr obtained using Cr levels might underestimate the true value of eGFR in patients with an eGFR of 60–80 mL/min/1.73m2,27 and 45–60 mL/min/1.73m2.28 Studies have found that the production of Cys C is more stable than that of Cr.6,29 Cys C can be used to estimate eGFRcys as an alternative to eGFRcr as it shows lower variability11 and better correlation with the morbidity and mortality rates for different population subsets (including those with CKD).28 Hence, the Kidney Disease: Improving Global Outcomes (KDIGO) recommends that regardless of renal damage and/or renal insufficiency, eGFRcys should be measured when the eGFRcr is between 45 and 60 mL/min/1.73m2 to reduce the risk of underestimation.6 Therefore, we used urine microalbumin, serum Cr, and eGFRcys levels to evaluate the renal function in our study.
In our study, 21.46% of the patients with VH were at a risk of developing hyperglycemia and 10.12% were at a risk of developing of CKD with hyperglycemia. Our study revealed a significant association between XMs (such as DM and nephropathy) and chronic viral liver disease. Type 2 DM and CKD have a considerable impact on follow-up medical care, labor, and economy and are associated with poor prognosis and management challenges; hence, disease prevention, screening, and clinical management strategies are urgently required.12,13
Our results showed that the average levels of glucose, eAG(GA), and eAG(HbA1c) were significantly higher in the VH group than in the control group, indicating that VH is closely associated with the occurrence of type 2 DM.
We also found that the average levels of Cr, Cys C, β2-microglobulin, and microalbumin were significantly higher in the VH group, especially in the HCV subgroup than in the control group. The average levels of eGFRcys were significantly higher in the control group than in the three subgroups, indicating that VH is closely related to the occurrence of CKD.
The Classification and Diagnosis of Diabetes: Standards of Medical Care in Diabetes—2020 states that in a patient with classic symptoms, the plasma glucose level is adequate to diagnose DM (symptoms of hyperglycemia or hyperglycemic crisis plus a random plasma glucose level of ≥200 mg/dL). Considering that the GA can accurately reflect the recent blood sugar levels and high blood glucose values after meals (post cibum), it meets the requirements of the American Diabetes Association (ADA) for the diagnosis of DM, and the reference level of eAG(GA) is 200 mg/dL, which we used in our study.30
We found that the average levels of glucose, eAG(HbA1c), Cr, Cys C, and β2-microglobulin were statistically and significantly higher in the VH patients with eAG(GA) ≥200 mg/dL than in the VH patients with eAG(GA) <200mg/dL. eGFRcys is commonly used in the clinical evaluation of CKD. The average level of eGFRcys was significantly lower in the patients with VH with eAG(GA) ≥200 mg/dL than in those with eAG(GA) <200 mg/dL.
An analysis using the logistic regression model found that the risk of renal impairment in the viral hepatitis group was 1.604-fold that of the non-viral hepatitis group. The risk of renal impairment in the hyperglycemia group was 1.832-fold that of the non-hyperglycemia group. The risk of renal impairment in patients with VH and hyperglycemia was 36.978-fold that of patients with no VH and hyperglycemia. The results indicate that VH is closely related to the occurrence of CKD, and hyperglycemia/DM increases the risk of nephropathy in patients with VH. (Table 5).
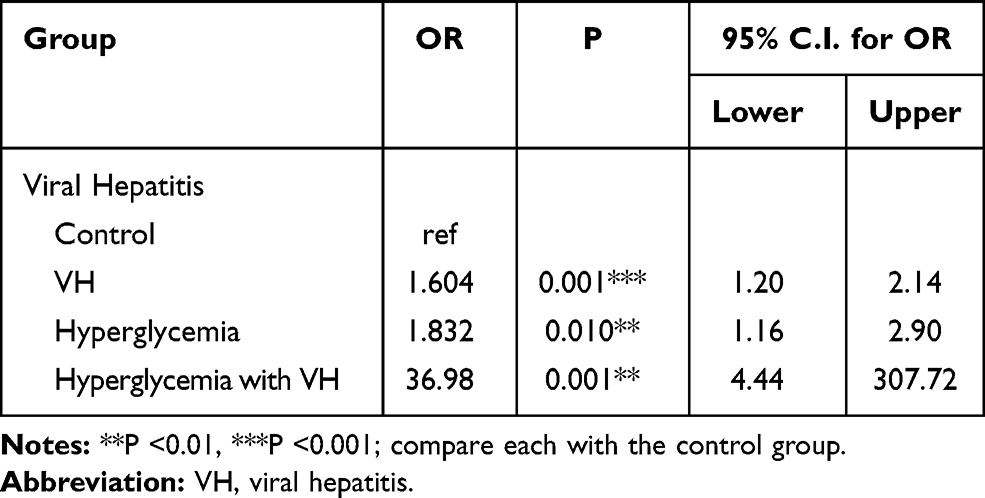 |
Table 5 The Risk of Renal Impairment in the Control Group, VH Group, and Combine Hyperglycemia with VH Subgroups (Logistic Regression Models) |
The possible mechanism could be reduced insulin sensitivity caused by VH, and increased insulin resistance, leading to the development of hyperglycemia/DM,15,16 which can lead to renal atherosclerosis and chronic inflammation.31–33 However, further research is necessary to confirm the mechanism.
The KDIGO guidelines clearly state that patients with kidney disease who are infected with HCV can be administered anti-viral drugs, and this will have a significant impact on follow-up care and long-term survival.6 Studies have also reported that anti-HCV drugs, such as telaprevir (TVR), peginterferon (PEG IFN), and ribavirin (RBV), can cause a significant increase in serum Cr and cys C and decrease in eGFRcr to < 60 mL/min/1.73m2, especially at high doses in case of TVR.34,35 All our patients with VH had been routinely followed up for at least 10 years; initially, none of them had hyperglycemia/DM and nephropathy, while some developed these conditions later, especially those VH and hyperglycemia/DM. Moreover, none of our patients used anti-viral drugs or other drugs that could affect renal function.
Conclusion
In conclusion, our study used many parameters to evaluate the glucose level and renal function in patients with VH and found that hyperglycemia/DM and renal disease (nephropathy) are closely associated with VH, especially in those with HCV infection. Patients with concurrent VH and hyperglycemia/DM, especially those with HCV infection, are particularly at risk of developing nephropathy. Patients with VH, especially those with HCV infection, should be closely followed up to evaluate the blood glucose and renal function for the early diagnosis and management of DM and nephropathy.
Abbreviations
DM, diabetes mellitus; VH, viral hepatitis; HBV, hepatitis B virus; HCV, hepatitis C virus; HBV-HCV, hepatitis B+C co-infected; GOT, glutamic oxaloacetic transaminase; HbA1c, glycated hemoglobin; GA, glycated albumin; eAG(GA), estimated average glucose calculated by glycated albumin; eAG(HbA1c), estimated average glucose calculated by HbA1c; CKD, chronic kidney disease; ESRD, end-stage renal disease; Cr, creatinine; Cys C, cystatin C; eGFRcys, estimated glomerular filtration rate calculated by cystatin C; MA, microalbumin; XM, extrahepatic manifestations; HD, hepatogenous diabetes; DN, diabetic nephropathy; WHO, World Health Organization.
Ethics and Informed Consent
The study was approved by the Tri-Service General Hospital Institutional Review Board (TSGHIRB No.:TC102-01) and conducted in accordance with the principles stated in the Declaration of Helsinki. All participants in the research were given the written informed consent before the health examination to authorize the data analysis. Personal identification data was removed in the Taichung Armed Force General Hospital, so the participants remained anonymous during the whole research process. All or part of the data used in this research were authorized by and received from the Taichung Armed Force General Hospital. All data accessed complied with relevant data protection and privacy regulations. The detail of the study population and data collection were described and reported in materials and methods.
Acknowledgments
The authors thank Dr. Yi-Yu Tu from the Department of Endocrine and Metabolism, Dr. Yu-Liang Lai and Dr. Wu-Hsien Kuo from the Gastroenterology Department, Dr. Chao-Hung Lai from the Department of Cardiology, Dr.Yu-Ching Li from the Family Medicine Department, Dr. De-Zheng Yue from the Department of Rectal Surgery for their assistance in collecting and consulting the research data.
Author Contributions
All authors made substantial contributions to conception and design, acquisition of data, or analysis and interpretation of data; took part in drafting the article or revising it critically for important intellectual content; agreed to submit to the current journal; gave final approval of the version to be published; and agree to be accountable for all aspects of the work.
Funding
This research was entirely funded by the Medical Service Fund of the Taichung Armed Force General Hospital (Research Plan Number: TCAFGH-D-109033).
Disclosure
The authors report no conflicts of interest in this work.
References
1. Jefferies M, Rauff B, Rashid H, Lam T, Rafiq S. Update on global epidemiology of viral hepatitis and preventive strategies. World J Clin Cases. 2018;6(13):589–599. doi:10.12998/wjcc.v6.i13.589
2. World Health Organization.. Global hepatitis report 2017; 2017. https://www.who.int/hepatitis/publications/global-hepatitis-report2017/en/.
3. Iovanescu VF, Streba CT, Ionescu M, et al. Diabetes mellitus and renal involvement in chronic viral liver disease. J Med Life. 2015;8(4):483–487.
4. Younossi ZM, Birerdinc A, Henry L. Hepatitis C infection: a multi-faceted systemic disease with clinical, patient reported and economic consequences. J Hepatol. 2016;65(1 Suppl):S109–S119. doi:10.1016/j.jhep.2016.07.005
5. Younossi ZM, Henry L, Po J, et al. Systematic review with meta-analysis: extrahepatic manifestations in chronic hepatitis C virus-infected patients in East Asia. Aliment Pharmacol Ther. 2019;49(6):644–653. doi:10.1111/apt.15131
6. Roth D, Bloom RD, Molnar MZ, et al. KDOQI US commentary on the 2018 KDIGO Clinical Practice Guideline for the Prevention, Diagnosis, Evaluation, and Treatment of Hepatitis C. Am J Kidney Dis. 2020;75(5):665–683. doi:10.1053/j.ajkd.2019.12.016
7. Garabed Eknoyan M, Norbert Lameire M, Co-Chairs FK, Kai-Uwe Eckardt M, Co-Chair IP. KDIGO 2012 Clinical Practice Guideline for the Evaluation and Management of Chronic Kidney Disease. Guideline. Off J Int Soc Nephrol. 2013;3(1):1–150. doi:10.1038/kisup.2012.73
8. Kim JK, Park JT, Oh HJ, et al. Estimating average glucose levels from glycated albumin in patients with end-stage renal disease. Yonsei Med J. 2012;53(3):578–586. doi:10.3349/ymj.2012.53.3.578
9. Nathan DM, Kuenen J, Borg R, et al. Translating the A1C assay into estimated average glucose values. Diabetes Care. 2008;31(8):1473–1478. doi:10.2337/dc08-0545
10. Rodriguez-Segade S, Rodriguez J, Paz JM, Camina F. Translating the A1C assay into estimated average glucose values: response to Nathan et al. Diabetes Care. 2009;32(1):
11. Stevens LA, Coresh J, Schmid CH, et al. Estimating GFR using serum cystatin C alone and in combination with serum creatinine: a pooled analysis of 3418 individuals with CKD. Am J Kidney Dis. 2008;51(3):395–406. doi:10.1053/j.ajkd.2007.11.018
12. Avramovic G, Oprea C, Surey J, et al. HepCare Europe-A service innovation project. HepCheck: characteristics of the patient population with active infection as defined by HCV RNA. Int J Infect Dis. 2020;91:246–251. doi:10.1016/j.ijid.2019.11.027
13. Crews DC, Bello AK, Saadi G. 2019 World Kidney Day Editorial - burden, access, and disparities in kidney disease. J Bras Nefrol. 2019;41(1):1–9. doi:10.1590/2175-8239-JBN-2018-0224
14. Ammirati AL. Chronic kidney disease. Rev Assoc Med Bras. 2020;66(Suppl 1):s03–s09. doi:10.1590/1806-9282.66.S1.3
15. Gundling F, Schumm-Draeger PM, Schepp W. Der hepatogene Diabetes - aktueller Stand der Diagnostik und Therapie [Hepatogenous diabetes - diagnostics and treatment]. Z Gastroenterol. 2009;47(5):436–445. doi:10.1055/s-0028-1109200
16. Iliescu L, Mercan-Stanciu A, Toma L, Ioanitescu ES, Severe A. Case of hyperglycemia in a kidney transplant recipient undergoing interferon-free therapy for chronic Hepatitis C. Acta Endocrinol (Buchar). 2018;14(4):533–538. doi:10.4183/aeb.2018.533
17. Chlup R, Ehrmann J. Zvlastnosti diagnostiky a lecby diabetu u jaternich onemocneni. [Special aspects of diagnosis and therapy of diabetes in liver diseases]. Vnitr Lek. 2001;47(5):320–323.
18. Petrides AS. Der Hepatogene Diabetes: pathophysiologie, therapeutische Besonderheiten und Prognose [Hepatogenic diabetes: pathophysiology, therapeutic options and prognosis]. Z Gastroenterol. 1999;Suppl 1:15–21.
19. Zhang X, Shen W, Shen DM. [A clinical analysis of liver disease patients with abnormal glucose metabolism]. Zhonghua Gan Zang Bing Za Zhi. 2006;14(4):289–292. (Chinese).
20. Mostafa A, Mohamed MK, Saeed M, et al. Hepatitis C infection and clearance: impact on atherosclerosis and cardiometabolic risk factors. Gut. 2010;59(8):1135–1140. doi:10.1136/gut.2009.202317
21. Du Y, Zhang S, Hu M, et al. Association between hepatitis B virus infection and chronic kidney disease: a cross-sectional study from 3 million population aged 20 to 49 years in rural China. Medicine. 2019;98(5):e14262. doi:10.1097/MD.0000000000014262
22. National Kidney Foundation. K/DOQI clinical practice guidelines for chronic kidney disease: evaluation, classification, and stratification. Am J Kidney Dis. 2002;39(2 Suppl 1):S1–266.
23. Endo M, Kumakura H, Kanai H, et al. Prevalence and risk factors for renal artery stenosis and chronic kidney disease in Japanese patients with peripheral arterial disease. Hypertensi Res. 2010;33(9):911–915. doi:10.1038/hr.2010.93
24. Hostetter TH, Olson JL, Rennke HG, Venkatachalam MA, Brenner BM. Hyperfiltration in remnant nephrons: a potentially adverse response to renal ablation. Am J Physiol. 1981;241(1):F85–93. doi:10.1152/ajprenal.1981.241.1.F85
25. Stevens LA, Coresh J, Greene T, Levey AS. Assessing kidney function–measured and estimated glomerular filtration rate. N Engl J Med. 2006;354(23):2473–2483. doi:10.1056/NEJMra054415
26. Stevens LA, Levey AS. Measured GFR as a confirmatory test for estimated GFR. J Am Soc Nephrol. 2009;20(11):2305–2313. doi:10.1681/ASN.2009020171
27. Murata K, Baumann NA, Saenger AK, Larson TS, Rule AD, Lieske JC. Relative performance of the MDRD and CKD-EPI equations for estimating glomerular filtration rate among patients with varied clinical presentations. Clin J Am Soc Nephrol. 2011;6(8):1963–1972. doi:10.2215/CJN.02300311
28. Shlipak MG, Matsushita K, Arnlov J, et al. Cystatin C versus creatinine in determining risk based on kidney function. N Engl J Med. 2013;369(10):932–943. doi:10.1056/NEJMoa1214234
29. Stevens LA, Schmid CH, Greene T, et al. Factors other than glomerular filtration rate affect serum cystatin C levels. Kidney Int. 2009;75(6):652–660. doi:10.1038/ki.2008.638
30. American Diabetes A. 2. Classification and diagnosis of diabetes: standards of medical care in diabetes-2020. Diabetes Care. 2020;43(Suppl 1):S14–S31. doi:10.2337/dc20-S002
31. Drummond CA, Brewster PS, He W, et al. Cigarette smoking and cardio-renal events in patients with atherosclerotic renal artery stenosis. PLoS One. 2017;12(3):e0173562. doi:10.1371/journal.pone.0173562
32. Eloueyk AK, Alameddine RY, Osta BA, Awad DM. Correlations between serum inflammatory markers and comorbidities in patients with end-stage renal disease. J Taibah Univ Med Sci. 2019;14(6):547–552. doi:10.1016/j.jtumed.2019.10.003
33. Becares N, Harmala S, China L, et al. Immune regulatory mediators in plasma from patients with acute decompensation are associated with 3-month mortality. Clin Gastroenterol Hepatol. 2020;18(5):1207–1215 e6. doi:10.1016/j.cgh.2019.08.036
34. Fukuda K, Imai Y, Hiramatsu N, et al. Renal impairment during the treatment of telaprevir with peginterferon and ribavirin in patients with chronic hepatitis C. Hepatol Res. 2014;44(12):1165–1171. doi:10.1111/hepr.12229
35. Mauss S, Hueppe D, Alshuth U. Renal impairment is frequent in chronic hepatitis C patients under triple therapy with telaprevir or boceprevir. Hepatology. 2014;59(1):46–48. doi:10.1002/hep.26602
 © 2021 The Author(s). This work is published and licensed by Dove Medical Press Limited. The
full terms of this license are available at https://www.dovepress.com/terms
and incorporate the Creative Commons Attribution
- Non Commercial (unported, 3.0) License.
By accessing the work you hereby accept the Terms. Non-commercial uses of the work are permitted
without any further permission from Dove Medical Press Limited, provided the work is properly
attributed. For permission for commercial use of this work, please see paragraphs 4.2 and 5 of our Terms.
© 2021 The Author(s). This work is published and licensed by Dove Medical Press Limited. The
full terms of this license are available at https://www.dovepress.com/terms
and incorporate the Creative Commons Attribution
- Non Commercial (unported, 3.0) License.
By accessing the work you hereby accept the Terms. Non-commercial uses of the work are permitted
without any further permission from Dove Medical Press Limited, provided the work is properly
attributed. For permission for commercial use of this work, please see paragraphs 4.2 and 5 of our Terms.