Back to Journals » Degenerative Neurological and Neuromuscular Disease » Volume 7
Biomarkers of multiple sclerosis: current findings
Authors Harris VK, Tuddenham JF, Sadiq SA
Received 2 September 2016
Accepted for publication 8 December 2016
Published 12 January 2017 Volume 2017:7 Pages 19—29
DOI https://doi.org/10.2147/DNND.S98936
Checked for plagiarism Yes
Review by Single anonymous peer review
Peer reviewer comments 5
Editor who approved publication: Dr Thomas Müller
Violaine K Harris, John F Tuddenham, Saud A Sadiq
Tisch Multiple Sclerosis Research Center of New York, New York, NY, USA
Abstract: Multiple sclerosis (MS) is an autoimmune disease affecting the brain and spinal cord that is associated with chronic inflammation leading to demyelination and neurodegeneration. With the recent increase in the number of available therapies for MS, optimal treatment will be based on a personalized approach determined by an individual patient’s prognosis and treatment risks. An integral part of such therapeutic decisions will be the use of molecular biomarkers to predict disability progression, monitor ongoing disease activity, and assess treatment response. This review describes current published findings within the past 3 years in biomarker research in MS, specifically highlighting recent advances in the validation of cerebrospinal fluid biomarkers such as neurofilaments (light and heavy chains), chitinases and chitinase 3-like proteins, soluble surface markers of innate immunity, and oligoclonal immunoglobulin M antibodies. Current research in circulating miRNAs as biomarkers of MS is also discussed. Continued validation and testing will be required before MS biomarkers are routinely applied in a clinical setting.
Keywords: multiple sclerosis, biomarkers, cerebrospinal fluid, neurofilament, miRNA
Introduction
Multiple sclerosis (MS) is a chronic autoimmune-mediated demyelinating disease of the central nervous system (CNS) that is usually associated with varying degrees of progressive disability. In most patients the early stages of disease, known as relapsing-remitting MS (RRMS) are characterized by clinical exacerbations, or relapses, caused by autoreactive immune cells that traffic into the CNS, resulting in focal inflammation and demyelination often visible as gadolinium-enhancing lesions on magnetic resonance imaging (MRI). Relapses are followed by periods of clinical remission as inflammation resolves and remyelination occurs. Over time, chronic inflammation with scar formation (sclerosis), accumulation of axonal damage and brain atrophy, and inhibition of remyelination contribute to progressively worsening disability, called secondary progressive MS (SPMS).1 Less frequently, in ~15% of patients, the disease is progressive from clinical onset and is designated as primary progressive MS (PPMS).
Clinical management of MS is challenging at the onset of disease because of the clinical uncertainty about long-term prognosis and the rate of disease progression. Because the cause of MS is not known, diagnosis is a complex process based on a composite of clinical symptoms and tests. Detecting and predicting disease progression is difficult due to the lack of sensitivity of current clinical assessments. For example, standard MRI-based imaging does not fully capture the many ongoing disease mechanisms such as neurodegeneration, demyelination/remyelination, microglial activation, and astrogliosis, all of which can contribute to subclinical disease activity.2 Treatment decisions are based more on risk assessment and trial and error than on objective assessments that predict who will respond to any given disease-modifying therapy (DMT). The development of biomarkers that predict treatment response and inform prognosis based on the degree of underlying disease activity would allow for more timely and rational individualized clinical management of MS patients.3 Thus, optimal treatment initiated at disease onset based on validated biomarkers would greatly reduce disease progression and the development of disability.
Biomarkers, for the purposes of this review, are molecular markers detectable in bodily fluids either by immunoassays (enzyme-linked immunoabsorbent assays [ELISAs]) to detect soluble protein biomarkers or quantitative polymerase chain reaction (PCR) to detect circulating miRNAs. Nonconventional MRI biomarkers and genetic variants associated with susceptibility to disease have been reviewed elsewhere.4,5 For biomarkers to be useful in clinical management, they must sensitively and specifically detect either a normal or pathological process. In addition, biomarkers need to be easy to collect from bodily fluids. While urine analysis would be the least invasive for collection, it is unlikely to accurately reflect MS-related changes because of its anatomic distance from disease pathology in the CNS. The distinct advantage of blood-based biomarkers is that blood can be routinely collected in large cohorts of patients in a minimally invasive manner. Blood biomarkers are most likely to reflect peripheral immune mechanisms, and may indirectly reflect CNS mechanisms.6,7 Cerebrospinal fluid (CSF), however, is the most direct source of biomarkers given its proximity to disease pathology. The reluctance by some neurologists and patients to undergo repeated lumbar puncture (LP) procedures is understandable, given that it is relatively invasive, requires a neurologist to perform the procedure, and can lead to adverse effects, such as spinal headaches. However, the incidence of untoward complications is minimized by the use of atraumatic needles of 24 gauge or greater and LP procedures are performed routinely in many MS centers.8,9 Furthermore, the emergence of accurate and reliable CSF biomarkers, as well as the development of safe and effective intrathecal therapies will likely result in CSF analysis becoming a routine part of optimal MS clinical management. For these reasons, recent advances in discovery and validation of CSF biomarkers will be the focus of this review.
Biomarkers in MS subtypes
MS subtypes
The need for biomarkers and their clinical application will depend on the stage of the disease and on the clinical subgroups of MS. Upon the first clinical presentation of a demyelinating event, often referred to as clinically isolated syndrome (CIS), there is a need for biomarkers to predict “conversion” to clinically definite MS. These patients frequently present with optic neuritis, transverse myelitis, or sensory complaints. Predicting conversion depends on the presence of associated MRI abnormalities on CNS imaging and on whether there is evidence of intrathecal oligoclonal IgG antibodies (IgG OCBs) in spinal fluid analysis. Currently, definite conclusions are frequently not possible at this stage because in clinical practice unequivocal MRI and CSF findings at this stage occur infrequently. In CIS patients not only is the risk of conversion important but also treatment decisions would be greatly aided by biomarkers that predict future disease severity. For example, biomarkers correlating with axonal damage or oligodendroglial loss might allow for identification of patients for whom aggressive, early therapeutic intervention would presumably help delay or attenuate disease progression and long-term disability. Because CSF analysis is frequently performed for diagnostic purposes in CIS patients, there have been numerous biomarker discovery studies in CIS patients comparing those who convert to MS to those who do not. The current challenge is to understand the reliability of predictive biomarkers and be able to identify subgroups of patients with a more severe disease prognosis. A further challenge is to reliably differentiate between the clinical subtypes. This is particularly difficult in some cases of late RRMS and early SPMS. In this regard, metabolite profiling of serum using nuclear magnetic resonance may reveal reliable biomarkers to distinguish between RRMS, SPMS, and PPMS.10 Metabolite profiling of CSF is also currently being developed but all these studies require further validation prior to clinical utilization.
Responsiveness to treatments
Patients with RRMS have a number of treatment options available, and there is a need to discover better biomarkers that predict treatment response and stratify risk. As of 2016, there are 14 Food and Drug Administration approved DMTs to treat RRMS, with many more in the pipeline. The majority of DMTs target immune mechanisms in MS and thus are approved to reduce the number and severity of immune-driven relapses. The therapeutic efficacy of certain DMTs, including interferon beta (IFNβ) and natalizumab, is often diminished by the development of neutralizing antibodies, and thus serum antibodies are routinely assayed as biomarkers of treatment response.11 Another clinically useful biomarker of IFNβ response is myxovirus resistance protein (MxA), a gene rapidly induced in peripheral blood mononuclear cells (PBMCs) by IFNβ.11 Although MxA mRNA levels lack relevance regarding the therapeutic mechanism of action of IFNβ in MS, they reflect the bioactivity of IFNβ and the reduced therapeutic response due to neutralizing antibodies.
DMTs in MS are also associated with varying risk profiles. For example, natalizumab is an anti-VLA4 antibody that inhibits immune cell trafficking into the CNS and is highly effective in reducing relapse rate and delaying disease progression in patients with RRMS.12 However, natalizumab use is associated with progressive multifocal leukoencephalopathy (PML), a potentially life-threatening infection caused by CNS reactivation of the John Cunningham virus (JCV). PML risk is monitored by prospective serum JCV antibody testing. Currently, use of the “stratify test” that measures anti-JCV antibody level on an ELISA-based test allows effective risk stratification of patients receiving natalizumab.13 In addition, tests that predict treatment response would allow clinicians to develop personalized treatment plans based on an informed understanding of the risk–benefit ratio for each patient.
MS disease activity
Accurate assessment of disease activity in individual MS patients is essential for the determination of treatment response. Current definitions of disease activity, which include clinical relapses, MRI activity, and disease progression, do not sufficiently quantify subclinical disease activity that can contribute to disease worsening. Disease activity associated with intrathecal inflammation has been shown to correlate with certain biomarkers in CSF, including Fetuin-A, osteopontin, and CXCL-13, whose levels decrease in response to treatment.3,14,15 In addition, biomarkers are needed that reflect the ongoing neurodegeneration, grey and white matter demyelination and remyelination, microgliosis, astrogliosis, and oxidative stress that contribute to overall disease activity. The need is particularly relevant for progressive MS (SPMS and PPMS) where there is a lack of biomarkers that can give objective assessments of disease mechanisms that contribute to neurologic worsening.
The biomarkers described in Table 1 were selected based on current published findings within the past 3 years investigating biomarkers or biomarker categories that attempt to meet some of the unmet needs in MS described above. Furthermore, CSF biomarkers were specifically highlighted because of their relevance to the disease process and their degree of validation.
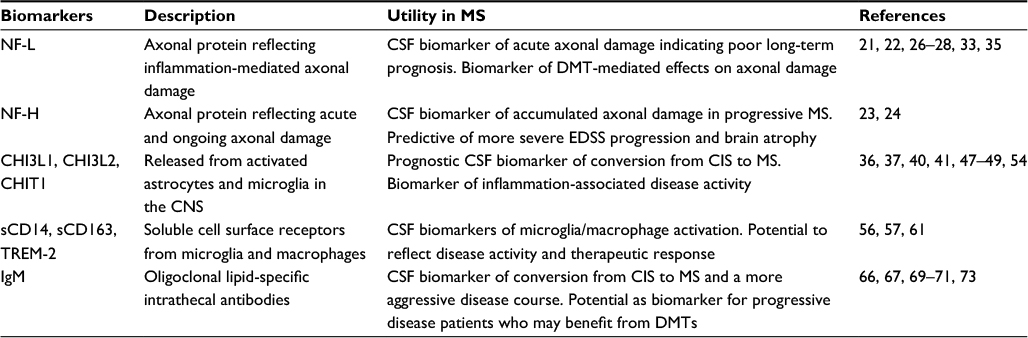 | Table 1 Emerging CSF biomarkers in MS Abbreviations: CHIT1, chitinase 1; CHI3L1, chitinase 3-like-1; CHI3L2, chitinase 3-like-2; IgM, immunoglobulin M; CIS, clinically isolated syndrome; CNS, central nervous system; CSF, cerebrospinal fluid; DMT, disease-modifying therapy; EDSS, expanded disability status scale; MS, multiple sclerosis; NF-L, neurofilament light; NF-H, neurofilament heavy; sCD14, soluble CD14; sCD163, soluble CD163; TREM-2, triggering receptor expressed on myeloid cells 2. |
Neurofilaments
Neurofilaments are emerging as some of the most promising new biomarkers for MS, offering exciting potential to monitor ongoing axonal injury and neurodegeneration. Neurofilaments are neuron-specific intermediate filaments formed by heteropolymers of low (neurofilament light [NF-L]), medium (neurofilament medium), and high (neurofilament heavy [NF-H]) molecular weight protein subunits. Their relative stability and abundance in CNS tissue make them ideal biomarker candidates. Neurofilament levels in biological fluids, specifically CSF, are suggested to reflect the degree of axonal damage based on their release into the extracellular space during axonal injury. In MS, CSF concentrations of NF-L and phosphorylated NF-H (pNF-H) are elevated, especially during relapses.16,17 Interestingly, levels of NF-L and NF-H do not always directly correlate with each other, perhaps due to differences in protein stability and assay sensitivity.18 NF-L is considered to reflect early, acute, inflammatory-mediated axonal damage due to its correlation with inflammatory disease and correlates less accurately with disability progression.19 Conversely, NF-H levels best correlate with disease progression and thus are thought to reflect ongoing neurodegenerative axonal damage.19
Recent evidence highlights the predictive value of CSF neurofilaments. Increased amount of NF-L in CSF not only correlated with inflammatory outcomes such as gadolinium enhancing lesions but was also predictive of conversion from CIS to RRMS and predictive of long-term disability outcomes.17,20 In a cohort of 109 CIS patients, high CSF NF-L was an independent prognostic marker for earlier conversion from CIS to clinically definite MS.21 Similarly, increased concentration of NF-L in CSF predicted visual outcome in patients with optic neuritis as the first demyelinating episode.22 The results of these studies indicate that elevated NF-L in early disease (≥1150 or ≥1770 ng/L, depending on the study) may predict long-term ongoing disease rather than a single isolated event.21,22 How NF-L concentration in CSF compares to current clinical and imaging assessments as a prognostic biomarker in individual patients remains to be determined.
The clinically relevant prognostic value of NF-H was also recently demonstrated in a cohort of 51 patients followed for an average of 15 years.23,24 RRMS patients with a high baseline level of CSF pNF-H showed a more severe expanded disability status score (EDSS) progression over time compared to those with normal levels.23 Importantly, MRI atrophy measures demonstrated a significant association between elevated NF-H and accelerated brain and spinal cord deterioration.24 Elevated NF-H (≥20 pg/mL) in CSF was only predictive of atrophy measured 15 years later, but not 3 years later.25 Brain atrophy is generally associated with long-term neurologic worsening and sustained disability in MS patients. Thus, the use of prognostic biomarkers, such as NF-H, early in disease could significantly affect the therapeutic course of individuals by identifying patients at high risk of developing progressive disability. While these studies are promising, more robust prospective studies are necessary on larger cohorts of patients to determine the sensitivity and specificity of these biomarkers.
As a step toward a better understanding of neurodegenerative disease mechanisms in MS, recent studies have found novel correlations between neurofilaments and other biomarkers of disease activity. CSF NF-L was found to be inversely correlated with serum levels of vitamin D in a cohort of 153 MS patients.26 This study suggested that normal or high normal values of vitamin D are not only associated with decreased inflammatory activity in MS but may also protect against axonal damage. Axonal injury as measured by neurofilaments was also found to correlate with mitochondrial dysfunction (CSF lactate) and CNS autoimmunity and inhibition of remyelination (CSF lipocalin 2), thus potentially expanding the repertoire of CSF biomarkers to measure ongoing neurodegenerative activity in MS.27,28
Clearly one of the most exciting aspects of neurofilament biomarkers is their potential for use as outcomes in clinical trials for progressive MS. As new therapies are being developed, including stem cell-based regenerative therapies, trial outcomes measuring disease progression and neurodegeneration will be necessary.29 Initial support for the incorporation of NF measurements into clinical trial design comes from studies analyzing post hoc reduction in NF levels in response to DMTs, such as natalizumab, rituximab, and mitoxantrone.30–32 In a recent study, CSF NF-L was decreased in patients after switching treatment from IFNs or glatiramer acetate to rituximab, correlating with traditional MRI measures of inflammatory activity,33 further supporting CSF NF-L as a measure of disease activity. Conversely, CSF NF-L did not change in response to intrathecal rituximab (IT-RTX), consistent with lack of effect of IT-RTX on overall disease activity.34 Finally, post hoc analysis of a subset of patients in the phase 3 fingolimod trial (FREEDOMS trial) showed a reduction in CSF NF-L following 12 months of treatment.35 Overall these studies demonstrate that CSF NF-L analysis is a potentially useful quantitative biomarker of axonal damage in MS and support its incorporation as a secondary outcome in future clinical trial design.
As mentioned previously, a remaining concern regarding neurofilament testing in CSF is the need for repeated LP. Whether blood levels of neurofilaments sufficiently correlate with disease activity and axonal loss remains to be determined. Initial studies showed that blood NF-L correlated both with CSF levels and with MRI measures of disease activity in early RRMS patients.6 Similarly, pNF-H in plasma was elevated in CIS (n=36) and RRMS (n=36), correlating with a separate marker of oxidative stress.7 More studies investigating the specificity and sensitivity of peripherally circulating neurofilaments will be required to validate these findings.
Chitinase and chitinase 3-like proteins
Chitinases, including chitinase I (CHIT1) or chitotriosidase, are a family of secreted glycoproteins that bind and hydrolyze chitin. Chitinase 3-like-1 (CHI3L1) and Chitinase 3-like-2 (CHI3L2) are chitin-binding proteins homologous to chitinases, but lacking their capacity for chitin hydrolysis. In MS brain tissue, CHI3L1 (also known as YKL-40) and CHI3L2 are expressed in astrocytes in white matter plaques and in normal appearing white matter, and CHI3L1 is also expressed in microglia in MS lesions.36–39 However, CHI3L1 levels correlate poorly with GFAP or sCD14, established biomarkers for astrogliosis and microglial activation respectively, and stimulation of macrophages in vitro with IL-13 resulted in increased CHI3L1 and CHIT1 secretion, suggesting that further inquiry is needed to identify the origins for each of these biomarkers in the CNS.21,40–42 In addition, CHIT1 and CHI3L1 mediate increased immune cell trafficking across the blood brain barrier.42 Further research on the biological role and origin of these proteins will allow better interpretation of their use as biomarkers and identification of novel therapeutic targets.
Of the three family members, CHI3L1 has been studied most extensively in MS. CHI3L1 is hypothesized to play a role in chronic inflammation and tissue remodeling.38,43 Both unbiased proteomic screening and ELISA testing of CSF have correlated elevated amounts of CHI3L1 with optic neuritis, CIS, and MS.36,41,44–48 The best-validated role for CHI3L1 is as a prognostic marker of MS conversion based on observations that increased concentration of CHI3L1 (cutoff ≥100, ≥170, or ≥189 ng/mL, depending on the study) in CSF correlates with higher likelihood of conversion from CIS or optic neuritis to clinically definite MS.22,36,47,49 Elevated CHI3L1 levels correlated with a shorter time to convert from CIS to MS, more rapid development of disability, and increased likelihood of long-term cognitive impairment over a period ranging from 5 to 14 years.21,22,47,49 Another consistent finding across recent studies is that DMTs, including natalizumab and fingolimod, reduce CHI3L1 levels, with the notable exception of JCV positive patients switching from natalizumab to fingolimod, who experienced no notable alteration in CSF levels.41,46,48
A role for CHI3L1 as a biomarker for disease activity or disease progression is less clear. While some studies have shown minimal differences in CHI3L1 levels between RRMS and SPMS patients or between patients during a relapse and in remission, one study found significant differences in both categories, demonstrating the need for future research in this area.21,40,41 In recent studies, elevated CSF CHI3L1 levels correlated with brain imaging (numbers of gadolinium enhancing, T1, and T2 lesions) and brain atrophy (brain parenchymal fraction or cerebral sulci size) but not damage to normal appearing white matter, thus suggesting that CHI3L1 reflects inflammation-associated damage and not neurodegeneration.40,47,48 It remains unclear whether serum levels of CHI3L1 can provide the same prognostic value as CSF levels. Initial studies have shown that serum levels of CHI3L1 possessed good diagnostic value for discriminating MS from CIS and controls and for predicting MS progression, although the ability of this biomarker to discriminate between SPMS/PPMS and RRMS was not consistent.36,50
CHIT1’s role as a biomarker in MS is less defined. Its extreme stability in CSF, and its responsiveness to immunomodulatory treatments such as natalizumab have previously been noted.51 CSF CHIT1 levels are generally elevated in MS compared to non-MS or healthy controls, although the relative increase of CHIT1 in RRMS, SPMS, and PPMS subgroups is variable in different studies due to small cohorts, differences in diagnostic methodology, and varied methods of quantifying CHIT1 levels.42,52,53 Correlations between CHIT1 and clinical, radiologic, and prognostic measures also lack consistency between studies. Increased CHIT1 levels correlated with clinical variables such as EDSS (although one study found no significant correlation after adjusting for age), radiologic measures such as MRI lesion load (although only for PPMS patients in one study), and prognostic measures such as OCBs and increased cell count in CSF (although only for RRMS patients in one study).42,45,52–54 Similar to the other CSF biomarkers discussed, the serum levels of CHIT1 are more variable in terms of differentiating MS patients and controls.42,53,54 Nevertheless, some studies have noted differences substantive enough to allow discrimination between progressive and relapsing-remitting forms as well as between MS patients and controls, suggesting that serum CHIT1 may be suitable.45,52 Interestingly, nonresponders to IFN-β treatment had lower pretreatment serum levels of CHIT1, although there was no significant difference between groups posttreatment.45 Overall, variable results in different studies make it difficult at present to determine CHIT1’s utility as a biomarker for MS.
As a biomarker, CHI3L2 has only been studied alongside CHIT1 or CHI3L1. One study found that CSF CHI3L2 correlated well with CHI3L1 and osteopontin in optic neuritis patients, and demonstrated that CHI3L2 predicted MS development with superior accuracy to CHI3L1, although it found that CHI3L2 was not a useful serum biomarker.54 Another study also demonstrated that CSF, but not serum, CHI3L2 had good diagnostic accuracy in discriminating RRMS from control patients, and that the CSF CHI3L1/CHI3L2 ratio had superior predictive accuracy than either alone, but in contrast, found that CSF and serum CHI3L2 did not accurately predict MS development.36 Taken together, the studies described above demonstrate that some chitinases may be promising biomarkers for discriminating MS, optic neuritis, and CIS patients from healthy controls, and predicting disease progression. Validation in larger cohorts will be required before they can be utilized as part of general MS clinical practice.
Biomarkers of innate immunity
Macrophage/microglial activation is a common feature in MS that is gaining recognition as a predominant player in MS pathogenesis. Microglia and macrophages are the dominant immune cell type in MS lesions where they interact with adaptive immune cells to initiate demyelination, and play both destructive and reparative roles. Activated macrophages derived from peripheral monocytes secrete proinflammatory cytokines and mediate demyelination and axonal damage, whereas activated resident microglia clear cellular debris and thus promote tissue recovery.55 As the involvement of microglia and macrophages in MS becomes better understood, biomarkers for innate immune activation in the CNS will be needed to evaluate disease status and response to therapies.
Detection of soluble cell surface markers in CSF may characterize the immune phenotype of intrathecal inflammation in MS.56 Biomarkers of myeloid lineage, such as soluble CD163 (sCD163) and sCD14 are released by monocytes and are elevated in MS CSF.56 sCD14 only weakly correlated with absolute CSF monocyte counts, suggesting that the sCD14/monocyte ratio may be a useful marker of microglial activation. sCD163 showed a better correlation with monocyte count in MS CSF, and previous studies have suggested it may be a biomarker of macrophage activity.57 Quantitation of intrathecal production of sCD163 by measuring the CSF/serum ratio of sCD163 in MS patients demonstrated elevated levels in RRMS and PPMS patients, along with other biomarkers of inflammation and neurodegeneration including CSF NF-L.58 Overall these studies indicate that soluble surface markers sCD14 and sCD163 may be useful biomarkers of intrathecal microglial and macrophage activation as a way to monitor disease activity and therapeutic response.
Ongoing research on microglia is helping to identify new candidate markers to assess the degree of microglial activation in MS. The triggering receptor expressed on myeloid cells 2 (TREM-2) is expressed at high levels in CNS microglia where it may play a role in attenuating the immune response.59,60 Soluble TREM-2 is increased in CSF from MS patients, and is reduced following natalizumab treatment.61 The role of TREM-2 in MS and the significance of ectodomain shedding to form the soluble TREM-2 remain unknown. These preliminary investigations need to be validated in a larger cohort of patients in order to confirm its use as a biomarker of microglial activation in MS.
Immunoglobulin M (IgM)
IgG and IgM antibodies present as OCBs in the CSF are hypothesized to represent an antigen-driven pathophysiology in MS, although the specific antigens remain unknown. Intrathecal IgG OCBs are a hallmark of MS and are the most widely used diagnostic biomarker in MS, despite not being specific to MS.62,63 In addition, an increased IgG synthetic rate and elevated IgG index are also used as corollary evidence for MS. In contrast to IgG, lipid-specific IgM antibody OCBs are present in the CSF of only 40% of MS patients.64,65 Similar to IgG OCBs however, IgM OCBs are shown to have value in predicting early conversion from CIS to clinically definite MS, along with other parameters such as lower age at onset and the presence of optic neuritis.66 The presence of IgM OCBs in CIS patients also predicted a more aggressive disease course, and correlated with brain atrophy, lesion load, and increased CSF levels of CXCL13, a chemokine that directs the migration of B-cells.64,65,67,68 Interestingly, intrathecal IgM antibodies showed a high degree of somatic hypermutation, suggesting an antigen-driven germinal center-like reaction of IgM-producing B cells in MS.69 While neither IgG nor IgM OCBs are unique to MS, the identification of their target antigen(s) could reveal important clues to the trigger and pathophysiology of the disease.69
More recent evidence supports the measurement of intrathecal IgMs as a biomarker in progressive disease. The presence of IgM OCBs correlated with increased concentration of NF-L in CSF, a higher MS Severity Score, increased lesion number on MRI, and thinning of the retinal nerve fiber layer, suggesting a role for intrathecal IgMs in the ongoing axonal damage in MS.70,71 Indeed, IgM antibodies were present in MS lesions where they targeted oligodendrocytes and axons, suggesting a possible direct role of lipid-specific antibodies in promoting CNS injury.72 Notably, researchers found that the presence of IgM OCBs in a subset of PPMS patients correlated with an active inflammatory disease subtype despite the diagnosis of progressive disease, suggesting that IgM OCBs may be a biomarker for progressive patients who may benefit from immune-directed treatment.73 These studies will require validation to confirm the prognostic value of IgM OCBs. Nevertheless, these data suggest that IgM OCBs may be a useful prognostic biomarker for MS, allowing neurologists and patients to make more informed treatment decisions.
Circulating MicroRNA (miRNAs)
miRNAs are short (~20 nucleotide), single-stranded, noncoding RNAs which regulate posttranscriptional protein synthesis, and thereby gene expression.74–76 Dysregulation of miRNAs may play an important role in the underlying mechanisms of disease in MS, and potentially serve as a readout to measure the disease process.77,78 Circulating miRNAs are relatively stable and are often packaged in microvesicles or exosomes.79 miRNAs identified by various methods including quantitative PCR, miRNA array analysis, small noncoding RNA cloning, or next generation sequencing have been detected in most biofluids, such as CSF, serum, plasma, whole blood, and PBMCs.80,81 These various properties of miRNAs have made them one of the most exciting and rapidly expanding fields in MS biomarker research.
A number of studies have used miRNA screening approaches to identify candidate MS biomarkers, revealing miRNAs that are up or downregulated in MS vs. controls, associated with the conversion of CIS to MS, and regulated in response to DMTs (Table 2). The miRNAs identified in these studies vary depending on the sample source, method of detection, and degree of validation. A subset of these studies compared CSF and serum miRNA levels, noting that CSF and serum levels of the same miRNA may differ substantially. For example, CSF levels of miR-181c and miR-922 were identified and associated with conversion from CIS to RRMS, whereas in serum, only miR-922 showed this correlation.82 Another study identified miR-150 in both CSF and plasma, where CSF levels correlated with other prognostic biomarkers including CSF cell count, IgG index, CXCL13, MMP-9, and osteopontin.83 Interestingly, CSF and plasma levels of miR-150 are altered by DMTs and the effects are medication specific. Thus, fingolimod treatment decreased plasma miR-150 levels and did not affect CSF levels, whereas natalizumab treatment increased plasma miR-150 levels and decreased CSF levels.83 These results suggest, not surprisingly, that miRNA levels in CSF compared to plasma reflect different aspects of underlying disease pathophysiology. Indeed, of the 63 miRNAs reported to be differentially expressed in white matter lesions, ~40% are detected in CSF analysis, supporting the hypothesis that miRNAs circulating in CSF mirror pathology in CNS tissue.83
 | Table 2 Candidate miRNA biomarkers in MS Note: *Proposed targets from miRDB107,108 (www.mirdb.org) unless referenced otherwise. Abbreviations: AHSCT, autologous hematopoietic stem cell transplantation; CIS, clinically isolated syndrome; CSF, cerebrospinal fluid; IFNβ, interferon beta; IL, interleukin; miRNA, microRNA; MS, multiple sclerosis; PBMC, peripheral blood mononuclear cell; RRMS, relapsing-remitting MS; SPMS, secondary progressive MS; MAPK, mitogen-activated protein kinase; NF-κB, nuclear factor kappa-light-chain-enhancer of activated B cells; TGFβ, transforming growth factor beta; TLR, toll-like receptors. |
As with protein biomarkers, a keen area of interest in miRNA biomarker research is the ability of miRNAs to predict treatment response or treatment risk. Altered levels of miRNAs in PBMCs are normalized by autologous hematopoietic stem cell transplantation and natalizumab.84,85 Regarding natalizumab risks, several miRNAs are possible biomarkers of PML development in patients receiving natalizumab, although these results need to be validated on a larger cohort of patients.86 Interestingly, in assessing IFNβ treatment response, a screening study of miRNAs identified elevated baseline levels of miR-26a-5p in patients categorized as “responders” to IFNβ therapy when compared to nonresponders.80 This finding deserves further investigation and validation, as an accurate biomarker to predict treatment response is much needed.
Ultimately, because most studies to date have relied on relatively small cohorts for biomarker discovery, a critical need remains for in-depth independent validation of specific miRNA biomarker candidates in larger patient cohorts. Specifically, further investigation is required to determine whether miRNA levels can accurately predict disease severity and treatment responses as well as reflect ongoing neurodegenerative and inflammatory disease. Although there is still ongoing need for large-scale unbiased screening, there is a large volume of data generated by previous studies that remains to be validated and correlated with clinical outcomes and other known biomarkers. Finally, identification and investigation of miRNA targets (Table 2) may reveal underlying mechanisms of disease and novel therapeutic targets for the treatment of MS.
Conclusion
The current findings in biomarker research for MS demonstrate exciting progress toward the identification and validation of clinically useful biomarkers for this complex disease. Of particular interest are the biomarkers, including neurofilaments, that reflect the underlying neurodegeneration and intrathecal inflammation driving progressive disease. These biomarkers are especially relevant as new therapies aimed at neuroprotection and neural repair are developed, including stem cell-based regenerative therapies.29 As this new class of treatments enters clinical trials, biomarker discovery and analysis should be done in parallel. Furthermore, as new biomarkers are discovered and validated, more powerful tools for statistical analysis and pattern detection will be required to identify combinations of biomarkers that best reflect clinical status.49
Disclosure
The authors report no conflicts of interest in this work.
References
Mahad DH, Trapp BD, Lassmann H. Pathological mechanisms in progressive multiple sclerosis. Lancet Neurol. 2015;14(2):183–193. | ||
Filippi M, Preziosa P, Rocca MA. Magnetic resonance outcome measures in multiple sclerosis trials: time to rethink? Curr Opin Neurol. 2014;27(3):290–299. | ||
Harris VK, Sadiq SA. Biomarkers of therapeutic response in multiple sclerosis: current status. Mol Diagn Ther. 2014;18(6):605–617. | ||
Londono AC, Mora CA. Nonconventional MRI biomarkers for in vivo monitoring of pathogenesis in multiple sclerosis. Neurol Neuroimmunol Neuroinflamm. 2014;1(4):e45. | ||
Housley WJ, Pitt D, Hafler DA. Biomarkers in multiple sclerosis. Clin Immunol. 2015;161(1):51–58. | ||
Kuhle J, Barro C, Disanto G, et al. Serum neurofilament light chain in early relapsing remitting MS is increased and correlates with CSF levels and with MRI measures of disease severity. Mult Scler. 2016;22(12):1550–1559. | ||
Ljubisavljevic S, Stojanovic I, Basic J, Pavlovic DA. The validation study of neurofilament heavy chain and 8-hydroxy-2′-deoxyguanosine as plasma biomarkers of clinical/paraclinical activity in first and relapsing-remitting demyelination acute attacks. Neurotox Res. 2016;30(3):530–538. | ||
Bertolotto A, Malentacchi M, Capobianco M, et al. The use of the 25 Sprotte needle markedly reduces post-dural puncture headache in routine neurological practice. Cephalalgia. 2016;36(2):131–138. | ||
Gafson AR, Giovannoni G. Towards the incorporation of lumbar puncture into clinical trials for multiple sclerosis. Mult Scler. 2012;18(10):1509–1511. | ||
Dickens AM, Larkin JR, Griffin JL, et al. A type 2 biomarker separates relapsing-remitting from secondary progressive multiple sclerosis. Neurology. 2014;83(17):1492–1499. | ||
Harris VK, Sadiq SA. Disease biomarkers in multiple sclerosis: potential for use in therapeutic decision making. Mol Diagn Ther. 2009;13(4):225–244. | ||
Polman CH, O’Connor PW, Havrdova E, et al. A randomized, placebo-controlled trial of natalizumab for relapsing multiple sclerosis. N Engl J Med. 2006;354(9):899–910. | ||
Lee P, Plavina T, Castro A, et al. A second-generation ELISA (STRATIFY JCV DxSelect) for detection of JC virus antibodies in human serum and plasma to support progressive multifocal leukoencephalopathy risk stratification. J Clin Virol. 2013;57(2):141–146. | ||
Harris VK, Donelan N, Yan QJ, et al. Cerebrospinal fluid Fetuin-A is a biomarker of active multiple sclerosis. Mult Scler. 2013;19(11):1462–1472. | ||
Sellebjerg F, Bornsen L, Khademi M, et al. Increased cerebrospinal fluid concentrations of the chemokine CXCL13 in active MS. Neurology. 2009;73(23):2003–2010. | ||
Kuhle J, Leppert D, Petzold A, et al. Neurofilament heavy chain in CSF correlates with relapses and disability in multiple sclerosis. Neurology. 2011;76(14):1206–1213. | ||
Teunissen CE, Iacobaeus E, Khademi M, et al. Combination of CSF N-acetylaspartate and neurofilaments in multiple sclerosis. Neurology. 2009;72(15):1322–1329. | ||
Koel-Simmelink MJ, Teunissen CE, Behradkia P, Blankenstein MA, Petzold A. The neurofilament light chain is not stable in vitro. Ann Neurol. 2011;69(6):1065–1066; author reply 1066–1067. | ||
Teunissen CE, Khalil M. Neurofilaments as biomarkers in multiple sclerosis. Mult Scler. 2012;18(5):552–556. | ||
Salzer J, Svenningsson A, Sundstrom P. Neurofilament light as a prognostic marker in multiple sclerosis. Mult Scler. 2010;16(3):287–292. | ||
Martinez MA, Olsson B, Bau L, et al. Glial and neuronal markers in cerebrospinal fluid predict progression in multiple sclerosis. Mult Scler. 2015;21(5):550–561. | ||
Modvig S, Degn M, Sander B, et al. Cerebrospinal fluid neurofilament light chain levels predict visual outcome after optic neuritis. Mult Scler. 2016;22(5):590–598. | ||
Petzold A. The prognostic value of CSF neurofilaments in multiple sclerosis at 15-year follow-up. J Neurol Neurosurg Psychiatry. 2015;86(12):1388–1390. | ||
Petzold A, Steenwijk MD, Eikelenboom JM, Wattjes MP, Uitdehaag BM. Elevated CSF neurofilament proteins predict brain atrophy: a 15-year follow-up study. Mult Scler. 2016;22(9):1154–1162. | ||
Petzold A. Neurofilament phosphoforms: surrogate markers for axonal injury, degeneration and loss. J Neurol Sci. 2005;233(1–2):183–198. | ||
Sandberg L, Bistrom M, Salzer J, Vagberg M, Svenningsson A, Sundstrom P. Vitamin D and axonal injury in multiple sclerosis. Mult Scler. 2016;22(8):1027–1031. | ||
Al Nimer F, Elliott C, Bergman J, et al. Lipocalin-2 is increased in progressive multiple sclerosis and inhibits remyelination. Neurol Neuroimmunol Neuroinflamm. 2016;3(1):e191. | ||
Albanese M, Zagaglia S, Landi D, et al. Cerebrospinal fluid lactate is associated with multiple sclerosis disease progression. J Neuroinflammation. 2016;13:36. | ||
Harris VK, Sadiq SA. Stem cell therapy in multiple sclerosis: a future perspective. Neurodegener Dis Manag. 2015;5(3):167–170. | ||
Axelsson M, Malmestrom C, Gunnarsson M, et al. Immunosuppressive therapy reduces axonal damage in progressive multiple sclerosis. Mult Scler. 2014;20(1):43–50. | ||
Gunnarsson M, Malmestrom C, Axelsson M, et al. Axonal damage in relapsing multiple sclerosis is markedly reduced by natalizumab. Ann Neurol. 2011;69(1):83–89. | ||
Romme Christensen J, Ratzer R, Bornsen L, et al. Natalizumab in progressive MS: results of an open-label, phase 2A, proof-of-concept trial. Neurology. 2014;82(17):1499–1507. | ||
de Flon P, Gunnarsson M, Laurell K, et al. Reduced inflammation in relapsing-remitting multiple sclerosis after therapy switch to rituximab. Neurology. 2016;87(2):141–147. | ||
Komori M, Lin YC, Cortese I, et al. Insufficient disease inhibition by intrathecal rituximab in progressive multiple sclerosis. Ann Clin Transl Neurol. 2016;3(3):166–179. | ||
Kuhle J, Disanto G, Lorscheider J, et al. Fingolimod and CSF neurofilament light chain levels in relapsing-remitting multiple sclerosis. Neurology. 2015;84(16):1639–1643. | ||
Hinsinger G, Galeotti N, Nabholz N, et al. Chitinase 3-like proteins as diagnostic and prognostic biomarkers of multiple sclerosis. Mult Scler. 2015;21(10):1251–1261. | ||
Canto E, Espejo C, Costa C, Montalban X, Comabella M. Breast regression protein-39 is not required for experimental autoimmune encephalomyelitis induction. Clin Immunol. 2015;160(2):133–141. | ||
Bonneh-Barkay D, Wang G, Starkey A, Hamilton RL, Wiley CA. In vivo CHI3L1 (YKL-40) expression in astrocytes in acute and chronic neurological diseases. J Neuroinflammation. 2010;7:34. | ||
Bonneh-Barkay D, Bissel SJ, Wang G, et al. YKL-40, a marker of simian immunodeficiency virus encephalitis, modulates the biological activity of basic fibroblast growth factor. Am J Pathol. 2008;173(1):130–143. | ||
Burman J, Raininko R, Blennow K, Zetterberg H, Axelsson M, Malmestrom C. YKL-40 is a CSF biomarker of intrathecal inflammation in secondary progressive multiple sclerosis. J Neuroimmunol. 2016;292:52–57. | ||
Malmestrom C, Axelsson M, Lycke J, Zetterberg H, Blennow K, Olsson B. CSF levels of YKL-40 are increased in MS and replaces with immunosuppressive treatment. J Neuroimmunol. 2014;269(1–2):87–89. | ||
Correale J, Fiol M. Chitinase effects on immune cell response in neuromyelitis optica and multiple sclerosis. Mult Scler. 2011;17(5):521–531. | ||
Lee CG, Da Silva CA, Dela Cruz CS, et al. Role of chitin and chitinase/chitinase-like proteins in inflammation, tissue remodeling, and injury. Annu Rev Physiol. 2011;73:479–501. | ||
Thouvenot E, Hinsinger G, Galeotti N, et al. Chitinase 3-like 1 and chitinase 3-like 2 as diagnostic and prognostic biomarkers of multiple sclerosis. Paper presented at: American Academy of Neurology Annual Meeting; 2014; Philadelphia, PA. | ||
Comabella M, Dominguez C, Rio J, et al. Plasma chitotriosidase activity in multiple sclerosis. Clin Immunol. 2009;131(2):216–222. | ||
Stoop MP, Singh V, Stingl C, et al. Effects of natalizumab treatment on the cerebrospinal fluid proteome of multiple sclerosis patients. J Proteome Res. 2013;12(3):1101–1107. | ||
Canto E, Tintore M, Villar LM, et al. Chitinase 3-like 1: prognostic biomarker in clinically isolated syndromes. Brain. 2015;138(Pt 4):918–931. | ||
Novakova L, Axelsson M, Khademi M, et al. Cerebrospinal fluid biomarkers of inflammation and degeneration as measures of fingolimod efficacy in multiple sclerosis. Mult Scler. Epub 2016 Mar 21. | ||
Borras E, Canto E, Choi M, et al. Protein-based classifier to predict conversion from clinically isolated syndrome to multiple sclerosis. Mol Cell Proteomics. 2016;15(1):318–328. | ||
Canto E, Reverter F, Morcillo-Suarez C, et al. Chitinase 3-like 1 plasma levels are increased in patients with progressive forms of multiple sclerosis. Mult Scler. 2012;18(7):983–990. | ||
Olsson B, Malmestrom C, Basun H, et al. Extreme stability of chitotriosidase in cerebrospinal fluid makes it a suitable marker for microglial activation in clinical trials. J Alzheimers Dis. 2012;32(2):273–276. | ||
Sotgiu S, Barone R, Arru G, et al. Intrathecal chitotriosidase and the outcome of multiple sclerosis. Mult Scler. 2006;12(5):551–557. | ||
Verbeek MM, Notting EA, Faas B, Claessens-Linskens R, Jongen PJ. Increased cerebrospinal fluid chitotriosidase index in patients with multiple sclerosis. Acta Neurol Scand. 2010;121(5):309–314. | ||
Mollgaard M, Degn M, Sellebjerg F, Frederiksen JL, Modvig S. Cerebrospinal fluid chitinase-3-like 2 and chitotriosidase are potential prognostic biomarkers in early multiple sclerosis. Eur J Neurol. 2016;23(5):898–905. | ||
Yamasaki R, Lu H, Butovsky O, et al. Differential roles of microglia and monocytes in the inflamed central nervous system. J Exp Med. 2014;211(8):1533–1549. | ||
Komori M, Blake A, Greenwood M, et al. Cerebrospinal fluid markers reveal intrathecal inflammation in progressive multiple sclerosis. Ann Neurol. 2015;78(1):3–20. | ||
Stilund M, Reuschlein AK, Christensen T, Moller HJ, Rasmussen PV, Petersen T. Soluble CD163 as a marker of macrophage activity in newly diagnosed patients with multiple sclerosis. PLoS One. 2014;9(6):e98588. | ||
Stilund M, Gjelstrup MC, Petersen T, Moller HJ, Rasmussen PV, Christensen T. Biomarkers of inflammation and axonal degeneration/damage in patients with newly diagnosed multiple sclerosis: contributions of the soluble CD163 CSF/serum ratio to a biomarker panel. PLoS One. 2015;10(4):e0119681. | ||
Klesney-Tait J, Turnbull IR, Colonna M. The TREM receptor family and signal integration. Nat Immunol. 2006;7(12):1266–1273. | ||
Sessa G, Podini P, Mariani M, et al. Distribution and signaling of TREM2/DAP12, the receptor system mutated in human polycystic lipomembraneous osteodysplasia with sclerosing leukoencephalopathy dementia. Eur J Neurosci. 2004;20(10):2617–2628. | ||
Ohrfelt A, Axelsson M, Malmestrom C, et al. Soluble TREM-2 in cerebrospinal fluid from patients with multiple sclerosis treated with natalizumab or mitoxantrone. Mult Scler. 2016;22(12):1587–1595. | ||
Dobson R, Ramagopalan S, Davis A, Giovannoni G. Cerebrospinal fluid oligoclonal bands in multiple sclerosis and clinically isolated syndromes: a meta-analysis of prevalence, prognosis and effect of latitude. J Neurol Neurosurg Psychiatry. 2013;84(8):909–914. | ||
Petzold A. Intrathecal oligoclonal IgG synthesis in multiple sclerosis. J Neuroimmunol. 2013;262(1–2):1–10. | ||
Thangarajh M, Gomez-Rial J, Hedstrom AK, et al. Lipid-specific immunoglobulin M in CSF predicts adverse long-term outcome in multiple sclerosis. Mult Scler. 2008;14(9):1208–1213. | ||
Villar LM, Sadaba MC, Roldan E, et al. Intrathecal synthesis of oligoclonal IgM against myelin lipids predicts an aggressive disease course in MS. J Clin Invest. 2005;115(1):187–194. | ||
Ferraro D, Simone AM, Bedin R, et al. Cerebrospinal fluid oligoclonal IgM bands predict early conversion to clinically definite multiple sclerosis in patients with clinically isolated syndrome. J Neuroimmunol. 2013;257(1–2):76–81. | ||
Ferraro D, Galli V, Vitetta F, et al. Cerebrospinal fluid CXCL13 in clinically isolated syndrome patients: association with oligoclonal IgM bands and prediction of multiple sclerosis diagnosis. J Neuroimmunol. 2015;283:64–69. | ||
Magraner MJ, Bosca I, Simo-Castello M, et al. Brain atrophy and lesion load are related to CSF lipid-specific IgM oligoclonal bands in clinically isolated syndromes. Neuroradiology. 2012;54(1):5–12. | ||
Beltran E, Obermeier B, Moser M, et al. Intrathecal somatic hypermutation of IgM in multiple sclerosis and neuroinflammation. Brain. 2014;137(Pt 10):2703–2714. | ||
Alvarez-Cermeno JC, Munoz-Negrete FJ, Costa-Frossard L, de la Maza SS, Villar LM, Rebolleda G. Intrathecal lipid-specific oligoclonal IgM synthesis associates with retinal axonal loss in multiple sclerosis. J Neurol Sci. 2016;360:41–44. | ||
Villar LM, Picon C, Costa-Frossard L, et al. Cerebrospinal fluid immunological biomarkers associated with axonal damage in multiple sclerosis. Eur J Neurol. 2015;22(8):1169–1175. | ||
Sadaba MC, Tzartos J, Paino C, et al. Axonal and oligodendrocyte-localized IgM and IgG deposits in MS lesions. J Neuroimmunol. 2012;247(1–2):86–94. | ||
Villar LM, Casanova B, Ouamara N, et al. Immunoglobulin M oligoclonal bands: biomarker of targetable inflammation in primary progressive multiple sclerosis. Ann Neurol. 2014;76(2):231–240. | ||
Huntzinger E, Izaurralde E. Gene silencing by microRNAs: contributions of translational repression and mRNA decay. Nat Rev Genet. 2011;12(2):99–110. | ||
Thounaojam MC, Kaushik DK, Basu A. MicroRNAs in the brain: it’s regulatory role in neuroinflammation. Mol Neurobiol. 2013;47(3):1034–1044. | ||
Bartel DP. MicroRNAs: genomics, biogenesis, mechanism, and function. Cell. 2004;116(2):281–297. | ||
Ridolfi E, Fenoglio C, Cantoni C, et al. Expression and genetic analysis of microRNAs involved in multiple sclerosis. Int J Mol Sci. 2013;14(3):4375–4384. | ||
Dutta R, Chomyk AM, Chang A, et al. Hippocampal demyelination and memory dysfunction are associated with increased levels of the neuronal microRNA miR-124 and reduced AMPA receptors. Ann Neurol. 2013;73(5):637–645. | ||
Valadi H, Ekstrom K, Bossios A, Sjostrand M, Lee JJ, Lotvall JO. Exosome-mediated transfer of mRNAs and microRNAs is a novel mechanism of genetic exchange between cells. Nat Cell Biol. 2007;9(6):654–659. | ||
De Felice B, Mondola P, Sasso A, et al. Small non-coding RNA signature in multiple sclerosis patients after treatment with interferon-beta. BMC Med Genomics. 2014;7:26. | ||
Keller A, Leidinger P, Steinmeyer F, et al. Comprehensive analysis of microRNA profiles in multiple sclerosis including next-generation sequencing. Mult Scler. 2014;20(3):295–303. | ||
Ahlbrecht J, Martino F, Pul R, et al. Deregulation of microRNA-181c in cerebrospinal fluid of patients with clinically isolated syndrome is associated with early conversion to relapsing-remitting multiple sclerosis. Mult Scler. 2016;22(9):1202–1214. | ||
Bergman P, Piket E, Khademi M, et al. Circulating miR-150 in CSF is a novel candidate biomarker for multiple sclerosis. Neurol Neuroimmunol Neuroinflamm. 2016;3(3):e219. | ||
Arruda LC, Lorenzi JC, Sousa AP, et al. Autologous hematopoietic SCT normalizes miR-16, -155 and -142-3p expression in multiple sclerosis patients. Bone Marrow Transplant. 2015;50(3):380–389. | ||
Ingwersen J, Menge T, Wingerath B, et al. Natalizumab restores aberrant miRNA expression profile in multiple sclerosis and reveals a critical role for miR-20b. Ann Clin Transl Neurol. 2015;2(1):43–55. | ||
Munoz-Culla M, Irizar H, Castillo-Trivino T, et al. Blood miRNA expression pattern is a possible risk marker for natalizumab-associated progressive multifocal leukoencephalopathy in multiple sclerosis patients. Mult Scler. 2014;20(14):1851–1859. | ||
Gandhi R, Healy B, Gholipour T, et al. Circulating microRNAs as biomarkers for disease staging in multiple sclerosis. Ann Neurol. 2013;73(6):729–740. | ||
Kacperska MJ, Jastrzebski K, Tomasik B, Walenczak J, Konarska-Krol M, Glabinski A. Selected extracellular microRNA as potential biomarkers of multiple sclerosis activity – preliminary study. J Mol Neurosci. 2015;56(1):154–163. | ||
Sondergaard HB, Hesse D, Krakauer M, Sorensen PS, Sellebjerg F. Differential microRNA expression in blood in multiple sclerosis. Mult Scler. 2013;19(14):1849–1857. | ||
Martinelli-Boneschi F, Fenoglio C, Brambilla P, et al. MicroRNA and mRNA expression profile screening in multiple sclerosis patients to unravel novel pathogenic steps and identify potential biomarkers. Neurosci Lett. 2012;508(1):4–8. | ||
Otaegui D, Baranzini SE, Armananzas R, et al. Differential micro RNA expression in PBMC from multiple sclerosis patients. PLoS One. 2009;4(7):e6309. | ||
Angerstein C, Hecker M, Paap BK, et al. Integration of MicroRNA databases to study MicroRNAs associated with multiple sclerosis. Mol Neurobiol. 2012;45(3):520–535. | ||
Keller A, Leidinger P, Lange J, et al. Multiple sclerosis: microRNA expression profiles accurately differentiate patients with relapsing-remitting disease from healthy controls. PLoS One. 2009;4(10):e7440. | ||
Siegel SR, Mackenzie J, Chaplin G, Jablonski NG, Griffiths L. Circulating microRNAs involved in multiple sclerosis. Mol Biol Rep. 2012;39(5):6219–6225. | ||
Honardoost MA, Kiani-Esfahani A, Ghaedi K, Etemadifar M, Salehi M. miR-326 and miR-26a, two potential markers for diagnosis of relapse and remission phases in patient with relapsing-remitting multiple sclerosis. Gene. 2014;544(2):128–133. | ||
Vistbakka J, Elovaara I, Lehtimaki T, Hagman S. Circulating microRNAs as biomarkers in progressive multiple sclerosis. Mult Scler. Epub 2016 May 31. | ||
Waschbisch A, Atiya M, Linker RA, Potapov S, Schwab S, Derfuss T. Glatiramer acetate treatment normalizes deregulated microRNA expression in relapsing remitting multiple sclerosis. PLoS One. 2011;6(9):e24604. | ||
Witwer KW, Sisk JM, Gama L, Clements JE. MicroRNA regulation of IFN-beta protein expression: rapid and sensitive modulation of the innate immune response. J Immunol. 2010;184(5):2369–2376. | ||
Fenoglio C, Cantoni C, De Riz M, et al. Expression and genetic analysis of miRNAs involved in CD4+ cell activation in patients with multiple sclerosis. Neurosci Lett. 2011;504(1):9–12. | ||
Yang D, Wang WZ, Zhang XM, et al. MicroRNA expression aberration in Chinese patients with relapsing remitting multiple sclerosis. J Mol Neurosci. 2014;52(1):131–137. | ||
Haghikia A, Haghikia A, Hellwig K, et al. Regulated microRNAs in the CSF of patients with multiple sclerosis: a case-control study. Neurology. 2012;79(22):2166–2170. | ||
Hutchison ER, Kawamoto EM, Taub DD, et al. Evidence for miR-181 involvement in neuroinflammatory responses of astrocytes. Glia. 2013;61(7):1018–1028. | ||
Fenoglio C, Ridolfi E, Cantoni C, et al. Decreased circulating miRNA levels in patients with primary progressive multiple sclerosis. Mult Scler. 2013;19(14):1938–1942. | ||
Du C, Liu C, Kang J, et al. MicroRNA miR-326 regulates TH-17 differentiation and is associated with the pathogenesis of multiple sclerosis. Nat Immunol. 2009;10(12):1252–1259. | ||
Mancuso R, Hernis A, Agostini S, Rovaris M, Caputo D, Clerici M. MicroRNA-572 expression in multiple sclerosis patients with different patterns of clinical progression. J Transl Med. 2015;13:148. | ||
Zhao ZB, Wu L, Xiong R, et al. MicroRNA-922 promotes tau phosphorylation by downregulating ubiquitin carboxy-terminal hydrolase L1 (UCHL1) expression in the pathogenesis of Alzheimer’s disease. Neuroscience. 2014;275:232–237. | ||
Wang X. Improving microRNA target prediction by modeling with unambiguously identified microRNA-target pairs from CLIP-ligation studies. Bioinformatics. 2016;32(9):1316–1322. | ||
Wong N, Wang X. miRDB: an online resource for microRNA target prediction and functional annotations. Nucleic Acids Res. 2015;43(Database issue):D146–D152. |
 © 2017 The Author(s). This work is published and licensed by Dove Medical Press Limited. The
full terms of this license are available at https://www.dovepress.com/terms
and incorporate the Creative Commons Attribution
- Non Commercial (unported, 3.0) License.
By accessing the work you hereby accept the Terms. Non-commercial uses of the work are permitted
without any further permission from Dove Medical Press Limited, provided the work is properly
attributed. For permission for commercial use of this work, please see paragraphs 4.2 and 5 of our Terms.
© 2017 The Author(s). This work is published and licensed by Dove Medical Press Limited. The
full terms of this license are available at https://www.dovepress.com/terms
and incorporate the Creative Commons Attribution
- Non Commercial (unported, 3.0) License.
By accessing the work you hereby accept the Terms. Non-commercial uses of the work are permitted
without any further permission from Dove Medical Press Limited, provided the work is properly
attributed. For permission for commercial use of this work, please see paragraphs 4.2 and 5 of our Terms.