Back to Journals » Journal of Inflammation Research » Volume 16
Biomarkers Associated with Immune Checkpoint, N6-Methyladenosine, and Ferroptosis in Patients with Restenosis
Authors Tong X, Zhao X, Dang X, Kou Y, Kou J
Received 10 October 2022
Accepted for publication 6 January 2023
Published 2 February 2023 Volume 2023:16 Pages 407—420
DOI https://doi.org/10.2147/JIR.S392036
Checked for plagiarism Yes
Review by Single anonymous peer review
Peer reviewer comments 3
Editor who approved publication: Professor Ning Quan
Xiao Tong, Xinyi Zhao, Xuan Dang, Yan Kou, Junjie Kou
Department of Cardiology, The 2nd Affiliated Hospital of Harbin Medical University, The Key Laboratory of Myocardial Ischemia, Chinese Ministry of Education, Harbin, People’s Republic of China
Correspondence: Junjie Kou; Yan Kou, Department of Cardiology, The 2nd Affiliated Hospital of Harbin Medical University, 148 Health Care Road, Harbin, Heilongjiang Province, People’s Republic of China, Tel +86 361 363 1365 ; +86 363 363 4516, Email [email protected]; [email protected]
Purpose: This study aimed to identify potential diagnostic markers of restenosis after stent implantation and to determine their association with immune checkpoint, ferroptosis, and N6-methyladenosine (m6A).
Patients and methods: Microarray data were downloaded from the National Center for Biotechnology Information (NCBI: GSE46560 and GSE48060 datasets) to identify differentially expressed genes (DEGs) between in-stent restenosis and no-restenosis samples. We then conducted systematic functional enrichment analyses of the DEGs based on Gene Ontology (GO) and Kyoto Encyclopedia of Genes and Genomes (KEGG), and further predicted the interactions of different proteins using the Search Tool for the Retrieval of Interacting Genes (STRING). We used the MCC and MCODE algorithms in the cytoHubba plug-in to screen three key genes in the network, and employed receiver operating characteristic (ROC) curves to determine their diagnostic significance using a multiscale curvature classification algorithm. Next, we investigated the relationships between these target genes, immune checkpoint, ferroptosis, and m6A. Finally, quantitative real-time polymerase chain reaction (qRT-PCR) was used to verify the above results.
Results: We identified 62 upregulated genes and 243 downregulated genes. Based on GO, KEGG, and screening results, EEF1D, RPL36, and RPSA are promising genes for predicting restenosis. In addition, the methylation of YTHDF2, the ferroptosis-related gene GLS2, and the immune checkpoint-related gene CTLA4 were observed to be associated with restenosis. The qRT-PCR test confirmed that RPSA and RPL36 are useful diagnostic markers of the restenosis that can provide new insights for future studies on its occurrence and molecular mechanisms.
Conclusion: We found that RPSA and RPL36, as useful diagnostic markers of restenosis, can provide new insights for future studies on its occurrence and molecular mechanisms.
Keywords: restenosis, immune checkpoint, differentially expressed genes, m6A, ferroptosis
Introduction
Coronary heart disease (CHD), characterized by unstable atherosclerotic lesions, coronary spasms, and coronary thrombosis, can trigger vessel narrowing and occlusion, eventually resulting in insufficient blood perfusion.1 Methods such as percutaneous coronary intervention (PCI) and dual antiplatelet therapy have significantly improved the treatment outcome of patients with myocardial ischemia.2–4 However, approximately 20–40% of patients still experience in-stent restenosis between 3 months and 4 years after implantation.2,5 Restenosis is a complex and multifactorial disease with genetic and environmental causes.6 Research has shown that male gender, stent length, elevated levels of Monocyte to HDL ratio (MHR) and Neutrophil to lymphocyte ratio (NLR) were independent predictors of stent restenosis (SR) in STEMI patients treated with primary PCI with bare-metal stent (BMS) implantation.7 In addition, risk factors for restenosis, such as smoking, high serum cholesterol, and poor dietary habits, can only predict the likelihood of restenosis but not further restenosis of intravascular stents.8 Additionally, early prediction of restenosis is the first step to improving the clinical management of patients after PCI; however, there are no effective biomarkers for this. Therefore, a better understanding of the mechanisms underlying restenosis is required.
In recent years, research on microarray technology and bioinformatics analysis has increased. By analyzing differential gene expressions in patients with a given disease, biomarkers for diagnosis and prognosis can be identified.9–12 However, very little research has been conducted on the identification of restenosis-related genes and the prediction of diagnostic markers in patients with restenosis using bioinformatics analysis.13 Some studies have found that high-sensitivity C-reactive proteins can predict increased risk of restenosis in patients with coronary artery disease;14 others have shown that preoperative inflammatory factors such as interleukin (IL)-6, IL-8, tumor necrosis factor-alpha, and IL-23 predict restenosis risk.15,16 The chief pathological features of restenosis are injury to arterial endothelial cells and proliferation of new tissue, which re-shrinks the coronary artery after stenting.17,18 The condition occurs in 30% of patients with bare-metal stents.19 While the development of drug-coated stents in recent years has lowered restenosis incidence to ~25% within one year of implantation, this rate is still relatively high.20 Therefore, the prevention of restenosis after stenting remains a major problem that needs resolving.
In this study, we demonstrated the potential diagnostic markers of restenosis after stent implantation by differential expression analysis of the microarray data from the National Center for Biotechnology Information (NCBI).21 Further GO and KEGG analysis of these DEGs determined the signal pathways relevant to restenosis.22,23 In addition, the protein interactions of these DEGs were studied using the Search Tool for the Retrieval of Interacting Genes (STRING).24 Three genes of diagnostic significance, EEF1D, RPL36, and RPSA, were screened using MCC and MCODE algorithms. Finally, we demonstrated that restenosis was associated with immune checkpoints, ferroptosis, and N6 methyladenosine (m6A) modification.25–29 This work provides new insights into the molecular mechanisms underlying the development of in-stent restenosis.
Materials and Methods
Microarray Data
Microarray data (GSE46560 and GSE48060) were downloaded from the GEO database30 as MINIML files. GSE46560 was based on the GPL15207 platform of the Affymetrix Human Gene Expression Array. GSE48060 data was based on the GPL570 platform of [HG-U133_Plus_2] Affymetrix Human Genome U133 Plus 2.0 Arrawhile. The GSE46560 dataset included five restenosis and six non-restenosis samples collected from the peripheral blood. In contrast, the GSE48060 dataset included five restenosis and 26 non-restenosis collected from peripheral blood. The extracted data were normalized by log2 transformation. The microarray data were normalized by the normalized quantiles function of the preprocessCore package in R software (version 3.4.1). Probes were converted to gene symbols according to the annotation information of the normalized data in the platform. Probes matching multiple genes were removed from these datasets, The average expression value of the gene measured by multiple probes was calculated as the final expression value. As in different datasets, we extracted multiple data sets with common gene symbols, and marking different datasets as different batches, used the removeBatchEffect function of the limma package in the R software to remove batch effects. The result of the data preprocessing was assessed by boxplot. The PCA plot was drawn to illustrate the samples before and after the batch effect.21,30,31
Filtering DEGs
The limma package in R was used to identify differential mRNA expression between 10 restenosis and 32 non-restenosis samples from the GSE46560 and the GSE48060 datasets. The P-value was adjusted to correct for false-positive results in the GEO datasets. Adjusted P < 0.05 and |log2 fold-change (FC)| > 1.3 were defined as the statistical criteria for differential expression of mRNAs. Heat maps were implemented using the R package function pheatmap.
Functional Enrichment Analysis
Gene Ontology (GO) is a widely used tool for the functional annotation of genes, especially those involved in molecular function (MF), biological pathways (BPs), and cellular components (CCs). Kyoto Encyclopedia of Genes and Genomes (KEGG) pathway analysis is valuable for determining high-level gene functions, such as involvement in biological pathways. The ClusterProfiler package in Bioconductor was used to obtain the functional profiles of the genes, and the ClusterProfiler package (version 3.18.0) in R was employed to visualize the results of GO and KEGG functional analyses.30
Candidate Diagnostic Biomarker Screening
Search Tool for the Retrieval of Interacting Genes (STRING) is an online biological database that facilitates gene analysis and the construction of networks of gene interactions at the protein level.24 The protein-protein interaction (PPI) network was constructed with STRING and the network was visualized with Cytoscape. Then, we used both MCC and MCODE algorithms to calculate the key genes.25
Diagnostic Value of Characteristic Biomarkers in Restenosis
To test the predictive value of the identified biomarkers, we used the GLM function in the R (version 3.6.3) package to build a logistics model and used the GGploT2 package to visualize the results. Receiver operating characteristic (ROC) curves were generated using the mRNA expression data from the GSE46560 and GSE48060 datasets. There were ten patients with restenosis and thirty-two patients without restenosis. The diagnostic value of the identified hub genes was evaluated using the area under the ROC curve (AUC), which was between 0.5 and 1. The closer the AUC value is to 1, the better the diagnostic effect. The AUC between 0.5 and 0.7 represents predictive significance, while AUC ranging from 0.7 to 0.9 means more accuracy. When the AUC value is larger than 0.9, the accuracy is the highest.
Ferroptosis, m6A and Immune-Checkpoint Related Gene Expression in Restenosis
On the basis of previous studies, the ferroptosis-, immune-checkpoint-, and m6A-related genes were verified. We downloaded data from the GEO database (https://www.ncbi.nlm.nih.gov/geo/) in a MINIML format. To obtain the ferroptosis-related genes, we used the systematic analysis of the aberrances and functional implications of ferroptosis in cancer published by Liu et al32 Moreover, m6A-related genes and immune checkpoint-related genes were obtained via the molecular characterization and analysis of the clinical significance of m6A modulators across 33 cancer types published by Xu et al and Zeng et al, respectively.33 Extracting the expression of immune checkpoint genes, observing the expression value of the immune checkpoint-related genes.34,35 We used the R package ggord to draw principal component analysis plots, and the R package ggplot2 to construct box plots. All the above analysis methods and R packages were implemented using R 4.0.3 (R Foundation for Statistical Computing 2020).
General Characteristics of Patients with Restenosis
We randomly selected 24 patients with restenosis admitted to the Department of Cardiology, the Second Affiliated Hospital of Harbin Medical University as the study subjects, and 14 patients with coronary heart disease with matched gender and age were randomly selected as the non-restenosis group. All patients with restenosis were treated regularly with aspirin. We also detailed the patients’ other concomitant diseases in the Supplementary Material. Patients with other diseases were mainly treated with commonly used drugs such as metformin or nifedipine. The clinical data of the patients was shown in Supplementary Table 1. The diagnostic criterion for restenosis was as follows: during coronary angiography reexamination, the internal diameter of the stent segment, proximal, and distal stents within 5 mm was narrowed again by over 50%. This study was approved by the Ethics Committee of the Second Affiliated Hospital of Harbin Medical University (KY2022-072). The experiment was in accordance with the principles in the Declaration of Helsinki.
Reverse Transcription-Quantitative Polymerase Chain Reaction (qRT-PCR) Verification
We detected the variations of gene expression levels in the blood of patients with and without restenosis with qRT-PCR using specific primers (Supplementary Table 2). This experiment was used to verify the differentially expressed genes. The experiment was performed with biological triplicates. The reaction system was 10 µL. β-actin was used as the internal control. Quantitative analysis of differential expression was assessed using the SYBR green reaction system on a Bio-Rad (USA) PCR machine. The relative expression levels of mRNAs were calculated by the 2-ΔΔCt method. Graphpad prism7 was used for statistical analysis, the t-test was used for the samples conforming to the normal distribution, and the non-parametric test was used for statistical analysis for the samples not conforming to the normal distribution.
Results
Identification of DEGs
We identified DEGs from the GSE46560 and GSE48060 datasets using the limma quartile normalization of quantitative traits approach with background correction. This analysis revealed 305 DEGs in the restenosis group, comprising 243 downregulated and 62 upregulated genes (Figures 1A and B).
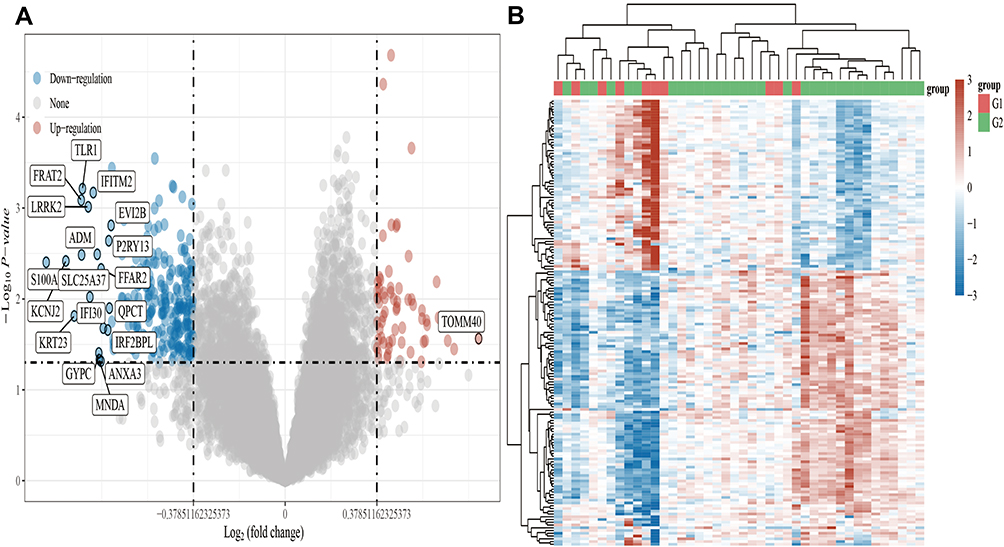 |
Figure 1 Volcano plots and heat maps of differentially expressed genes in restenosis. Notes: (A) Volcano plots were constructed using fold-change and adjusted P values. The red point in the plot represents the significantly overexpressed mRNAs and the blue point indicates the significantly underexpressed mRNAs in restenosis. (B) Hierarchical clustering analysis heatmap of those mRNAs which were differentially expressed between patients with restenosis and those without restenosis. G1 represents the restenosis group and G2 represents the non-restenosis group. The change in gene expression, denoted in blue to red, increased in the restenosis group. |
Functional Correlation Analysis
Using the “clusterProfiler” package in Bioconductor to obtain the functional profiles of genes via GO and KEGG pathway enrichment analysis, we found that the DEGs were mainly concentrated in the following functional categories: ribosome, coronavirus disease-COVID-19, base excision repair, RNA catabolic process, heart looping, embryonic heart tube development, and determination of bilateral symmetry (Figures 2A–D).
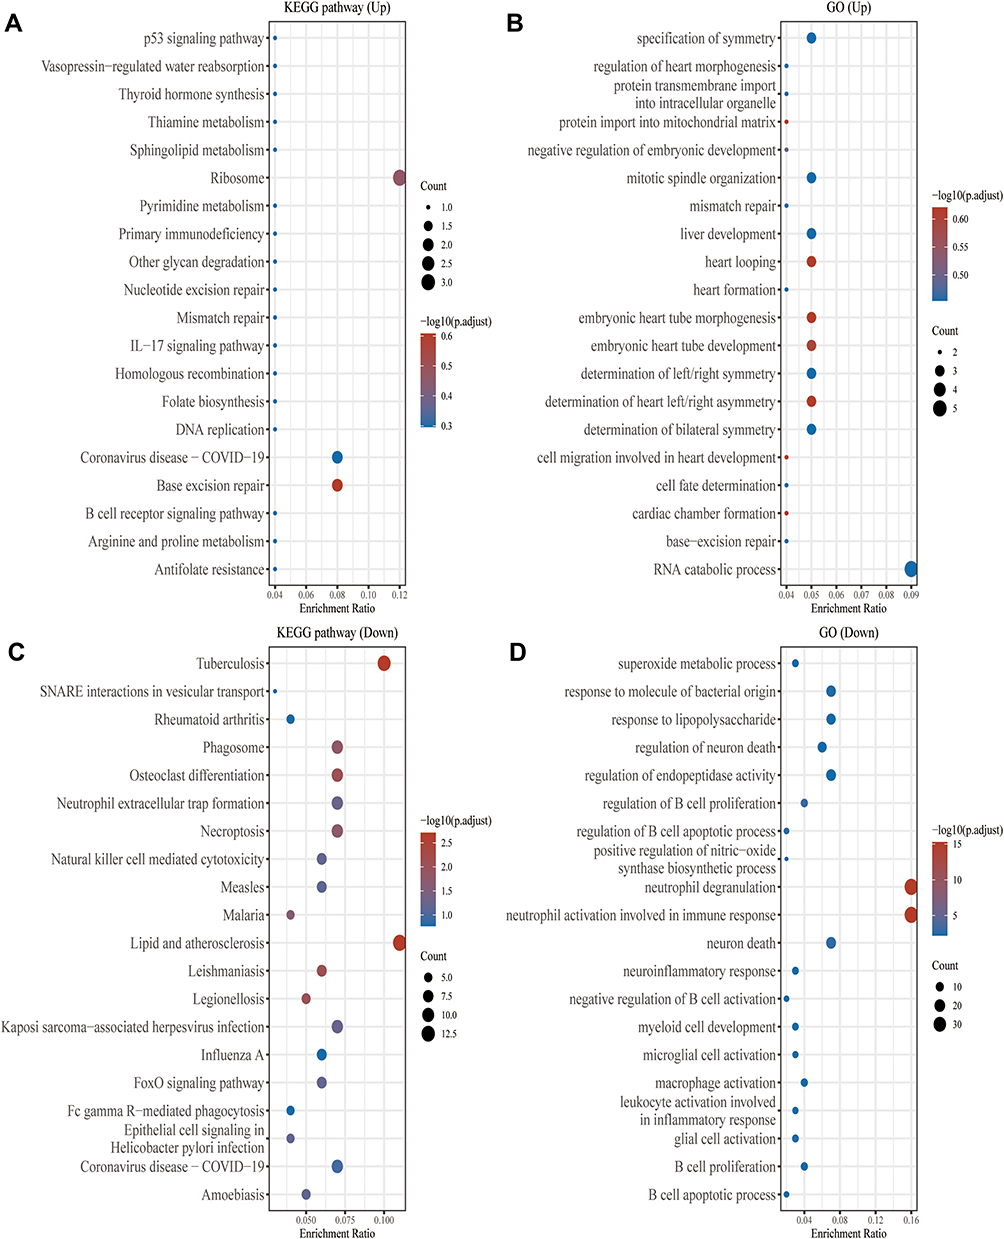 |
Figure 2 KEGG and GO enrichment analysis. Notes: The abscissa indicates gene ratios, and the enriched pathways according to the gene ontology (GO) analysis of the potential targets of the mRNAs are presented in the ordinate. (A) The figure shows the enrichment results of the KEGG pathway analysis of the differentially upregulated genes. (B) The figure shows the enrichment results of the GO pathway analysis of the differentially upregulated genes. (C) The figure shows the enrichment results of the KEGG pathway analysis of the differentially downregulated genes. (D) The figure shows the enrichment results of the GO pathway analysis of the differentially downregulated genes. For the enrichment results, a P <0.05 or FDR <0.05 was considered to indicate enrichment in a meaningful pathway. |
Identification and Validation of the Diagnostic Biomarkers
To further explore the central genes related to restenosis and their mechanisms, 62 genes with upregulated expression among the 305 DEGs in the restenosis group were determined and uploaded to the STRING online database to build a PPI network; a PPI network with 74 genes as nodes and 18 edges was generated (Supplementary Figure 1). Nodes represent DEGs enriched in the STRING database, whereas edges reflect the interactions between the DEGs. Since genes with a high binding degree and high clustering coefficient are more important in maintaining the stability of the entire network, we searched for genes with a high binding degree and a clustering coefficient greater than 0.4 throughout the PPI network. The average node degree was 0.486, the average local clustering coefficient was 0.288, and the P-value of PPI enrichment was 0.458. Among the 74 nodes, the top three genes with a high binding degree were determined using Cytoscape (version 3.8.2) MCC (Figure 3A) and MCODE (Figure 3B), as follows: EEF1D, RPL36, RPSA (Figure 3C). These three genes were thus identified as central genes that play key roles in restenosis.
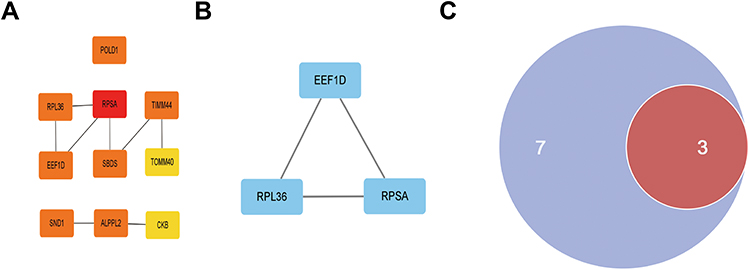 |
Figure 3 The key genes identified by MCC and MCODE. Notes: (A) Figure represents the 10 key genes calculated by MCC algorithm in cytoHubba; the darker the color, the more critical the gene. (B) Figure denotes the gene related to the module with the highest score (3.000) derived using the Cytoscape plugin MCODE. (C) The intersection of the key genes determined using MCC and MCODE is visualized with a Venn diagram (Purple represents the MCC algorithm and red represents the MCODE algorithm). |
Diagnostic Effectiveness of the Biomarkers for Restenosis
The three biomarkers used to distinguish restenosis samples from control samples demonstrated high diagnostic values (Figure 4). With respect to the predictive capacity, the AUC value was 0.700 for EEF1D (95% CI = 0.472–0.928), 0.625 for RPL36 (95% CI = 0.384–0.866), 0.695 for RPSA (95% CI = 0.467–0.923).
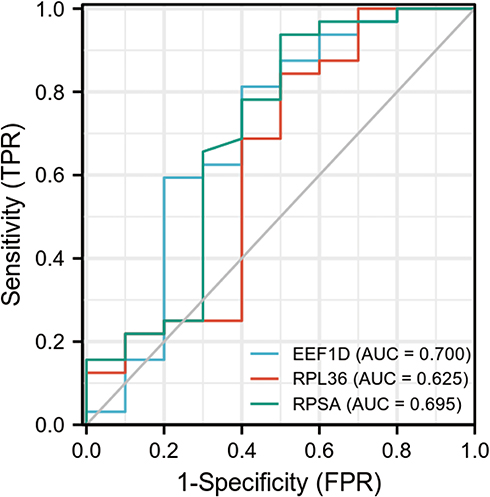 |
Figure 4 Receiver operating characteristic (ROC) curve of differentially expressed genes related to restenosis, Independence. Abbreviations: TPR, true positive rate; FPR, false negative rate. Note: Each point on the curve corresponds to FPR and TPR at different thresholds. |
Restenosis with m6A, Immune Checkpoint and Ferroptosis
Studies have shown that the mechanisms of ferroptosis are closely linked to the development of cardiovascular disease. Therefore, effective regulation of the ferroptosis process in cardiomyocytes has the potential to provide new action targets for the clinical prevention and treatment of restenosis. We selected 24 genes related to ferroptosis and observed variations in their expression between patients with and without restenosis (Figure 5A). GLS2 expression was closely related to ferroptosis in patients with restenosis (Figure 5B). Many regulators participate in RNA methylation, including methyltransferases (writers), RNA-binding proteins (readers), and demethylases (erasers).35 Therefore, we selected genes related to these three regulator types and investigated their relationship with restenosis (Figure 6A). We found that the expression level of YTH N6-methyladenosine RNA binding protein 2 (YTHDF2) increased significantly in patients with restenosis (P < 0.01), suggesting that it may play a role in the mechanism of restenosis (Figure 6B). In addition, we also found a significant correlation between CTLA4 and restenosis among eight immune checkpoint-related genes evaluated.34,35 (Figure 7A and B).
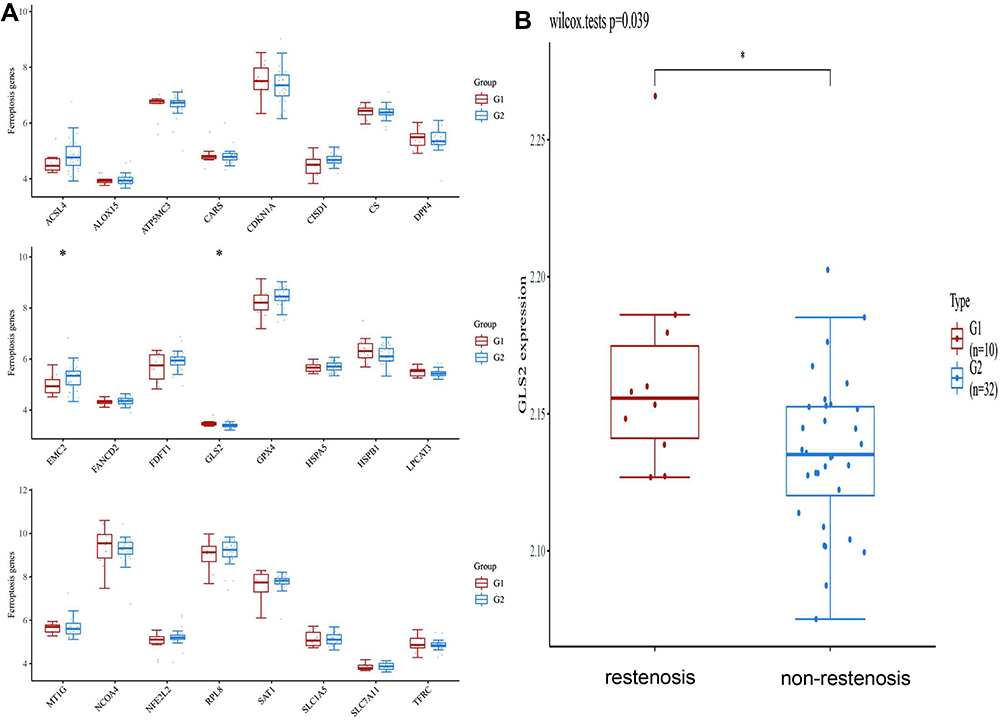 |
Figure 5 The expression distribution of the ferroptosis-related mRNAs in the restenosis and non-restenosis groups. Notes: (A) Ferroptosis-related gene analysis results. (B) The expression distribution of GLS2 gene in restenosis, where the horizontal axis represents restenosis and non-restenosis samples, the vertical axis represents the gene expression distribution. *P < 0.05, the asterisk represents the degree of importance (*P). The significance of the two groups of samples passed the Wilcox test. |
 |
Figure 6 The expression distribution of the m6A-related mRNAs in the restenosis and non-restenosis groups. Notes: (A) m6A-related gene analysis results. (B) The expression distribution of YTHDF2 gene in restenosis, where the horizontal axis represents restenosis and non-restenosis samples, the vertical axis represents the gene expression distribution. *P < 0.05, the asterisk represents the degree of importance (*P). The significance of the two groups of samples passed the Wilcox test. |
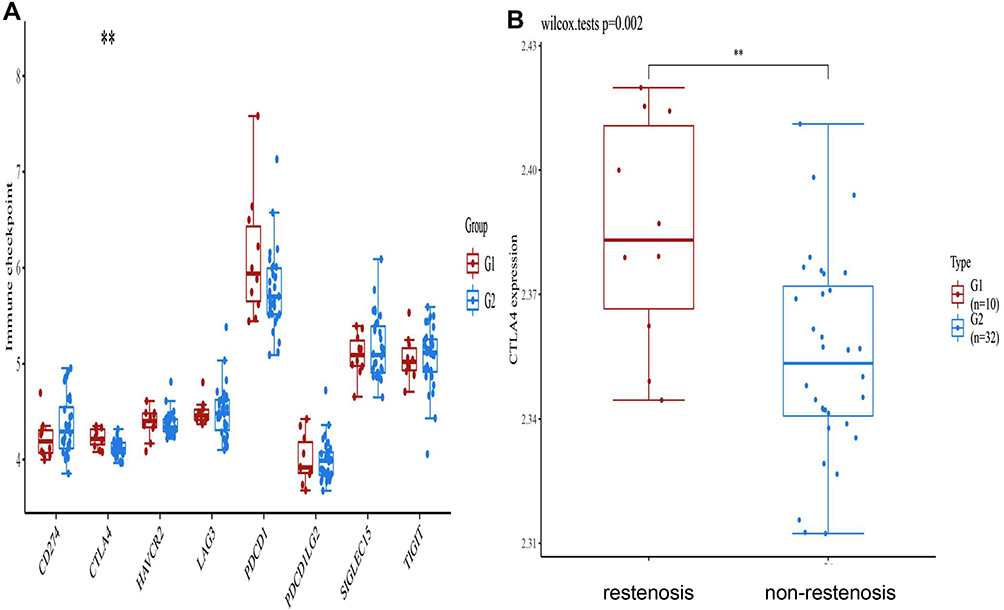 |
Figure 7 The expression distribution of the immune checkpoint-related mRNAs in the restenosis and non-restenosis groups. Notes: (A) Immune checkpoint-related gene analysis results. (B) The expression distribution of CTLA4 gene in restenosis, where the horizontal axis represents restenosis and non-restenosis samples, the vertical axis represents the gene expression distribution. **P < 0.01, the asterisk represents the degree of importance (*P). The significance of the two groups of samples passed the Wilcox test. |
Validation of Diagnostic Genes
We verified the identified DEGs using qRT-PCR in peripheral blood samples of patients with restenosis and controls (Figures 8A–F). Among the evaluated genes, the expression levels of RPSA and RPL36 were up-regulated in restenosis patients (Figures 8E and F). Notably, the expression level of RPSA was significantly increased in the patients (Figure 8F). Finally, we built a flow chart for the whole experiment design (Figure 9).
 |
Figure 8 qRT-PCR validation of gene expression. Abbreviation: ns, not significant. Notes: Quantitative real-time PCR (qRT-PCR) of (A) GLS2, (B) CTLA4, (C) EEF1D, (D) YHDF2, (E) RPL36 and (F) RPSA in the blood of restenosis compared to the control. *P < 0.05, **P < 0.002. |
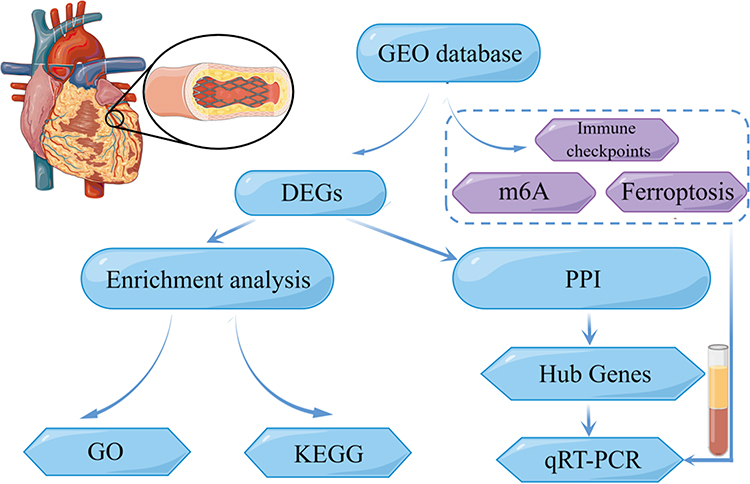 |
Figure 9 Flow chart of restenosis. Note: Figure was created using the open tool, Figdraw. |
Discussion
Restenosis is characterized by a gradual narrowing of coronary artery in-stent lesions,36 and approximately 30% of patients with CAD undergoing PCI experience restenosis.2,37 Restenosis usually occurs in a few months after PCI, which is often accompanied by arterial damage and new intima formation. In recent years, balloon dilatation and drug-eluting stents have reduced the restenosis incidence and are thus widely used; however, approximately 20% of restenosis cases still occur within 2 years after DES or PCI.38 Additionally, these two methods do not effectively inhibit the proliferation and migration of vascular smooth muscle cells, nor do they induce adequate reendothelialization in blood vessels.39–41 Thus, restenosis remains a major challenge in clinical practice, and developing potential biomarkers to reduce restenosis incidence is necessary. Fortunately, gene-chip technology has allowed for the increased use of gene expression data in clinical studies, and microarrays are applied extensively in peripheral blood studies and cardiopathy.42–45 For example, studies have shown that the higher the sST2 plasma levels, the lower the expression of ST2L on the membrane of the cells composing the carotid atherosclerotic plaques.46 Although several studies have examined factors related to AMI or CHD occurrence, for instance, some research report that ECG index can predict Diastolic dysfunction (DD) in patients without known coronary artery disease. Such as the electrocardiographic diastolic index (EDI), which is an inexpensive, feasible, and easy to use formula, appears to have a considerable role in predicting diastolic dysfunction (DD) in adult patients,47 little is known about the predictive value of in-stent restenosis after AMI.48 Therefore, it is necessary to prevent restenosis occurrence and explore the underlying molecular mechanism. Here, we used GEO gene expression datasets to test restenosis-related differential gene expression and identify DEGs via functional analyses. Next, we employed MCC and MCODE calculation methods to screen out genes as potential diagnostic markers. Subsequently, we verified the relationship between restenosis-related genes with ferroptosis, m6A, and the immune checkpoint. Our novel study should contribute to the better diagnosis and treatment of vascular restenosis. Additionally, the findings may provide a definite biomarker to predict restenosis risk in patients undergoing PCI or DES.
In the enrichment analysis of differentially expressed genes, we found fewer enrichment pathways for genes associated with restenosis. We believe that the cause of this problem is due to the pathological mechanism of RNA-regulated restenosis. It is well known that the pathological mechanisms of RNA-regulated restenosis include the following two main aspects: first, neointimal proliferation, including smooth muscle migration and proliferation, and extracellular matrix deposition; second, vascular remodeling. For the former, infiltration of various inflammatory cells is predominant, whereas the current mechanism of vascular remodeling leading to restenosis is not dominated by inflammatory infiltration. Therefore, when performing differential expression analysis, we took into account the diversity of mechanisms by which it occurs, and the absence of KEGG- and GO-related enrichment pathways would not affect the role of these genes in restenosis. In our analysis, this result may be related to the independent role of these DEGs in the pathogenesis of restenosis and may be a novel direction for the mechanism of restenosis occurrence. In the analysis of clinical patient information. We found that patients with restenosis had a higher probability of having hypertension, diabetes mellitus, and a higher history of smoking. However, we believe that this is a common risk factor for coronary artery disease and cannot be a specific risk factor for restenosis.
The eukaryotic translation extension factor-1 (EEF1) protein complex is composed of non-ribosomal protease factors; among these members, EEF1D plays a carcinogenic role by maintaining the Akt-mTOR and Akt-Bad signaling pathways in osteosarcoma.49 The RPSA gene encodes SA ribosomal protein, which has a variety of functions, including laminin binding, ribosomal function, nuclear function, extracellular matrix modification, and signal transduction.50 These previous studies coincide with the results of our current study. Metabolism is a strong predictor of inflammation and injury. In recent years, there have been increasing reports of a metabolic disorder involving intracellular lipid peroxidation that produces toxic lipids and triggers cell death, which is termed ferroptosis. The ferroptosis-related gene GLS2 was among the restenosis-associated genes identified in this study. Moreover, studies have confirmed that the m6A modification significantly affects the occurrence and development of restenosis.39 But our results revealed that the expression level of the methylation-related gene YTHDF2 was not increased in patients with restenosis. YTHDF2 is an m6A reader that binds to m6A-containing mRNAs to regulate the localization and stability of the bound mRNAs.51 Moreover, YTHDF2 regulates the occurrence and development of several tumors, including breast and prostate cancers.52–57 Therefore, methylation of YTHDF2 may play a pathophysiological role in restenosis through structural changes of it. Among our results of immune checkpoint genes, CTLA4 was also not significantly associated with restenosis.
Studies have shown that the development of restenosis is associated with damage to endothelial and smooth muscle cells. Smooth muscle cells are relevant to maintaining the integrity of the heart muscle. PCI damages the endothelial cells, destroying them as a whole and exposing the subendothelial matrix to the blood. In turn, vascular smooth muscle cells continue to proliferate and the endothelium overgrows, thereby increasing the risk of restenosis. Indeed, laminin is a family of extracellular matrix glycoproteins. Involved in cell adhesion, differentiation, migration, signaling, neurite growth and metastasis, RPSA is the cell surface receptor for laminins and plays an important role in the adhesion of cells to the basement membrane and the subsequent activation of signaling pathways.58 The gene encoding RPL36 is located on position 19p13.2 at the short arm of human chromosome 19 and consists of 104 amino acids with a molecular weight of 12128 daltons.59 It may therefore also play a role in cell fate determination and tissue morphogenesis. Thus, RPSA and RPL36 play a key role in the development of restenosis.
Our findings from public databases and bioinformatics tools were thus verified in clinical samples, demonstrating that during coronary artery stenting, a significant increase in RPSA and RPL36 expression could predict the occurrence of in-stent restenosis. However, it is interesting to note that the significant changes in the expression levels of EEF1D, GLS2, CTLA4, and YTHDF2 in the restenosis patients in our clinical sample did not match the results of bioinformatic analysis. One potential reason for this discrepancy could be that these genes may be associated with a particular phenotype in the restenosis-associated changes, and thus did not cause the change of expression quantity. This study also has some limitations. First, this study is a retrospective study, and some prospective studies are needed in the future to further diagnose the occurrence of restenosis. Second, the total number of restenosis samples analyzed in this work was small. Thus, our results need to be further confirmed in experiments with larger sample sizes. Third, the ferroptosis, m6A, and immune checkpoint-related genes involved in this experiment are only a preliminary screen, and further experiments are still needed for validation.
Conclusion
In conclusion, we identified RPL36 and RPSA as the diagnostic biomarkers for restenosis. This study can contribute to the timely diagnosis and improved treatment of restenosis.
Abbreviations
CHD, coronary heart disease; DEGs, differentially expressed genes; GO, Gene Ontology; KEGG, Kyoto Encyclopedia of Genes and Genomes; ROC, The receiver operator characteristic; qRT-PCR, quantitative real-time polymerase chain reaction.
Acknowledgments
We would like to thank the GEO (GSE46560, GSE48060) networks for providing the data.
Disclosure
The authors report no conflicts of interest in this work.
References
1. Schweizer W. [Editorial: acute coronary heart disease: definition and nomenclature (author’s transl)]. Schweiz Rundsch Med Prax. 1975;64:829–830. German.
2. Her A, Shin E. Current management of in-stent restenosis. Korean Circ J. 2018;48:337–349. doi:10.4070/kcj.2018.0103
3. Li T, Zeng Z. Adiponectin as a potential therapeutic target for the treatment of restenosis. pharmacotherapie. 2018;101:798–804. doi:10.1016/j.biopha.2018.03.003
4. Stimpfle F, Bauer M, Rath D, et al. Variants of PEAR1 are associated with outcome in patients with ACS and stable CAD undergoing PCI. Front Pharmacol. 2018;9:490. doi:10.3389/fphar.2018.00490
5. Alfonso F, Byrne R, Rivero F, Kastrati A. Current treatment of in-stent restenosis. J Am Coll Cardiol. 2014;63:2659–2673. doi:10.1016/j.jacc.2014.02.545
6. Nichols M, Townsend N, Scarborough P, Rayner M. Cardiovascular disease in Europe 2014: epidemiological update. Eur Heart J. 2014;35:2950–2959. doi:10.1093/eurheartj/ehu299
7. Avci II, Sahin I, Gungor B, et al. Association of monocyte to high-density lipoprotein ratio with bare-metal stent restenosis in STEMI patients treated with primary PCI. North Clin Istanb. 2019;6(4):393–400. doi:10.14744/nci.2018.93653
8. Law M, Watt H, Wald N. The underlying risk of death after myocardial infarction in the absence of treatment. Arch Intern Med. 2002;162:2405–2410. doi:10.1001/archinte.162.21.2405
9. Zhao E, Zhou C, Chen S. A signature of 14 immune-related gene pairs predicts overall survival in gastric cancer. Clin Transl Oncol. 2021;23:265–274. doi:10.1007/s12094-020-02414-7
10. Cao Y, Tang W, Tang W. Immune cell infiltration characteristics and related core genes in lupus nephritis: results from bioinformatic analysis. BMC Immunol. 2019;20:37. doi:10.1186/s12865-019-0316-x
11. Zhao E, Zhou C, Chen S. Flap endonuclease 1 (FEN1) as a novel diagnostic and prognostic biomarker for gastric cancer. Clin Res Hepatol Gastroenterol. 2021;45:101455. doi:10.1016/j.clinre.2020.04.019
12. Zhao E, Bai X. Nomogram based on microRNA signature contributes to improve survival prediction of clear cell renal cell carcinoma. Biomed Res Int. 2020;2020:7434737. doi:10.1155/2020/7434737
13. Chen A, Gao X, Wang Z, et al. Therapeutic exosomes in prognosis and developments of coronary artery disease. Front Cardiovasc Med. 2021;8:691548. doi:10.3389/fcvm.2021.691548
14. Wu Y, Fu X. Comprehensive analysis of predictive factors for rapid angiographic stenotic progression and restenosis risk in coronary artery disease patients underwent percutaneous coronary intervention with drug-eluting stents implantation. J Clin Lab Anal. 2019;33:e22666. doi:10.1002/jcla.22666
15. Sun J, Yu H, Liu H, et al. Correlation of pre-operative circulating inflammatory cytokines with restenosis and rapid angiographic stenotic progression risk in coronary artery disease patients underwent percutaneous coronary intervention with drug-eluting stents. J Clin Lab Anal. 2020;34(3):e23108. doi:10.1002/jcla.23108
16. Meeuwsen J, Wesseling M, Hoefer I, de Jager S. Prognostic value of circulating inflammatory cells in patients with stable and acute coronary artery disease. Front Cardiovasc Med. 2017;4:44. doi:10.3389/fcvm.2017.00044
17. Schiele T. Current understanding of coronary in-stent restenosis. Pathophysiology, clinical presentation, diagnostic work-up, and management. Z Kardiol. 2005;94:772–790. doi:10.1007/s00392-005-0299-x
18. Iwashima Y, Fukuda T, Yoshihara F, et al. Incidence and risk factors for restenosis, and its impact on blood pressure control after percutaneous transluminal renal angioplasty in hypertensive patients with renal artery stenosis. J Hypertens. 2016;34:1407–1415. doi:10.1097/HJH.0000000000000928
19. Zeller T, Rastan A, Macharzina R, Beschorner U, Noory E. Novel approaches to the management of advanced peripheral artery disease: perspectives on drug-coated balloons, drug-eluting stents, and bioresorbable scaffolds. Curr Cardiol Rep. 2015;17:624. doi:10.1007/s11886-015-0624-6
20. Park D, Ahn J, Park H, et al. Ten-year outcomes after drug-eluting stents versus coronary artery bypass grafting for left main coronary disease: extended follow-up of the PRECOMBAT trial. Circulation. 2020;141:1437–1446. doi:10.1161/circulationaha.120.046039
21. Barrett T, Wilhite S, Ledoux P, et al. NCBI GEO: archive for functional genomics data sets--update. Nucleic Acids Res. 2013;41:D991–995. doi:10.1093/nar/gks1193
22. Gene Ontology Consortium. The Gene Ontology (GO) project in 2006. Nucleic Acids Res. 2006;34:D322–326. doi:10.1093/nar/gkj021
23. Kanehisa M, Sato Y, Kawashima M, Furumichi M, Tanabe M. KEGG as a reference resource for gene and protein annotation. Nucleic Acids Res. 2016;44:D457–462. doi:10.1093/nar/gkv1070
24. Szklarczyk D, Gable A, Lyon D, et al. STRING v11: protein-protein association networks with increased coverage, supporting functional discovery in genome-wide experimental datasets. Nucleic Acids Res. 2019;47:D607–D613. doi:10.1093/nar/gky1131
25. Shannon P, Markiel A, Ozier O, et al. Cytoscape: a software environment for integrated models of biomolecular interaction networks. Genome Res. 2003;13:2498–2504. doi:10.1101/gr.1239303
26. Hoadley K, Yau C, Wolf D, et al. Multiplatform analysis of 12 cancer types reveals molecular classification within and across tissues of origin. J Cell. 2014;158:929–944. doi:10.1016/j.cell.2014.06.049
27. Iglesia M, Parker J, Hoadley K, Serody J, Perou C, Vincent B. Genomic analysis of immune cell infiltrates across 11 tumor types. J Natl Cancer Inst. 2016;108:djw144. doi:10.1093/jnci/djw144
28. Koh Y, Han J, Haam S, Jung J, Lee H. Increased CMTM6 can predict the clinical response to PD-1 inhibitors in non-small cell lung cancer patients. J Oncoimmunol. 2019;8:e1629261. doi:10.1080/2162402x.2019.1629261
29. Yi L, Wu G, Guo L, Zou X, Huang P. Comprehensive analysis of the PD-L1 and immune infiltrates of mA RNA methylation regulators in head and neck squamous cell carcinoma. Mol Ther Nucleic Acids. 2020;21:299–314. doi:10.1016/j.omtn.2020.06.001
30. Yu G, Wang L, Han Y, He Q. clusterProfiler: an R package for comparing biological themes among gene clusters. OMICS. 2012;16:284–287. doi:10.1089/omi.2011.0118
31. Li L, Guo L, Yin G, et al. Upregulation of circular RNA circ_0001721 predicts unfavorable prognosis in osteosarcoma and facilitates cell progression via sponging miR-569 and miR-599. pharmacotherapie. 2019;109:226–232. doi:10.1016/j.biopha.2018.10.072
32. Liu Z, Zhao Q, Zuo ZX, et al. Systematic analysis of the aberrances and functional implications of ferroptosis in cancer. iScience. 2020;23:101302. doi:10.1016/j.isci.2020.101302
33. Li Y, Xiao J, Bai J, et al. Molecular characterization and clinical relevance of m(6)A regulators across 33 cancer types. Mol Cancer. 2019;18:137. doi:10.1186/s12943-019-1066-3
34. Zeng D, Li M, Zhou R, et al. Tumor microenvironment characterization in gastric cancer identifies prognostic and immunotherapeutically relevant gene signatures. Cancer Immunol Res. 2019;7:737–750. doi:10.1158/2326-6066.CIR-18-0436
35. Wang J, Sun J, Liu LN, et al. Siglec-15 as an immune suppressor and potential target for normalization cancer immunotherapy. Nat Med. 2019;25:656–666. doi:10.1038/s41591-019-0374-x
36. Vom Dahl J, Dietz U, Haager PK, et al. Rotational atherectomy does not reduce recurrent in-stent restenosis: results of the angioplasty versus rotational atherectomy for treatment of diffuse in-stent restenosis trial (ARTIST). Circulation. 2002;105:583–588. doi:10.1161/hc0502.103347
37. Cassese S, Byrne RA, Tada T, et al. Incidence and predictors of restenosis after coronary stenting in 10 004 patients with surveillance angiography. Heart. 2014;100:153–159. doi:10.1136/heartjnl-2013-304933
38. Cassese S, Kufner S, Xhepa E, et al. Three-year efficacy and safety of new- versus early-generation drug-eluting stents for unprotected left main coronary artery disease insights from the ISAR-LEFT MAIN and ISAR-LEFT MAIN 2 trials. Clin Res Cardiol. 2016;105:575–584. doi:10.1007/s00392-015-0953-x
39. Yang X, Yang Y, Guo J, et al. Targeting the epigenome in in-stent restenosis: from mechanisms to therapy. Mol Ther Nucleic Acids. 2021;23:1136–1160. doi:10.1016/j.omtn.2021.01.024
40. Liu TF, Lin T, Ren LH, Li GP, Peng JJ. [Association of CMTM5 gene expression with the risk of in-stent restenosis in patients with coronary artery disease after drug-eluting stent implantation and the effects and mechanisms of CMTM5 on human vascular endothelial cells]. Beijing Da Xue Xue Bao Yi Xue Ban. 2020;52:856–862. Chinese. doi:10.19723/j.issn.1671-167X.2020.05.010
41. Li Z, Wu J, Wei W, et al. Association of serum miR-186-5p with the prognosis of acute coronary syndrome patients after percutaneous coronary intervention. Front Physiol. 2019;10:686. doi:10.3389/fphys.2019.00686
42. Li L, Cong Y, Gao X, Wang Y, Lin P. Differential expression profiles of long non-coding RNAs as potential biomarkers for the early diagnosis of acute myocardial infarction. Oncotarget. 2017;8:88613–88621. doi:10.18632/oncotarget.20101
43. Chen DQ, Kong XS, Shen XB, et al. Identification of differentially expressed genes and signaling pathways in acute myocardial infarction based on integrated bioinformatics analysis. Cardiovasc Ther. 2019;2019:8490707. doi:10.1155/2019/8490707
44. Han H, Du R, Cheng P, Zhang J, Chen Y, Li G. Comprehensive analysis of the immune infiltrates and aberrant pathways activation in atherosclerotic plaque. Front Cardiovasc Med. 2020;7:602345. doi:10.3389/fcvm.2020.602345
45. Ghafouri-Fard S, Gholipour M, Taheri M. Role of MicroRNAs in the pathogenesis of coronary artery disease. Front Cardiovasc Med. 2021;8:632392. doi:10.3389/fcvm.2021.632392
46. Scicchitano P, Marzullo A, Santoro A, et al. The prognostic role of ST2L and sST2 in patients who underwent carotid plaque endarterectomy: a five-year follow-up study. J Clin Med. 2022;11(11). doi:10.3390/jcm11113142
47. Hayiroglu MI, Cinar T, Cicek V, et al. A simple formula to predict echocardiographic diastolic dysfunction-electrocardiographic diastolic index. Herz. 2021;46(Suppl2):159–165. doi:10.1007/s00059-020-04972-6
48. Ghafouri-Fard S, Gholipour M, Taheri M. The emerging role of long non-coding RNAs and circular RNAs in coronary artery disease. Front Cardiovasc Med. 2021;8:632393. doi:10.3389/fcvm.2021.63239349
49. Cheng DD, Li SJ, Zhu B, Zhou SM, Yang QC. EEF1D overexpression promotes osteosarcoma cell proliferation by facilitating Akt-mTOR and Akt-bad signaling. J Exp Clin Cancer Res. 2018;37:50. doi:10.1186/s13046-018-0715-5
50. DiGiacomo V, Meruelo D. Looking into laminin receptor: critical discussion regarding the non-integrin 37/67-kDa laminin receptor/RPSA protein. Biol Rev Camb Philos Soc. 2016;91:288–310. doi:10.1111/brv.12170
51. Chen M, Wei L, Law CT, et al. RNA N6-methyladenosine methyltransferase-like 3 promotes liver cancer progression through YTHDF2-dependent posttranscriptional silencing of SOCS2. Hepatology. 2018;67:2254–2270. doi:10.1002/hep.29683
52. Fei Q, Zou Z, Roundtree IA, Sun HL, He C. YTHDF2 promotes mitotic entry and is regulated by cell cycle mediators. PLoS Biol. 2020;18:e3000664. doi:10.1371/journal.pbio.3000664
53. Miyake S, Wakita H, Bernstock JD, et al. Hypophosphorylation of ribosomal protein S6 is a molecular mechanism underlying ischemic tolerance induced by either hibernation or preconditioning. J Neurochem. 2015;135:943–957. doi:10.1111/jnc.13368
54. Hou J, Zhang H, Liu J, et al. YTHDF2 reduction fuels inflammation and vascular abnormalization in hepatocellular carcinoma. Mol Cancer. 2019;18:163. doi:10.1186/s12943-019-1082-3
55. Li J, Xie H, Ying Y, et al. YTHDF2 mediates the mRNA degradation of the tumor suppressors to induce AKT phosphorylation in N6-methyladenosine-dependent way in prostate cancer. Mol Cancer. 2020;19:152. doi:10.1186/s12943-020-01267-6
56. Shen X, Zhao K, Xu L, et al. YTHDF2 inhibits gastric cancer cell growth by regulating FOXC2 signaling pathway. Front Genet. 2020;11:592042. doi:10.3389/fgene.2020.592042
57. Xu F, Li J, Ni M, et al. FBW7 suppresses ovarian cancer development by targeting the N(6)-methyladenosine binding protein YTHDF2. Mol Cancer. 2021;20:45. doi:10.1186/s12943-021-01340-8
58. Vilas-Boas F, Bagulho A, Tenente R, et al. Hydrogen peroxide regulates cell adhesion through the redox sensor RPSA. Free Radic Biol Med. 2016;90:145–157. doi:10.1016/j.freeradbiomed.2015.11.019
59. Song M, Jung C, Park C, et al. RPL36 as a prognostic marker in hepatocellular carcinoma. Pathol Int. 2011;61:638–644. doi:10.1111/j.1440-1827.2011.02716.x
 © 2023 The Author(s). This work is published and licensed by Dove Medical Press Limited. The
full terms of this license are available at https://www.dovepress.com/terms
and incorporate the Creative Commons Attribution
- Non Commercial (unported, 3.0) License.
By accessing the work you hereby accept the Terms. Non-commercial uses of the work are permitted
without any further permission from Dove Medical Press Limited, provided the work is properly
attributed. For permission for commercial use of this work, please see paragraphs 4.2 and 5 of our Terms.
© 2023 The Author(s). This work is published and licensed by Dove Medical Press Limited. The
full terms of this license are available at https://www.dovepress.com/terms
and incorporate the Creative Commons Attribution
- Non Commercial (unported, 3.0) License.
By accessing the work you hereby accept the Terms. Non-commercial uses of the work are permitted
without any further permission from Dove Medical Press Limited, provided the work is properly
attributed. For permission for commercial use of this work, please see paragraphs 4.2 and 5 of our Terms.