Back to Journals » OncoTargets and Therapy » Volume 9
Biomarker and competing endogenous RNA potential of tumor-specific long noncoding RNA in chromophobe renal cell carcinoma
Authors He HT, Xu M, Kuang Y, Han XY, Wang MQ, Yang Q ![]()
Received 4 July 2016
Accepted for publication 20 September 2016
Published 18 October 2016 Volume 2016:9 Pages 6399—6406
DOI https://doi.org/10.2147/OTT.S116392
Checked for plagiarism Yes
Review by Single anonymous peer review
Peer reviewer comments 4
Editor who approved publication: Dr William C. Cho
Hai-Tao He,1,2,* Mu Xu,1,* Ye Kuang,1 Xiao-Yun Han,1 Ming-Qi Wang,1 Qing Yang1
1Department of Pathogenobiology, 2Department of Cell Biology, College of Basic Medical Sciences, Jilin University, Changchun, People’s Republic of China
*These authors contributed equally to this work
Background: Accumulating evidence suggests long noncoding RNAs (lncRNAs) play important roles in the initiation and progression of cancers. However, their functions in chromophobe renal cell carcinoma (chRCC) are not fully understood.
Methods: We analyzed the expression profiles of lncRNA, microRNA, and protein-coding RNA, along with the clinical information of 59 primary chRCC patients collected from The Cancer Genome Atlas database to identify lncRNA biomarkers for prognosis. We also constructed an lncRNA–microRNA–mRNA coexpression network (competitive endogenous RNAs network) by bioinformational approach.
Results: One hundred and forty-two lncRNAs were found to be differentially expressed between the cancer and normal tissues (fold change ≥1.5, P<0.001). Among them, 12 lncRNAs were also differentially expressed with the corresponding clinical characteristics (fold change ≥1.5, P<0.01). Besides, 7 lncRNAs (COL18A1-AS, BRE-AS1, SNHG7, TMEM51-AS1, C21orf62-AS1, LINC00336, and LINC00882) were identified to be significantly correlated with overall survival (log-rank P<0.05). A competitive endogenous RNA network in chRCC containing 16 lncRNAs, 18 miRNAs, and 168 protein-coding RNAs was constructed.
Conclusion: Our results identified specific lncRNAs associated with chRCC progression and prognosis, and presented competing endogenous RNA potential of lncRNAs in the tumor.
Keywords: long noncoding RNA, chromophobe renal cell carcinoma, biomarker, competing endogenous RNA network
Introduction
Renal cell carcinoma (RCC) is one of the most common genitourinary cancers worldwide.1 An estimated 61,560 new cases of RCC were expected in the US in 2015.2 Chromophobe renal cell carcinoma (chRCC) is a relatively rare subtype of RCC, accounting for approximately 5% of all patients.3 Compared to other RCC subtypes, chRCC has significantly higher cancer-specific survival probabilities. Prognosis for patients with chRCC has improved in past decades due to technological advances in early detection and intervention.4 Even so, the clinical behavior and long-term outcomes of chRCC are still highly variable. Hence, identifying novel molecular biomarkers and studying the detailed molecular mechanism of chRCC are necessary.
Noncoding RNAs with length greater than 200 nucleotides are cataloged as long noncoding RNAs (lncRNAs).5 LncRNAs are usually short of meaningful open reading frames (ORFs) and not translated into proteins, but they can regulate the gene expression in the form of RNA in many aspects.6,7 Competitive endogenous RNA (ceRNA) hypothesis was proposed by Salmena et al in 2011. They pointed out that some messenger RNAs and noncoding RNAs such as pseudogene, lncRNAs, and circular RNAs can regulate the target genes by competitive binding to the same microRNA (miRNA)-binding sites through miRNA response elements (MREs), so the inhibition of target genes by miRNA can be released or lessened.8 This is to say that lncRNA–miRNA–mRNA may form a large and subtle regulatory RNA network in tumors. To date, various lncRNA and miRNA interactions with significant functions have been identified in many cancers.9–11 In RCC, lncRNA MALAT1 was found to function as a competing endogenous RNA to regulate epithelial–mesenchymal transition-related proteins by sponging miR-200s and miR-205, and HOTAIR was proved to promote the proliferation and invasion of renal clear cell adenocarcinoma cells 786-O by interacting with miR-141.12–15 However, more functions of lncRNA in chRCC remain to be elucidated.
In this study, we analyzed the expression data of lncRNA, miRNA, and protein-coding RNA and the corresponding clinical information of 59 chRCC patients selected from The Cancer Genome Atlas (TCGA) database to explore the differential expression profiles of lncRNAs in different clinical statuses and to identify tumor-specific lncRNAs’ competing endogenous RNA potential in the tumor.
Methods
Data collection
Fifty-nine chRCC patients selected from the TCGA database were enrolled in our study. The inclusion criteria were set as follows: 1) the tumor histological type was chRCC; 2) the patient did not have a history of other malignancies; 3) the patient had not received neoadjuvant therapy; and 4) the clinical information was complete. Among these 59 patients (Cohort T), 23 patients provided the adjacent nontumor tissues (Cohort M). Their corresponding RNA expression data (level 3) were downloaded from TCGA data portal (http://cancergenome.nih.gov, up to Jan 20, 2016). These gene expression profiles were produced by using Illumina HiSeq 2000 sequencer platforms (Illumina Inc., San Diego, CA, USA). The raw expression data of lncRNAs and mRNAs which were generated from RNA sequencing raw reads by RNASeqV2 postprocessing pipelines were normalized as RNA-Seq by Expectation-Maximization. The raw expression data of miRNAs were standardized as reads per million by the TCGA project. Patient data were collected and processed following the data access policies approved by the Ethics Committee of The Cancer Genome Atlas Program. The authors downloaded all the data from the TCGA database and performed this study in line with the TCGA publication guidelines (http://cancergenome.nih.gov/publications/publicationguidelines). All patients enrolled in the program were well informed. Therefore, no further ethical approval was required for this study. We analyzed these expression profiles with BRB-Array tools (version 4.4.0) developed by Dr Richard Simon and the BRB-Array Tools Development Team.16
Construction of lncRNA-associated ceRNA network
LncRNA-associated ceRNA network was constructed based on the “ceRNA hypothesis” that lncRNAs can regulate the expression of mRNAs which contain common MREs by combining the miRNAs competitively. We identified differentially expressed lncRNAs and miRNAs (fold change ≥5.0, P<0.001) in the tumor. Predicted human miRNA–lncRNA interactions were collected from starBase v2.017 and miRcode.18 Experimentally validated miRNA–target mRNA interactions were retrieved from the miRTarBase.19 Differentially expressed miRNAs were set as hub nodes. The lncRNAs and mRNAs were connected with these hub nodes according to their interactions. Maximal information coefficient (MIC) algorithm was used to identify the robustness of pair-wise relationships of miRNA–lncRNA and miRNA–mRNA (MIC >0.15, MIC-ρ2 >0.15).20 Cytoscape v3.021 was applied to construct and visualize the network graph.
Functional enrichment analysis
Kyoto Encyclopedia of Genes and Genomes (KEGG) pathway enrichment analysis of the coding RNAs involved in the ceRNA network was conducted using Database for Annotation, Visualization, and Integrated Discovery.22 We did the analysis with default parameters. The whole human genome was set as background; functional categories with P-value <0.05 were regarded as statistically significant.
Statistical analysis
Clinical category variables were presented as counts and percentages. The chi-square test was applied to analyze differences of distribution between Cohort M and Cohort T. RNA expression data were presented as mean ± standard deviation. Paired sample t-test was used to examine differences in lncRNA and miRNA expression between cancerous and matched adjacent tissues (significant P-value was set as 0.001). Unpaired t-test was conducted to find out the difference in lncRNA expression levels between different clinicopathological groups (significant P-value was set as 0.01). Unsupervised hierarchical cluster analysis was used to generate tree clusters for the separation of different classes with lncRNA expression profiles. Univariate Cox proportional hazards regression was applied to identify the lncRNAs associated with overall survival; Kaplan–Meier survival analyses and log-rank test were performed to study the relations of lncRNA expression states (cutoff point: median value) and survival time (significant P-value was set as 0.05). All statistical analyses were performed by the SPSS 19 (IBM Corporation, Armonk, NY, USA) and BRB-Array Tools 4.0.
Results
Patient characteristics
A total of 59 chRCC patients were enrolled in our study. Among them (Cohort T), 23 patients provided adjacent tissues (Cohort M). Their demographic characteristics and clinical information are summarized in Table 1.
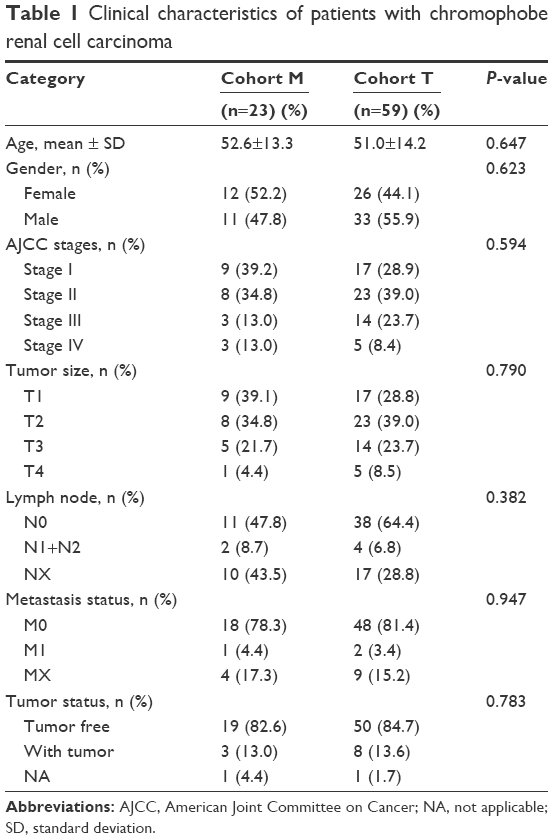 | Table 1 Clinical characteristics of patients with chromophobe renal cell carcinoma |
Differential expression analysis of lncRNAs
We identified 605 lncRNAs from the TCGA level 3 RNASeqV2 data according to the classification of HUGO Gene Nomenclature Committee (HGNC) (http://www.genenames.org). A total of 143 lncRNAs were found to be expressed differentially between the cancer and the paired adjacent tissues (fold change ≥1.5, P<0.001) (Table S1). Unsupervised hierarchical clustering could clearly discriminate cancer and normal class with these differentially expressed lncRNAs (Figures S1 and S2). In consideration of the fold change, 43 of them had an absolute fold change ≥5.0, and they were selected to build the ceRNA network (Table 2). Furthermore, among these 143 differentially expressed lncRNAs, 12 cancer-specific lncRNAs were also identified to be differentially expressed in different clinical features (fold change ≥1.5, P<0.01) with 3 for gender, 1 for age, 5 for tumor status, and 3 for American Joint Committee on Cancer stage and tumor size (Table 3). Because the number of patients with metastasis status M1 and lymph node status N1+N2 was too small, class comparison analyses were not conducted for them.
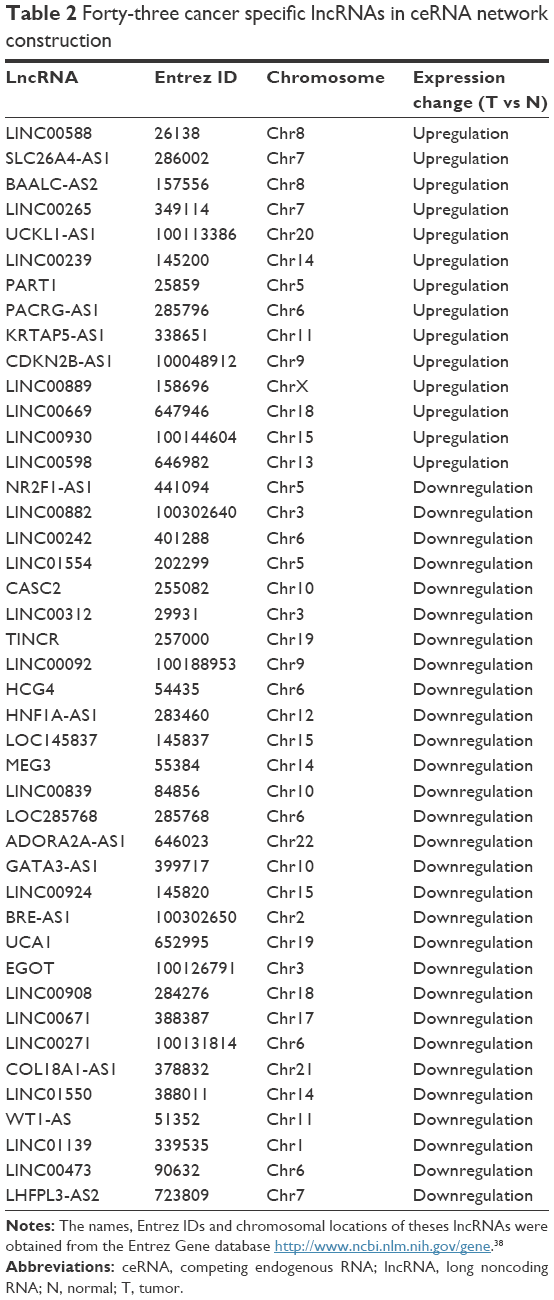 | Table 2 Forty-three cancer specific lncRNAs in ceRNA network construction |
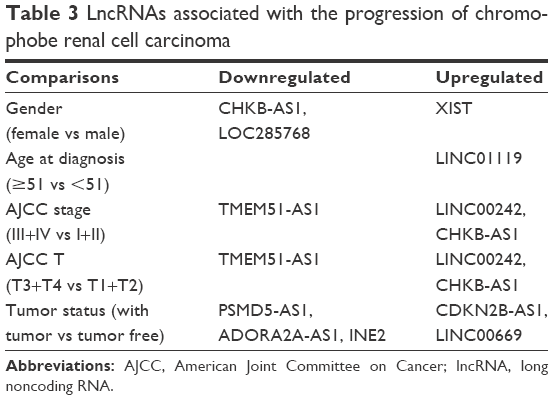 | Table 3 LncRNAs associated with the progression of chromophobe renal cell carcinoma |
LncRNAs in relation to patient prognosis
Among differentially expressed lncRNAs, 7 lncRNAs (COL18A1-AS, BRE-AS1, SNHG7, TMEM51-AS1, C21orf62-AS1, LINC00336, and LINC00882) were identified to be associated with the overall survival of chRCC by univariate Cox regression analysis. Kaplan–Meier survival curves indicated that COL18A1-AS1 (P=0.009), BRE-AS1 (P=0.011), SNHG7 (P=0.014), TMEM51-AS1 (P=0.024), C21orf62-AS1 (P=0.027), and LINC00336 (P=0.037) were positively correlated with overall survival, while the remaining LINC00882 (P=0.047) was negatively associated with overall survival (Figure 1).
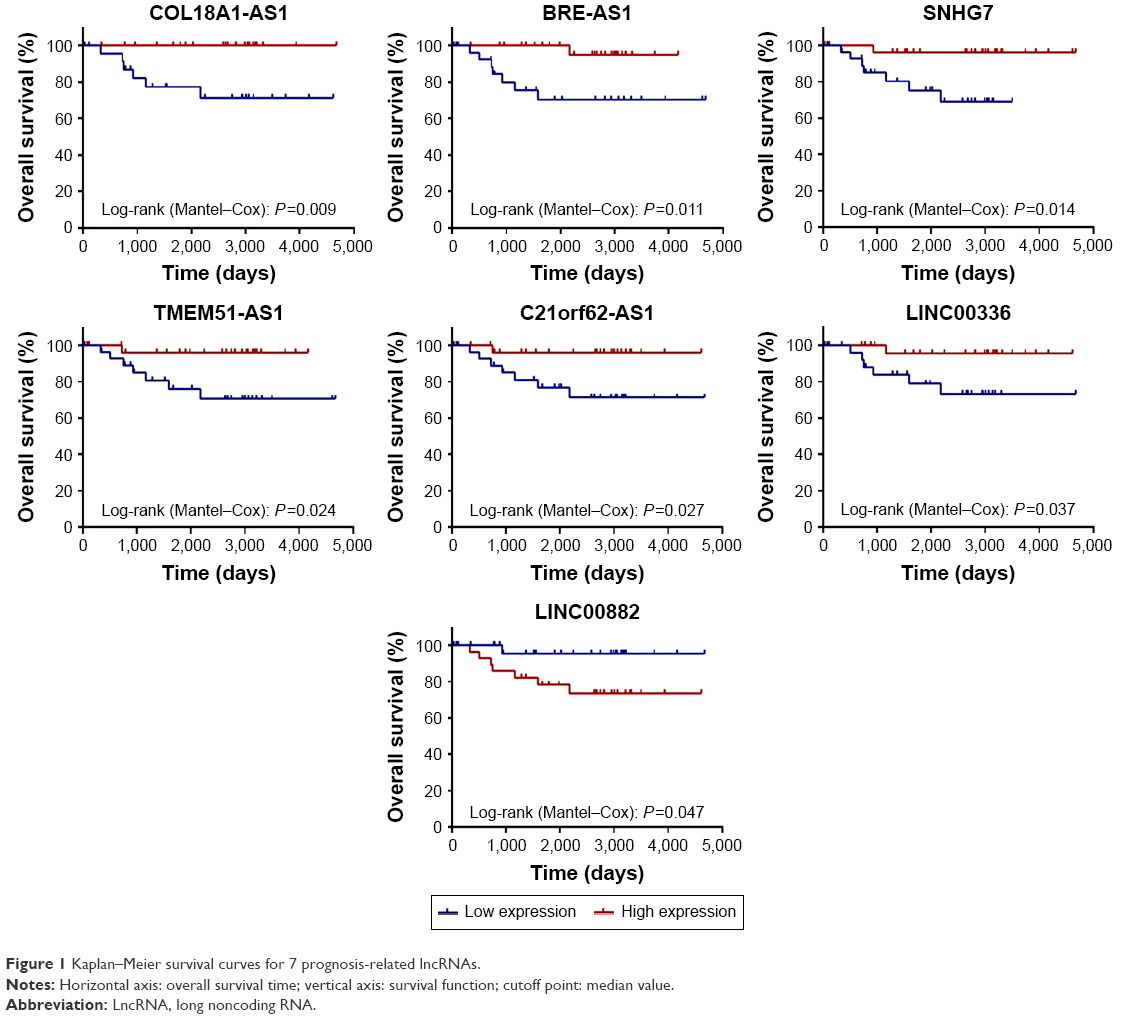 | Figure 1 Kaplan–Meier survival curves for 7 prognosis-related lncRNAs. |
LncRNA-associated ceRNA network
Thirty-one miRNAs identified to be expressed differentially between the cancer and adjacent tissues with absolute fold change higher than 5 (P<0.001) (Table S2) were selected to construct the ceRNA network. In a ceRNA network, miRNAs interact with lncRNAs through MREs, and we used miRcode and starBase v2.0 to find the potential MREs of these miRNAs in tumor-specific lncRNAs, as described in Table 2. The result demonstrated that 18 of 31 cancer-specific miRNAs might interact with 16 of 43 cancer-specific lncRNAs (Table 4). Subsequently, 167 experimentally validated target genes of miRNAs described in Table 4 were identified by using miRTarBase (Table 5), and all these miRNA–mRNA interactions were validated by reporter assay, Western blot, and qPCR. Then, an lncRNA–miRNA–mRNA network was established based on the above-mentioned data (Tables 4 and 5). The MIC algorithm was applied to test pair-wise correlations based on their expression levels. To enhance the robustness of the ceRNA network, only those pair-wise interactions with MIC >0.15 and MIC-ρ2 >0.15 were included in the ceRNA network (Figure 2).
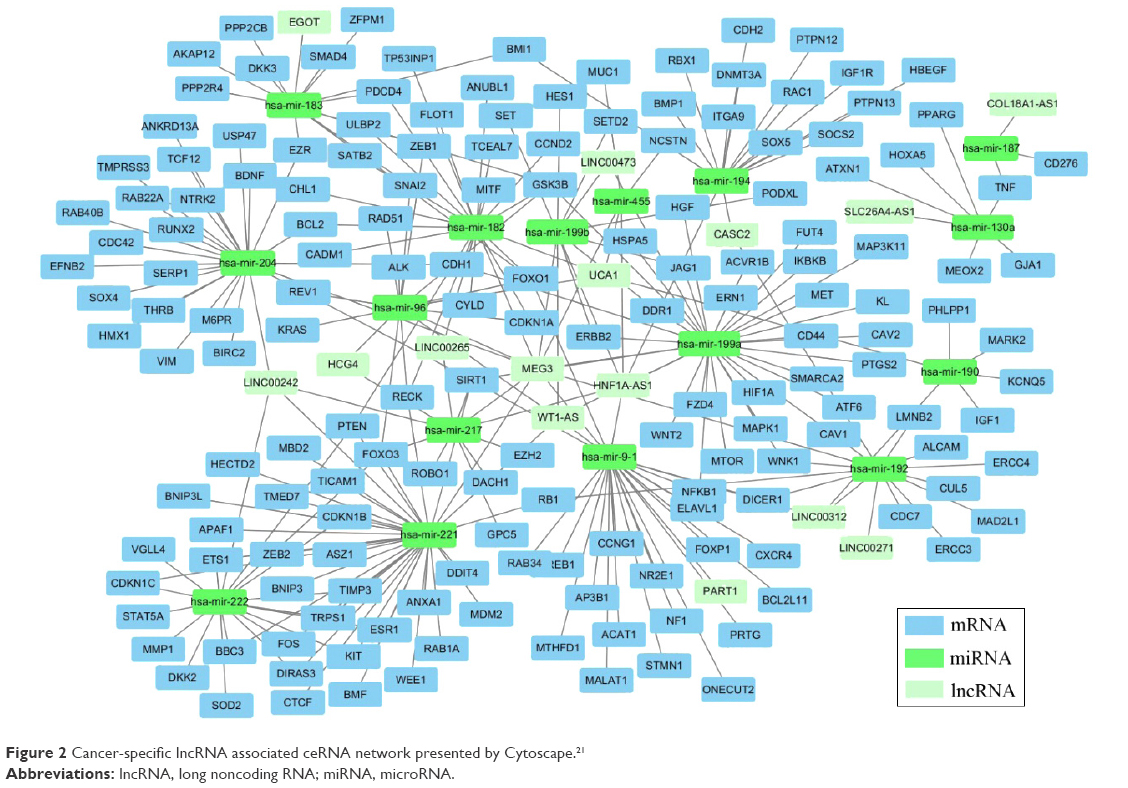 | Figure 2 Cancer-specific lncRNA associated ceRNA network presented by Cytoscape.21 |
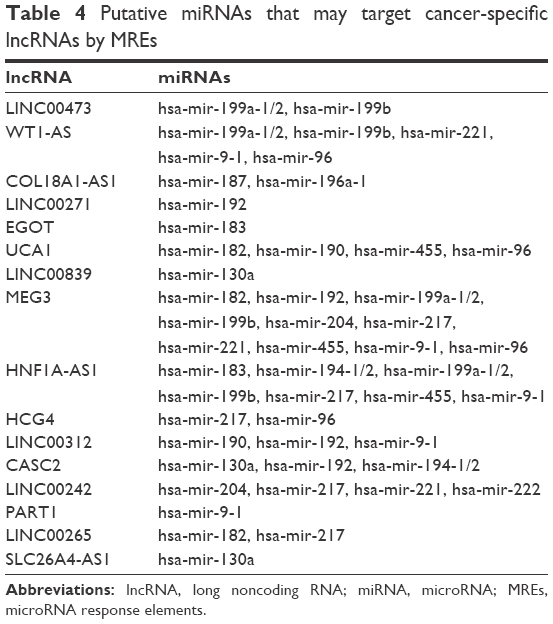 | Table 4 Putative miRNAs that may target cancer-specific lncRNAs by MREs |
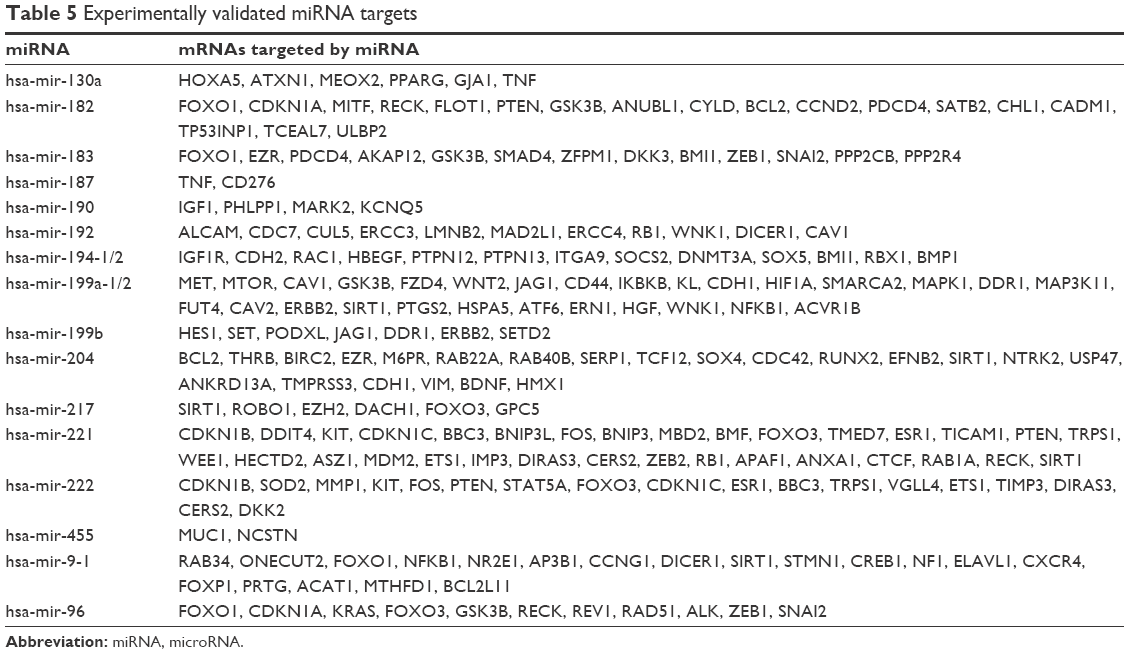 | Table 5 Experimentally validated miRNA targets |
KEGG pathway enrichment analysis
To explore the biological functions of these protein-coding RNAs involved in the ceRNA network, KEGG pathway enrichment analysis was conducted using Database for Annotation, Visualization, and Integrated Discovery. As summarized in Table 6, 12 cancer-related pathways were enriched, including those for prostate cancer, melanoma, pancreatic cancer, chronic myeloid leukemia, colorectal cancer, bladder cancer, glioma, RCC, small cell lung cancer, endometrial cancer, and acute myeloid leukemia, and 6 non-cancer-related pathways were enriched, including those for focal adhesion, adherens junction, cell cycle, neurotrophin signaling pathway, ErbB signaling pathway, and p53 signaling pathway.
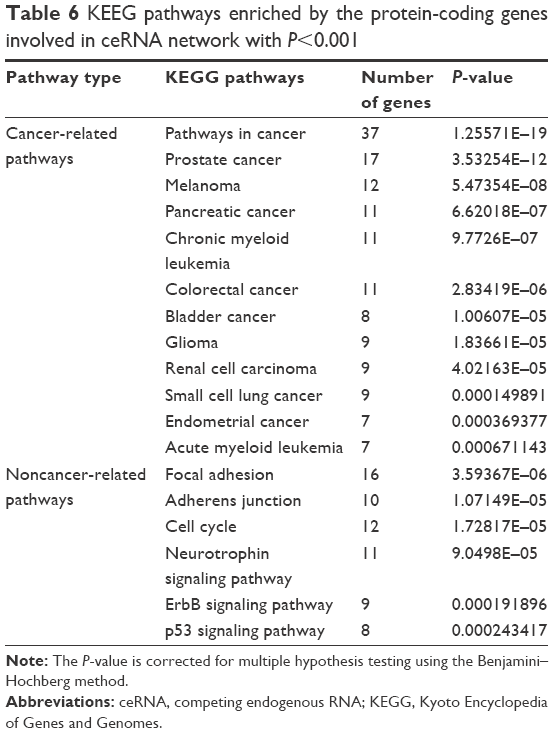 | Table 6 KEEG pathways enriched by the protein-coding genes involved in ceRNA network with P<0.001 |
Discussion
RCC has various histological subtypes, of which clear-cell RCC (about 70%), papillary RCC (about 10%–15%), and chRCC (about 5%) are the most prevalent.3 These subtypes have diverse genetic and clinical features, and the identification of molecular mechanisms behind their oncogenesis and progression comprises an important area of cancer research.4,23 In the present study, we focused on exploring the prognostic roles and the competing endogenous RNA potential of lncRNAs in chRCC. By analyzing the clinical information and large-scale sequencing data pertaining to a chRCC patient cohort, we identified tumor-specific lncRNAs in chRCC and investigated their distribution in different clinical features and prognoses. Besides, we constructed an lncRNA-related ceRNA network of chRCC consisting of lncRNAs, miRNAs, and protein-coding RNAs.
As a highly heterogeneous group of noncoding RNAs, lncRNAs can regulate the gene expression by means of diverse mechanisms and are involved in various biological processes.5,24 Mounting evidences suggest lncRNAs have key roles in regulation of tumor development and progression.10,25 These aberrantly expressed lncRNAs could be tracked in the migration, apoptosis, proliferation, and drug resistance patterns of tumor cells, which implies that lncRNAs could serve as potential therapeutic targets and biomarkers.26–29 Numerous studies have documented that lncRNAs could affect the expression of cancer-related proteins by interacting with miRNAs, somewhat validating the ceRNA hypothesis.14,15 In order to gain more insight about their effects in tumors, lncRNA profiling has become a major method to study the widespread dysregulated lncRNAs, and their coexpression networks with mRNAs and miRNAs have been constructed in various tumors.30–32 However, such lncRNAs-related ceRNA networks in RCC are still poorly explored.
Hence, we conducted the present study with the aim to identify lncRNA biomarkers of prognosis and construct an lncRNA–miRNA–mRNA coexpression network in chRCC. By analyzing the lncRNA expression profiles of 59 primary chRCC patients, we identified 142 differentially expressed lncRNAs between cancer and adjacent tissues, 43 of which had a more than a fivefold change in expression levels. In those upregulated lncRNAs, CDKN2B-AS1 has previously been reported to be able to promote cell proliferation. Furthermore, its high expression has been linked to poor prognosis in prostate and gastric cancer.33,34 The expression level of SLC26A4-AS1 was found to be significantly associated with overall higher survival of gastric cancer patients, but the mechanism was not elaborated.35 In those downregulated lncRNAs, CASC2 was found to be aberrantly expressed in glioma and non-small-cell lung cancer. Increase in CASC2 expression could inhibit cell proliferation of the 2 tumors, and CASC2 was proved to be an independent predictor of overall survival for non-small-cell lung cancer patients.36 In addition, 12 tumor-specific lncRNAs were found to be abnormally expressed in different clinical features. Dysregulated lncRNAs identified by tumor stage or size are identical because patients’ distributions in their different groups are common. As the number of patients with metastasis status M1 and lymph node status N1 + N2 was too small, class comparison analyses were not conducted. In consideration of the relationship between cancer-specific lncRNAs and prognosis, we identified 7 lncRNAs that were associated with chRCC overall survival, and they may serve as prognosis prediction tools or candidate drug targets for chRCC management. Among the 6 protective lncRNAs, SNHG7 was reported to be involved in the cellular response to radiation-induced oxidative stress.37 The functions of the other 5 protective and 1 risky lncRNA are still unknown.
For further analyzing the interactions between lncRNA, miRNA, and mRNA in chRCCs, we constructed a ceRNA network by bioinformational methods. This ceRNA network contained 16 tumor-specific lncRNAs, 18 tumor-specific miRNAs, and 168 protein-coding RNAs. To improve the prediction accuracy of the coexpression network, pair-wise relationships of lncRNA–miRNA–mRNA were filtered based on their expression levels by the MIC algorithm which could detect novel associations in complex datasets. Through KEGG analysis, we found that those ceRNA network-involved genes were mainly enriched in cancer-related pathways, further indicating that lncRNAs may play a vital role in tumor molecular regulatory networks. The ceRNA network we constructed reveals an unknown ceRNA regulatory network in chRCC and gives some new perspectives of lncRNAs’ functions in gene regulation. However, some issues should be acknowledged in interpreting this ceRNA network. The network was constructed in silico and could serve as a reference for further research. For validation of the lncRNA/miRNA/mRNA pathway, additional biological experiments need to be conducted.
Conclusion
By analyzing an independent chRCC patient cohort extracted from the TCGA database, we screened differentially expressed lncRNAs under different clinical features and constructed an lncRNA-related ceRNA network. Our study suggests that some lncRNAs are associated with chRCC progression and prognosis, and they may function as ceRNAs in a complex ceRNA network.
Acknowledgments
We thank The Cancer Genome Atlas (TCGA) project for providing data. Support for the study was provided by the National Natural Science Foundation of China (No 31571443 to QY), the Jilin Provincial Science and Technology Department (Nos 20140414031GH and 20150101121JC to QY), and the Health and Family Planning Commission of Jilin Province (No 2014Z068 to QY).
Disclosure
The authors report no conflicts of interest in this work.
References
Znaor A, Lortet-Tieulent J, Laversanne M, Jemal A, Bray F. International variations and trends in renal cell carcinoma incidence and mortality. Eur Urol. 2015;67(3):519–530. | ||
Siegel RL, Miller KD, Jemal A. Cancer statistics, 2015. CA Cancer J Clin. 2015;65(1):5–29. | ||
Lipworth L, Morgans AK, Edwards TL, et al. Renal cell cancer histological subtype distribution differs by race and sex. BJU Int. 2016;117(2):260–265. | ||
Capitanio U, Montorsi F. Renal cancer. Lancet. 2016;387(10021):894–906. | ||
Bhartiya D, Scaria V. Genomic variations in non-coding RNAs: structure, function and regulation. Genomics. 2016;107(2–3):59–68. | ||
Fatica A, Bozzoni I. Long non-coding RNAs: new players in cell differentiation and development. Nat Rev Genet. 2014;15(1):7–21. | ||
Shi X, Sun M, Liu H, Yao Y, Song Y. Long non-coding RNAs: a new frontier in the study of human diseases. Cancer Lett. 2013;339(2):159–166. | ||
Salmena L, Poliseno L, Tay Y, Kats L, Pandolfi PP. A ceRNA hypothesis: the Rosetta Stone of a hidden RNA language? Cell. 2011;146(3):353–358. | ||
Yang C, Wu D, Gao L, et al. Competing endogenous RNA networks in human cancer: hypothesis, validation, and perspectives. Oncotarget. 2016;7(12):13479–13490. | ||
Huarte M. The emerging role of lncRNAs in cancer. Nat Med. 2015;21(11):1253–1261. | ||
Li T, Mo X, Fu L, Xiao B, Guo J. Molecular mechanisms of long noncoding RNAs on gastric cancer. Oncotarget. 2016;7(8):8601–8612. | ||
Zhang HM, Yang FQ, Chen SJ, Che J, Zheng JH. Upregulation of long non-coding RNA MALAT1 correlates with tumor progression and poor prognosis in clear cell renal cell carcinoma. Tumour Biol. 2015;36(4):2947–2955. | ||
Xiao H, Tang K, Liu P, et al. LncRNA MALAT1 functions as a competing endogenous RNA to regulate ZEB2 expression by sponging miR-200s in clear cell kidney carcinoma. Oncotarget. 2015;6(35):38005–38015. | ||
Hirata H, Hinoda Y, Shahryari V, et al. Long noncoding RNA MALAT1 promotes aggressive renal cell carcinoma through Ezh2 and Interacts with miR-205. Cancer Res. 2015;75(7):1322–1331. | ||
Pei CS, Wu HY, Fan FT, Wu Y, Shen CS, Pan LQ. Influence of curcumin on HOTAIR-mediated migration of human renal cell carcinoma cells. Asian Pac J Cancer Prev. 2014;15(10):4239–4243. | ||
Zhao Y, Simon R. BRB-ArrayTools data archive for human cancer gene expression: a unique and efficient data sharing resource. Cancer Inform. 2008;6:9–15. | ||
Li JH, Liu S, Zhou H, Qu LH, Yang JH. starBase v2.0: decoding miRNA-ceRNA, miRNA-ncRNA and protein-RNA interaction networks from large-scale CLIP-Seq data. Nucleic Acids Res. 2014;42(Database issue):D92–D97. | ||
Jeggari A, Marks DS, Larsson E. miRcode: a map of putative microRNA target sites in the long non-coding transcriptome. Bioinformatics. 2012;28(15):2062–2063. | ||
Hsu SD, Tseng YT, Shrestha S, et al. miRTarBase update 2014: an information resource for experimentally validated miRNA-target interactions. Nucleic Acids Res. 2014;42(Database issue):D78–D85. | ||
Reshef DN, Reshef YA, Finucane HK, et al. Detecting novel associations in large data sets. Science. 2011;334(6062):1518–1524. | ||
Shannon P, Markiel A, Ozier O, et al. Cytoscape: a software environment for integrated models of biomolecular interaction networks. Genome Res. 2003;13(11):2498–2504. | ||
Huang da W, Sherman BT, Lempicki RA. Systematic and integrative analysis of large gene lists using DAVID bioinformatics resources. Nat Protoc. 2009;4(1):44–57. | ||
MacLennan S, Imamura M, Lapitan MC, et al. Systematic review of perioperative and quality-of-life outcomes following surgical management of localised renal cancer. Eur Urol. 2012;62(6):1097–1117. | ||
Hung T, Chang HY. Long noncoding RNA in genome regulation: prospects and mechanisms. RNA Biol. 2010;7(5):582–585. | ||
Martens-Uzunova ES, Bottcher R, Croce CM, Jenster G, Visakorpi T, Calin GA. Long noncoding RNA in prostate, bladder, and kidney cancer. Eur Urol. 2014;65(6):1140–1151. | ||
Song S, Wu Z, Wang C, et al. RCCRT1 is correlated with prognosis and promotes cell migration and invasion in renal cell carcinoma. Urology. 2014;84(3):730.e731–e737. | ||
Wang M, Huang T, Luo G, et al. Long non-coding RNA MEG3 induces renal cell carcinoma cells apoptosis by activating the mitochondrial pathway. J Huazhong Univ Sci Technolog Med Sci. 2015;35(4):541–545. | ||
Guo J, Jing R, Lv X, et al. H2A/K pseudogene mutation may promote cell proliferation. Mutat Res. 2016;787:32–42. | ||
Zhang HM, Yang FQ, Yan Y, Che JP, Zheng JH. High expression of long non-coding RNA SPRY4-IT1 predicts poor prognosis of clear cell renal cell carcinoma. Int J Clin Exp Pathol. 2014;7(9):5801–5809. | ||
Xia T, Liao Q, Jiang X, et al. Long noncoding RNA associated-competing endogenous RNAs in gastric cancer. Sci Rep. 2014;4:6088. | ||
Zhou M, Wang X, Shi H, et al. Characterization of long non-coding RNA-associated ceRNA network to reveal potential prognostic lncRNA biomarkers in human ovarian cancer. Oncotarget. 2016;7(11):12598–12611. | ||
Zhang J, Fan D, Jian Z, Chen GG, Lai PB. Cancer specific long noncoding RNAs show differential expression patterns and competing endogenous RNA potential in hepatocellular carcinoma. PLoS One. 2015;10(10):e0141042. | ||
Kotake Y, Nakagawa T, Kitagawa K, et al. Long non-coding RNA ANRIL is required for the PRC2 recruitment to and silencing of p15(INK4B) tumor suppressor gene. Oncogene. 2011;30(16):1956–1962. | ||
Zhang EB, Kong R, Yin DD, et al. Long noncoding RNA ANRIL indicates a poor prognosis of gastric cancer and promotes tumor growth by epigenetically silencing of miR-99a/miR-449a. Oncotarget. 2014;5(8):2276–2292. | ||
Li CY, Liang GY, Yao WZ, et al. Integrated analysis of long non-coding RNA competing interactions reveals the potential role in progression of human gastric cancer. Int J Oncol. 2016;48(5):1965–1976. | ||
He X, Liu Z, Su J, et al. Low expression of long noncoding RNA CASC2 indicates a poor prognosis and regulates cell proliferation in non-small cell lung cancer. Tumour Biol. 2016;37(7):9503–9510. | ||
Chaudhry MA. Expression pattern of small nucleolar RNA host genes and long non-coding RNA in X-rays-treated lymphoblastoid cells. Int J Mol Sci. 2013;14(5):9099–9110. | ||
Maglott D, Ostell J, Pruitt KD, Tatusova T. Entrez Gene: gene-centered information at NCBI. Nucleic Acids Res. 2007;35:D26–D31. |
 © 2016 The Author(s). This work is published and licensed by Dove Medical Press Limited. The
full terms of this license are available at https://www.dovepress.com/terms
and incorporate the Creative Commons Attribution
- Non Commercial (unported, 3.0) License.
By accessing the work you hereby accept the Terms. Non-commercial uses of the work are permitted
without any further permission from Dove Medical Press Limited, provided the work is properly
attributed. For permission for commercial use of this work, please see paragraphs 4.2 and 5 of our Terms.
© 2016 The Author(s). This work is published and licensed by Dove Medical Press Limited. The
full terms of this license are available at https://www.dovepress.com/terms
and incorporate the Creative Commons Attribution
- Non Commercial (unported, 3.0) License.
By accessing the work you hereby accept the Terms. Non-commercial uses of the work are permitted
without any further permission from Dove Medical Press Limited, provided the work is properly
attributed. For permission for commercial use of this work, please see paragraphs 4.2 and 5 of our Terms.