Back to Journals » International Journal of General Medicine » Volume 14
Biological Function and Clinical Value of VPS13A in Pan-Cancer Based on Bioinformatics Analysis
Received 20 July 2021
Accepted for publication 6 October 2021
Published 16 October 2021 Volume 2021:14 Pages 6825—6838
DOI https://doi.org/10.2147/IJGM.S330256
Checked for plagiarism Yes
Review by Single anonymous peer review
Peer reviewer comments 2
Editor who approved publication: Dr Scott Fraser
Xue Qin Zhang,1,2,* Li Li1,*,2
1Department of Gynecology and Oncology, Guangxi Medical University Cancer Hospital, Nanning, Guangxi, People’s Republic of China; 2Key Laboratory of Early Prevention and Treatment for Regional High Frequency Tumor, Ministry of Education, Nanning, Guangxi, People’s Republic of China
*These authors contributed equally to this work
Correspondence: Li Li
Department of Gynecology and Oncology, Guangxi Medical University Cancer Hospital, Nanning, Guangxi, 530021, People’s Republic of China
Tel +86 13878113406
Email [email protected]
Purpose: Vacuolar protein sorting-associated protein 13A (VPS13A) has been shown to be associated with rhabdomyosarcoma, gastric cancer and ovarian cancer, but the pan cancer analysis of VPS13A is still lacking, and the bioinformatics function of VPS13A has not been studied yet.
Methods: We used TCGA and GEO databases to investigate the distribution, expression and prognosis of VPS13A in 33 tumors for the first time. We used TIMER2, ULCAN databases to obtain the expression differences of VPS13A in tumor tissues and corresponding normal tissues, and further obtain the gene expression in different pathological stages of tumors from the GEPIA database. Mutation types and survival analysis of VPS13A were obtained from cBioPortal database. The relationship between VPS13A and immune infiltration was explored using TIMER2. We used the String website to obtain VPS13A binding proteins and draw the protein–protein interaction network map. JVENN was used for cross analysis, and Kyoto Encyclopedia of Genes and Genomes (KEGG) and Gene Ontology (GO) were used for gene enrichment analysis.
Results: VPS13A is highly expressed in most tumors, and gene expression is associated with prognosis in patients with tumors. The expression level of VPS13A was correlated with the infiltration depth of CD8+T cells in DLBC, LUAD, SKCM and TGCT, and was correlated with carcinoma-associated fibroblasts in BRCA, CESC, LIHC and THYM. Compared with normal tissue, VPS13A methylation levels were higher in some primary tumors. KEGG gene enrichment indicates that VPS13A is involved in RNA degradation, autophagy, cell senescence, cell cycle, apoptosis and other pathways.
Conclusion: VPS13A is closely related to the occurrence and progression of tumors and can be used as a biomarker for tumor screening and diagnosis. The level of VPS13A expression and the presence of mutations affect the prognosis of patients with certain cancers, which can be determined by early genetic testing.
Keywords: VPS13A, biological function, cancer, diagnosis, prognosis
Introduction
Given the complexity of tumor genesis and progression, it is important to analyze the expression of related genes and evaluate their correlation with clinical prognosis and potential molecular mechanisms. The TCGA (The Cancer Genome Atlas) and GEO (Gene Expression Omnibus) databases contain different tumor functional genomics datasets so that we can perform pan-cancer analysis.1,2 Vacuolar protein sorting 13 homolog A (VPS13A) located at chr9:77177353–77421541 (GRCh38). The protein encoded by this gene controls the steps of protein circulation from the trans-Golgi network to the endosome, lysosome and plasma membrane.3 Mutations in this gene cause an autosomal recessive disease known as chorea-acanthosis. Selective splicing of this gene can lead to multiple transcriptional variations.4
Studies have shown that VPS13A is associated with rhabdomyosarcoma, gastric cancer, and ovarian cancer.5,6 We summarized the distribution relationship between VPS13A and various tumors in the TCGA database, as shown in Figure 1A. In this study, for the first time, we used the TCGA project and GEO database to conduct VPS13A pan-cancer analysis (including gene expression, survival status, DNA methylation, gene mutations, immune osmosis and related cellular pathways), which can further understand the biological function of VPS13A in ubiquitin-cancer and its value in clinical diagnosis and prognosis of cancer patients.
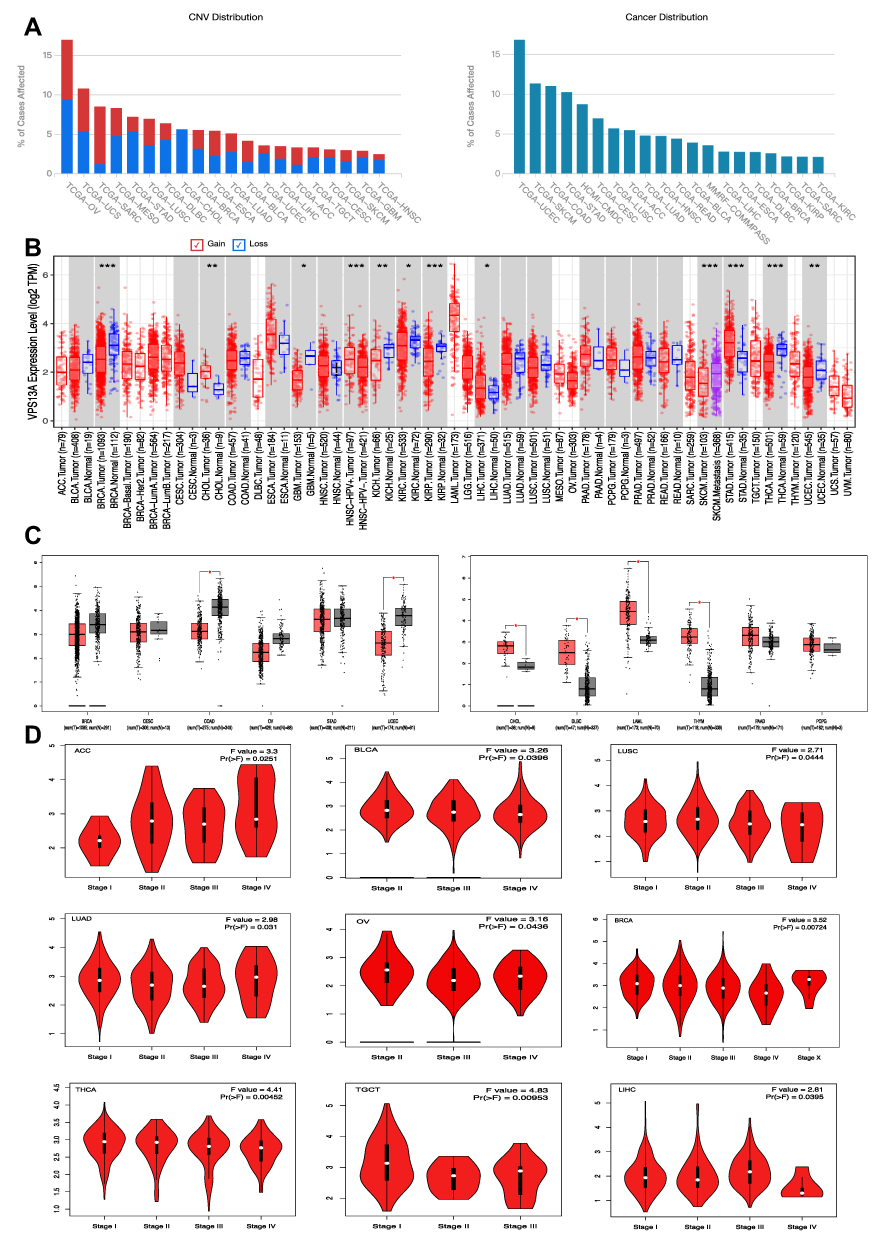 |
Figure 1 The expression of VPS13A differed in different tumors and normal tissues. (A) The distribution relationship between VPS13A and various tumors in the TCGA database; (B) The expression differences of VPS13A in different tumors and normal tissues from TIMER2 database; (C) VPS13A was highly expressed in CHOL, DLBC, LAML and THYM tumors, Low expression in COAD and UCEC tumors; (D) The correlation between VPS13A expression and different tumor Pathological stages. Notes: The statistical significance computed by the Wilcoxon test is annotated by the number of stars (*p-value < 0.05; **p-value <0.01; ***p-value <0.001). |
Materials and Methods
Gene Expression Analysis
In Tumor Immune Estimation Resource version 2 (TIMER2, http://timer.cistrome.org/) “Gene_DE” module, VPS13A was input to observe the difference in gene expression between tumor and adjacent normal tissue in different tumor or specific tumor subtype of TCGA project, gray columns indicate normal data are available.7 Some tumors do not have normal tissue or are highly restricted to normal tissues, such as adrenal cortical carcinoma (ACC), T diffuse large B-cell lymphoma (DLBC), acute myeloid leukemia(LAML), serous cystadenocarcinoma of the ovary (OV), thymic carcinoma (THYM), and so on.
We use the “analysis-box” module of Gene Expression Profiling Interactive Analysis Version 2 website (GEPIA2, http://gepia2.cancer-pku.cn/) to obtain a box map of tumor Tissue and corresponding normal Tissue Expression differences in the Genotype-Tissue Expression (GTEX) database.8 Set p value cutoff = 0.01, log2FC (fold change) cutoff = 1, “Match TCGA normal and GTEx data”. In addition, through the ”Pathological Stage Plot” module of GEPIA2, we obtained the violin plots of VPS13A expression in all TCGA tumors at different Pathological stages (Stage I, II, III and IV).9 The log2 [TPM (Transcripts per million) +1] transformed expression data were applied for the box or violin plots.
Protein Expression and DNA Methylation Analysis
UALCAN website (http://ualcan.path.uab.edu/analysis-prot.html), an interactive web resource for analyzing cancer Omics data,10 allowed us to perform protein expression analysis on the Clinical Proteomics Consortium for Cancer Analysis (CPTAC) dataset.11 In this study, we input “VPS13A” and selected available datasets of six kinds of tumors, to investigate the expression level of total protein of VPS13A in primary tumor and normal tissue, respectively. The z-value represents the standard deviation of the median sample for different cancer types.
DNA methylation in primary tumors and normal tissues was analyzed in the TCGA dataset on the UALCAN website,12 Input “VPS13A”, select available datasets of 11 kinds of tumors: infiltrating breast cancer, cervical squamous cell cancer, adenocarcinoma, cholangiocarcinoma, colorectal adenocarcinoma, esophageal cancer, squamous cell carcinoma of head and neck, clear cell carcinoma of kidney, hepatocellular carcinoma, lung adenocarcinoma, pancreatic cancer, and endometrial cancer. Beta values indicate that DNA methylation levels go from 0(unmethylated) to 1(fully methylated), [Beta-value: 0.7–0.5] for hypermethylation, and [Beta-value: 0.3–0.25] for hypomethylation. P < 0.05 indicated a statistically significant difference in DNA methylation between the primary tumor and normal tissue.
Analysis of Survival Prognosis
We used the “Survival Map” module of GEPIA2 to obtain the OS (overall survival) and DFS (disease-free survival) significance map data of VPS13A in all TCGA tumors.13 The threshold value of cutoff (50%) was used as the expression threshold to separate the high expression and low-expression queues. In the survival analysis module, the significance level was set to 0.05, and the log-rank hypothesis test was used to obtain the survival curve, in which P < 0.05 suggested that the difference in gene expression was related to the prognosis of patients.
Analysis of Genetic Changes
We use cBioPortal website (https://www.cbioportal.org/),14–16 in the “Quick select” part chose “TCGA Pan Cancer Atlas Studies”, Enter “VPS13A” to query the genetic alteration characteristics of VPS13A. Change frequency, mutation type and copy number variation (CNV) of all TCGA tumors can be observed in the “Cancer Types Summary” module. The mutation site information on VPS13A can be displayed in the schematic map of protein structure or three-dimensional structure through the “Mutations” module. We also used the “Comparison/Survival” module to obtain data on the difference in overall, disease-free, progression-free, and disease-free survival of TCGA cancer cases with and without VPS13A gene alteration. Kaplan–Meier graphs with log-rank and p-value are also generated.
Immune Infiltration Analysis
We used the “Immune Genes” module of the TIMER2 Web server to explore the relationship between VPS13A expression and immune infiltration in all TCGA tumors.17 CD8+ T cells and cancer-related fibroblasts were selected, TIMER, CIBERSORT, CIBERSORT- abs, QUANTISEQ, XCELL, MCPCOUNTER and EPIC algorithms were used to test the purity Spearman rank correlation. The heat map and scatter map containing P value and partial correlation (COR) value of immune infiltration were obtained.18 COR ranges from +1 to −1 denote perfect positive to perfect negative correlations, sometimes denoted by R.
Gene Enrichment Analysis
Search the STRING website (https://string-db.org/), using a single protein name (“VPS13A”) and an organism (“homo sapiens”),19 then set the following main parameters: Minimum required interaction score [“low confidence (0.150)”], meaning of network edge meaning (“evidence-line color indicates the type of interaction evidence”), Max number of Interactors to show maximum number of interactors (“no more than 50 interactors”) and active interaction sources (“experiment”). Active interaction sources include Neighborhood in the Genome (green), Gene Fusion (purple), Co-occurrence Across Genomes (blue), Co-Expression (black), Experimental/Biochemical Data (red), Association in Curated Databases (light blue), and Co-Mentioned in PubMed Abstracts (light green).
Finally, available experimentally determined VPS13A binding proteins were obtained. We used the “similar gene” module of GEPIA2 to obtain the top 100 VPS13A-related targeted genes based on the data sets of all TCGA tumors and normal tissues.20 “Correlation Analysis” module was also applied to conduct paired Pearson gene correlation analysis of VPS13A and the selected genes, a scatter plot with log2 TPM, P value and correlation coefficient (R) was obtained. The larger the R, the higher the correlation was.21
In addition, the “Gene_Corr” module of TIMER2 was used to input VPS13A-related genes, and purity adjusted Spearman rank correlation test was selected to perform gene correlation analysis on VPS13A and the selected genes, and heat maps and scatter maps with partial correlation (COR) and p values in different tumors were obtained. The larger R was, the higher the correlation was.22
We used Jvenn, an interactive Venn graph viewer,23 to perform cross analysis to compare binding proteins and related genes. KEGG (Kyoto Encyclopedia of Genes and Genomes) pathway analysis was conducted by combining the two sets of data. Click the “Search & Color” Pathway on the “KEGG Mapper” page, and in the Color input box for the related proteins and markers, set the other parameters: Sponsorship-Specific defaults to HSA, select Include Aliases, and finally click on “Exec”. The pathways with more proteins involved were copied, and histograms were drawn using GraphPad Prism 8. Similarly, 100 Uniprots with similar genes were obtained from the UniProt website, and their colors and markers were input into the KEGG Mapper box. We upload the list of genes to David (Database for annotation, visualization, and integrated discovery) by selecting the identifier (“official”) and species (“ Homo sapiens ”) Settings. And integrated discovery), and obtained the data of functional annotation map.24,25 Go (Gene Ontology) enrichment26,27 was performed on these data, and copies of pathways with a large number of genes were involved. GraphPad Prism 8 was used to plot the histogram.
Results
Gene Expression Data Analysis
The expression differences of VPS13A in different tumors and normal tissues were obtained in TIMER2, as shown in Figure 1B. VPS13A was observed in Cholangiocarcinoma (CHOL), Lymphoid Neoplasm Diffuse Large B-cell Lymphoma (DLBC), Acute Myeloid Leukemia (LAML), Thymoma (THYM), Pancreatic cancer Adenocarcinoma (PAAD), Pheochromocytoma and Paraganglioma (PCPG) were highly expressed. VPS13A is low expressed in breast invasive carcinoma (BRCA), cervical squamous cell carcinoma and endocervical carcinoma (CESC), uterine corpus endometrial carcinoma (UCEC), ovarian serous cystadenoma (OV), stomach adenocarcinoma (STAD) and colon adenocarcinoma (COAD). The statistical significance computed by the Wilcoxon test is annotated by the number of stars (*: p-value <0.05; **: p-value <0.01; ***: p-value <0.001). The box chart of expression difference was obtained from GEPIA2 database. VPS13A was highly expressed (with high median) in CHOL, DLBC, LAML and THYM tumors, as shown in Figure 1C. Low expression (low median) in COAD and UCEC tumors, as shown in Figure 1C. The box chart * indicated P < 0.05, and the difference was statistically significant. We also used the “Pathological Stage Plot” module of GEPIA2 to observe the correlation between VPS13A expression and different tumor pathological stages.
Among them, ACC (P=0.02), BRCA (P=0.007), BLCA (P=0.03), LIHC (P=0.04), LUAD (P=0.03), LUSC (P=0.04), TGCT (P=0.01), THCA (P=0.005), OV (P=0.04), P<0.05 is correlated. Others have no correlation. The higher the pathological stages of ACC, BLCA, LUAD, LUSC and OV were, the higher the expression level of VPS13A was, presenting a positive correlation, while BRCA, LIHC, TGCT and THCA presented a negative correlation, as shown in Figure 1D.
Protein Expression and DNA Methylation Analysis
CPTAC dataset results showed that compared with normal tissues, total VPS13A protein was lower expressed in primary tissues of breast cancer (BRCA), serous cystadenocarcinoma of the ovary, endometrial carcinoma of the uterus, colon cancer, clear cell carcinoma of the kidney, and lung adenocarcinoma (LUAD), as shown in Figure 2A.
 |
Figure 2 VPS13A protein expression and DNA methylation analysis. (A) VPS13A protein was lower expressed in these tumors compared with normal tissues; (B) VPS13A showed higher methylation levels in primary tumors compared with normal tissues. |
TCGA dataset results showed DNA methylation analysis in primary tumors and normal tissues, VPS13A showed higher methylation levels in primary tumors of infiltrating breast cancer, cervical squamous cell cancer, adenocarcinoma, cholangiocarcinoma, colorectal adenocarcinoma, esophageal cancer, squamous cell carcinoma of head and neck, clear cell carcinoma of kidney, hepatocellular carcinoma, lung adenocarcinoma, pancreatic cancer, and endometrial cancer, as shown in Figure 2B.
Survival Analysis Data
We divided cancer cases into high and low-expression groups based on VPS13A expression level, mainly using the TCGA and GEO datasets to study the correlation between VPS13A expression and prognosis in different tumor patients with datasets. Kaplan-Meier mapping tool was used to analyze the survival data. The high expression of VPS13A gene was associated with longer overall survival (OS) of CHOL and KIRC (P=0.035, 0.0051, P<0.05). Low expression of VPS13A gene was associated with prolonged overall survival of ACC, LGG, LIHC and UCS (P=0.031, 0.0057, 0.027, 0.047, P<0.05), as shown in Figure 3A. The high expression of VPS13A gene was associated with prolonged disease-free survival (DFS) of TGCT and THCA (P=0.022, 0.025, P<0.05). Low expression of VPS13A gene was associated with prolonged disease-free survival of ACC, LIHC, Prad, and UCS (P=0.0017, 0.019, 0.022, 0.015, P<0.05), as shown in Figure 3B. Finally, high expression of VPS13A in ACC, LIHC and UCS was found to be correlated with poor prognosis.
 |
Figure 3 Survival analysis of VPS13A in different tumors. (A) The high expression of VPS13A gene was associated with prolonged overall survival (OS) of ACC, LGG, LIHC and UCS (P=0.031, 0.0057, 0.027, 0.047, P<0.05); (B) Low expression of VPS13A gene was associated with prolonged disease-free survival (DFS) of ACC, LIHC, Prad, and UCS (P=0.0017, 0.019, 0.022, 0.015, P<0.05). |
Analysis Data of Genetic Changes
We observed the genetic alteration of VPS13A in different tumor samples in the TCGA dataset. As shown in the Figure 4A, patients with endometrial cancer with “mutation” as the primary type had the highest frequency of VPS13A changes (>12%). VPS13A copy number deletions were present in all genetically altered mature B-cell tumors (2% of the time). Figure 4B shows the type, locus and number of cases of VPS13A gene mutation. We found that missense mutation was the main type of VPS13A gene mutation. We can observe the K3725fs *2 site and SHR-BD in the three-dimensional structure of SND1 protein. SHR-BD:SHR-binding domain of vacuolar-sorting associated protein 13 (2209–2455) PFAM, see Figure 4B. In addition, we explored the potential association between VPS13A gene alterations and clinical survival outcomes in patients with different types of cancer. In the cBioPortal website, through the analysis of 33 tumor mutations and prognosis, it was found that the mutation and non-mutation of VPS13A were not significantly associated with survival on the whole, which may be related to the low number of cases or lack of mutation data in many tumor samples. Figure 4C data showed that compared with UCEC patients without VPS13A change, UCEC patients with VPS13A change had better overall (P=0.0723), disease-free (P=0.315), progression-free (P=6.798e-3), and disease-specific (P=0.0486) survival outcomes. Compared with ACC patients with VPS13A change, ACC patients without VPS13A change had better overall (P=1.56e-8), progression-free (P=1.11e-16), and disease-specific (P=6.15e-9) survival outcomes.
 |
Figure 4 VPS13A gene mutation analysis and survival analysis. (A) The genetic alteration of VPS13A in different tumor samples in the TCGA dataset; (B) The type, locus and number of cases of VPS13A gene mutation;The three-dimensional structure of SND1 protein. (C) UCEC patients with VPS13A change had better overall compared with UCEC patients without VPS13A change; ACC patients without VPS13A change had better overall compared with ACC patients with VPS13A change; (D) The phosphorylation site and sequence information of VPS13A in the PhosphoNet database. |
Protein Phosphorylation Data Analysis
Phosphonet and qPhos databases were also used to analyze phosphorylation levels. The qPhos database result interface contains the protein number in UniProt database, the gene name, the position of phosphorylated amino acids in the protein, sequence information, sample name, sample type, experimental conditions, detection method, phosphorylation difference results and significance.28,29 qPhos database showed that under PaSC standard, TMT detection method was used to obtain the phosphorylation site and sequence information on VPS13A,30 and the difference was significant (P=0.017). The PhosphoNet database shows that VPS13A has 240 phosphorylated sites, with more phosphorylated sites at S839, as shown in Figure 4D.
Immune Infiltration Analysis Data
Tumor-infiltrating immune cells, as an important part of the tumor microenvironment, are closely related to the occurrence, progression or metastasis of tumors.31–34 It has been reported that tumor-associated fibroblasts in the tumor microenvironment stroma are involved in regulating the functions of various tumor-infiltrating immune cells.35,36
We used TIMER, CIBERSORT, CIBERSORT- abs, QUANTISEQ, XCELL, MCPCOUNTER and EPIC algorithms to investigate the potential relationship between different levels of immune cell infiltration and VPS13A gene expression in different types of TCGA cancer. Cor 0–1 is a positive correlation, which is red; Cor 0- (−1) is a negative correlation, which is blue. After a series of analyses, based on all or most of the algorithms, we found that there was a statistically positive correlation between the immune infiltration of CD8+T cells and the expression level of VPS13A in DLBC, LUAD, SKCM, TGCT and UVM metastases (Figure 5A). We observed a positive correlation between VPS13A expression and cancer-associated fibroblasts in BRCA, CESC, LIHC, and THYM, but a negative correlation in BLCA, KIRC, and TGCT (Figure 5B). According to TIDE algorithm, the expression level of VPS13A in ACC is positively correlated with the infiltration level of cancer-related fibroblasts (Cor = 0.262, P=2.49e-02), P < 0.05, and the COR > is positively correlated, which is of statistical significance, as shown in Figure 5C.
 |
Figure 5 Immune infiltration analysis. (A) The correlation between the immunoinfiltration of CD8+T cells and the expression level of VPS13A in DLBC, LUAD, SKCM, TGCT and UVM metastases; (B) The correlation between VPS13A expression and cancer-associated fibroblasts in BRCA, CESC, LIHC, and THYM, but a negative correlation in BLCA, KIRC and TGCT; (C) The expression level of VPS13A in ACC is positively correlated with the infiltration level of cancer-related fibroblasts (Cor =0.262, P=2.49e-02). |
Enrichment Analysis of VPS13A Related Complexes
In order to further study the molecular mechanism of VPS13A gene in tumor genesis, we tried to screen the targeted VPS13A binding protein and the genes related to VPS13A expression, and performed a series of pathway enrichment analysis. We used the GEPIA2 tool combined with all tumor expression data of TCGA to obtain the top 100 genes associated with VPS13A expression. Paired Pearson gene correlation analysis was conducted for VPS13A and the selected genes, and a scatter plot of correlation analysis was obtained. The larger R was, the higher the correlation was, as shown in Figure 6A. We used the Gene_Corr module of TIMER2 to provide VPS13A-related genes, and obtained heat maps and scatter maps with partial correlation (COR) and p values for different tumors, as shown in Figure 6B. Among them, GCC2 (R=0.66, P=0), ZnF518A (R=0.64, P=0), INO80D (R=0.63, P=0), NHLRC2 (R=0.63, P=0), SREK1 (R=0.62, P=0) and ZnF782 (R=0.62, P=0) were all correlated with VPS13A in different tumors, and R>0 was indicated as a positive correlation, P<0.05, which was statistically significant. Based on the STRING tool, we obtained a total of 50 binding proteins, all of which were supported by experimental evidence. Figure 6C shows a diagram of these protein network interactions. The line between nodes represents the type of interaction between two proteins, and the red represents Experimental Data. The color of protein node is different from the score value. Among them, the score between PMSA1 and PMSA4 was the highest (score=0.994), the score between ULK3 and VPS13A was the lowest (score=0.157).
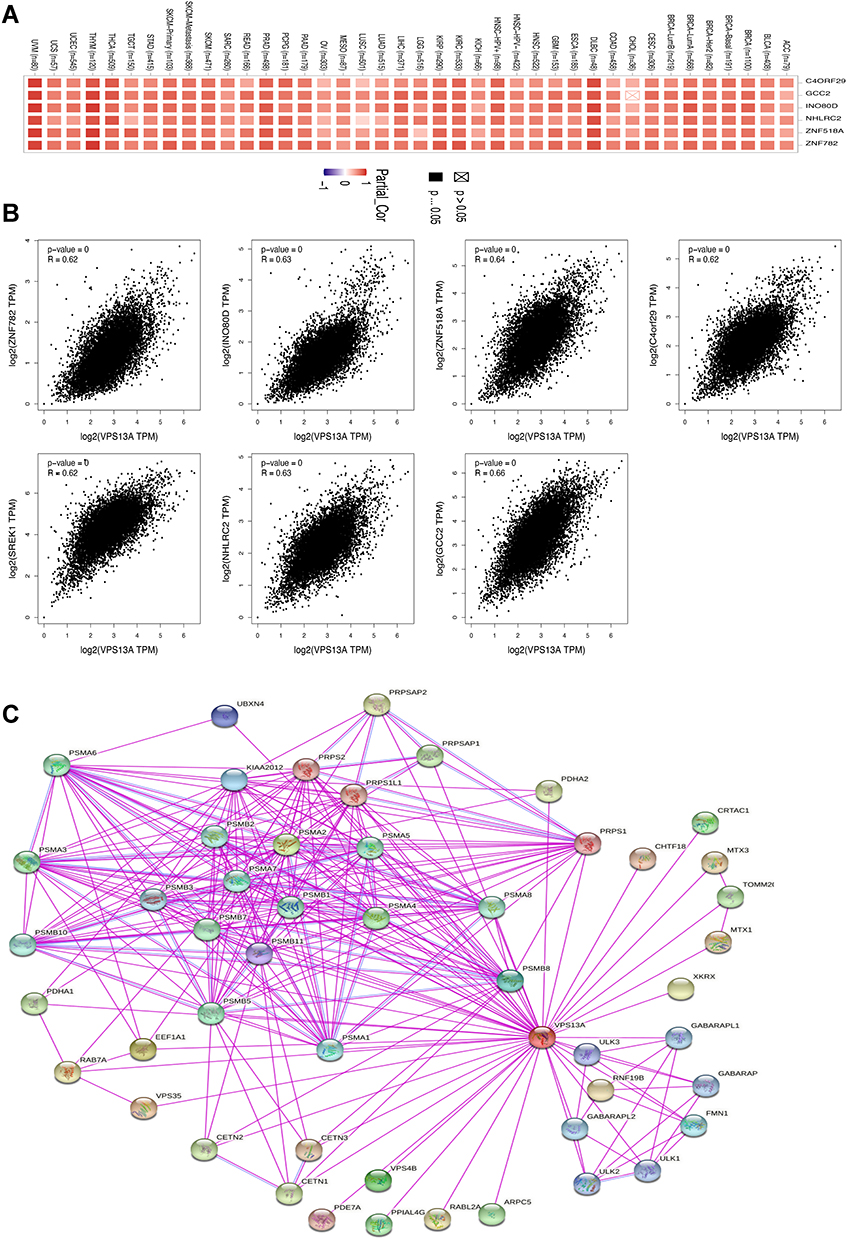 |
Figure 6 Enrichment analysis of VPS13A related complexes. (A) Scatter plot of correlation analysis was conducted for VPS13A and the selected genes; (B) The partial correlation (COR) and p values between VPS13A-related genes in different tumors; (C) Protein- Protein Interaction network. |
VPS13A Signaling Pathway Analysis
We combined the two datasets for KEGG enrichment analysis and obtained the signaling pathway diagrams of 50 VPS13A binding proteins and 100 VPS13A associated genes. RAB7A is one of the VPS13 family of acting proteins, can regulate autophagosome-lysosomal fusion and autosomal lysosomal maturation.37 In the neurodegenerative pathway and the amyotrophic lateral sclerosis pathway, protein enrichment is the largest, followed by the proteasome pathway, as shown in Figure 7A. The associated genes involved in RNA degradation, autophagy, cell senescence, cell cycle, apoptosis, TGF-β, cAMP, mTOR, Hippo, cGMP-PKG, Wnt, oxytocin, estrogen, metabolic pathway, cancer and other 66 signaling pathways. GO enrichment analysis was conducted on the annotation data of associated genes obtained by David, and it was found that these genes were related to DNA, RNA and protein synthesis, as well as DNA binding, DNA repair, cell division, protein binding and protein phosphorylation, as shown in Figure 7B. VPS13A has a wide range of effects in vivo and is very important for cell survival. Jvenn was used for cross analysis of related genes and binding proteins, and no obvious common members were found, as shown in Figure 7C.
 |
Figure 7 VPS13A signaling pathway analysis. (A) The signaling pathway diagrams of 50 VPS13A binding proteins; (B) GO enrichment analysis was conducted on the 100 VPS13A associated genes; (C) Cross analysis of related genes and binding proteins. |
Discussion
VPS13A has been shown to be associated with rhabdomyosarcoma, gastric cancer and ovarian cancer. VPS13A refers to vacuolar protein sorting-associated protein13A, which is a peripheral membrane protein located in the close contact with the endoplasmic reticulum (ER) and mitochondria (MT), and is associated with mitochondria, endoplasmic reticulum and lipid droplets. VPS13A interacts with the endoplasmic reticulum ER resident protein VAP-A through its FFAT domain and with mitochondria through its C-terminal domain.38 The protein encoded by this gene can regulate intracellular protein transport and induce autophagy by mediating protein endocytosis and lysosomal degradation. Defects in the autophagy pathway can be caused by VPS13A deficiency.39 VPS13A can regulate apoptosis by activating the Akt-PI3K pathway and increases cell survival rate.40 VPS13A can affect the morphology and function of mitochondria in cells and regulate apoptosis and autophagy, which is very important for cell survival. However, the pan-cancer analysis of VPS13A is still lacking, so for the first time, we investigated the distribution characteristics, expression and prognosis of VPS13A in 33 tumor datasets of TCGA and GEO.
In some tumors, the expression of VPS13A gene was positively correlated with the level of cancer-associated fibroblasts, indicating that VPS13A was associated with the occurrence of cancer, and the higher the pathological stage of some tumors, the higher the expression of VPS13A gene was. Chorea levels of VPS13A-expressed protein in blood samples can be clinically screened to predict the occurrence of cancer and determine the pathological stage of cancer.
The methylation level of VPS13A is higher in the cells of tumor patients, suggesting that VPS13A methylation may be one of the causes of cancer. Therefore, the level of gene methylation can be detected to screen for cancer, and gene demethylation can be used to prevent the occurrence of cancer through treatment. The expression level of VPS13A gene was correlated with the infiltration level of CD8+T cells and other immune cells, indicating that the increased expression level of VPS13A was associated with increased cancer cells and enhanced immune response. Because VPS13A is highly expressed in most tumors, it can reduce the expression level of VPS13A mRNA or protein in patients’ cells, reduce cancer-related fibroblasts, activate tumor cell apoptosis pathway, reduce autophagy level, reduce immune response, promote cell death, improve the therapeutic effect, and prolong the survival time. For some cancer patients, screening for VPS13A mutations in vivo can predict the prognosis of patients. For example, promoting VPS13A mutations in endometrial cancer cells can improve the prognosis of patients.
Conclusion
This time, we analyzed the changes of VPS13A in different tumors from the aspects of gene expression and clinical prognosis, DNA mutation, DNA methylation, protein phosphorylation, and immune cell infiltration. Most of the data were statistically significant, which helped to understand the role of VPS13A in various tumors and to observe the occurrence of tumors from the perspective of clinical tumor samples. However, the sample size of this study is insufficient, and there may be some deviation in the data. It is necessary to increase the clinical data and conduct clinical trials for further verification.
Abbreviations
ACC, adrenocortical carcinoma; BLCA, bladder urothelial carcinoma; BRCA, breast invasive carcinoma; CESC, cervical and endocervical cancer; CHOL, cholangiocarcinoma; COAD, colon adenocarcinoma; DLBC, diffuse large B-cell lymphoma; ESCA, esophageal carcinoma; GBM, glioblastoma multiforme; HNSC, head and neck cancer; KICH, kidney chromophobe; KIRC, kidney renal clear cell carcinoma; LGG, lower grade glioma; LIHC, liver hepatocellular carcinoma; LUAD, lung adenocarcinoma; LUSC, lung squamous cell carcinoma; MESO, mesothelioma; OV, ovarian serous cystadenocarcinoma; PAAD, pancreatic adenocarcinoma; PCPG, pheochromocytoma and paraganglioma; PRAD, prostate adenocarcinoma; READ, rectum adenocarcinoma; SARC, sarcoma; SKCM, skin cutaneous melanoma; STAD, stomach adenocarcinoma; TGCT, testicular germ cell tumors; THCA, thyroid carcinoma; THYM, thymoma; UCEC, uterine corpus endometrial carcinoma; UCS, uterine carcinosarcoma; UVM, uveal melanoma.
Acknowledgments
This research was completed under the guidance of my tutor Professor Li Li, which provided me with great help and support in terms of research topic selection, research ideas, statistical methods, etc. I would like to thank my tutor for his guidance and tolerance and for his suggestions on the revision of my article.
Funding
This work was supported by Project supported by the Scientific Research and Technological Development Plan of Guangxi Zhuang Autonomous Region (No. 1140003A-33).
Disclosure
The authors report no conflicts of interest in this work.
References
1. Blum A, Wang P, Zenklusen JC. SnapShot: TCGA-Analyzed Tumors. Cell. 2018;173(2):530. doi:10.1016/j.cell.2018.03.059
2. Zhang Z, Li H, Jiang S, et al. A survey and evaluation of Web-based tools/databases for variant analysis of TCGA data. Brief Bioinform. 2019;20(4):1524–1541. doi:10.1093/bib/bby023
3. Yeshaw WM, van der Zwaag M, Pinto F, et al. Human VPS13A is associated with multiple organelles and influences mitochondrial morphology and lipid droplet motility. Elife. 2019;8:e43561. doi:10.7554/eLife.43561
4. Urs AB, Augustine J, Khan AA. Chorea-acanthocytosis: a case report with review of oral manifestations. Contemp Clin Dent. 2021;12(1):73–75. doi:10.4103/ccd.ccd_207_20
5. Wu YY. Steap1 Regulation of Tumor Genesis and Chemotherapy Resistance During Peritoneal Metastasis of Gastric Cancer. Jilin University; 2019.
6. Zhang Q. Study on the reverse mechanism of LIPG/ RS9958734 multidrug resistance in ovarian cancer based on CRISPR/Cas9. Guangxi Med Univ. 2019;1:5487.
7. Xu M, Li Y, Li W, et al. Immune and Stroma Related Genes in Breast Cancer: a Comprehensive Analysis of Tumor Microenvironment Based on the Cancer Genome Atlas (TCGA) Database. Front Med. 2020;7:64. doi:10.3389/fmed.2020.00064
8. Tang Z, Kang B, Li C, Chen T, Zhang Z. GEPIA2: an enhanced web server for large-scale expression profiling and interactive analysis. Nucleic Acids Res. 2019;47(W1):W556–W560. doi:10.1093/nar/gkz430
9. He C, Hua X, Sun S, Li S, Wang J, Huang X. Integrated Bioinformatic Analysis of SARS-CoV-2 Infection Related Genes ACE2, BSG and TMPRSS2 in Aerodigestive Cancers. J Inflamm Res. 2021;14:791–802. doi:10.2147/JIR.S300127
10. Chandrashekar DS, Bashel B, Balasubramanya SAH, et al. UALCAN: a portal for facilitating tumor subgroup gene expression and survival analyses. Neoplasia. 2017;19(8):649–658. doi:10.1016/j.neo.2017.05.002
11. Thomas SN, Friedrich B, Schnaubelt M, Chan DW, Zhang H, Aebersold R. Orthogonal proteomic platforms and their implications for the stable classification of high-grade serous ovarian cancer subtypes. iScience. 2020;23(6):101079. doi:10.1016/j.isci.2020.101079
12. Yang J, Li H, Hu S, Zhou Y. ACE2 correlated with immune infiltration serves as a prognostic biomarker in endometrial carcinoma and renal papillary cell carcinoma: implication for COVID-19. Aging. 2020;12(8):6518–6535. doi:10.18632/aging.103100
13. Guo L, Li X, Liu R, Chen Y, Ren C, Du S. TOX correlates with prognosis, immune infiltration, and T cells exhaustion in lung adenocarcinoma. Cancer Med. 2020;9(18):6694–6709. doi:10.1002/cam4.3324
14. Wu P, Heins ZJ, Muller JT, et al. Integration and Analysis of CPTAC Proteomics Data in the Context of Cancer Genomics in the cBioPortal. Mol Cell Proteomics. 2019;18(9):1893–1898. doi:10.1074/mcp
15. Unberath P, Knell C, Prokosch HU, Christoph J. Developing new analysis functions for a translational research platform: extending the cbioportal for cancer genomics. Stud Health Technol Inform. 2019;258:46–50.
16. Ou Q, Yu Y, Li A, et al. Association of survival and genomic mutation signature with immunotherapy in patients with hepatocellular carcinoma. Ann Transl Med. 2020;8(5):230. doi:10.21037/atm.2020.01.32
17. Li T, Fu J, Zeng Z, et al. TIMER2.0 for analysis of tumor-infiltrating immune cells. Nucleic Acids Res. 2020;48(W1):W509–W514. doi:10.1093/nar/gkaa407
18. Xu ZY, Zhao M, Chen W, et al. Analysis of prognostic genes in the tumor microenvironment of lung adenocarcinoma. Peer J. 2020;8:e9530. doi:10.7717/peerj.9530
19. Szklarczyk D, Gable AL, Nastou KC, et al. The STRING database in 2021: customizable protein-protein networks, and functional characterization of user-uploaded gene/measurement sets. Nucleic Acids Res. 2021;49(D1):D605–D612. doi:10.1093/nar/gkaa1074
20. Gui Y, Liu X, Wang C, Overexpressing YP. PTTG family genes predict poor prognosis in kidney renal clear cell carcinoma. World J Surg Oncol. 2021;19(1):111. doi:10.1186/s12957-021-02225-2
21. Zheng R, Zhu HL, Hu BR, Ruan XJ, Cai HJ. Identification of APEX2 as an oncogene in liver cancer. World J Clin Cases. 2020;8(14):2917–2929. doi:10.12998/wjcc.v8.i14.2917
22. Li L, Li Y, Guo Y, Li J, Jin H. Potential roles of PBRM1 on immune infiltration in cholangiocarcinoma. Int J Clin Exp Pathol. 2020;13(10):2661–2676.
23. Cho J, Gao S, Stein L, Sternberg PW. Vennter - An interactive analysis tool for WormBase interaction data using Venn diagrams. MicroPubl Biol. 2020;2020. doi:10.17912/micropub.biology.000258
24. Kanehisa M, Sato Y. KEGG Mapper for inferring cellular functions from protein sequences. Protein Sci. 2020;29(1):28–35. doi:10.1002/pro.3711
25. Liang Y, Zhang C, Dai DQ. Identification of differentially expressed genes regulated by methylation in colon cancer based on bioinformatics analysis. World J Gastroenterol. 2019;25(26):3392–3407. doi:10.3748/wjg.v25.i26.3392
26. Liu S, Xie X, Lei H, Zou B, Xie L. Identification of Key circRNAs/lncRNAs/miRNAs/mRNAs and Pathways in Preeclampsia Using Bioinformatics Analysis. Med Sci Monit. 2019;25:1679–1693. doi:10.12659/MSM.912801
27. Sepulveda JL. Using R and Bioconductor in Clinical Genomics and Transcriptomics. J Mol Diagn. 2020;22(1):3–20. doi:10.1016/j.jmoldx.2019.08.006
28. Huang S, Zheng F, Liu L, et al. Integrated proteome and phosphoproteome analyses of peripheral blood mononuclear cells in primary Sjögren syndrome patients. Aging. 2020;13(1):1071–1095. doi:10.18632/aging.202233
29. Yu K, Zhang Q, Liu Z, et al. qPhos: a database of protein phosphorylation dynamics in humans. Nucleic Acids Res. 2019;47(D1):D451–D458. doi:10.1093/nar/gky1052
30. Paulo JA, Gaun A, Gygi SP. Global analysis of protein expression and phosphorylation levels in nicotine-treated pancreatic stellate cells. J Proteome Res. 2015;14(10):4246–4256. doi:10.1021/acs.jproteome.5b00398
31. Arneth B. Tumor Microenvironment. Medicina. 2019;56(1):15. doi:10.3390/medicina56010015
32. Hinshaw DC, Shevde LA. The Tumor Microenvironment Innately Modulates Cancer Progression. Cancer Res. 2019;79(18):4557–4566. doi:10.1158/0008-5472.CAN-18-3962
33. RRibeiro Franco PI, Rodrigues AP, de Menezes LB, Pacheco Miguel M. Tumor microenvironment components: allies of cancer progression. Pathol Res Pract. 2020;216(1):152729. doi:10.1016/j.prp.2019.152729
34. Wang SS, Liu W, Ly D, Xu H, Qu L, Tumor-infiltrating ZL. B cells: their role and application in anti-tumor immunity in lung cancer. Cell Mol Immunol. 2019;16(1):6–18. doi:10.1038/s41423-018-0027-x
35. Marta T, Luca S, Fabio C. Fibroblasts in the Tumor Microenvironment. Adv Exp Med Biol. 2020;1234:15–29.
36. Truffi M, Sorrentino L, Corsi F. Fibroblasts in the Tumor Microenvironment. Adv Exp Med Biol. 2020;1234:15–29. doi:10.1007/978-3-030-37184-5_2
37. Tan EHN, Tang BL. Rab7a and Mitophagosome Formation. Cells. 2019;8(3):224. doi:10.3390/cells8030224
38. Yeshaw WM, van der Zwaag M, Pinto F, et al. Human VPS13A is associated with multiple organelles and influences mitochondrial morphology and lipid droplet motility. Elife. 2019;8:e4356. doi:10.7554/eLife.43561
39. Muñoz-Braceras S, Tornero-écija AR, Vincent O, Escalante R. VPS13A is closely associated with mitochondria and is required for efficient lysosomal degradation. Dis Model Mech. 2019;12(2):dmm036681. doi:10.1242/dmm.036681
40. Lang Lang F, Pelzl L, Schöls L, et al. Neurons, Erythrocytes and Beyond -The Diverse Functions of Chorein. Neurosignals. 2017;25(1):117–126. doi:10.1159/000485457
 © 2021 The Author(s). This work is published and licensed by Dove Medical Press Limited. The
full terms of this license are available at https://www.dovepress.com/terms
and incorporate the Creative Commons Attribution
- Non Commercial (unported, 3.0) License.
By accessing the work you hereby accept the Terms. Non-commercial uses of the work are permitted
without any further permission from Dove Medical Press Limited, provided the work is properly
attributed. For permission for commercial use of this work, please see paragraphs 4.2 and 5 of our Terms.
© 2021 The Author(s). This work is published and licensed by Dove Medical Press Limited. The
full terms of this license are available at https://www.dovepress.com/terms
and incorporate the Creative Commons Attribution
- Non Commercial (unported, 3.0) License.
By accessing the work you hereby accept the Terms. Non-commercial uses of the work are permitted
without any further permission from Dove Medical Press Limited, provided the work is properly
attributed. For permission for commercial use of this work, please see paragraphs 4.2 and 5 of our Terms.