")
Back to Journals » Journal of Inflammation Research » Volume 16
Bioinformatics Prediction and Experimental Validation of the Role of Macrophage Polarization and Ferroptosis in Gestational Diabetes Mellitus
Received 20 September 2023
Accepted for publication 3 December 2023
Published 12 December 2023 Volume 2023:16 Pages 6087—6105
DOI https://doi.org/10.2147/JIR.S440826
Checked for plagiarism Yes
Review by Single anonymous peer review
Peer reviewer comments 2
Editor who approved publication: Dr Tara Strutt
Chujun Chen, Zerui Yang, Zhikun Qiu
Key Specialty of Clinical Pharmacy, The First Affiliated Hospital of Guangdong Pharmaceutical University, Guangzhou, 510080, People’s Republic of China
Correspondence: Zhikun Qiu, Email [email protected]
Purpose: Gestational diabetes mellitus (GDM) is a common metabolic disorder during pregnancy that is associated with placental inflammation and adverse pregnancy outcomes. However, the mechanisms of inflammation in GDM are still unclear.
Methods: Bulk transcriptome, single-cell transcriptome, clinical information, and samples were collected from GSE154414, GSE70493, GSE173193 and a retrospective cohort. Bioinformatics prediction was used to explore the mechanisms of placental inflammation, and multiplex immunofluorescence was used to validate the results.
Results: First, we found that GDM is characterized by low-grade inflammation and is linked to several adverse pregnancy outcomes, as supported by our collected clinical data. Additionally, we identified ten hub genes (FCGR3B, CXCR1, MMP9, ITGAX, CCL5, GZMB, S100A8, LCN2, TGFB1, and LTF) as potential therapy targets and confirmed the binding of corresponding predictive therapeutic agents by molecular docking. Transcriptome sequencing analysis has shown that macrophages are primarily responsible for the emergence of placental inflammation, and that M1 macrophage polarization increased while M2 macrophage polarization decreased in GDM when compared to the control sample. Multiplex immunofluorescence staining of CD68, CD80, and ACSL4 was performed and suggested that ferroptosis of macrophages may contribute to placental inflammation in GDM.
Conclusion: In conclusion, our findings provide a better understanding of the mechanisms of inflammation in GDM and suggest potential therapeutic targets for this condition.
Keywords: gestational diabetes mellitus, placental inflammation, macrophage, therapy targets, ferroptosis
Graphical Abstract:
Introduction
Gestational diabetes mellitus (GDM) is a common pregnancy complication with increasing prevalence, significantly impacting maternal and infant morbidity and mortality.1,2 It is defined as glucose intolerance with onset or recognition during pregnancy and is characterized by a low-grade inflammatory response.3 Placental tissue can secrete inflammatory cytokines involved in inflammatory responses, and placental inflammation has been observed in GDM, which affects the fetal environment.4 However, the mechanisms of placental inflammation in GDM remain unclear.
Macrophages, as integral components of innate immunity, are involved in potentially pathological inflammatory processes,5 and previous studies have shown associations between macrophages and GDM.6–9 However, the polarization state of macrophages in GDM remains inconsistent, and their role in the development of placental inflammation is still controversial. It is also unclear whether cell-cell communication between macrophages and other cell types in the placenta of GDM can affect the occurrence of placental inflammation.
Programmed cell death (PCD) is a crucial biological process, and its disrupted regulation is implicated in the pathogenesis of diverse diseases.10 Up to now, there have been more than ten cell death modalities described, including ferroptosis, apoptosis, cuproptosis, necroptosis, alkaliptosis, oxeiptosis, pyroptosis, entotic cell death, parthanatos, netotic cell death, lysosome-dependent cell death, and autophagy-dependent cell death.11,12 Cell death has been found to be associated with placental disorders, including GDM and preeclampsia.13 Ferroptosis is a newly identified form of PCD that is distinguished by iron-dependent lipid peroxidation and subsequent membrane damage. This process has been shown to play a critical role in various physiological and pathological conditions, particularly in the context of inflammation.14 Recently, there has been emerging evidence supporting the involvement of ferroptosis in patients with gestational diabetes mellitus (GDM) and the possible modulatory roles of ferroptosis-related genes in the molecular mechanisms of GDM.15 Yifang Zheng et al found that correcting the imbalance of fatty acid oxidation/peroxide-induced ferroptosis could ameliorate placental injury in GDM.16 Studies have also suggested that targeting ferroptosis may be a potential therapeutic approach for treating GDM.17
Bioinformatics prediction involves using computational algorithms and tools to analyze biological data and make predictions about various biological phenomena. Experimental validation, on the other hand, involves conducting laboratory experiments to test and validate the predictions made by bioinformatics methods. In this study, we hypothesized that macrophage polarization and ferroptosis may contribute to the occurrence and development of placental inflammation in GDM and investigated this through bioinformatics analysis and experimental verification. We thereby determined the role of macrophages in placental inflammation in GDM. Our findings provide new insight into macrophages as potential therapeutic targets in GDM.
Materials and Methods
Data Download and Processing
Single-Cell RNA Sequencing Data: The single-cell RNA sequencing dataset (GSE173193)18 was obtained from the Gene Expression Omnibus (GEO) database (https://www.ncbi.nlm.nih.gov/geo/). The dataset consisted of two GDM and two normal (control) placenta samples. Downstream analysis, including principal component analysis (PCA) and t-distributed stochastic neighbor embedding (t-SNE) analysis, was performed using the Seurat R package.19 Cells with fewer than 300 genes, more than 7500 genes, or more than 10% mitochondrial genes were filtered out. After filtering, a total of 23,769 cells were used for further analysis. To remove batch effects and combine the four scRNA-seq data sets, the Harmony R package was employed.20 The Seurat “FindMarkers” function, which uses a Wilcoxon rank sum test, was used to identify differentially expressed genes (adjusted p-value <0.05 and |log fold change| >0.25).
Bulk Sequencing Data: Gene expression data and clinical data from the RNA sequencing dataset (GSE154414) and RNA microarray dataset (GSE70493)21 were downloaded from the GEO database. The bulk RNA sequencing dataset GSE154414 consisted of 4 GDM patients and 4 control individuals. The RNA microarray dataset GSE70493 consisted of 32 GDM patients and 31 control individuals. Differentially expressed genes (DEGs) were identified using the limma R package,22 where genes (|log fold change| > 0.58 and p-value < 0.05) were considered significant DEGs.
Pathway Enrichment Analysis
The clusterProfiler R package23 was used for Gene Ontology (GO), Kyoto Encyclopedia of Genes and Genomes (KEGG) analysis, and gene set enrichment analysis (GSEA). The GSVA R package24 was used to perform gene set variation analysis (GSVA) of the Hallmark gene sets. Adjusted p value < 0.05 is considered statistically significant.
Screening Hub Genes
The STRING database25 was used to construct the protein-protein interaction (PPI) network in up-regulated DEGs (https://string-db.org/). Top 10 up-regulated hub genes were identified by Cytoscape software (version 3.8.2).
Identifying Drug Candidates and Molecular Docking
Drug signature database DSigDB tool of Enrichr (https://maayanlab.cloud/Enrichr/) was used to identify drug candidates based on hub genes. The corresponding small molecular structure (mol format) can be downloaded from the PubChem database based on the name of a small molecule. Protein structures can be obtained from the AlphaFold2 or PDB structure databases (https://www.rcsb.org/), and smina software is used for molecular docking.
Identification of TFs
Pearson correlation tests were performed to analyze the relationships between the gene expression and infiltration of M2 macrophages through the “cor.test” function in the R platform, with a P value cutoff of <0.05 and a correlation coefficient of >0.30. The “findMotifs.pl” program in “Homer” was executed to search for the TF-binding motifs of M2 macrophage-related genes in GDM.
Infiltrating Immune Cells Analysis
The IOBR R package26 was used to calculate the population of 22 infiltrating immune cell types in the human placenta based on the CIBERSORT algorithm (Perm = 1000).
Transcription Factor (TF) Activity Analysis
The TF activity of macrophages in GDM and control groups was calculated by the Dorothea R package.27 The top 30 variables TF are shown in the heatmap.
Inflammatory Response Score Analysis
Inflammatory response scores among cell clusters were calculated by the irGSEA R package (https://github.com/chuiqin/irGSEA) based on the AUCell method and Hallmark gene sets.
Intercellular Communication Analysis
Intercellular signaling communications analysis was conducted, and visualization was conducted using the CellChat R package.28 The code for CellChat is publicly available and accessible at the GitHub website (https://github.com/sqjin/CellChat).
Clinical Data and Laboratory Indicators
Clinical data and laboratory inflammation indicators from patients were collected from the First Affiliated Hospital of Guangdong Pharmaceutical University between January 2015 and August 2022 (Ethical Approval Number: 2023-KT-44). Patients were excluded if they had other systemic diseases (eg, diabetes) or had hematology. Inflammatory markers, including white blood cells (WBC), neutrophils (NEUT), lymphocytes (LYM), monocytes (MONO), and platelets (PLT), were collected; the neutrophil/lymphocyte ratio (NLR) was then calculated. Hematology was performed during pregnancy. The study complies with the ethical principles of the Helsinki Declaration.
Immunofluorescence (IF)
To perform IF staining of human placenta, we used an Opal Polaris 7 color manual IHC kit (Akoya Biosciences) according to the manufacturer’s instructions with primary antibodies against human CD68, CD80, and ACSL4. Nuclear staining was carried out using DAPI, and the sections were mounted for imaging. The images were captured using Vectra software (Akoya Biosciences), and the image analysis was performed using HALO software (Indica Labs). Briefly, CD68 + represents macrophages, and CD68 + and CD80 + represent M1 macrophages. The First Affiliated Hospital of Guangdong Pharmaceutical University supplied the clinical samples. All patients provided informed consent for the collection of samples, and this project was approved by the Institutional Review Board (Ethical Approval Number: 2023-KT-44).
Statistical Analysis
The two-sided Wilcox test, or student’s t test, was used for comparisons between two groups. Fisher’s exact tests were performed using the fisher.test function. All statistical tests were performed on the software R. The ggplot2 R package was used for data visualization. P<0.05 was considered to have statistical significance. * p < 0.05; ** p <0.01; *** p < 0.001; **** p < 0.0001; ns p >0.05.
Results
Workflow of This Study
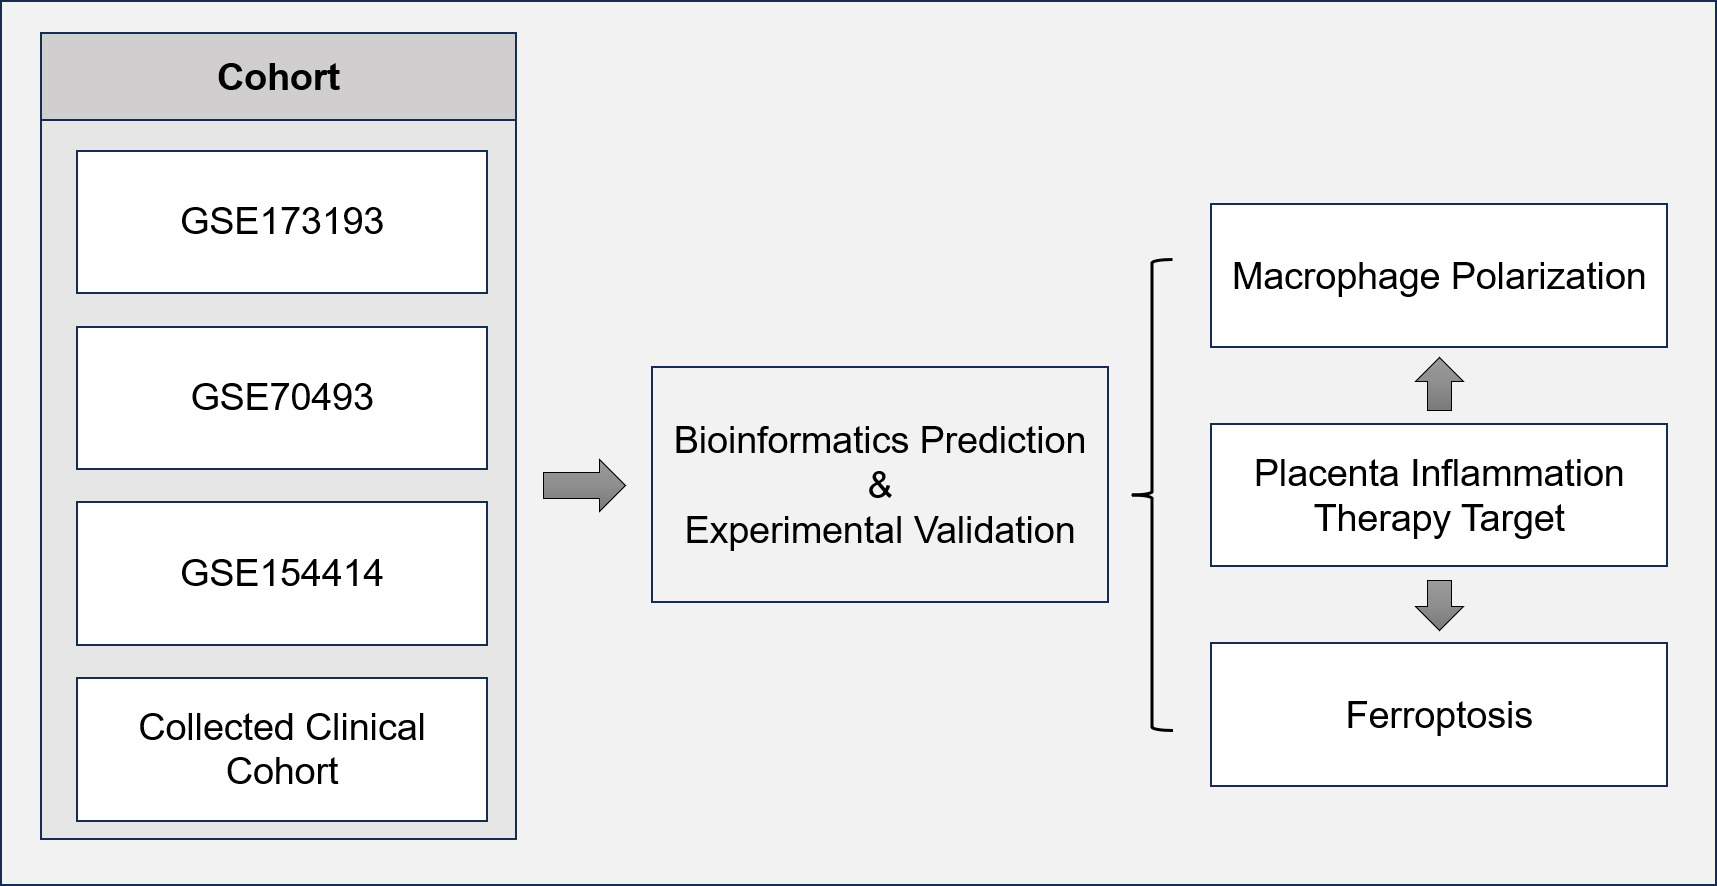
In this study, we collected bulk transcriptome, single-cell transcriptome, clinical information, and samples from publicly available datasets (GSE154414, GSE70493, and GSE173193), as well as a retrospective cohort. We utilized bioinformatics prediction to investigate the underlying mechanisms of placental inflammation in gestational diabetes mellitus (GDM), and the results were further validated using multiplex immunofluorescence. The overall study design and workflow are illustrated in Figure 1.
 |
Figure 1 Flowchart for comprehensive analysis of the role of macrophage in GDM. |
Inflammatory Response in GDM Patients
We analyzed a cohort of clinical data, which included two groups: control pregnant women (n = 65) and pregnant women with GDM (n = 65). The two groups were similar in terms of age and race. However, the GDM group had significantly higher levels of WBC, NEUT, MOMO, and NLR, indicating an inflammatory response compared to the control group. Of note, eight adverse pregnancy outcomes, such as fetal macrosomia, preterm birth, and delivery of a low-birth-weight infant occurred in the GDM group, while no adverse pregnancy outcomes were observed in the control group (Table 1). These findings suggest an association between GDM and an inflammatory response.
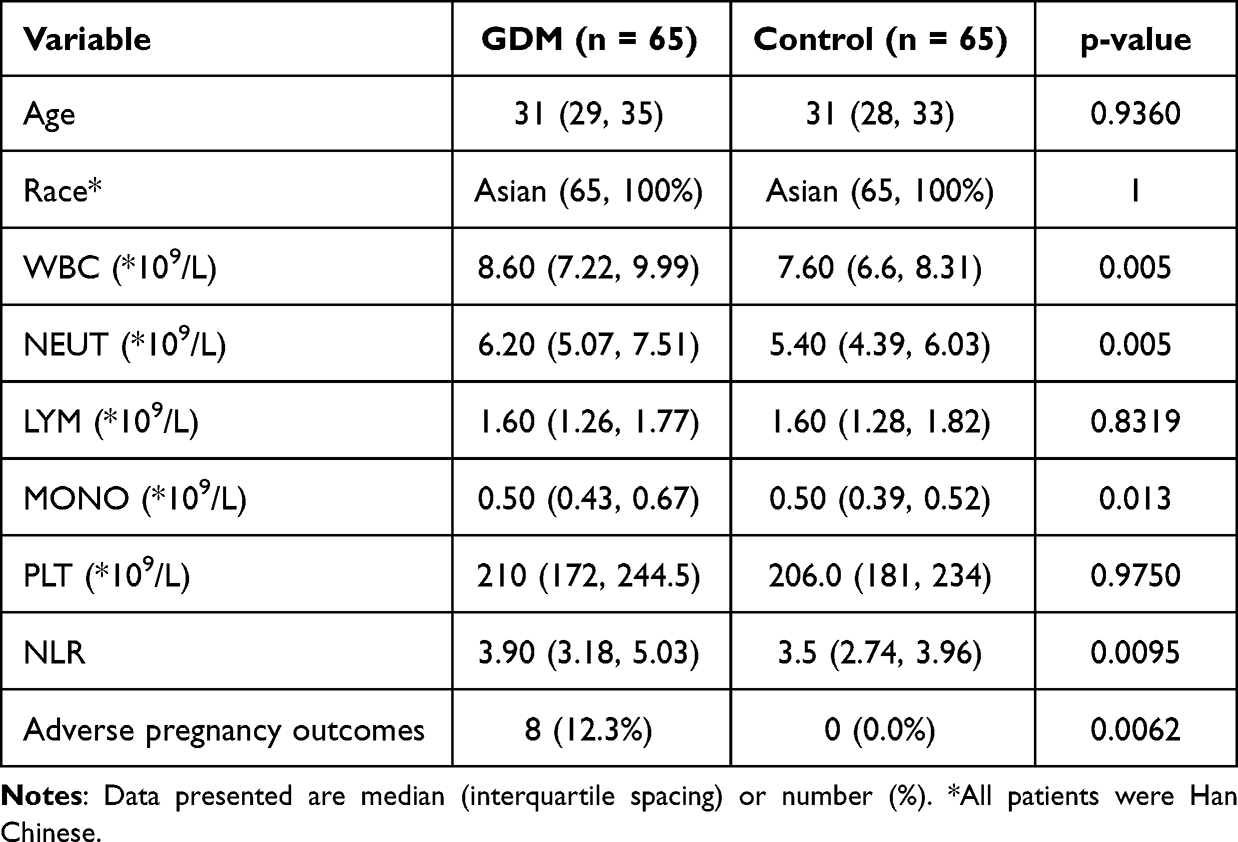 |
Table 1 Comparison of GDM and Control Group in Clinical Variables |
Transcriptional Feature of GDM Placenta from Bulk Sequencing Data
To investigate the transcriptional features and inflammatory response of the human placenta in GDM, we utilized the bulk RNA sequencing dataset GSE154414, which included 4 GDM patients and 4 controls, to identify differentially expressed genes (DEGs) in the human placenta and screen hub genes. As shown in Figure 2A, 101 up-regulated and 398 down-regulated genes were identified in the GDM placenta. The top 30 up-regulated and top 30 down-regulated DEGs were shown in the heatmap (Figure 2B). Notably, enrichment analysis of DEGs revealed pathways focused on innate immunity and inflammation signaling, such as regulation of inflammatory response, macrophage activation, macrophage chemotaxis, and leukocyte activation involved in inflammatory response (Figure 2C), suggesting a potential role of macrophages in the placenta of GDM patients. Furthermore, GSEA revealed that the inflammatory response regulatory pathway was up-regulated in GDM when compared to the control sample (Figure 2D). We then used the up-regulated genes to build the protein-protein interaction (PPI) network and screen for hub genes using the Cytoscape software, discovering that the top 10 hub genes were inflammation-related genes TGFB1, S100A8, MMP9, LTF, LCN2, FCGR38, CXCR1, CCL5, ITGAX, and GZMB (Figure 2E and F). These 10 hub genes were then used to screen potential drugs for the treatment of placenta inflammation in GDM. The top 10 candidate drugs, including probucol, triamcinolone acetonide, and potassium persulfate, were generated based on the combined score (Supplementary Table 1). Molecular docking patterns for triamcinolone acetonide with TGFB1 and CCL5, potassium persulfate with LCN2 and LTF, and probucol with TGFB1 and MMP9 (Figure 3).
 |
Figure 2 Transcription features and hub genes in GDM and control samples. (A) Volcano showing the DEGs between GDM and control groups. The top 10 up-regulated and down-regulated genes were labeled. (B) Heatmap showing the top 30 up-regulated and down-regulated DEGs between GDM and control samples. (C) The bar plot shows the GO analysis enrichment of DEGs. Significant pathways related to macrophages and inflammation were shown. (D) Gene set enrichment analysis (GSEA) plot showing the up-regulated pathway enrichment in regulation of inflammatory response. (E) Protein-protein network plot showing the interaction across the up-regulated DEGs. (F) Interaction network plot showing the top 10 hub genes. |
 |
Figure 3 Molecular docking analysis results. (A and B) Molecular docking patterns for TGFB1 (A) and CCL5 (B) and triamcinolone acetonide. A schematic representation of the protein structure (left), overall structure with docking results (middle) and docking details (right). (C and D) Molecular docking patterns for LCN2 (C) and LTF (D) and potassium persulfate. A schematic representation of the protein structure (left), overall structure with docking results (middle) and docking details (right). (E and F) Molecular docking patterns for TGFB1 (E) and MMP9 (F) and probucol. A schematic representation of the protein structure (left), overall structure with docking results (middle) and docking details (right). |
Identification of Key Regulators Governing M2 Macrophage in GDM
To explore the relationship between placental immune cells and GDM, we calculated the proportion of 22 infiltrating immune cell types in GDM and control samples from GSE154414 and GSE79403 datasets (Figure 4A–D). We then explored the intersection between the two data sets’ analyses and found consistent results that the infiltration abundance of anti-inflammatory M2 macrophages was decreasing in the placenta of GDM (Figure 4E). Then, a total of 5533 and 1741 M2 macrophage-related genes were identified in GSE70493 and GSE154414, respectively, and 217 overlapping genes were obtained, including 156 positive correlation genes and 61 negative correlation genes (Figure 5A and B). Enrichment analysis of these genes revealed significant pathways related to diabetic complications, ECM-receptor interaction, Th1 and Th2 cell differentiation, viral myocarditis, and the Rap1 signaling pathway (Figure 5C). To further investigate the potential transcription factors regulating M2 macrophage-related genes, we performed a promoter analysis and identified top-scoring TF motifs, including SMAD2, HEY2, FOXK1, ETV1, KLF4, SIX1, MAZ, TEAD4, SOX10, RUNX3, JUNB, and E2F2 (Figure 5D).
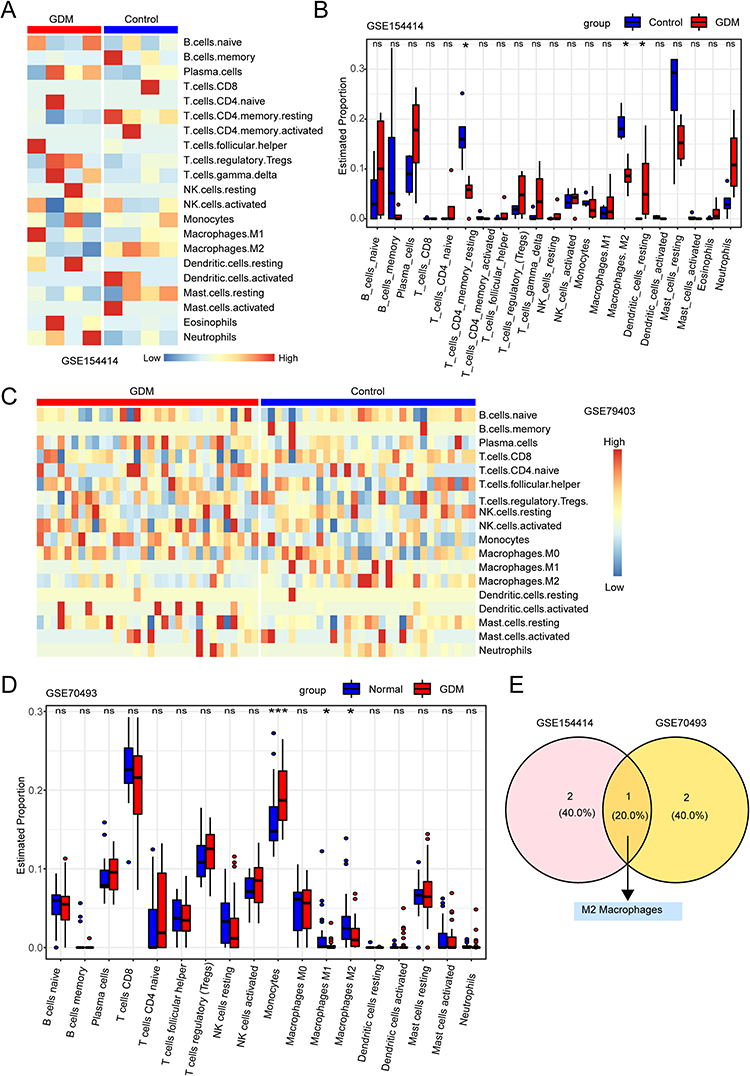 |
Figure 4 Immune cell infiltration in human placenta. (A) Heatmap of immune cell infiltration in the GSE154414 dataset for GDM and control groups. (B) Bar plot showing the proportion of infiltrating immune cells between GDM and control groups in GSE154414 dataset. (C) Heatmap showing the immune cell infiltration of GDM and control groups in GSE79403 dataset. (D) A bar plot depicts the proportion of infiltrating immune cells in the GSE79403 dataset between GDM and control groups. (E) Venn diagram showing shared significant differential immune cell types between GSE154414 dataset and GSE79403 dataset, which obtained M2 macrophages. “ns” represents p > 0.05, * represents p < 0.05, *** represents p < 0.001. |
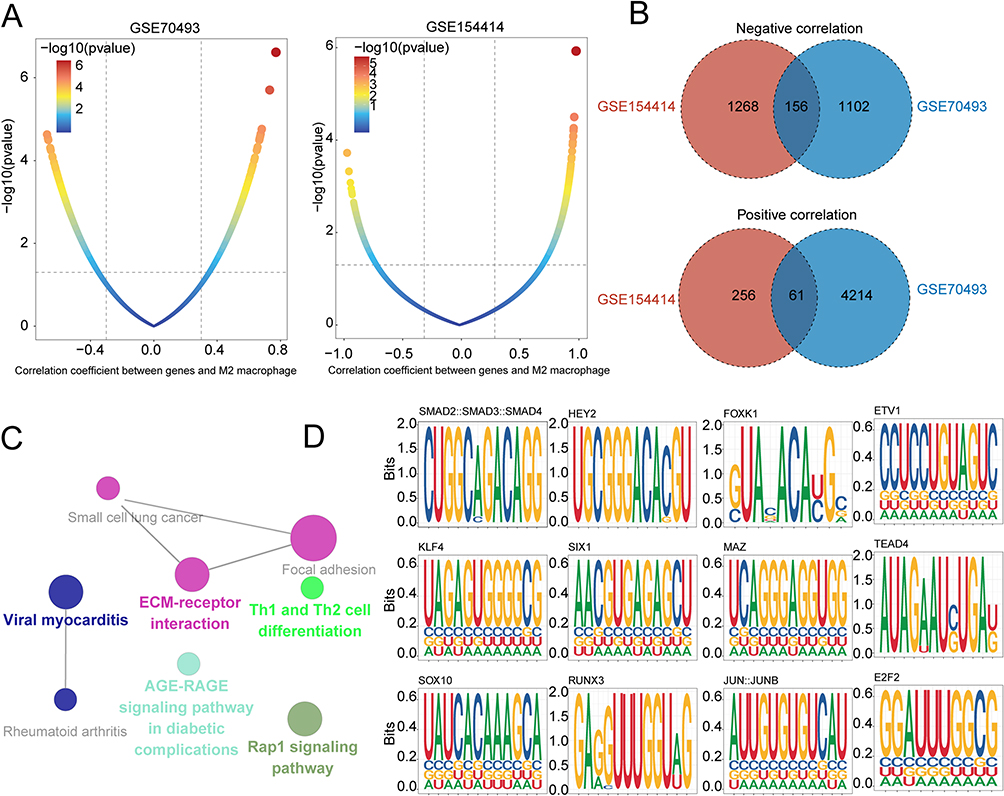 |
Figure 5 Identification of key regulators governing M2 macrophage-related genes in GDM. (A) Dot plots show the correlation coefficient (x-axis) and significance (y-axis) evaluated between gene expression and infiltration of M2 macrophage in GSE70493 (left) and GSE154414 (right). (B) Venn diagrams showing shared significant M2 macrophages positively (up) and negatively (down) related genes between GSE154414 and GSE70493 datasets. (C) Network diagram showing KEGG pathway enrichment of M2 macrophage-related genes. (D) TF-binding site motif analysis for M2 macrophage-related genes in GDM. |
scRNA Profiling of Human Placenta in GDM
To investigate the cellular infiltration and transcriptome characteristics of the human placenta in GDM, we analyzed the scRNA-seq dataset (GSE173193) from the GEO database, which included 26,407 cells, comprising 14,027 cells from GDM patients and 12,380 cells from control samples. After filtration, 23,769 cells were retained, with 12,358 cells from GDM patients and 11,411 cells from control samples. The expression characteristics of each sample are depicted in Supplementary Figure 1A. We observed a positive correlation between nFeature_RNA, which represents the number of genes, and nCount_RNA, which represents the number of unique molecular identifiers (UMI), with a correlation coefficient of 0.94 (Supplementary Figure 1B). Furthermore, we identified the top 10 highly variable genes (HVGs), which included the interferon-related genes IFNL3, IFNL2, IFNB1, and IFIT (Supplementary Figure 1C).
We identified 21 clusters using the Seurat R package and assigned these cell clusters to defined cell populations based on the expression of previously reported marker genes (Figure 6A and B, Supplementary Table 2). The expression of cell type marker genes was illustrated in the violin plot (Figure 6C). Notably, the proportion of macrophages was increased in GDM samples compared to control samples (Figure 6D), and odds ratio (OR) analysis showed that macrophages had a strong distribution preference in GDM (Figure 6E). Therefore, in the subsequent analysis, we focused on the macrophage cluster of the human placenta.
 |
Figure 6 Placental landscape profiling of single cells from GDM and control samples. (A) t-SNE plot showing 23,769 cells from the 4 samples, with cells grouped into 21 clusters. (B) t-SNE plot showing 23,769 cells grouped into 11 major cell types. (C) Violin plot showing the expression of canonical marker genes in each cell cluster. (D) Cell cluster frequency showing the fractions of 11 major cell types for GDM and control samples. (E) Heatmap showing the odds ratio (ORs) of cell clusters occurring in each tissue. |
The Distribution and Characteristics of Macrophages in GDM
To further investigate the transcriptional differences in cell clusters between GDM and control samples, we performed differentially expressed genes (DEG) analysis. The numbers of DEGs in each cell cluster were visualized using t-SNE analysis, and the largest number was observed in the macrophage cluster, demonstrating the essential role of macrophages in GDM (Figure 7A and Supplementary Table 3). We used the irGSEA R package to determine the inflammatory response activity of each cell line (Figure 7B). Notably, macrophages, monocytes, and granulocytes exhibited higher AUCell scores related to inflammatory response (Figure 7C). We also performed Gene Set Variation Analysis (GSVA) of the Hallmark Pathways for different cell clusters to characterize their function. In macrophages, pathways involved in inflammatory responses, IFN-α and IFN-γ responses, NFκB-mediated TNFA-signaling, and IL6_JAK_STAT3 signaling were up-regulated (Figure 7D).
 |
Figure 7 The heterogeneity and relation to inflammatory response of cell clusters in the human placenta. (A) t-SNE plot showing the numbers of differentially expressed genes (DEGs) in each cell type. (B) t-SNE plot showing the inflammatory response score in each cell cluster. (C) Ridgeline plot showing the AUCell scores of inflammatory responses in major cell types in the human placenta. (D) Heatmap showing differences in normalized scores of pathways among the different cell types. |
Next, we further explored the role of macrophages in GDM (Figure 8A). To search for upstream regulatory mechanisms, we calculated the transcription factor (TF) activity of macrophages from GDM and control samples using the Dorothea algorithm. We found increased TF activity for inflammation-related genes, including ZNF263, HSF1, ZEB2, and BCL6, in macrophages from patients with GDM (Figure 8B). Furthermore, we obtained 788 DEGs, including 234 up-regulated and 554 down-regulated genes, by differential gene expression analysis (Figure 8C). It was reported that heat shock proteins (HSPs) were up-regulated in all cells at the site of inflammation.29 Notably, members of the HSPs families’ genes, including HSPA6, HSPD1, HSPE1, HSPB1, and HSPA1B, were up-regulated in macrophages from GDM, suggesting the occurrence of inflammation in GDM (Figure 8C). As shown in Figure 8D, pathway enrichment analysis of DEGs in macrophages mainly focused on innate immune responses, such as neutrophil median immunity, neutrophil activation, and MHC protein complex binding. In addition, we calculated the M1 macrophages signature (pro-inflammatory function) and M2 macrophages signature (anti-inflammatory function) scores to confirm the function of macrophages. Consistent with our bulk RNA sequencing analysis, M1 macrophage signature scores in macrophages from GDM were significantly higher than those in control samples, while M2 macrophage signature scores were significantly lower than those in control samples (Figure 8E). Our experimental results also showed that M1 macrophages increased in GDM patients compared to the control group (Figure 8F and G).
 |
Figure 8 The distribution and characteristics of macrophage clusters in human placenta. (A) t-SNE plot showing the macrophage from human placenta, with each cell color-coded by its clusters (left), sample origins (middle), and macrophage marker gene CD68 expression (right). (B) Heatmap showing the top 30 highly variable transcriptional factor (TF) activities between GDM and control groups. (C) Volcano showing the DEGs between GDM and control groups. The top 10 up-regulated and down-regulated genes were labeled. (D) The bar plot shows the GO analysis enrichment of DEGs. (E) Violin plot showing M1 macrophage signature score (left) and M2 macrophage signature score (right) in macrophages from GDM and control group. (F and G) Expression of M1 macrophages (white arrows) in GDM patients and controls group. *** represents p < 0.001, **** represents p < 0.0001. |
The Mode of Cell Death for Macrophage in GDM
As we know, the inflammatory reactions were associated with increased cell death.30 Then, we wanted to know the mode of cell death for macrophages in GDM. As shown in Figure 9A, we found that ferroptosis, lysosome-dependent cell death, apoptosis, and the autophagy signature score were highly expressed in macrophages. Moreover, our data indicated that the ferroptosis signature score was significantly associated with inflammatory response signature score (Figure 9B). An accumulating body of evidence found that excess iron was a risk factor in GDM.31,32 We visualized the ferroptosis signature score using the t-SNE plot (Figure 9C). Notably, the ferroptosis signature score in macrophages was significantly highest in the placenta (Figure 9D). It is worth noting that the ferroptosis signature was significantly increased in GDM as compared to control group macrophages (Figure 9E). Our experimental results demonstrate similar findings, showing a significant increase in ferroptosis signature in macrophages of GDM patients compared to the control group (Figure 9F). Overall, our results suggest that ferroptosis of macrophages may be associated with inflammation in GDM. Global alterations of intercellular signaling network in GDM.
 |
Figure 9 Ferroptosis was significantly active in macrophage clusters from GDM. (A) Dotplot shows the expression levels of 12 programmed cell death signature score among different cell types. (B) The density plot shows a correlation between ferroptosis signature score and inflammatory response signature score. (C) t-SNE plot shows ferroptosis signature score in each cell type. (D) Violin plot showing ferroptosis signature score among different cell types. (E) Violin plot shows ferroptosis signature score in macrophages from GDM and control groups. (F) Immunofluorescence staining shows the ferroptosis related gene ACSL4 in macrophages (white arrows) from GDM and control patients. ** represents p < 0.01, **** represents p < 0.0001. |
To illustrate cell-cell communication in the human placenta, we first quantified and visualized the crosstalk atlas among different cell clusters using the CellChat R package and compared the data between the GDM and control samples. Notably, we discovered that in GDM, both overall interaction number and interaction strength decreased when compared to physiological conditions (Figure 10A–C). Some pathways, such as TGFb, CALCR, and MK, were turned off, while the OSM and INF-II signaling communication pathways were turned on in GDM (Figure 10D). The MIF and BAFF pathways were increased and some decreased (such as SPP1, IL1, and EGF) in GDM compared to control, whereas the WNT, CCL, PTN, VEGF, RESISTIN, and GDF pathways were comparable between GDM and control (Figure 10D). Between macrophages and other cell clusters, the BAFF and MIF signals were generally increased in GDM compared to control (Figure 10E and F). We found no observable interaction of OSM signal among different cell clusters in the control sample, while there was an intense crosstalk of OSM signal between granulocytes and syncytiotrophoblast cells in GDM (Figure 10G). In addition, we further found that there was no crosstalk of the INF-II signal among different cell clusters in the control sample. On the contrary, there was an intense interaction of IFN-II signal in GDM (Figure 10H).
 |
Figure 10 The crosstalk among cell clusters in GDM and control groups. (A) A circle plot showing the differential number of cell-cell interactions. (B) A circle plot showing the differential strength of cell-cell interactions. (C) Heatmaps showing the interaction quantity (left) and interaction strength (right) between GDM and control cells. (D) Bar plots showing the ranking of signaling in the interaction networks between GDM and control samples. (E–H) Circle plots showing the cell-cell communication between GDM and control samples, including BAFF (E), MIF (F), OSM (G), and the IFN-II (H) signaling pathway. |
Discussion
Gestational diabetes mellitus (GDM) is a form of diabetes that occurs or is first detected during pregnancy and is one of the most common complications of pregnancy.33,34 It is known to be associated with adverse pregnancy outcomes such as malformations, fetal death, fetal macrosomia, and neonatal hypoglycemia.35,36 To our knowledge, GDM is characterized by a low-grade inflammatory response. While it is understood that the placenta can be a source of inflammatory mediators,3 the underlying mechanisms of placental inflammation remain unclear. In this study, we investigated the relationship between cell clusters in the placenta and inflammation using bioinformatics analysis. Previous research has demonstrated that inflammatory genes, such as IL1B, TNF, TNFAIP3, and NFKB1A, are up-regulated in GDM patients.37 Our results confirm that inflammation-related signaling pathways are up-regulated in GDM compared with control samples. Furthermore, we identified ten hub genes, including FCGR3B, CXCR1, MMP9, ITGAX, CCL5, GZMB, S100A8, LCN2, TGFB1, and LTF, which are associated with inflammation-related processes, using PPI hub analysis. Furthermore, correlation analysis confirmed that hub genes were associated with inflammation-related processes (Supplementary Figure 2). Ferroptosis has been shown to be closely associated with the occurrence and progression of inflammation.38 Our study revealed that macrophages have the highest ferroptosis signature score among all cell types, suggesting their potential role in placental inflammation.
Macrophages are a subset of innate immune cells that originate from monocytes and are part of the innate immune system. Due to their role in innate and adaptive immunity, macrophages play a central role in the development and progression of inflammation.39 Numerous studies have shown that in diabetic patients, pro-inflammatory M1 macrophages are increased, while anti-inflammatory M2 macrophages are suppressed.40–42 However, the role of macrophages in GDM is less well understood. In a study by Ines Mrizak et al, both pro-inflammatory factors such as IL-6, TLR4, and TGF-β expression and macrophage infiltration were found to be increased in GDM placenta.6 Other studies have reported a positive association between GDM and macrophages.43 Consistent with these findings, our data showed a strong distribution preference of macrophages in GDM, suggesting that macrophages play an important role in the development of placental inflammation in GDM. Previous studies have reported conflicting findings on the polarization state of macrophages in GDM. While some studies have reported that placental macrophages maintain an M2 phenotype in GDM,8,44 others have shown that Hofbauer cells switch their functional phenotype from M2 to a pro-inflammatory M1 state.45 Moreover, M1 macrophages were found to be increasing while M2 macrophages were decreasing in GDM placenta.46 Similarly, Xinmei Huang et al found that the M2 macrophage marker CD206 was significantly lower, while the M1 macrophage markers CD80 and CD86 were significantly higher in GDM patients than in those without GDM.9 These findings indicate that the role of macrophages with altered polarization in GDM is still unclear and requires further investigation. In this study, we aimed to investigate whether reduced anti-inflammatory M2 macrophages or increased pro-inflammatory M1 macrophages are responsible for placental inflammation in GDM. Using bioinformatic analysis, we observed a significant decrease in M2 macrophages in GDM placenta in both GSE154414 and GSE70493 datasets. Furthermore, the M1 macrophage signature score was significantly higher in GDM macrophages than in control samples, while the M2 macrophage signature score was significantly lower. Given the key role of M2 macrophages in GDM, we identified 217 M2 macrophage-related genes and TF-binding motifs enriched in their promoters, such as KLF4 and ETV1. These findings provide insights into the mechanisms and therapeutic targets of M2 macrophages in placental inflammation in GDM. However, additional studies are needed to confirm this controversial issue.
Ferroptosis is associated with the development of inflammation and be a potential therapeutic target to address inflammation.14,38 Our clinical data indicated that patients with gestational diabetes mellitus (GDM) were in an inflammatory state and had an increased risk of multiple adverse pregnancy outcomes. To further determined that ferroptosis may be involved in the development of placental inflammation in GDM and then visualized the landscape of ferroptosis across different cell types in the placenta. The results found that ferroptosis signature score in macrophages was highest among other cell types in placenta and ferroptosis of macrophages in GDM was significantly higher than that of normal sample. Totally, our data suggested that ferroptosis of macrophages might contribute to the placental inflammation in GDM.
The human placenta is a complex organ composed of various cell types, including trophoblast, immune, stromal, and endothelial sub-clusters. Intercellular communication plays a critical role in inducing and resolving inflammation. Fewer studies have been conducted on intercellular communication in the placenta in GDM. Using the CellChat algorithm, we explored cell-cell communication in the GDM placenta and observed a reduction in both interaction quantity and strength among different cell types compared with control samples. However, the IFN-II, BAFF, and MIF signals were generally increased in GDM compared with control between macrophages and other cell clusters. IFN-II, BAFF, and MIF are associated with inducing inflammation, suggesting that these signals from other cell types may promote macrophages’ participation in the occurrence and development of inflammation in GDM placenta. These findings provide some insight into the mechanism of placental inflammation in GDM.
The present study is the first to investigate the role of macrophages in the placenta of GDM through integrative scRNA-seq and bulk RNA sequencing analysis. However, there are several limitations to consider. Firstly, the use of public data from the GEO database may result in analysis deviation due to the limited amount of data available. Additionally, while this study suggests that the regulation of macrophage polarization may be associated with placental inflammation in GDM, further studies are necessary to confirm this controversial issue. Moreover, it is still unclear whether these changes are the cause or result of placental inflammation in GDM.
Conclusion
In conclusion, our study provides comprehensive insights into the role of bioinformatics, single-cell RNA sequencing, bulk sequencing data, and macrophages in gestational diabetes mellitus (GDM). Our clinical data support the presence of a low-grade inflammatory response in GDM, which is associated with adverse pregnancy outcomes. Through the integration of bioinformatic analysis and experimental validation, we have identified macrophages as key players in the placental inflammatory changes observed in GDM. Specifically, we observed an imbalance in macrophage polarization, with an increase in M1 macrophages and a decrease in M2 macrophages. This dysregulated polarization ratio may contribute to placental inflammation in GDM. Furthermore, our data suggest that ferroptosis of macrophages may also play a role in placental inflammation in GDM. Overall, our findings highlight the importance of bioinformatics analysis, single-cell RNA sequencing, bulk sequencing data, and the role of macrophages in understanding the mechanisms underlying inflammation in GDM. These insights provide potential therapeutic targets for the management of GDM and offer promising avenues for future research in this field.
Data Sharing Statement
The datasets presented in this study can be found in online repositories. The names of the repository and accession number(s) can be found in Supplementary Table 4. Detailed clinical information of the patients can be found in Supplementary Table 5.
Acknowledgments
We thank the authors who provided the GEO public datasets. We thank Dr.Jianming Zeng (University of Macau) and all the members of his bioinformatics team, biotrainee, for generously sharing their experience and codes. We also thank for generous help from Jun Zhang of China Pharmaceutical University and his official account.
Author Contributions
All authors made a significant contribution to the work reported, whether that is in the conception, study design, execution, acquisition of data, analysis and interpretation, or in all these areas; took part in drafting, revising or critically reviewing the article; gave final approval of the version to be published; have agreed on the journal to which the article has been submitted; and agree to be accountable for all aspects of the work.
Funding
This study was supported by National Key Clinical Specialty Construction Project (Clinical Pharmacy) and High-Level Clinical Key Specialty (Clinical Pharmacy) in Guangdong Province. In addition, the study was also supported by funding of the Guangdong Province Hospital Association (No. 2021YXQN08).
Disclosure
The authors declare that there were no financial or commercial relationships that might be viewed as having a potential conflict of interest.
References
1. Russo LM, Nobles C, Ertel KA, et al. Physical activity interventions in pregnancy and risk of gestational diabetes mellitus: a systematic review and meta-analysis. Obstet Gynecol. 2015;125(3):576–582. doi:10.1097/aog.0000000000000691
2. Damm P, Houshmand-Oeregaard A, Kelstrup L, et al. Gestational diabetes mellitus and long-term consequences for mother and offspring: a view from Denmark. Diabetologia. 2016;59(7):1396–1399. doi:10.1007/s00125-016-3985-5
3. Pantham P, Aye IL, Powell TL. Inflammation in maternal obesity and gestational diabetes mellitus. Placenta. 2015;36(7):709–715. doi:10.1016/j.placenta.2015.04.006
4. Kleiblova P, Dostalova I, Bartlova M, et al. Expression of adipokines and estrogen receptors in adipose tissue and placenta of patients with gestational diabetes mellitus. Mol Cell Endocrinol. 2010;314(1):150–156. doi:10.1016/j.mce.2009.08.002
5. Hamidzadeh K, Christensen SM, Dalby E, et al. Macrophages and the recovery from acute and chronic inflammation. Annu Rev Physiol. 2017;79(1):567–592. doi:10.1146/annurev-physiol-022516-034348
6. Mrizak I, Grissa O, Henault B, et al. Placental infiltration of inflammatory markers in gestational diabetic women. Gen Physiol Biophys. 2014;33(2):169–176. doi:10.4149/gpb_2013075
7. Bari MF, Weickert MO, Sivakumar K, et al. Elevated soluble CD163 in gestational diabetes mellitus: secretion from human placenta and adipose tissue. PLoS One. 2014;9(7):e101327. doi:10.1371/journal.pone.0101327
8. Schliefsteiner C, Peinhaupt M, Kopp S, et al. Human placental hofbauer cells maintain an anti-inflammatory m2 phenotype despite the presence of gestational diabetes mellitus. Front Immunol. 2017;8:888. doi:10.3389/fimmu.2017.00888
9. Huang X, Zha B, Zhang M, et al. Decreased monocyte count is associated with gestational diabetes mellitus development, macrosomia, and inflammation. J Clin Endocrinol Metab. 2022;107(1):192–204. doi:10.1210/clinem/dgab657
10. Ashkenazi A, Salvesen G. Regulated cell death: signaling and mechanisms. Annu Rev Cell Dev Biol. 2014;30(1):337–356. doi:10.1146/annurev-cellbio-100913-013226
11. Tang D, Kang R, Berghe TV, et al. The molecular machinery of regulated cell death. Cell Res. 2019;29(5):347–364. doi:10.1038/s41422-019-0164-5
12. Tsvetkov P, Coy S, Petrova B, et al. Copper induces cell death by targeting lipoylated TCA cycle proteins. Science. 2022;375(6586):1254–1261. doi:10.1126/science.abf0529
13. Kasture V, Sahay A, Joshi S. Cell death mechanisms and their roles in pregnancy related disorders. Adv Protein Chem Struct Biol. 2021;126:195–225. doi:10.1016/bs.apcsb.2021.01.006
14. Sun Y, Chen P, Zhai B, et al. The emerging role of ferroptosis in inflammation. Biomed Pharmacother. 2020;127:110108. doi:10.1016/j.biopha.2020.110108
15. Zhao Y, Gao Q, Li B, et al. Ferroptosis and its potential role in gestational diabetes mellitus: updated evidence from pathogenesis to therapy. Front Endocrinol. 2023;14:1177547. doi:10.3389/fendo.2023.1177547
16. Zheng Y, Hu Q, Wu J. Adiponectin ameliorates placental injury in gestational diabetes mice by correcting fatty acid oxidation/peroxide imbalance-induced ferroptosis via restoration of CPT-1 activity. Endocrine. 2022;75(3):781–793. doi:10.1007/s12020-021-02933-5
17. Han D, Jiang L, Gu X, et al. SIRT3 deficiency is resistant to autophagy-dependent ferroptosis by inhibiting the AMPK/mTOR pathway and promoting GPX4 levels. J Cell Physiol. 2020;235(11):8839–8851. doi:10.1002/jcp.29727
18. Yang Y, Guo F, Peng Y, et al. Transcriptomic profiling of human placenta in gestational diabetes mellitus at the single-cell level. Front Endocrinol. 2021;12:679582. doi:10.3389/fendo.2021.679582
19. Stuart T, Butler A, Hoffman P, et al. Comprehensive integration of single-cell data. Cell. 2019;177(7):1888–902.e21. doi:10.1016/j.cell.2019.05.031
20. Korsunsky I, Millard N, Fan J, et al. Fast, sensitive and accurate integration of single-cell data with harmony. Nat Methods. 2019;16(12):1289–1296. doi:10.1038/s41592-019-0619-0
21. Binder AM, LaRocca J, Lesseur C, et al. Epigenome-wide and transcriptome-wide analyses reveal gestational diabetes is associated with alterations in the human leukocyte antigen complex. Clin Epigenetics. 2015;7(1):79. doi:10.1186/s13148-015-0116-y
22. Ritchie ME, Phipson B, Wu D, et al. limma powers differential expression analyses for RNA-sequencing and microarray studies. Nucleic Acids Res. 2015;43(7):e47. doi:10.1093/nar/gkv007
23. Wu T, Hu E, Xu S, et al. clusterProfiler 4.0: a universal enrichment tool for interpreting omics data. Innovation. 2021;2(3):100141. doi:10.1016/j.xinn.2021.100141
24. Hanzelmann S, Castelo R, Guinney J. GSVA: gene set variation analysis for microarray and RNA-seq data. BMC Bioinf. 2013;14(1):7. doi:10.1186/1471-2105-14-7
25. Jensen LJ, Kuhn M, Stark M, et al. STRING 8--a global view on proteins and their functional interactions in 630 organisms. Nucleic Acids Res. 2009;37(Database):D412–6. doi:10.1093/nar/gkn760
26. Zeng D, Ye Z, Shen R, et al. IOBR: multi-omics immuno-oncology biological research to decode tumor microenvironment and signatures. Front Immunol. 2021;12:687975. doi:10.3389/fimmu.2021.687975
27. Garcia-Alonso L, Holland CH, Ibrahim MM, et al. Benchmark and integration of resources for the estimation of human transcription factor activities. Genome Res. 2019;29(8):1363–1375. doi:10.1101/gr.240663.118
28. Jin S, Guerrero-Juarez CF, Zhang L, et al. Inference and analysis of cell-cell communication using cellchat. Nat Commun. 2021;12(1):1088. doi:10.1038/s41467-021-21246-9
29. Hauet-Broere F, Wieten L, Guichelaar T, et al. Heat shock proteins induce T cell regulation of chronic inflammation. Ann Rheum Dis. 2006;65(Suppl 3):iii65–8. doi:10.1136/ard.2006.058495
30. Corbalan JJ, Medina C, Jacoby A, et al. Amorphous silica nanoparticles trigger nitric oxide/peroxynitrite imbalance in human endothelial cells: inflammatory and cytotoxic effects. Int J Nanomedicine. 2011;6:2821–2835. doi:10.2147/IJN.S25071
31. Bowers K, Yeung E, Williams MA, et al. A prospective study of prepregnancy dietary iron intake and risk for gestational diabetes mellitus. Diabetes Care. 2011;34(7):1557–1563. doi:10.2337/dc11-0134
32. Fernández-Cao JC, Aranda N, Ribot B, et al. Elevated iron status and risk of gestational diabetes mellitus: a systematic review and meta-analysis. Matern Child Nutr. 2017;13(4). doi:10.1111/mcn.12400
33. Hartling L, Dryden DM, Guthrie A, et al.; Benefits and harms of treating gestational diabetes mellitus: a systematic review and meta-analysis for the U.S. Preventive services task force and the national institutes of health office of medical applications of research. Ann Intern Med. 2013;159(2):123–129. doi:10.7326/0003-4819-159-2-201307160-00661
34. Hedderson MM, Brown SD, Ehrlich SF, et al. A tailored letter based on electronic health record data improves gestational weight gain among women with gestational diabetes mellitus: the gestational diabetes’ effects on moms (gem) cluster-randomized controlled trial. Diabetes Care. 2018;41(7):1370–1377. doi:10.2337/dc17-1133
35. Group HSCR, Metzger BE, Lowe LP, et al. Hyperglycemia and adverse pregnancy outcomes. N Engl J Med. 2008;358(19):1991–2002. doi:10.1056/NEJMoa0707943
36. Schaefer-Graf UM, Pawliczak J, Passow D, et al. Birth weight and parental BMI predict overweight in children from mothers with gestational diabetes. Diabetes Care. 2005;28(7):1745–1750. doi:10.2337/diacare.28.7.1745
37. Evangelista AF, Collares CV, Xavier DJ, et al. Integrative analysis of the transcriptome profiles observed in type 1, type 2 and gestational diabetes mellitus reveals the role of inflammation. BMC Med Genomics. 2014;7(1):28. doi:10.1186/1755-8794-7-28
38. Chen X, Kang R, Kroemer G, et al. Ferroptosis in infection, inflammation, and immunity. J Exp Med. 2021;218(6). doi:10.1084/jem.20210518
39. Li C, Xu MM, Wang K, et al. Macrophage polarization and meta-inflammation. Transl Res. 2018;191:29–44. doi:10.1016/j.trsl.2017.10.004
40. Theocharidis G, Thomas BE, Sarkar D, et al. Single cell transcriptomic landscape of diabetic foot ulcers. Nat Commun. 2022;13(1):181. doi:10.1038/s41467-021-27801-8
41. Louiselle AE, Niemiec SM, Zgheib C, et al. Macrophage polarization and diabetic wound healing. Transl Res. 2021;236:109–116. doi:10.1016/j.trsl.2021.05.006
42. Jia G, DeMarco VG, Sowers JR. Insulin resistance and hyperinsulinaemia in diabetic cardiomyopathy. Nat Rev Endocrinol. 2016;12(3):144–153. doi:10.1038/nrendo.2015.216
43. De Luccia TPB, Pendeloski KPT, Ono E, et al. Unveiling the pathophysiology of gestational diabetes: studies on local and peripheral immune cells. Scand J Immunol. 2020;91(4):e12860. doi:10.1111/sji.12860
44. Barke TL, Goldstein JA, Sundermann AC, et al. Gestational diabetes mellitus is associated with increased CD163 expression and iron storage in the placenta. Am J Reprod Immunol. 2018;80(4):e13020. doi:10.1111/aji.13020
45. Sisino G, Bouckenooghe T, Aurientis S, et al. Diabetes during pregnancy influences hofbauer cells, a subtype of placental macrophages, to acquire a pro-inflammatory phenotype. Biochim Biophys Acta. 2013;1832(12):1959–1968. doi:10.1016/j.bbadis.2013.07.009
46. Pan X, Jin X, Wang J, et al. Placenta inflammation is closely associated with gestational diabetes mellitus. Am J Transl Res. 2021;13(5):4068–4079.
 © 2023 The Author(s). This work is published and licensed by Dove Medical Press Limited. The full terms of this license are available at https://www.dovepress.com/terms.php and incorporate the Creative Commons Attribution - Non Commercial (unported, v3.0) License.
By accessing the work you hereby accept the Terms. Non-commercial uses of the work are permitted without any further permission from Dove Medical Press Limited, provided the work is properly attributed. For permission for commercial use of this work, please see paragraphs 4.2 and 5 of our Terms.
© 2023 The Author(s). This work is published and licensed by Dove Medical Press Limited. The full terms of this license are available at https://www.dovepress.com/terms.php and incorporate the Creative Commons Attribution - Non Commercial (unported, v3.0) License.
By accessing the work you hereby accept the Terms. Non-commercial uses of the work are permitted without any further permission from Dove Medical Press Limited, provided the work is properly attributed. For permission for commercial use of this work, please see paragraphs 4.2 and 5 of our Terms.