Back to Journals » Journal of Inflammation Research » Volume 17
Bioinformatics and Integrative Experimental Method to Identifying and Validating Co-Expressed Ferroptosis-Related Genes in OA Articular Cartilage and Synovium
Authors Ma J ![]() , Yu P, Ma S, Li J, Wang Z
, Yu P, Ma S, Li J, Wang Z ![]() , Hu K
, Hu K ![]() , Su X
, Su X ![]() , Zhang B, Cheng S, Wang S
, Zhang B, Cheng S, Wang S
Received 14 September 2023
Accepted for publication 13 January 2024
Published 12 February 2024 Volume 2024:17 Pages 957—980
DOI https://doi.org/10.2147/JIR.S434226
Checked for plagiarism Yes
Review by Single anonymous peer review
Peer reviewer comments 2
Editor who approved publication: Professor Ning Quan
Jinxin Ma,1,* Peng Yu,1,* Shang Ma,1,* Jinjin Li,1 Zhen Wang,1 Kunpeng Hu,1 Xinzhe Su,1 Bei Zhang,1 Shao Cheng,1– 3 Shangzeng Wang1– 3
1School of Osteopathy, Henan University of Chinese Medicine, Zhengzhou, People’s Republic of China; 2Department of Arthropathy, Henan Province Hospital of Chinese Medicine (The Second Affiliated Hospital of Henan University of Chinese Medicine), Zhengzhou, People’s Republic of China; 3School of Osteopathy, Henan Province Engineering Research Center of Basic and Clinical Research of Bone and Joint Repair in Chinese Medicine, Zhengzhou, People’s Republic of China
*These authors contributed equally to this work
Correspondence: Shao Cheng; Shangzeng Wang, 156 Jinshui East Road, Zhengzhou, Henan, People’s Republic of China, Tel +86 15093141825 ; +86 13838527504, Fax +0371-86667366, Email [email protected]; [email protected]
Purpose: Osteoarthritis (OA) is the most common joint disease worldwide and is the primary cause of disability and chronic pain in older adults.Ferroptosis is a type of programmed cell death characterized by aberrant iron metabolism and reactive oxygen species accumulation; however, its role in OA is not known.
Methods: To identify ferroptosis markers co-expressed in articular cartilage and synovium samples from patients with OA, in silico analysis was performed.Signature genes were analyzed and the results were evaluated using a ROC curve prediction model.The biological function, correlation between Signature genes, immune cell infiltration, and ceRNA network analyses were performed. Signature genes and ferroptosis phenotypes were verified through in vivo animal experiments and clinical samples. The expression levels of non-coding RNAs in samples from patients with OA were determined using qRT-PCR. ceRNA network analysis results were confirmed using dual-luciferase assays.
Results: JUN, ATF3, and CDKN1A were identified as OA- and ferroptosis-associated signature genes. GSEA analysis demonstrated an enrichment of these genes in immune and inflammatory responses, and amino acid metabolism. The CIBERSORT algorithm showed a negative correlation between T cells and these signature genes in the cartilage, and a positive correlation in the synovium. Moreover, RP5-894D12.5 and FAM95B1 regulated the expression of JUN, ATF3, and CDKN1A by competitively binding to miR-1972, miR-665, and miR-181a-2-3p. In vivo, GPX4 was downregulated in both OA cartilage and synovium; however, GPX4 and GSH were downregulated, while ferrous ions were upregulated in patient OA cartilage and synovium samples, indicating that ferroptosis was involved in the pathogenesis of OA. Furthermore, JUN, ATF3, and CDKN1A expression was downregulated in both mouse and human OA synovial and cartilage tissues. qRT-PCR demonstrated that miR-1972, RP5-894D12.5, and FAM95B1 were differentially expressed in OA tissues. Targeted interactions between miR-1972 and JUN, and a ceRNA regulatory mechanism between RP5-894D12.5, miR-1972, and JUN were confirmed by dual-luciferase assays.
Conclusion: This study identified JUN, ATF3, and CDKN1A as possible diagnostic biomarkers and therapeutic targets for joint synovitis and OA. Furthermore, our finding indicated that RP5-894D12.5/miR-1972/JUN was a potential ceRNA regulatory axis in OA, providing an insight into the connection between ferroptosis and OA.
Keywords: osteoarthritis, ferroptosis, synovitis, bioinformatics, JUN, ATF3, CDKN1A, GPX4
Introduction
Osteoarthritis (OA) is a degenerative joint disease that primarily affects elderly individuals and causes articular cartilage morphology changes, destroys cartilage, and leads to osteophyte formation.1 It has a high incidence and disability rate and is characterized by joint pain, swelling, and stiffness; thus, it exerts a great burden on both individuals and society. By 2021, OA was estimated to affect approximately 300 million people worldwide,2 and it ranked sixth in Asia and eleventh globally in terms of years of disability.3 Early diagnosis and treatment of OA can effectively improve patients’ quality of life, delay progression, and reduce the financial burden on patients’ families and national healthcare systems.
OA is a complex disease caused by multiple factors, including aging, obesity, sex, overuse, trauma, joint deformity, and genetic susceptibility.4,5 The release of proinflammatory cytokines plays a critical role in synovial inflammation and cartilage matrix destruction, which lead to degradation and destructive responses in articular cartilage, thus contributing to the progression of OA.6 In 2012, Dixon7 reported a new form of programmed cell death called ferroptosis, which is characterized by abnormal iron metabolism, leading to the inactivation of glutathione peroxidase 4 (GPX4) and the accumulation of lipid reactive oxygen species (ROS).8 Ferroptosis is associated with many diseases, including Alzheimer’s disease, Parkinson’s disease, renal degeneration, malignancies, cerebral hemorrhage, traumatic brain injury, ischemia-reperfusion injury, and stroke.9 Studies have shown that OA shares some features with ferroptosis, such as abnormal iron metabolism,10,11 lipid peroxidation and mitochondrial dysfunction.8,12,13
Although research into the relationship between ferroptosis and OA is ongoing, a clear link has been observed. Ferroptosis triggers synovial inflammation, which activates the body’s nonspecific immunity and releases inflammatory mediators, such as IL-1β and interleukin-18 (IL-18).14,15 This exacerbates ferroptosis, thereby creating a vicious cycle. Therefore, studying the relationship between ferroptosis and synovial inflammation may aid in diagnosing OA at the early stage and improve the clinical management of patients with this condition.
This study investigated ferroptosis-related biomarkers in OA cartilage and synovium through bioinformatics analysis and validated the occurrence of ferroptosis in the cartilage and synovium and expression of signature genes in OA mice and patients. This study aimed to provide valuable information for the diagnosis and evaluation of OA, propose innovative ideas and methods for its treatment, and offer targeted support and theoretical foundations for the development of new drugs (Figure 1).
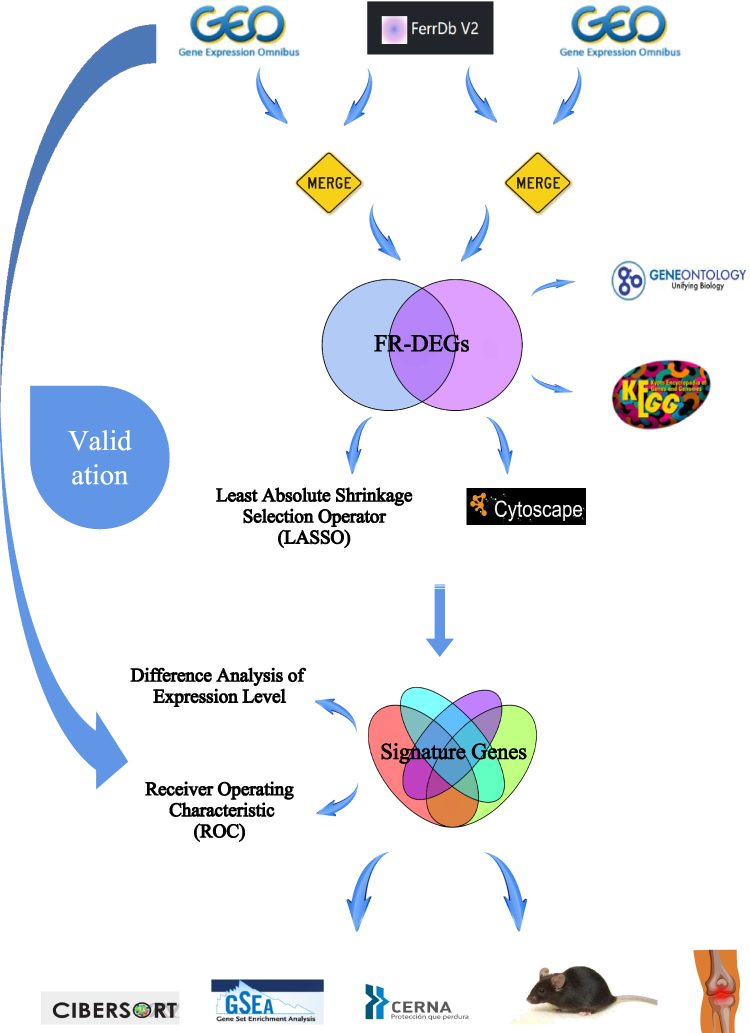 |
Figure 1 The overall flow chart of this study. |
Materials and Methods
Data Source
We used “human” and “osteoarthritis” as filtering criteria to select five eligible datasets from the GEO database (https://www.ncbi.nlm.nih.gov/geo/) as follows: GSE114007, GSE55235, GSE169077, GSE55457, and GSE206848. GSE114007 and GSE55235 were used as the training set, while GSE169077, GSE55457, and GSE206848 were used as the validation set (Table 1). Differentially expressed genes (DEGs) in the training set were screened by the R package “limma” using |logFC| > 1 and p-value < 0.05 as screening criteria, and they are displayed by volcano plots.
 |
Table 1 OA-Related Dataset from the GEO Database |
Ferroptosis-Related DEGs Screening
The ferroptosis inhibitor, suppressor, and marker datasets were downloaded from the FerrDB database (http://www.zhounan.org/ferrdb), and the three datasets were merged to obtain ferroptosis-related genes. The ferroptosis-related genes were intersected with the DEGs from training sets GSE114007 and GSE55235 to obtain ferroptosis-related differentially expressed genes (FR-DEGs) in the knee cartilage and knee synovium, respectively. We then examined the intersection between FR-DEGs in knee cartilage and synovium to identify the FR-DEGs co-expressed in both tissues. Heat maps were used to determine the expression levels.
Correlation Analysis and Enrichment Analysis of FR-DEGs
Correlation analyses among FR-DEGs were performed using the R package “corrplot”. We used the R package “clusterProfiler” to perform gene ontology (GO) enrichment analysis of FR-DEGs. Kyoto Encyclopedia of Genes and Genomes (KEGG) signaling pathway analysis and hierarchical clustering Ward D algorithm were used to explore the signaling pathway expression of FR-DEGs based on the Hiplot Pro platform (https://hiplot.com.cn/).
Protein-Protein Interaction(PPI) Network of FR-DEGs
The FR-DEGs were mapped to the STRING database (https://cn.string-db.org/) and screened with medium confidence (0.4) to construct the PPI network. The PPI network was then imported into Cytoscape (3.91) software and optimized for display and then clustered using the MCODE plug-in to build functional modules. The CytoHubba plug-in was used to analyze the nodes in the PPI network and obtain the core target gene network using the MCC topology analysis method.
Screening of the Signature Genes
Least Absolute Shrinkage Selection Operator (LASSO) regression analysis of the FR-DEGs was performed using the R package “glmnet”. Ten-fold of cross-validation iterations were conducted to select marker genes from the two training sets. Based on the cross-validation results, the regularization parameter with the smallest error is chosen as optimal, the LASSO model is then fitted, and the disease signature genes are identified.
Expression Levels of the Signature Genes and Prediction of OA
Box plots were used to demonstrate and statistically analyze the expression levels of the signature genes in both the control and disease groups. Receiver operating characteristic (ROC) curve analysis was used to examine the specificity, accuracy, and area under the curve (AUC) values of the signature genes were obtained. A logistic regression model based on the signature genes was constructed, and its accuracy was evaluated for OA diagnosis using ROC curves. The validation sets were used to validate the expression levels of the signature genes and determine their accuracy and significance in diagnosing OA.
Gene Set Enrichment Analysis
The R package “GSEA” was used for gene set enrichment analysis of the signature genes. The signature genes were divided into high and low expression groups based on the median expression level of the signature genes in the dataset. These groups were then used for KEGG enrichment analysis. The signaling pathways enriched in the signature genes at a p-value of <0.05 were considered significantly enriched.
Immunological Infiltration Analysis
The R package “CIBERSORT” was used to estimate the proportion of infiltrating immune cells in the training dataset. Subsequently, statistically significant differences were identified within the gene set composed of 22 immune cells at p < 0.05 for subsequent correlation analysis between the signature genes and immune cells.
Construction of ceRNA Network
The miRNAs corresponding to the feature genes were predicted using miRanda, miRDB, and TargetScan software, and those predicted by all three software programs were included. The miRNAs eligible for inclusion were predicted based on the spongeScan database, which was used to identify their corresponding lncRNAs, and competing endogenous RNA (ceRNA) networks of mRNA-miRNA-lncRNA were constructed to explore the intrinsic regulatory mechanisms of the signature genes.
Construction of OA Mice
Twenty C57BL/6 mice (Sipeifu (Beijing) Biotechnology Co., Ltd., SCXK (Beijing) 2019–0010) at 8 weeks old and weighing 20±2 g were selected. The animals were managed according to SPF level standards (20°C~25°C, 40~50% humidity, 12 h day and night cycle) and provided ad libitum access to laboratory food and water. The mice were then randomly divided into control and OA groups, with 10 mice in each group that underwent destabilizing medial meniscal surgery to prepare the OA mice.16 The mice were euthanized using carbon dioxide 4 weeks post-surgery, after which their knee joints were fixed with 4% paraformaldehyde. The experimental mice were housed at the Animal Experiment Center of Henan University of Chinese Medicine, and all experimental procedures were conducted in accordance with the ethical standards for experimental animals of Henan University of Chinese Medicine (IACUC-202302028).
Patients
Synovial tissues in the clinical OA group were obtained from six patients who underwent knee arthroscopic synovectomy and six patients who underwent total knee arthroplasty. Synovial tissue in the clinical control group was obtained from six patients who underwent arthroscopic surgery due to severe joint trauma, and these patients had no other joint abnormalities or systemic diseases.17 Cartilage tissues in the clinical OA group were obtained from six patients who underwent total knee arthroplasty. Cartilage tissue in the clinical control group was obtained from six patients with OA who underwent unicompartmental knee arthroplasty. Articular cartilage was collected at different stages following the Osteoarthritis Research Society International and International Cartilage Regeneration and Joint Preservation Society standards.18
All surgeries were performed at the Henan Provincial Hospital of Traditional Chinese Medicine. OA was diagnosed based on the 2019 American College of Rheumatology/Arthritis Foundation (ACR/AF) classification criteria. The protocol was approved by the Ethics Committee of Henan Provincial Hospital of Traditional Chinese Medicine (No. 1506–01), and all participants provided written informed consent in accordance with the Declaration of Helsinki. For the experiments, synovial and cartilage tissue samples from each donor were employed in only one experiment, and at least three donor-derived synovial and cartilage tissues were used for all experiments.
Histological Staining and Morphological Analysis
Knee joint samples from mice in both the control and OA groups were fixed using a 4% paraformaldehyde solution. Subsequently, decalcification, dehydration, transparency, wax dipping, and embedding were performed to prepare tissue slices. The sections were examined and stained under a light microscope (Nikon, Eclipse ci). Images were acquired using an imaging system (Nikon, DS-U3).The knee joint samples were pathologically scored according to the Mankin criteria.19
Immunohistochemical Detection of Expression Levels of Signature Genes
The knee joint cartilage and synovial tissue sections from mice were dewaxed, hydrated, and washed in PBS, followed by treatment with H2O2 and blocking with goat serum. The sections were incubated overnight at 4°C with primary antibodies, including JUN (1:200, abcam, ab32385), activating transcription factor 3 (ATF3) (1:300, bioss, bs-0519R) and cyclin-dependent kinase inhibitor 1A (CDKN1A) (1:200, bioss, bs-0741R). Afterward, they were rewarmed, washed again with PBS, and incubated with the secondary antibody at room temperature for 2 hours. Development with DAB and counterstaining with hematoxylin were performed, followed by dehydration, sealing, and observation under a microscope.
Western Blot
Knee joint cartilage and synovial tissues from mice in both the OA and control groups were washed with PBS, lysed, ground, and proteins were extracted and quantified on ice. Gel electrophoresis was then performed using the BCA method. Primary antibody is JUN (1:5000), ATF3 (1:1000), CDKN1A (1:1000), GPX4(1:5000, abcam, ab125066), GAPDH (abcam, ab8245) is the internal reference. After development with the ECL mixed solution, the experimental results are presented in the form of strips on the film. The absorbance values of the target bands were analyzed using ImageJ software.
Quantitative Real-Time PCR Assay
Cartilage and synovial tissues obtained from mice and patients were stored at a temperature of −80°C. The cartilage and synovial tissue samples were ground, and total RNA was extracted by TRIzol™ reagent (Invitrogen, 15596018). The primer sequences listed in Table S1 should be utilized for the detection of mouse samples and clinical samples. The qRT-PCR reaction conditions included an initial denaturation at 95°C for 10 min, followed by a denaturation step at 95°C for 10s, annealing at 60°C for 20s, and extension at 72°C for 15s. The CT values were recorded, and the results were analyzed using the 2−ΔΔCT method to obtain the relative expression levels.
Ferrous Iron and GSH Level Assay
A ferrous iron colorimetric assay kit (Elabscience, E-BC-K773-M) and reduced GSH colorimetric assay kit (Elabscience, E-BC-K030-M) were used to determine the levels of ferrous ions and glutathione (GSH) in the cartilage and synovial tissue of the clinical samples. The measurements were performed following the instructions provided with each respective assay kit.
Dual Luciferase Reporter Gene Assay
Targetscan V8 analysis revealed that miR-1972 targets the JUN 3’UTR. To construct a wild-type dual-luciferase reporter gene vector, we cloned the JUN 3’UTR sequence into the pmirGLO vector through PCR amplification and digestion with Nhe I and Sal I endonucleases. A fast site-directed mutagenesis kit was used to construct a mutant dual-luciferase reporter vector. 293T cells were seeded in culture dishes and cultured until they reached the desired density. The target 293T cells were co-transfected with a miR-1972 mimic, mimic NC, and dual-luciferase reporter gene vector using the Lipo2000 transfection reagent (Thermo, 11668027). After culturing the transfected cells for 48 h, luciferase detection was performed using a luciferase detection kit (Promega, E2920) according to the manufacturer’s instructions. Luciferase detection was performed to analyze the regulatory effect of miR-1972 on JUN expression.
In addition, we designed overexpression vectors for pcDNA3.1-RP5-894D12.5 and pcDNA3.1-FAM95B1. The pmirGLO-JUN-3’ UTR-WT and MUT plasmids were co-transfected into 293T cells with miRNA mimics, mimic NC, lncRNA overexpression vector or its empty vector pcDNA3.1(+). After culturing the transfected cells for 48 h, a luciferase detection kit (Promega, E2920) was used according to the manufacturer’s instructions. Luciferase detection results were examined to analyze the ceRNA regulatory relationships involving miR-1972, JUN, RP5-894D12.5, and FAM95B1.
Statistical Analysis
Measurement information were presented as the mean ± standard deviation (SD). Student’s t-test was used to analyze the difference between two groups for those with a normal distribution, while the Wilcoxon rank sum test was used for those with a non-normal distribution. P < 0.05 indicated a statistically significant difference between the two groups.
Results
Identification of FR-DEGs
A total of 2136 DEGs were found in the GSE114007 dataset, and they included 1067 upregulated and 1069 downregulated genes, while a total of 846 DEGs were found in the GSE55235 dataset, and they included 452 upregulated and 394 downregulated genes (Figure 2A and B, Table S2). The ferroptosis-related dataset was downloaded from the FerrDb database, and 281 genes were included in the suppressor dataset, 298 genes were included in the inhibitor dataset, and 12 genes were included in the marker dataset. A total of 396 human ferroptosis-related genes were obtained after determining the intersections (Table S3). The ferroptosis-related genes were intersected with the DEGs analyzed in each of the two datasets to obtain 45 FR-DEGs in the knee cartilage and 30 FR-DEGs in the knee synovium (Figure 2C and D). After intersecting the FR-DEGs in the knee cartilage and synovium, we identified 17 FR-DEGs (Figure 2E-G).
 |
Figure 2 Identification of FR-DEGs. (A and B) The volcano plot of differentially expressed genes(DEGs) in GSE11407 and GSE55235. (C and D) Venn diagram showing the overlap of genes between DEGs and ferroptosis-related genes in FerrDb database. (E) Venn diagram showing the overlap of co-expressed ferroptosis genes between GSE11407 and GSE55235. (F and G) Clustered heatmap of ferroptosis-related DEGs (FR-DEGs) in GSE11407 and GSE55235. |
Correlation Analysis and Functional Enrichment Analysis of FR-DEGs
Correlation analysis revealed a significant correlation between 17 DEGs related to ferroptosis across the two datasets (Figure 3A and B). In both datasets, positive correlations were dominant, and synergistic effects promoted or inhibited the expression of genes associated with ferroptosis. GO enrichment analysis revealed that FR-DGEs were significantly enriched in cellular responses to reactive oxygen species, oxidative stress, chemical stress, and regulation of adipocyte differentiation (Figure 3C). KEGG pathway enrichment analysis revealed that FR-DGEs were significantly enriched in several pathways, including the interleukin-17 (IL-17), hypoxia-inducible factor 1(HIF-1), tumor necrosis factor (TNF), and forkhead box o (FoxO) signaling pathways (Figure 3D). The clustering tree showed five enriched signaling pathway clusters: hepatitis human herpes virus infection, oxytocin signaling pathway, FoxO and HIF-1 signaling pathways, C-type IL-17 lectin receptor, and AGE-RAGE leishmaniasis diabetic complications. The second and third clusters were significantly associated with apoptosis and immune inflammatory responses and included pathways such as the FoxO and HIF-1, IL-17, and TNF signaling pathways, which are closely related to the FR-DEGs in this study (Figure 3E).
 |
Figure 3 Correlation analysis and functional enrichment analysis of FR-DGEs. (A and B) Correlation heatmap of 17 FR-DEGs in GSE114007 and GSE55235,*P<0.05,**P<0.01,***P<0.001. (C) GO enrichment analysis. (D and E) KEGG enrichment analysis.BP:biological process;CC:biological process;MF:molecular function. |
Construction of the PPI Network
A PPI network of 17 FR-DEGs was constructed using the STRING database. The network was imported into Cytoscape software and optimized to produce a final PPI network that contained 14 nodes and 28 edges (Figure 4A and B). The MCODE plugin identified a major functional module containing JUN, IL6, PTGS2, CDKN1A, ZFP36, and ATF3 (Figure 4C). In addition, the MCC algorithm identified the top ten core target genes in the network, including IL6, JUN, ATF3, PTGS2, CDKN1A, ZFP36, NR4A1, GDF15, CYBB, and KLF2 (Figure 4D).
 |
Figure 4 Construction of the PPI network.(A and B) PPI network for 17 FR-DEGs constructed by Cytoscape, isolated nodes were removed.(C)Module genes identified by MCODE plugin. (D)The top 10 core target genes identified based on the MCC algorithm in cytohubba plugin. Proteins are represented by nodes, and protein interactions are represented by edges. Node color indicates gene expression, with Orange for up-regulated and green for down-regulated expression. Node size corresponds to the degree value, with larger nodes indicating higher degrees. |
Identification of Characterized Genes
LASSO regression analysis was conducted on the two training sets to identify the marker genes. In GSE114007, 10 marker genes (JUN, ATF3, CDKN1A, ARNTL, PLIN2, ZFP36, KIF20A, CYBB, MT1G, and DPP4; Figure 5A) were identified out of the 17 FR-DEGs, whereas in GSE55235, nine marker genes (ATF3, CDKN1A, KLF2, ARNTL, PLIN2, JUN, KIF20A, PDK4, and MT1G; Figure 5B) were identified. Subsequently, the target genes identified by the MCODE plug-in and MCC algorithm intersected with the marker genes obtained by LASSO analysis, resulting in the identification of three signature genes-JUN, ATF3, and CDKN1A (Figure 5C).
 |
Figure 5 Identification of characterized genes. (A and B) LASSO logistic regression algorithm of FR-DEGs in GSE114007 and GSE55235.(C)The intersection of LASSO, MCODE and cytohubba. |
Validation of the Feature Genes
In the training set, the expression levels of three signature genes (JUN, ATF3, and CDKN1A) were downregulated in comparison to the normal group (Figure 6A and B), and the expression levels of the signature genes in the three validation sets were also consistent with the results in the training set (Figure 6C-E), indicating the potential influence of the signature genes on the development of OA. Meanwhile, this study assessed the accuracy and diagnostic value of the signature genes on OA progression. In the GSE114007 dataset, the AUC values were 0.972, 0.994, and 0.975 for the ROC curves of JUN, ATF3, and CDKN1A, respectively, and the AUC value was 1 in the constructed logistic regression model (95% CI: 1.000–1.000) (Figure 7A). In the GSE55235 dataset, the AUC values were 0.990, 0.990 and 1 for the ROC curves of JUN, ATF3, and CDKN1A, respectively, and the AUC value for the constructed logistic regression model was 1 (95% CI: 1.000–1.000) (Figure 7B). Additionally, in the three validation sets, ROC curve analysis and logistic regression model construction were performed for the signature genes to validate the results of the signature genes in the training set (Figure 7C-E), indicating that the signature genes JUN, ATF3, and CDKN1A have good diagnostic value for the development of OA.
 |
Figure 6 Differential expression analysis of the characterized genes. Different expression of JUN, ATF3, and CDKN1A in OA and Control samples in the (A and B) train set and (C-E) external verification set. |
 |
Figure 7 Validation of the characterized genes. The ROC curve and the diagnostic prediction model of JUN, ATF3, and CDKN1A in the (A and B) train set and (C-E) external verification set. |
Correlation of the Signature Genes with Immune Cells
This study investigated the dissimilarities in the immune microenvironment between the articular cartilage and synovial membrane of patients with OA and normal individuals using the CIBERSORT algorithm. Violin plots illustrate the differences in immune cell expression between articular cartilage and normal cartilage in OA patients as well as between synovial membrane and normal synovial membrane in OA patients. Higher expression levels of macrophages and lower expression levels of eosinophils were observed in the disease group compared to the normal group for GSE114007 (Figure 8A). Higher expression levels of mast cells and lower expression of T cells and NK cells were observed in the disease group compared to the normal group for GSE55235 (Figure 8B).Furthermore, the correlations between signature genes and immune cells revealed that in the GSE114007 dataset, JUN and CDKN1A were positively correlated with monocytes, ATF3 was negatively correlated with B cells and positively correlated with dendritic cells, and CDKN1A was negatively correlated with T cells (Figure 8C). Such correlations in the GSE55235 dataset revealed that ATF3 was significantly and negatively correlated with plasma cells while CDKN1A was positively correlated with T cells (Figure 8D).
 |
Figure 8 Immune infiltration analysis and correlation of the signature genes with immune cells. (A and B) Differential analysis of the 22 immune cells between the articular cartilage and synovial membrane of patients with OA and normal individuals in GSE11407 and GSE55235. (C and D) Correlation analysis between the signature genes and immune cells, red represents positive correlation and blue represents negative correlation,*P<0.05,**P<0.01,***P<0.001. |
Gene Set Enrichment Analysis of the Signature Genes
GSEA results indicated that the signature genes present in the cartilage were majorly enriched in immune and inflammatory responses, including cell adhesion molecules, cytokine receptor interactions, and systemic lupus erythematosus (Figure 9A). The signature genes of the synovial membrane were enriched in several biochemical pathways, including GSH metabolism, tricarboxylic acid cycle, pantothenate and coenzyme A biosynthesis, and the P53 signaling pathway (Figure 9B).
 |
Figure 9 GSEA results showed that the signature genes in cartilage (A) were mainly enriched in cell adhesion molecules, cytokine receptor interaction and systemic lupus erythematosus.The featured genes in synovium (B) were enriched for amino acid metabolism, citric acid cycle, pantothenate and coenzyme a biosynthesis, and P53 signaling pathway. The top six enriched signaling pathways of the featured genes are shown in the panel (A and B). |
Construction of Feature Genes ceRNA Network
The software miRanda, miRDB, and TargetScan predicted that 90 miRNAs corresponded to the three signature genes (Table S4). The lncRNAs corresponding to the 90 miRNAs were predicted using the spongeScan database (Table S4), and the mRNA-miRNA-lncRNA ceRNA network was constructed using Cytoscape (Figure 10). miR-1972, miR-665 and miR-181a-2-3p in the ceRNA network could both affect the three signature genes separately and competitively bind the above three miRNAs through FAM95B1 and RP5-894D12.5 in the lncRNAs, thus affecting signature gene expression.
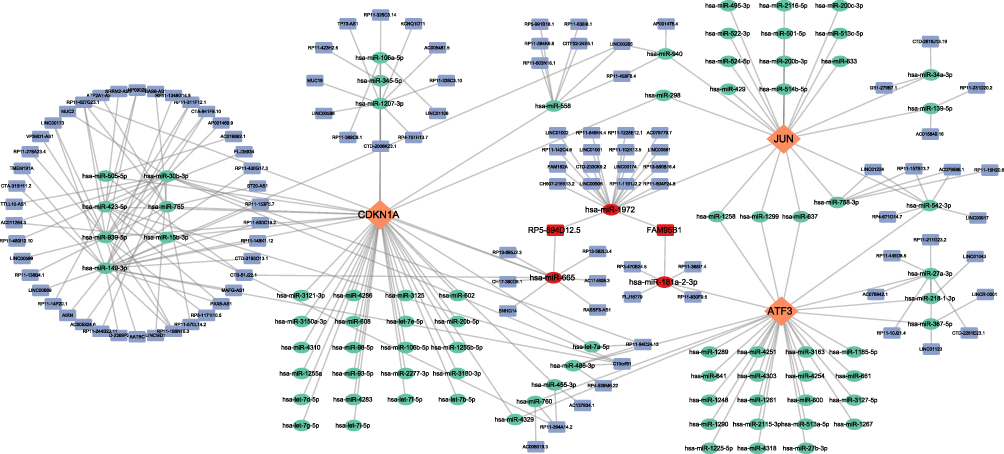 |
Figure 10 Construction of the feature genes ceRNA network.The network comprises eigengenes, their corresponding miRNAs, and lncRNAs.The red oval represents three important miRNAs: hsa-miR-1972, hsa-miR-665, and hsa-miR-181a-2-3p, the red square represents two significant lncRNAs: FAM95B1 and RP5-894D12.5. Diamond, Orange: signature gene; oval, green: miRNA; square, blue: lncRNA. |
Morphological Observation of Knee Joint Cartilage in OA Mice
Hematoxylin and eosin staining of the sections revealed normal development of the cartilage layer in mice from the control group. The cartilage exhibited uniform thickness, round chondrocytes, and a regular arrangement. Furthermore, the tidal lines were clearly visible. The articular cartilage structure of mice in the OA group exhibited disorders, severe tissue defects, and thinning of the cartilage layer (Figure 11A). The Mankin score in the OA group was higher than that in the control group (Figure 11B). The results demonstrated that the mice in the OA group developed OA lesions after destabilizing medial meniscal surgery.
 |
Figure 11 H&E staining shows that compared with the control group, the knee joint cartilage of mice in the OA group showed significant cartilage degradation(A). Mankin score in OA group was higher than that in control group(B). The results of Western blot (C) and qRT-PCR (D and E) showed that the expression levels of JUN, ATF3, CDKN1A and GPX4 in the articular cartilage and synovial membrane of OA mice were lower than those in the normal group, *P<0.05, ***P<0.001. |
Occurrence of Ferroptosis and Expression of the Signature Genes in OA Mice
The mechanism underlying ferroptosis in OA remains unclear. This study aimed to examine the expression of GPX4 in the articular cartilage and synovium of animals and clinical patients to verify the occurrence of ferroptosis mediated by GPX4 in OA. We also performed animal experiments to detect the expression level of the signature genes, which were screened using bioinformatics, to verify their accuracy and reliability in OA. The WB and qRT-PCR results showed that the expression levels of GPX4 in the articular cartilage and synovial membrane of OA mice were lower than those in the normal group, which reflected the occurrence of ferroptosis in OA in the joint and synovial membrane at the same time. The expression levels of the signature genes JUN, ATF3, and CDKN1A were significantly lower than those in the normal group (Figure 11C-E). Furthermore, immunohistochemical analysis revealed a downregulation in the expression levels of JUN and ATF3 in the cartilage and synovial tissues of OA mice compared to the normal group. Additionally, the expression level of CDKN1A was also found to be downregulated in the OA cartilage. (Figure 12A-C). The results demonstrate the precision and diagnostic significance of this study in screening for signature genes of ferroptosis in OA.
 |
Figure 12 Immunohistochemistry results indicated that the expressions of JUN, ATF3 and CDKN1A were down-regulated in the OA group compared to the control mice. (A)Representative immunohistochemistry images of JUN, ATF3 and CDKN1A in the control and OA groups. (B and C) Quantitative analysis, *P<0.05, **P<0.01. |
Assay of IL-1β and TNF-α Levels in the Cartilage and Synovial Tissue of Clinical Patients
Proinflammatory cytokines, such as IL-1β and TNF-α, are commonly found in the inflammatory environment of OA. To better differentiate between the clinical OA and control groups, we performed qRT-PCR assays to analyze the gene expression levels of the inflammatory factors IL-1β and TNF-α in cartilage and synovial tissues. The results indicated that the clinical OA group exhibited increased expression levels of IL-1β and TNF-α in both the synovial membrane and cartilage tissue in comparison with that of the clinical control group. These findings suggested that the clinical OA group experienced inflammatory changes in the synovial membrane and cartilage tissue while the clinical control group did not exhibit such signs of OA (Figure 13A).
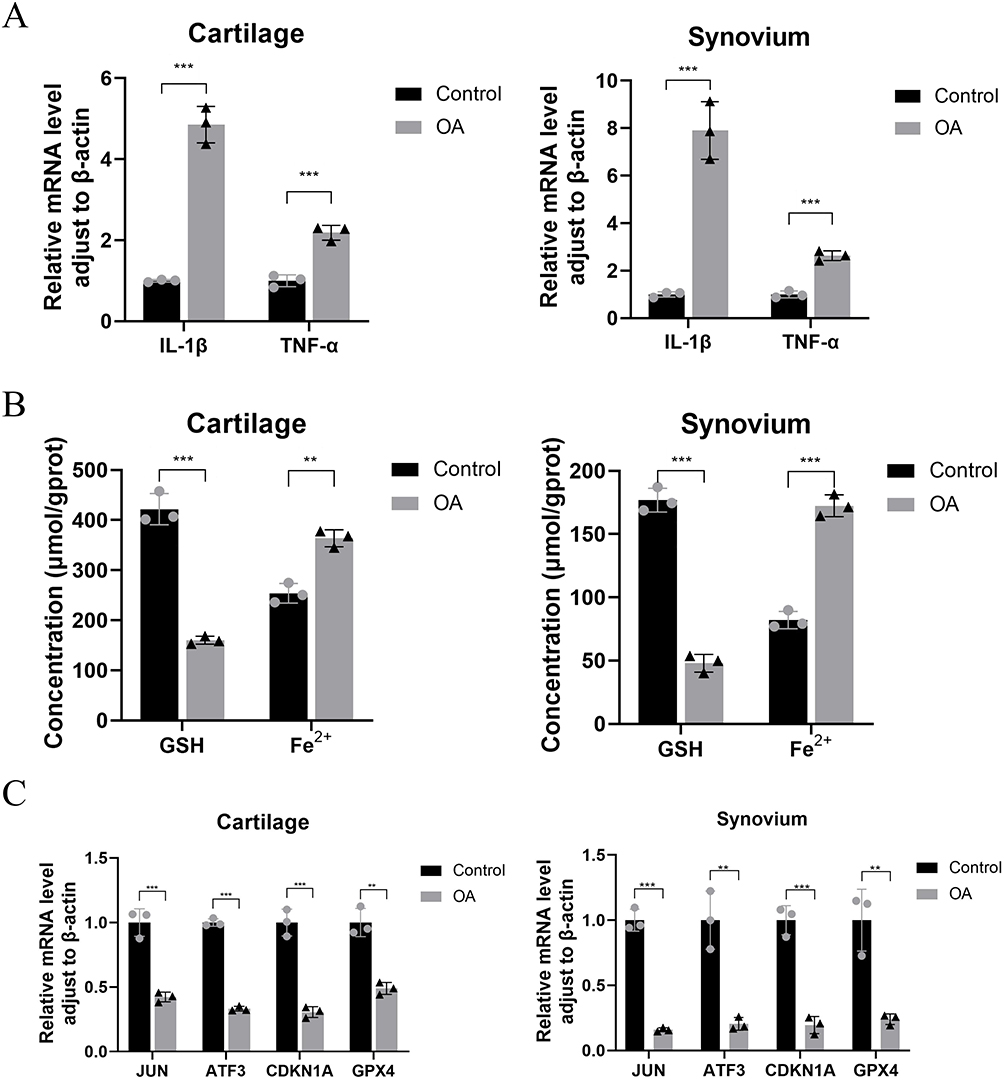 |
Figure 13 The qRT-PCR results showed that the expression levels of IL-1β and TNF-α in the articular cartilage and synovium of OA patients were higher than those in the normal group(A). The results of biochemical testing (B) and qRT-PCR (C) showed that the GSH content in the articular cartilage and synovium of patients with OA was decreased, while the ferrous ion content increased, as compared to the control group.The expression levels of JUN, ATF3, CDKN1A, and GPX4 were reduced,**P<0.01, ***P<0.001. |
Contents of Ferrous Iron and GSH in OA Cartilage and Synovial Tissue and Expression of Ferroptosis Signature Genes
After confirming the presence of inflammatory changes in the cartilage and synovial tissue, we analyzed the levels of ferrous iron and GSH and the expression of signature genes in the clinical tissue samples. Compared to the clinical control group, the clinical OA group exhibited an increase in ferrous iron content in both the cartilage and synovial tissue and a decrease in GSH content (Figure 13B). The qRT-PCR results revealed that the expression of JUN, ATF3, CDKN1A, and GPX4 in both the synovium and cartilage of the clinical OA group was lower than that of the clinical control group (Figure 13C). These results provide additional clinical evidence supporting the occurrence of ferroptosis in both the joints and synovium of patients with OA. Furthermore, the identification of signature genes associated with ferroptosis were accurate and have diagnostic value.
Targeted Interaction Between miR-1972 and JUN
To further investigate the molecular mechanism of the ceRNA network, we measured the expression levels of RP5-894D12.5, FAM95B1, miR-665, miR-1972, and miR-181a-2-3p in the synovium and cartilage of clinical samples using qRT-PCR. The results indicated a downregulation in the expression of RP5-894D12.5 and FAM95B1 in both the synovium and cartilage of the clinical OA group compared to the clinical control group (Figure 14A and B). In contrast, the expression of miR-1972 was upregulated in both the synovium and cartilage in the OA group (Figure 14C). No significant differences were observed in the expression levels of the remaining genes. The predictions of the ceRNA network and results of the qRT-PCR analysis of ferroptosis signature genes indicated that a competitive binding relationship occurs among RP5-894D12.5, FAM95B1, miR-1972, and JUN in the context of OA.
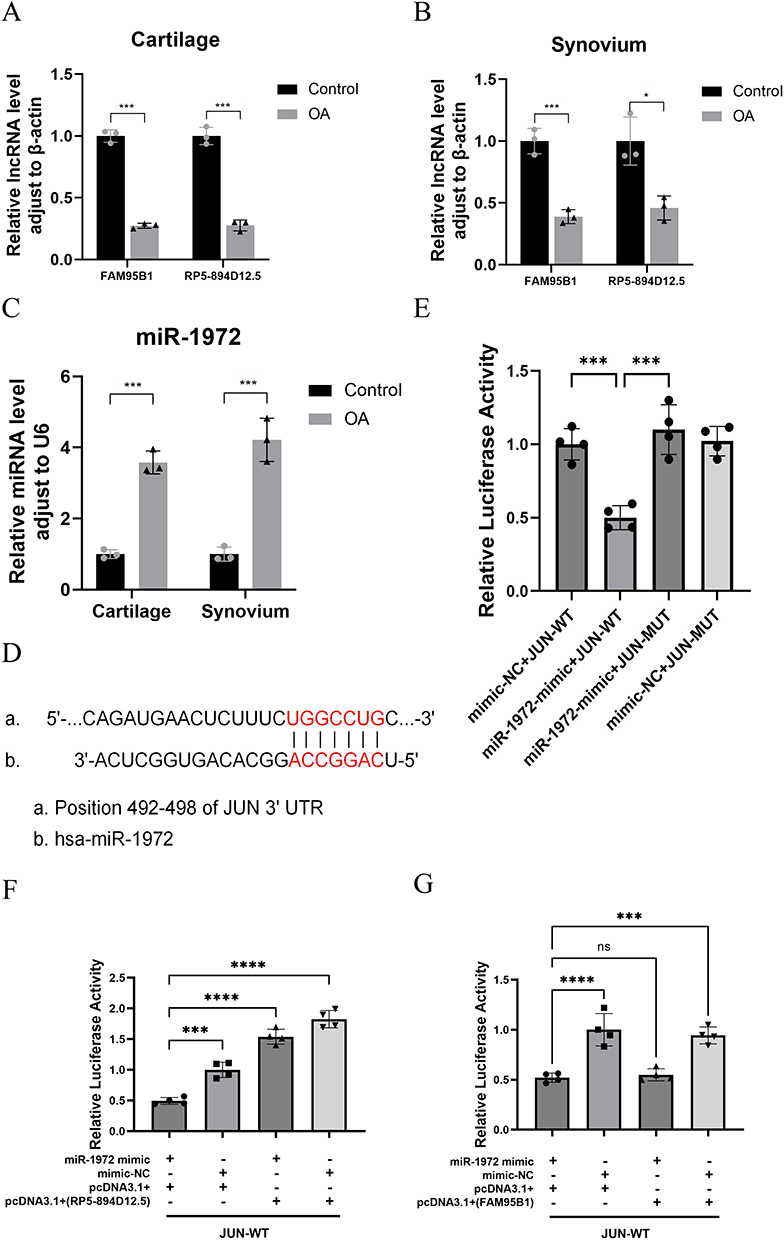 |
Figure 14 A ceRNA network regulatory mechanism exists between RP5-894D12.5, miR-1972, and JUN. The qRT-PCR results showed that compared with the control group, there were differences in the expression of FAM95B1, RP5-894D12.5 (A and B), and miR-1972 (C) in the cartilage and synovium of clinical OA patients. (D) Predicted interaction site between JUN and miR-1972. (E) The relative luciferase activity in 293T cells after co-transfection of miR-1972 mimic, mimic NC with JUN-WT and JUN-MUT was measured. (F and G) The relative luciferase activity in 293T cells after co-transfection of JUN-WT and MUT plasmids with miR-1972 mimics, mimic NC, overexpression vectors (RP5-894D12.5, FAM95B1) or empty vector pcDNA3.1 (+) was measured. *P<0.05, ***P<0.001, ****P<0.0001. |
To confirm the specific interaction between miR-1972 and JUN, we generated JUN luciferase reporter vectors that incorporated wild-type or mutant miR-1972 binding sites (Figure 14D). The dual-luciferase reporter gene assay showed that miR-1972 mimics significantly inhibited the relative luciferase activity of JUN-WT compared to co-transfection with mimic NC and JUN-WT, mimic NC and JUN-MUT, or miR-1972 mimics and JUN-MUT (Figure 14E). This observation suggests the presence of a specific targeting interaction between miR-1972 and JUN.
ceRNA Regulation Involving RP5-894D12.5, miR-1972, and JUN
Following confirmation that miR-1972 targets JUN, we co-transfected JUN-WT and MUT plasmids with miRNA mimics, mimic NC, lncRNA overexpression vector, or lncRNA empty vector into 293T cells. The results indicated that the regulation of the target gene JUN 3’UTR by miR-1972 is weakened when transferred into the RP5-894D12.5 overexpression vector compared to the RP5-894D12.5 empty vector control group (Figure 14F). However, significant differences in the regulation of the target gene JUN 3’UTR by miR-1972 were not observed after transfer into the FAM95B1 overexpression vector compared with that observed after transfer into the FAM95B1 empty vector control (Figure 14G). The results revealed that ceRNA regulation occurred among RP5-894D12.5, miR-1972, and JUN. In summary, the RP5-894D12.5/miR-1972/JUN axis is a potential ceRNA regulatory axis that may play a key role in the occurrence and progression of OA.
Discussion
Previous studies of OA suggested that cartilage lesions are the main cause of OA. However, recent research has shown that OA is a multifaceted disease with various causative factors beyond joint wear and tear.20 Synovial inflammation also plays an important role in joint deterioration by causing synovial endothelial hyperplasia and inflammatory cell infiltration, which stimulate the secretion of proinflammatory mediators by the cartilage and synovial cells.21 These changes contribute to the development of OA. Although synovial inflammation occurs at all stages of OA, further research is needed to understand the exact mechanism underlying the interaction between these two factors. Studies have suggested that ferroptosis plays an important role in cartilage degeneration and knee synovitis in patients with OA.22,23 Therefore, further studies on this subject may provide valuable insights into the pathological mechanisms and potential therapeutic targets of OA. In this study, we aimed to investigate the relationship among cartilage degeneration, joint synovitis, and ferroptosis in OA and identify potential therapeutic targets for treatment.
Compared with previous studies,24–26 this study has two distinct advantages. First, while previous studies have only investigated the correlation between synovial or cartilaginous tissue and ferroptosis, this study performed a more comprehensive analysis by investigating the potential association among all three factors. Second, this study validated the presence of ferroptosis in OA and the expression of genes characteristic of OA in animals, thereby providing robust evidence. In this study, 17 disease-associated ferroptosis genes were screened using GEO and ferroptosis databases, and they were strongly correlated in the training set. GO and KEGG enrichment analyses revealed that these genes were significantly associated with cellular responses to reactive oxygen species, oxidative stress, adipocyte differentiation, and several immune and inflammatory pathways, including the IL-17, HIF-1, and TNF pathways.
To identify ferroptosis signature genes specifically linked to OA, we used a combination of the MCODE, cytoHubba, and LASSO algorithms to identify the JUN, ATF3, and CDKN1A signature genes. Analysis of the differential expression levels in both the training and validation sets indicated that these genes were underexpressed. Furthermore, ROC curves for the signature genes demonstrated a promising diagnostic value for OA. The JUN gene encodes c-JUN protein, which can regulate the expression of proinflammatory factors in cells such as TNF-α and interleukin-1 (IL-1), which affects the synthesis of proteoglycans.27 In addition, Wang showed that c-JUN is involved in cellular fever and activation of the NLRP3 inflammasome.28 As a downstream effector of the Jun N-terminal kinase pathway, c-JUN plays an important role in programmed cell death, including necrosis, ferroptosis, burns, and autophagy.29 Compared with the S73A mutant of the non-O-glcnac acylated form of JUN, overexpression of JUN-wt can induce the transcription of PSAT1 and CBS, thereby inhibiting ferroptosis. This suggests that JUN-mediated GSH synthesis via O-glcnac acylation is essential for resistance to ferroptosis.30 Inducing macrophage M2 polarization mediated by NRF2 can alleviate osteoarthritis, while Zhang’s research has shown that activating the c-JUN/NRF2-CBS signaling pathway can inhibit ferroptosis.31,32 Therefore, we proposed that JUN plays an essential role in the progression of OA and knee synovitis. CDKN1A, also known as p21WAF1/Cip1, mediates p53-dependent cell cycle arrest following DNA damage, and studies have shown that it responds to oxidative stress by inhibiting apoptosis.33,34 Tarangelo et al showed that p53-mediated CDKNIA expression delays the onset of ferroptosis.35 In addition, CDKNIA may affect peroxide metabolism via GSH.36 The stabilization of p53 and the induction of CDKN1A lead to the inhibition of ribonucleotide reductase (RNR) subunit expression, protecting intracellular GSH, limiting lipid peroxide accumulation, and preventing ferroptosis.37 Divya et al found that in the absence of p53, CDKN1A can also inhibit ferroptosis in cells. This may be related to the fact that CDKN1A’s inhibition of cyclin-dependent kinase (CDK) activity can produce a variety of effects that affect cell growth.38 Therefore, we hypothesized that in OA and joint synovitis, CDKNIA regulates ferroptosis through its involvement in both cell cycle processes and peroxide metabolism. ATF3 is a member of the ATF/cyclic AMP response element-binding protein family of transcription factors,39 and studies have demonstrated that it can directly affect the transcription of matrix metalloproteinase-13, which promotes collagen type II degradation, thus leading to an imbalance in cartilage homeostasis and loss of the extracellular matrix (ECM).40 In addition, ATF3 is involved in the regulation of cellular inflammatory, apoptosis, and stress responses.41,42 Reports have also indicated that ATF3 is involved in the regulation of cellular ferroptosis by acting on solute carrier family 7 member 11 (SLC7A11) and regulating systemic Xcin in a p53-independent manner, thereby affecting intracellular GSH levels. ATF3’s impact on GSH levels heightens the susceptibility of cells to (1S,3R)-RSL3-induced GPX4 inhibition, effectively regulating the process of ferroptosis.43 Additionally, ATF3 is capable of modulating the expression of GPX4, lowering lipid ROS levels, and bolstering cell viability. This regulatory mechanism effectively interrupts the downstream signaling pathways associated with ferroptosis.44
In conclusion, our results indicate that JUN, CDKN1A, and ATF3 play important roles in the interaction among OA, knee synovitis, and ferroptosis; however, the specific molecular mechanisms involved require further investigation. Our study investigated the expression levels of JUN, CDKN1A, ATF3, and GPX4 in the knee cartilage and synovium of both OA mice and patients with OA. The results demonstrated that OA significantly inhibited the expression of the aforementioned indicators in both the synovium and cartilage. This finding provides further validation of the accuracy and reliability of these signature genes. Additionally, we performed tests on the levels of GSH and ferrous iron in clinical cartilage and synovium samples. Our findings revealed a significant decrease in GSH content and an increase in ferrous iron content specifically within the samples obtained from the OA group. GPX4 is a GSH-regulated lipid repair enzyme that inhibits ferroptosis by reducing lipid peroxidation products and ROS accumulation.45 Evidence suggests that the inhibition of ferroptosis effectively attenuates the progression of OA.46 Furthermore, an abnormal accumulation of iron has been reported in the cartilage and synovial fluid of patients with OA.47 This finding provides further evidence of the occurrence of ferroptosis in both OA and synovitis.
To investigate the correlation between signature genes and immunity, we analyzed the differences in the immune microenvironment between the articular cartilage and synovium of patients with OA and normal subjects. We found that CDKN1A was positively correlated with T cells in synovial tissue but negatively correlated with T cells in cartilage tissue. In the early stages of OA, relevant immune cell infiltration occurs in both the synovium and peripheral blood and contributes to pathogenesis.48,49 Chondrocytes exhibit intricate interactions with diverse immune cells.50 Upon cartilage damage, immune cells infiltrate the affected tissue and release soluble inflammatory factors.51 The results of immune infiltration analysis also showed that macrophage expression levels were higher in the cartilage’s inflammatory environment. Macrophages are crucial in preserving the homeostasis of cartilage tissue.52 Injured chondrocytes create a pro-inflammatory microenvironment, driving macrophage M1 polarization and exacerbating cartilage destruction. Increased expression of type II collagen induces M2 polarization of macrophages, fostering anti-inflammatory responses.53–55 Furthermore, the absence of activated T cell nuclear factors leads to articular chondrocyte dysfunction and OA development.56 The inhibition of neutrophil-released elastase can retard the progression of OA and cartilage degeneration.57
Reports have suggested that some non-coding RNAs, including both miRNAs and lncRNAs, may affect OA as well as knee synovitis.58 Therefore, we established a signature gene ceRNA network. miR-1972, miR-665 and miR-181a-2-3p could affect both the 3 signature genes separately and through lncRNAs in FAM95B1 and RP5-894D12.5 competitively bound the above 3 miRNAs, thus affecting the expression of the signature genes. It was shown that miR-665 expression is decreased in the OA chondrocyte model, while overexpression of miR-665 significantly increased chondrocyte proliferation and alleviated chondrocyte inflammation, apoptosis and ECM degradation.59 The Wnt signaling pathway influences the progression of OA, and miR-665 modulates cell proliferation and apoptosis through its impact on the Wnt/β-Catenin signaling pathway.60,61 Blocking miR-1972 expression attenuated the production of synovial invasive vascular opacities in RA.17 Furthermore, rho-associated coiled-coil containing protein kinase 1, targeted by miR-1972, facilitates cartilage tissue development through the regulation of contraction and aggregation of human mesenchymal stem cells in cartilage induction.62,63 miR-181a-2-3p inhibits NOX4/p38, thus regulating apoptosis and ROS. Additionally, its exogenous expression inhibits PI3K, which in turn promotes chondrocyte proliferation.64,65 However, studies on miR-181a-2-3p and OA have not yet been reported. Based on our findings, it is suggested that these non-coding RNAs may be involved in the interaction between OA, knee synovitis and ferroptosis. The gene expression levels within the ceRNA network were assessed using qRT-PCR, which revealed notable differences in the expression levels of FAM95B1, RP5-894D12.5, miR-1972, and JUN. Based on ceRNA network predictions, a ceRNA regulatory mechanism may occur in OA that involves FAM95B1/miR-1972/JUN and RP5-894D12.5/miR-1972/JUN. Subsequently, we constructed a dual-luciferase reporter gene assay and verified the target interaction between miR-1972 and JUN. The results showed that the RP5-894D12.5/miR-1972/JUN axis may be a potential key ceRNA regulatory axis in OA; however, the specific molecular mechanism is still unclear. After transfection with the FAM95B1 overexpression vector, significant differences were not observed in the regulation of miR-1972 on the target gene JUN 3 ‘UTR. Our findings suggest that the RP5-894D12.5/miR-1972/JUN axis may be involved in the interaction among OA, knee synovitis, and ferroptosis.
This study has several limitations. First, the sample size is small. Second, the results need to be further validated and analyzed to identify the potential mechanisms of action in both in vivo and in vitro experiments. Third, IHC analysis failed to detect the expression of CDKN1A in the synovial membrane. We will expand the sample size, optimize experimental conditions, and explore other validation methods.
Conclusion
This study successfully identified and validated three signature genes, JUN, ATF3, and CDKN1A, as potential novel biomarkers for the diagnosis and treatment of OA. Moreover, our study highlights the therapeutic potential of targeting the RP5-894D12.5/miR-1972/JUN axis for patients with OA. In addition, this research explored the potential association of ferroptosis with cartilage and synovium in OA. Our future research will focus on regulating the expression of iron death-related genes to intervene in cartilage degeneration and synovial inflammation as a potential therapeutic approach for OA.
Abbreviations
OA, Osteoarthritis; ROC, Receiver operating characteristic; GPX4, Glutathione peroxidase 4; lipid ROS, lipid reactive oxygen species; IL-1β, Interleukin-1beta; IL-18, Interleukin-18; DEGs, Differentially expressed genes; FR-DEGs, Ferroptosis-related differentially expressed genes; GO, Gene ontology; KEGG, Kyoto Encyclopedia of Genes and Genomes; PPI, Protein-protein interaction; LASSO, Least Absolute Shrinkage Selection Operator; AUC, Area under the curve; CT, Cycle threshold; SD, standard deviation; CAM, Cell adhesion molecule; TAC, Tricarboxylic acid cycle; TNF-α, Tumor necrosis factor-α; IL-1, Interleukin 1; CDKN1A, Cyclin-dependent kinase inhibitor 1A; CREB, Cyclic AMP response element binding; ECM, Extracellular matrix; GSH, Glutathione; RNR, ribonucleotide reductase.
Data Sharing Statement
The datasets supporting the conclusions of this article are available in the GEO database (https://www.ncbi.nlm.nih.gov/geo/), FerrDB database (http://www.zhounan.org/ferrdb) and STRING database (https://cn.string-db.org/).
Ethics Statement
The animal study protocol was approved by Laboratory Animal Welfare and Ethics Committee of Henan University of Traditional Chinese Medicine (IACUC-202302028).
This study was approved by Ethics Committee of Henan province Hospital of TCM (No. 1506-01). The patient provided their written informed consent to participate in this study.
Acknowledgments
We would like to thank the Experimental Animal Center of Henan Provincial Hospital of Traditional Chinese Medicine for their help in this experiment.
Author Contributions
All authors made a significant contribution to the work reported, whether that is in the conception, study design, execution, acquisition of data, analysis and interpretation, or in all these areas; took part in drafting, revising or critically reviewing the article; gave final approval of the version to be published; have agreed on the journal to which the article has been submitted; and agree to be accountable for all aspects of the work.
Funding
This research was funded by National Natural Science Foundation of China (NSFC) (82374490), Henan Provincial Natural Science Foundation Project (grant number 222300420486, 232300420269), Henan Provincial Special Project on Scientific Research in Chinese Medicine (grant number 2021ZY2010, 2023ZYZD06, 2022ZY2026, 2019ZY2035), Program for Innovative Research Team (in Science and Technology) in University of Henan Province (24IRTSTHN040), Key Scientific Research Project of Higher Education Institution of Henan Province (24A360002).
Disclosure
The authors report no conflicts of interest in this work.
References
1. Hunter DJ, March L, Chew M. Osteoarthritis in 2020 and beyond: a Lancet Commission. Lancet. 2020;396(10264):1711–1712. doi:10.1016/s0140-6736(20)32230-3
2. Tschon M, Contartese D, Pagani S, Borsari V, Fini M. Gender and Sex Are Key Determinants in Osteoarthritis Not Only Confounding Variables. A Systematic Review of Clinical Data. J Clin Med. 2021;10(14). doi:10.3390/jcm10143178
3. Son KM, Hong JI, Kim DH, Jang DG, Crema MD, Kim HA. Absence of pain in subjects with advanced radiographic knee osteoarthritis. BMC Musculoskeletal Disorders. 2020;21(1):640. doi:10.1186/s12891-020-03647-x
4. Mobasheri A, Batt M. An update on the pathophysiology of osteoarthritis. Ann Phys Rehabil Med. 2016;59(5–6):333–339. doi:10.1016/j.rehab.2016.07.004
5. Musumeci G, Aiello FC, Szychlinska MA, Di Rosa M, Castrogiovanni P, Mobasheri A. Osteoarthritis in the XXIst century: risk factors and behaviours that influence disease onset and progression. Int J Mol Sci. 2015;16(3):6093–6112. doi:10.3390/ijms16036093
6. Sun X, Zhen X, Hu X, et al. Osteoarthritis in the Middle-Aged and Elderly in China: prevalence and Influencing Factors. Int J Environ Res Public Health. 2019;16(23). doi:10.3390/ijerph16234701
7. Dixon SJ, Lemberg KM, Lamprecht MR, et al. Ferroptosis: an iron-dependent form of nonapoptotic cell death. Cell. 2012;149(5):1060–1072. doi:10.1016/j.cell.2012.03.042
8. Yao X, Sun K, Yu S, et al. Chondrocyte ferroptosis contribute to the progression of osteoarthritis. J Orthopaedic Translation. 2021;27:33–43. doi:10.1016/j.jot.2020.09.006
9. Stockwell BR, Friedmann Angeli JP, Bayir H, et al. Ferroptosis: a Regulated Cell Death Nexus Linking Metabolism, Redox Biology, and Disease. Cell. 2017;171(2):273–285. doi:10.1016/j.cell.2017.09.021
10. van Vulpen LF, Roosendaal G, van Asbeck BS, Mastbergen SC, Lafeber FP, Schutgens RE. The detrimental effects of iron on the joint: a comparison between haemochromatosis and haemophilia. J Clin Pathol. 2015;68(8):592–600. doi:10.1136/jclinpath-2015-202967
11. Nieuwenhuizen L, Schutgens RE, van Asbeck BS, et al. Identification and expression of iron regulators in human synovium: evidence for upregulation in haemophilic arthropathy compared to rheumatoid arthritis, osteoarthritis, and healthy controls. Haemophilia. 2013;19(4):e218–27. doi:10.1111/hae.12208
12. Abusarah J, Bentz M, Benabdoune H, et al. An overview of the role of lipid peroxidation-derived 4-hydroxynonenal in osteoarthritis. Inflammation Res. 2017;66(8):637–651. doi:10.1007/s00011-017-1044-4
13. Qiu L, Luo Y, Chen X. Quercetin attenuates mitochondrial dysfunction and biogenesis via upregulated AMPK/SIRT1 signaling pathway in OA rats. Biomed Pharmacothe. 2018;103:1585–1591. doi:10.1016/j.biopha.2018.05.003
14. Yang W, Wang Y, Zhang C, et al. Maresin1 Protect Against Ferroptosis-Induced Liver Injury Through ROS Inhibition and Nrf2/HO-1/GPX4 Activation. Front Pharmacol. 2022;13:865689. doi:10.3389/fphar.2022.865689
15. Su G, Yang W, Wang S, Geng C, Guan X. SIRT1-autophagy axis inhibits excess iron-induced ferroptosis of foam cells and subsequently increases IL-1Β and IL-18. Biochem. Biophys. Res. Commun. 2021;561:33–39. doi:10.1016/j.bbrc.2021.05.011
16. Glasson SS, Blanchet TJ, Morris EA. The surgical destabilization of the medial meniscus (DMM) model of osteoarthritis in the 129/SvEv mouse. Osteoarthritis Cartilage. 2007;15(9):1061–1069. doi:10.1016/j.joca.2007.03.006
17. Chen Y, Dang J, Lin X, et al. RA Fibroblast-Like Synoviocytes Derived Extracellular Vesicles Promote Angiogenesis by miRNA-1972 Targeting p53/mTOR Signaling in Vascular Endotheliocyte. Front Immunol. 2022;13:793855. doi:10.3389/fimmu.2022.793855
18. Ji Q, Zheng Y, Zhang G, et al. Single-cell RNA-seq analysis reveals the progression of human osteoarthritis. Ann Rheumatic Dis. 2019;78(1):100–110. doi:10.1136/annrheumdis-2017-212863
19. Mankin HJ, Johnson ME, Lippiello L. Biochemical and metabolic abnormalities in articular cartilage from osteoarthritic human hips. III. Distribution and metabolism of amino sugar-containing macromolecules. J Bone Joint Surg Am. 1981;63(1):131–139.
20. Jørgensen AEM, Kjær M, Heinemeier KM. The Effect of Aging and Mechanical Loading on the Metabolism of Articular Cartilage. J Rheumatol. 2017;44(4):410–417. doi:10.3899/jrheum.160226
21. Wood MJ, Miller RE, Malfait AM. The Genesis of Pain in Osteoarthritis: inflammation as a Mediator of Osteoarthritis Pain. Clin Geriatric Med. 2022;38(2):221–238. doi:10.1016/j.cger.2021.11.013
22. Sun K, Guo Z, Hou L, et al. Iron homeostasis in arthropathies: from pathogenesis to therapeutic potential. Ageing Res Rev. 2021;72:101481. doi:10.1016/j.arr.2021.101481
23. Chang S, Tang M, Zhang B, Xiang D, Li F. Ferroptosis in inflammatory arthritis: a promising future. Front Immunol. 2022;13:955069. doi:10.3389/fimmu.2022.955069
24. Wang X, Liu T, Qiu C, et al. Characterization and role exploration of ferroptosis-related genes in osteoarthritis. Front Mol Biosci. 2023;10:1066885. doi:10.3389/fmolb.2023.1066885
25. Xia L, Gong N. Identification and verification of ferroptosis-related genes in the synovial tissue of osteoarthritis using bioinformatics analysis. Front Mol Biosci. 2022;9:992044. doi:10.3389/fmolb.2022.992044
26. Xu W, Wang X, Liu D, et al. Identification and validation of hub genes and potential drugs involved in osteoarthritis through bioinformatics analysis. Front Genetics. 2023;14:1117713. doi:10.3389/fgene.2023.1117713
27. Xu Y, Gu Y, Ji W, Dong Q. Activation of the extracellular-signal-regulated kinase (ERK)/c-Jun N-terminal kinase (JNK) signal pathway and osteogenic factors in subchondral bone of patients with knee osteoarthritis. Ann Translat Med. 2021;9(8):663. doi:10.21037/atm-21-1215
28. Wang QS, Luo XY, Fu H, Luo Q, Wang MQ, Zou DY. MiR-139 protects against oxygen-glucose deprivation/reoxygenation (OGD/R)-induced nerve injury through targeting c-Jun to inhibit NLRP3 inflammasome activation. J Stroke Cerebrovascular Dis. 2020;29(9):105037. doi:10.1016/j.jstrokecerebrovasdis.2020.105037
29. Fan J, Chen M, Cao S, et al. Identification of a ferroptosis-related gene pair biomarker with immune infiltration landscapes in ischemic stroke: a bioinformatics-based comprehensive study. BMC Genomics. 2022;23(1):59. doi:10.1186/s12864-022-08295-0
30. Chen Y, Zhu G, Liu Y, et al. O-GlcNAcylated c-Jun antagonizes ferroptosis via inhibiting GSH synthesis in liver cancer. Cell. Signalling. 2019;63:109384. doi:10.1016/j.cellsig.2019.109384
31. Zhang XY, Zhang H, Hu SJ, et al. NR0B1 suppresses ferroptosis through upregulation of NRF2/c-JUN-CBS signaling pathway in lung cancer cells. Am J Cancer Res. 2023;13(11):5174–5196.
32. Cao N, Wang D, Liu B, et al. Silencing of STUB1 relieves osteoarthritis via inducing NRF2-mediated M2 macrophage polarization. Mol Immunol. 2023;164:112–122. doi:10.1016/j.molimm.2023.11.010
33. Kang R, Kroemer G, Tang D. The tumor suppressor protein p53 and the ferroptosis network. Free Radic Biol Med. 2019;133:162–168. doi:10.1016/j.freeradbiomed.2018.05.074
34. Bi G, Liang J, Zhao M, et al. miR-6077 promotes cisplatin/pemetrexed resistance in lung adenocarcinoma via CDKN1A/cell cycle arrest and KEAP1/ferroptosis pathways. Mol Ther Nucleic Acids. 2022;28:366–386. doi:10.1016/j.omtn.2022.03.020
35. Tarangelo A, Magtanong L, Bieging-Rolett KT, et al. p53 Suppresses Metabolic Stress-Induced Ferroptosis in Cancer Cells. Cell Rep. 2018;22(3):569–575. doi:10.1016/j.celrep.2017.12.077
36. Maddocks OD, Berkers CR, Mason SM, et al. Serine starvation induces stress and p53-dependent metabolic remodelling in cancer cells. Nature. 2013;493(7433):542–546. doi:10.1038/nature11743
37. Tarangelo A, Rodencal J, Kim JT, Magtanong L, Long JZ, Dixon SJ. Nucleotide biosynthesis links glutathione metabolism to ferroptosis sensitivity. Life Sci Alliance. 2022;5(4):56.
38. Venkatesh D, Stockwell BR, Prives C. p21 can be a barrier to ferroptosis independent of p53. Aging. 2020;12(18):17800–17814. doi:10.18632/aging.103961
39. Ku HC, Cheng CF. Master Regulator Activating Transcription Factor 3 (ATF3) in Metabolic Homeostasis and Cancer. Front Endocrinol. 2020;11:556. doi:10.3389/fendo.2020.00556
40. Wang XM, Liu XM, Wang Y, Chen ZY. Activating transcription factor 3 (ATF3) regulates cell growth, apoptosis, invasion and collagen synthesis in keloid fibroblast through transforming growth factor beta (TGF-beta)/SMAD signaling pathway. Bioengineered. 2021;12(1):117–126. doi:10.1080/21655979.2020.1860491
41. Bambouskova M, Gorvel L, Lampropoulou V, et al. Electrophilic properties of itaconate and derivatives regulate the IκBζ-ATF3 inflammatory axis. Nature. 2018;556(7702):501–504. doi:10.1038/s41586-018-0052-z
42. Li X, Li Y, Yang X, et al. PR11-364P22.2/ATF3 protein interaction mediates IL-1β-induced catabolic effects in cartilage tissue and chondrocytes. J Cell & Mol Med. 2021;25(13):6188–6202. doi:10.1111/jcmm.16561
43. Wang L, Liu Y, Du T, et al. ATF3 promotes erastin-induced ferroptosis by suppressing system Xc(). Cell Death Differ. 2020;27(2):662–675. doi:10.1038/s41418-019-0380-z
44. Wang Y, Quan F, Cao Q, et al. Quercetin alleviates acute kidney injury by inhibiting ferroptosis. J Adv Res. 2021;28:231–243. doi:10.1016/j.jare.2020.07.007
45. Wei S, Qiu T, Yao X, et al. Arsenic induces pancreatic dysfunction and ferroptosis via mitochondrial ROS-autophagy-lysosomal pathway. J Hazard Mater. 2020;384:121390. doi:10.1016/j.jhazmat.2019.121390
46. Wang S, Li W, Zhang P, et al. Mechanical overloading induces GPX4-regulated chondrocyte ferroptosis in osteoarthritis via Piezo1 channel facilitated calcium influx. J Adv Res. 2022;41:63–75. doi:10.1016/j.jare.2022.01.004
47. Miao Y, Chen Y, Xue F, et al. Contribution of ferroptosis and GPX4’s dual functions to osteoarthritis progression. EBioMedicine. 2022;76:103847. doi:10.1016/j.ebiom.2022.103847
48. Rosshirt N, Trauth R, Platzer H, et al. Proinflammatory T cell polarization is already present in patients with early knee osteoarthritis. Arthritis Res Therapy. 2021;23(1):37. doi:10.1186/s13075-020-02410-w
49. Zhu W, Zhang X, Jiang Y, et al. Alterations in peripheral T cell and B cell subsets in patients with osteoarthritis. Clin Rheumatol. 2020;39(2):523–532. doi:10.1007/s10067-019-04768-y
50. Duan L, Liang Y, Xu X, Xiao Y, Wang D. Recent progress on the role of miR-140 in cartilage matrix remodelling and its implications for osteoarthritis treatment. Arthritis Res Therapy. 2020;22(1):194. doi:10.1186/s13075-020-02290-0
51. He S, Deng H, Li P, et al. Arthritic Microenvironment-Dictated Fate Decisions for Stem Cells in Cartilage Repair. Adv. Sci. 2023;10(27):e2207715. doi:10.1002/advs.202207715
52. Wu CL, Harasymowicz NS, Klimak MA, Collins KH, Guilak F. The role of macrophages in osteoarthritis and cartilage repair. Osteoarthritis Cartilage. 2020;28(5):544–554. doi:10.1016/j.joca.2019.12.007
53. Kraus VB, McDaniel G, Huebner JL, et al. Direct in vivo evidence of activated macrophages in human osteoarthritis. Osteoarthritis Cartilage. 2016;24(9):1613–1621. doi:10.1016/j.joca.2016.04.010
54. Yin J, Zeng H, Fan K, et al. Pentraxin 3 regulated by miR-224-5p modulates macrophage reprogramming and exacerbates osteoarthritis associated synovitis by targeting CD32. Cell Death Dis. 2022;13(6):567. doi:10.1038/s41419-022-04962-y
55. Wang FH, Hsieh CY, Shen CI, et al. Induction of type II collagen expression in M2 macrophages derived from peripheral blood mononuclear cells. Sci Rep. 2022;12(1):21663. doi:10.1038/s41598-022-25764-4
56. Zhang M, Theleman JL, Lygrisse KA, Wang J. Epigenetic Mechanisms Underlying the Aging of Articular Cartilage and Osteoarthritis. Gerontology. 2019;65(4):387–396. doi:10.1159/000496688
57. Wang G, Jing W, Bi Y, et al. Neutrophil Elastase Induces Chondrocyte Apoptosis and Facilitates the Occurrence of Osteoarthritis via Caspase Signaling Pathway. Front Pharmacol. 2021;12:666162. doi:10.3389/fphar.2021.666162
58. Kong H, Sun ML, Zhang XA, Wang XQ. Crosstalk Among circRNA/lncRNA, miRNA, and mRNA in Osteoarthritis. Front Cell Dev Biol. 2021;9:774370. doi:10.3389/fcell.2021.774370
59. Li N, Wang Y, Wu X. Knockdown of Circ_0037658 Alleviates IL-1β-Induced Osteoarthritis Progression by Serving as a Sponge of miR-665 to Regulate ADAMTS5. Front Genetics. 2022;13:886898. doi:10.3389/fgene.2022.886898
60. Cheng J, Li M, Bai R. The Wnt signaling cascade in the pathogenesis of osteoarthritis and related promising treatment strategies. Front Physiol. 2022;13:954454. doi:10.3389/fphys.2022.954454
61. Chen T-J, Zheng Q, Gao F, et al. MicroRNA-665 facilitates cell proliferation and represses apoptosis through modulating Wnt5a/β-Catenin and Caspase-3 signaling pathways by targeting TRIM8 in LUSC. Can Cell Inter. 2021;21(1):215. doi:10.1186/s12935-021-01913-z
62. Wang KC, Egelhoff TT, Caplan AI, Welter JF, Baskaran H. ROCK Inhibition Promotes the Development of Chondrogenic Tissue by Improved Mass Transport. Tissue Eng Part A. 2018;24(15–16):1218–1227. doi:10.1089/ten.TEA.2017.0438
63. Wang Y, Zeng X, Wang N, et al. Long noncoding RNA DANCR, working as a competitive endogenous RNA, promotes ROCK1-mediated proliferation and metastasis via decoying of miR-335-5p and miR-1972 in osteosarcoma. Mol Cancer. 2018;17(1):89. doi:10.1186/s12943-018-0837-6
64. Yao X, Zhang J, Jing X, et al. Fibroblast growth factor 18 exerts anti-osteoarthritic effects through PI3K-AKT signaling and mitochondrial fusion and fission. Pharmacol Res. 2019;139:314–324. doi:10.1016/j.phrs.2018.09.026
65. Chhabra R. let-7i-5p, miR-181a-2-3p and EGF/PI3K/SOX2 axis coordinate to maintain cancer stem cell population in cervical cancer. Sci Rep. 2018;8(1):7840. doi:10.1038/s41598-018-26292-w
 © 2024 The Author(s). This work is published and licensed by Dove Medical Press Limited. The
full terms of this license are available at https://www.dovepress.com/terms
and incorporate the Creative Commons Attribution
- Non Commercial (unported, 3.0) License.
By accessing the work you hereby accept the Terms. Non-commercial uses of the work are permitted
without any further permission from Dove Medical Press Limited, provided the work is properly
attributed. For permission for commercial use of this work, please see paragraphs 4.2 and 5 of our Terms.
© 2024 The Author(s). This work is published and licensed by Dove Medical Press Limited. The
full terms of this license are available at https://www.dovepress.com/terms
and incorporate the Creative Commons Attribution
- Non Commercial (unported, 3.0) License.
By accessing the work you hereby accept the Terms. Non-commercial uses of the work are permitted
without any further permission from Dove Medical Press Limited, provided the work is properly
attributed. For permission for commercial use of this work, please see paragraphs 4.2 and 5 of our Terms.
Recommended articles
Identification and Validation of CDKN1A and HDAC1 as Senescence-Related Hub Genes in Chronic Obstructive Pulmonary Disease
Yang J, Zhang MY, Du YM, Ji XL, Qu YQ
International Journal of Chronic Obstructive Pulmonary Disease 2022, 17:1811-1825
Published Date: 10 August 2022
Vancomycin Induced Ferroptosis in Renal Injury Through the Inactivation of Recombinant Glutathione Peroxidase 4 and the Accumulation of Peroxides
Yin X, Yang Q, Li H, Kang Y, Li Z
Drug Design, Development and Therapy 2023, 17:283-295
Published Date: 1 February 2023
Exploration and Validation of Potential Biomarkers and Therapeutic Targets in Ferroptosis of Asthma
Xing Y, Feng L, Dong Y, Li Y, Zhang L, Wu Q, Huo R, Dong Y, Tian X, Tian X
Journal of Asthma and Allergy 2023, 16:689-710
Published Date: 12 July 2023
Network Analysis of Osteoarthritis Progression Using a Steiner Minimal Tree Algorithm
Xie Y, Shao F, Ji Y, Feng D, Wang L, Huang Z, Wu S, Sun F, Jiang H, Miyamoto A, Wang H, Zhang C
Journal of Inflammation Research 2024, 17:3201-3209
Published Date: 18 May 2024
Ferroptosis in Osteoarthritis: Current Understanding
Liu Y, Zhang Z, Fang Y, Liu C, Zhang H
Journal of Inflammation Research 2024, 17:8471-8486
Published Date: 7 November 2024