Back to Journals » OncoTargets and Therapy » Volume 14
Bioinformatics Analysis of Choriocarcinoma-Related MicroRNA-Transcription Factor-Target Gene Regulatory Networks and Validation of Key miRNAs
Authors Peng X, Zhang Z, Mo Y, Liu J, Wang S ![]() , Liu H
, Liu H
Received 16 March 2021
Accepted for publication 15 June 2021
Published 29 June 2021 Volume 2021:14 Pages 3903—3919
DOI https://doi.org/10.2147/OTT.S311291
Checked for plagiarism Yes
Review by Single anonymous peer review
Peer reviewer comments 3
Editor who approved publication: Dr William C. Cho
Xiaotong Peng,1 Zhirong Zhang,1 Yanqun Mo,1 Junliang Liu,1 Shuo Wang,2 Huining Liu1
1Department of Gynaecology and Obstetrics, Xiangya Hospital, Central South University, Changsha, 410008, People’s Republic of China; 2Department of Orthopaedics, Shanghai Jiaotong University Affiliated Sixth People’s Hospital, Shanghai, 200233, People’s Republic of China
Correspondence: Huining Liu
Department of Gynecology and Obstetrics, Xiangya Hospital, Central South University, Changsha, 410011, Hunan, People’s Republic of China
Email [email protected]
Shuo Wang
Department of Orthopaedics, Shanghai Jiaotong University Affiliated Sixth People’s Hospital, Shanghai, 200233, People’s Republic of China
Email [email protected]
Objective: The aim of the current research was to construct a miRNA-transcription factor (TF)-target gene regulatory network in order to investigate the mechanism underlying choriocarcinoma and to verify the network through the overexpression or silencing of hub miRNAs in vitro.
Materials and Methods: A mRNA expression dataset and two miRNA expression datasets were analysed to identify differentially expressed genes (DEGs) and miRNAs (DEMs) between normal cells and choriocarcinoma cells. The top 400 upregulated and downregulated DEGs were identified as candidate DEGs, which were then mapped to construct protein–protein interaction (PPI) networks and select hub genes. Moreover, the DGIdb database was utilized to select candidate drugs for hub genes. Moreover, DEM target genes were predicted through the miRWalk2.0 database and overlaid with candidate DEGs to identify the differentially expressed target genes (DETGs). Furthermore, we established miRNA-TF-target gene regulatory networks and performed functional enrichment analysis of hub DEMs. Finally, we transfected mimics or inhibitors of hub DEMs into choriocarcinoma cells and assessed cell proliferation and migration to verify the vital role of hub DEMs in choriocarcinoma.
Results: A total of 140 DEMs and 400 candidate DEGs were screened from choriocarcinoma cells and normal cells. A PPI network of 400 candidate DEGs was established. Twenty-nine hub genes and 99 associated small molecules were identified to provide potential target drugs for choriocarcinoma treatment. We obtained 70 DETGs of DEMs derived from the intersection between predicted miRNA target genes and candidate DEGs. Subsequently, 3 hub DEMs were selected, and miRNA-TF-target gene regulatory networks containing 4 TFs, 3 TFs and 3 TFs for each network were constructed. The RT-PCR results confirmed that miR-29b-3p was highly expressed and that miR-519c-3p and miR-520a-5p were expressed at low levels in choriocarcinoma cells. The overexpression or silencing results suggested that 3 dysregulated hub DEMs jointly accelerated the proliferation and migration of choriocarcinoma.
Conclusion: Association of miRNA-TF-target gene regulatory networks may help us explore the underlying mechanism and provide potential targets for the diagnosis and treatment of choriocarcinoma.
Keywords: choriocarcinoma, hub miRNAs, transcription factors, regulatory network, bioinformatics
Introduction
Choriocarcinoma, which occurs secondary to hydatidiform moles, miscarriage, term pregnancy, preterm pregnancy, and ectopic pregnancy, is a highly aggressive and malignant trophoblastic neoplasm in the uterus.1 If left untreated, choriocarcinoma tends to rapidly spread to other organs to establish distant metastases via blood vessels, causing distant organ failure.2 Human chorionic gonadotropin (HCG) levels are the main diagnostic basis for gestational trophoblastic tumours. However, rising HCG concentrations can be observed in normal pregnancy, ectopic pregnancy, or gestational trophoblastic neoplasia, seriously affecting early screening and diagnosis of choriocarcinoma in the clinic.3 Therefore, it is necessary to elucidate the pathogenesis of choriocarcinoma and explore new markers for the early screening and diagnosis of choriocarcinoma.
MicroRNAs (miRNAs) are noncoding RNAs consisting of 20–25 nucleotides.4 miRNAs can regulate the posttranscriptional expression of target genes by binding to the 3ʹ-untranslated regions of messenger RNAs (mRNAs), leading to translational repression or mRNA cleavage.5 Increasing evidence has demonstrated that dysregulated miRNAs are involved in choriocarcinoma tumorigenesis, with altered expression patterns during tumour progression.6,7 For example, miR-34a significantly inhibits the proliferation and invasiveness of choriocarcinoma cells via regulation of the Notch pathway,8 and miR-21 promotes the progression of choriocarcinoma.9 These findings showed that miRNAs regulate the occurrence and progression of choriocarcinoma. Unfortunately, the mechanism by which miRNAs regulate choriocarcinoma has not been systematically elucidated.
Based on high-throughput sequencing data from Gene Expression Omnibus (GEO) databases, comprehensive microarray analysis was utilized to explore the molecular mechanism to identify differentially expressed genes (DEGs) and miRNAs (DEMs) as well as transcription factors (TFs) involved in initiation and progression for further experimental validation.10 In our study, we identified DEMs and DEGs in choriocarcinoma cells by analysing one mRNA dataset (GSE20510) and two miRNA datasets (GSE32346 and GSE130489) downloaded from GEO databases. The top 400 upregulated and downregulated DEGs were selected, and protein-protein interaction (PPI) network construction and functional enrichment analysis were performed. Twenty-nine hub genes were obtained from 400 DEGs, and drug-hub gene networks were established. Moreover, we screened 70 differentially expressed target genes (DETGs) of DEMs derived from the intersection between predicted miRNA target genes and candidate DEGs. MiRNA-target gene regulatory networks were visualized by Cytoscape software. In addition, miRPath v.3.0 helped us perform functional enrichment analyses of selected hub DEMs (miR-29b-3p, miR-519c-3p and miR-520a-5p). TFs related to hub DEMs from the interaction network were identified by the iRegulon plugin. From the results of the database tools described above, we evaluated the effect of hub DEMs on the proliferation and migration abilities of choriocarcinoma cell lines through the transfection of miRNA mimics or inhibitors. We hope that our findings may provide potential therapeutic targets for inhibiting tumorigenesis and improving the prognosis of choriocarcinoma.
Materials and Methods
Data Acquisition
After careful review and comparison, mRNA expression datasets (GSE2051011) along with miRNA expression from the GSE3234612 and GSE13048913 datasets were downloaded from the GEO database (https://www.ncbi.nlm.nih.gov/geo/) for subsequent analysis. The platform, variety of studies and proportions of choriocarcinoma cell samples and normal cell samples in each dataset are presented in Figure 1G. The above miRNA datasets were processed based on the GPL15497 and GPL26600 platforms. Hence, we normalized these data using R’s limma package.
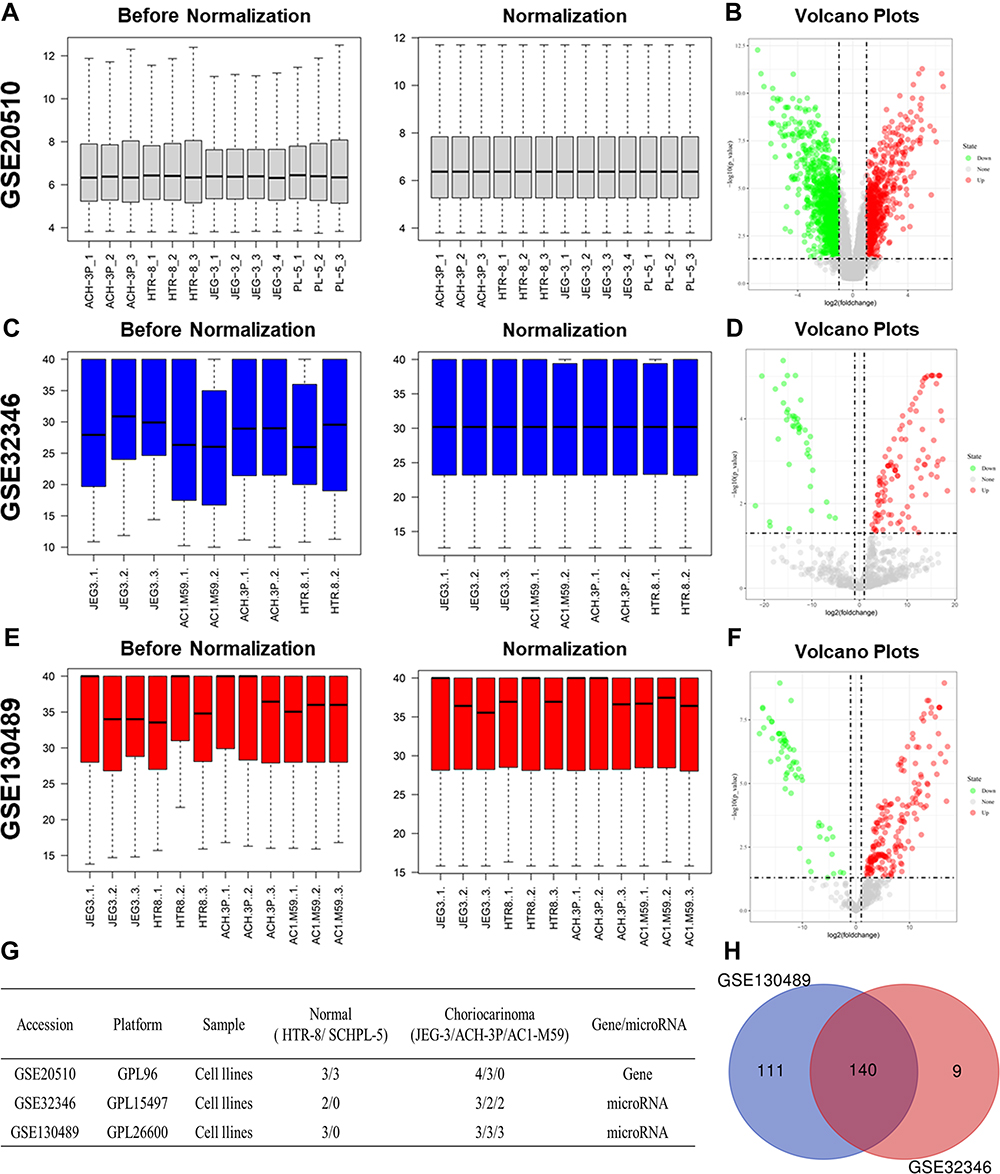 |
Figure 1 Identification of differentially expressed miRNAs (DEMs) in choriocarcinoma. The before and after normalization and volcano plots of GSE20510 (A and B), GSE32346 (C and D) and GSE130489 (E and F). Characteristics of mRNA and miRNA expression profiles of choriocarcinoma (G). Venn diagram based on the miRNA expression profile of choriocarcinoma (H). |
Screening of DEMs and DEGs
GEO2R (https://www.ncbi.nlm.nih.gov/geo/geo2r/) is an online analysis tool that allows for comparisons between choriocarcinoma cell samples and normal cell samples from normalized GEO datasets. The Benjamini and Hochberg false discovery rate (FDR) method was utilized to adjust the p-value to reduce false positivity. With the thresholds of adjusted p-value < 0.05 and |log2-fold change (FC)| > 1, the top 400 upregulated and downregulated given genes were selected as DEGs. Under the same conditions, DEMs were screened and analysed in overlapping sections of the GSE32346 and GSE130489 datasets through a Venn diagram to identify candidate DEMs.14 Heatmaps of DEMs and DEGs were visualized by TBtools, which is a toolkit that integrates various biological data handling tools.
Functional and Pathway Enrichment Analysis of DEGs
To further annotate the functions of DEGs, Gene Ontology (GO) and Kyoto Encyclopedia of Genes and Genomes (KEGG) pathways were analysed using ClueGO V2.5.1,15 with thresholds of p-value <0.0 5 and gene count > 3.
Construction of PPI Network and Analysis of Modules
The STRING database (http://www.bork.emblheidelberg.de/STRING/) is an online tool that can provide predictive and visual analysis of interactive relationships among DEGs. We established PPI networks with an interaction score ≥0.4 used as the threshold. Cytoscape software was utilized to screen the top 400 upregulated and downregulated DEGs and construct the PPI network. Additionally, degree cut-off = 2, max. depth = 100, node score cut-off = 0.2 and k-Core = 2 were adopted as the cut-off criteria for identifying hub genes through Molecular Complex Detection (MCODE) v1.5.1.16
Drug-Hub Gene Networks Analysis
The drug-gene interaction database (DGIdb, www.dgidb.org) is a web resource that presents drug-gene interactions from databases, web resources, etc. The list of hub genes was uploaded to the DGIdb to predict targeted drugs. Finally, the drug-gene networks were constructed by Cytoscape.
Prediction of Target Genes for DEMs and miRNA–Target Gene Regulatory Network Construction
miRWalk2.0 (http://zmf.umm.uni-heidelberg.de/apps/zmf/mirwalk2/) was used to predict potential target genes of candidate DEMs based on six bioinformatic algorithms (miRWalk,17 Pictar2,18 PITA,19 RNA22,20 RNAhybrid21 and TargetScan22). Then, overlapping sections among these target genes and the top 400 upregulated and downregulated DEGs were obtained for further analysis. The miRNA-target gene regulatory networks between relative DEMs and the overlaps were visualized by Cytoscape. Among the upregulated miRNAs in this network, we selected the miRNA with the largest number of reverse regulation genes as the hub DEM. The same operation was performed for downregulated miRNAs in this network. Finally, the hub DEMs were selected from among the upregulated and downregulated DEMs based on the number of reverse-regulated genes.
Functional and Pathway Enrichment Analysis of Hub DEMs
GO and KEGG pathway analyses of hub DEMs were performed using miRPath v3.0 (http://snf-515788.vm.okeanos.grnet.gr/). GO functional analysis was mainly classified into biological process (BP), cellular component (CC), and molecular function (MF) categories. The heatmaps of GO and KEGG pathway analyses were also visualized with a p-value < 0.05 as the threshold.
Establishment of the miRNA-TFs-Target Genes Networks
Gene regulatory networks are controlled by miRNAs and TFs in a dependent or independent manner.22 Therefore, further research on the regulatory relationship between TFs and miRNAs can help elucidate the underlying mechanism of tumorigenesis. We selected hub DEMs and predicted potential TFs related to them via the iRegulon plug-in.23 Relevant parameters were as follows: enrichment score threshold = 5.0, ROC threshold for AUC calculation = 0.05, rank threshold = 5000, minimum identity between orthologous genes = 0.05 and maximum FDR on motif similarity = 0.001. MiRNA-TF-target gene regulatory networks of hub DEMs were screened in Cytoscape.
Cell Culture and Transfection
The human trophoblast cell line HTR-8/SVneo and the choriocarcinoma cell lines JEG3 and JAR were purchased from American Type Culture Collection (ATCC) and cultured in RPMI 1640 medium (Gibco, USA) and MEM (Gibco, USA), respectively, containing 10% FEB, 100 U/mL penicillin, and 100 mg/mL streptomycin at 37°C in a humidified incubator with 5% CO2. The cells were seeded in 6-well plates at the appropriate density and then transfected with negative control (NC) or corresponding hub DEM mimics or inhibitors (50 nM) using Lipofectamine 3000 (Invitrogen, USA) according to the manufacturer’s instructions. The sequences were synthesized by GenePharma (Shanghai, China).
Total RNA Extraction and RT-PCR Validation
Total cellular RNA was extracted by the TRIzol Total RNA method. Then, the RNA was reverse transcribed into cDNA using the RevertAid™ H Minus First Strand cDNA Synthesis Kit. RT-PCR was carried out by using SYBR® Green MasterMix in an ABI PRISM® 7500 Sequence Detection System (Applied Biosystems Inc: Foster City, CA). The reaction conditions were as follows: 45 seconds at 95°C, 40 cycles for 30 seconds at 95°C, 45 seconds at 60°C, 60 seconds at 72°C and a final cycle for 300 seconds at 72°C. The accumulation of PCR products was monitored in real time, and simultaneous determination of cycle threshold (Ct) values was also conducted. Gene expression values were determined using the ΔΔCT method with normalization to GAPDH. The primers were purchased from Sangon Biotech (Shanghai, China).
Cell Proliferation Assay
CCK-8 and 5-ethynyl-2́-deoxyuridine (EdU) assays were conducted to assess the proliferation of HTR-8/SVneo and JEG3/JAR cells following the manufacturer’s protocol. After 24 h of mimic or inhibitor transfection, the cells were seeded into 24-well (for EdU assays) and 96-well (for CCK-8 assays) plates at a suitable density. After 24 h of culture, CCK-8 solution (Beyotime, China) was added to each well (10 μL/well) and cultured for 1 h at 37 °C in an incubator. Finally, the absorbance at 450 nm, as the optical density (OD) of the samples, was detected by spectrophotometry at different time points. In addition, the cells in 24-well plates were incubated in EdU solution (100 μL/well) for 2 h, and then, after cell fixation with 4% paraformaldehyde for 30 min, permeabilization with 1% Triton X-100 for 10 min and staining with Hoechst 33,342 for 10 min, microphotographs were obtained to calculate the positive cell rate by fluorescence microscopy.
Cell Migration Assay
After 24 h of mimic or inhibitor transfection, the cells were harvested with 0.25% trypsin and resuspended to obtain a serum-free suspension. A 300 μL cell suspension at an appropriate concentration was placed into the upper layer of the Transwell chamber. Cell medium with 20% FEB was incubated in the lower layer of the Transwell chamber to promote cell migration. After 24 h of culture, the cells in the upper chamber were removed using cotton swabs, and those that migrated to the chamber membranes were fixed with 4% paraformaldehyde and stained with 0.1% crystal violet. Five randomly selected microscopic views were obtained through a microscope and analysed by ImageJ software to count the number of cell migration.
Statistical Analysis
All the experiments were repeated three times, and the data are presented as the mean ± SD. Analysis of variance was utilized to compare different sample means. SPSS for Windows, version 22.0 was used for analyses. Statistical analysis of variance (ANOVA) was used for statistical analysis between each group. P< 0.05 was considered statistically significant.
Results
Identification of DEGs and DEMs in Choriocarcinoma
As indicated in Figure 1, normalization of the expression profile datasets was carried out through the preprocess Core package in RStudio, and is the results are shown in boxplots. Two normalized miRNA expression profiles and one mRNA expression profile were downloaded from the GEO database. A total of 22 choriocarcinoma cell samples and 12 normal trophoblast samples were included in further analysis. A total of 2114 DEGs (1381 unregulated and 733 downregulated genes) were identified in GSE20510 with the mentioned threshold. Genes whose |log2 FC| ranked in the top 400 upregulated and downregulated genes were chosen as candidate DEGs (Supplementary Table 1). With the same threshold set, 149 and 251 DEMs were identified in GSE32346 and GSE130489, respectively. Furthermore, 140 candidate DEMs were identified by Venn diagram analysis overlapping these two datasets (Figure 1H). LogFC of 140 candidate DEMs from GSE32346 and GSE130489 were displayed in Supplementary Table 2.
Functional and Pathway Analysis of DEGs
GO and KEGG pathway analyses were performed on the 400 candidate DEGs. As shown in Figure 2, BP-associated results indicated that candidate DEGs were particularly enriched in cell migration, extracellular matrix organization and regulation of cell population proliferation; CC-associated results showed that candidate DEGs were mainly enriched in basement membrane, extracellular matrix and tight junction; MF-associated results indicated that candidate DEGs were significantly enriched in regulation of peptidase activity, regulation of transferase activity and positive regulation of catalytic activity. Furthermore, KEGG pathway results demonstrated that candidate DEGs were primarily enriched in the focal adhesion, Wnt and PI3K-Akt signalling pathways. Significant results of the GO enrichment analysis and KEGG pathway analysis of candidate DEGs in choriocarcinoma are shown in Supplementary Tables 3 and 4.
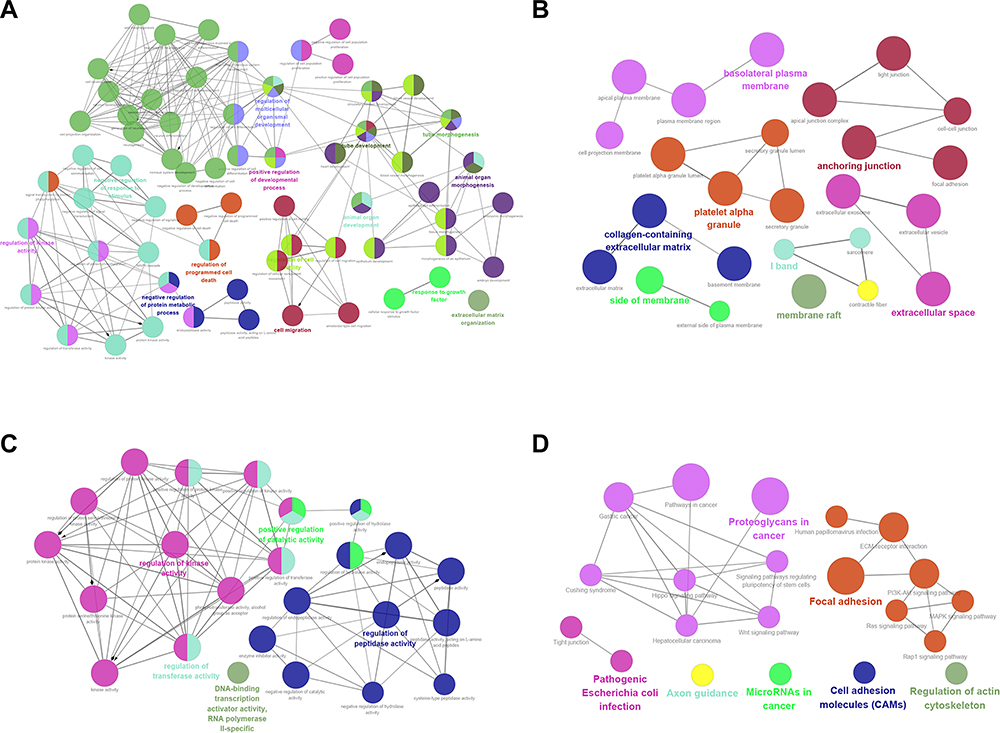 |
Figure 2 GO terms and KEGG pathway analysis of candidate DEGs in choriocarcinoma. (A) BP-associated category; (B) CC-associated category; (C) MF-associated category; (D) KEGG pathways. Abbreviations: BP, biological processes; CC, cellular component; MF, molecular function; KEGG, Kyoto Encyclopedia of Genes and Genomes. |
PPI Network Construction and Module Analysis
To identify potential interactions among 400 candidate DEGs, a PPI network was constructed through the STRING database and visualized by Cytoscape (Figure 3A). Furthermore, hub genes were validated by MCODE, and we obtained 14 cluster modules. The highest-rated module included 29 nodes and 243 edges and was subjected to GO and KEGG pathway analysis (Figure 3B). The hub genes were mainly abundant in 167 GO terms, including positive regulation of developmental process, cell migration, basement membrane, extracellular matrix, tight junction and regulation of transferase activity. In addition, KEGG pathway analysis indicated that these genes were abundant in focal adhesion, proteoglycans in cancer, the PI3K-Akt signalling pathway and pathways in cancer (Supplementary Table 5).
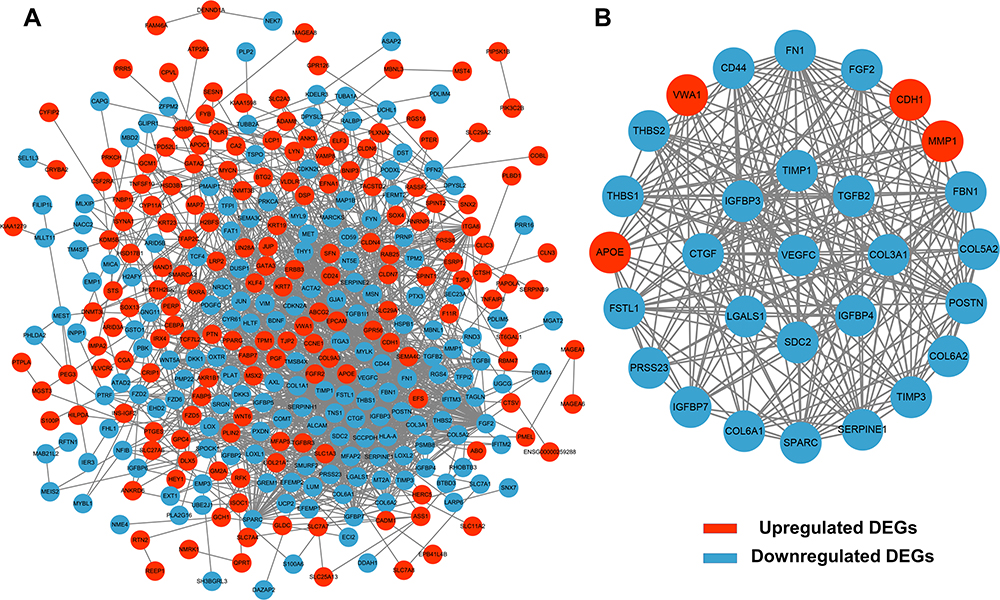 |
Figure 3 PPI network construction and module analysis. A total of 400 DEGs were visualized in the DEG PPI network (A). Module analysis using MCODE (B). The nodes represent proteins, and the edges represent the interaction of the proteins. Red nodes represent upregulated genes, and blue nodes represent downregulated genes. |
Drug-Gene Networks
A total of 99 potential drugs for treating choriocarcinoma patients were identified when the drug-gene interactions were explored using DGIdb (Supplementary Table 6). Additionally, drug-gene networks were constructed by Cytoscape (Figure 4). Most potential drugs might interact with hub genes either in unknown manners or as inhibitors.
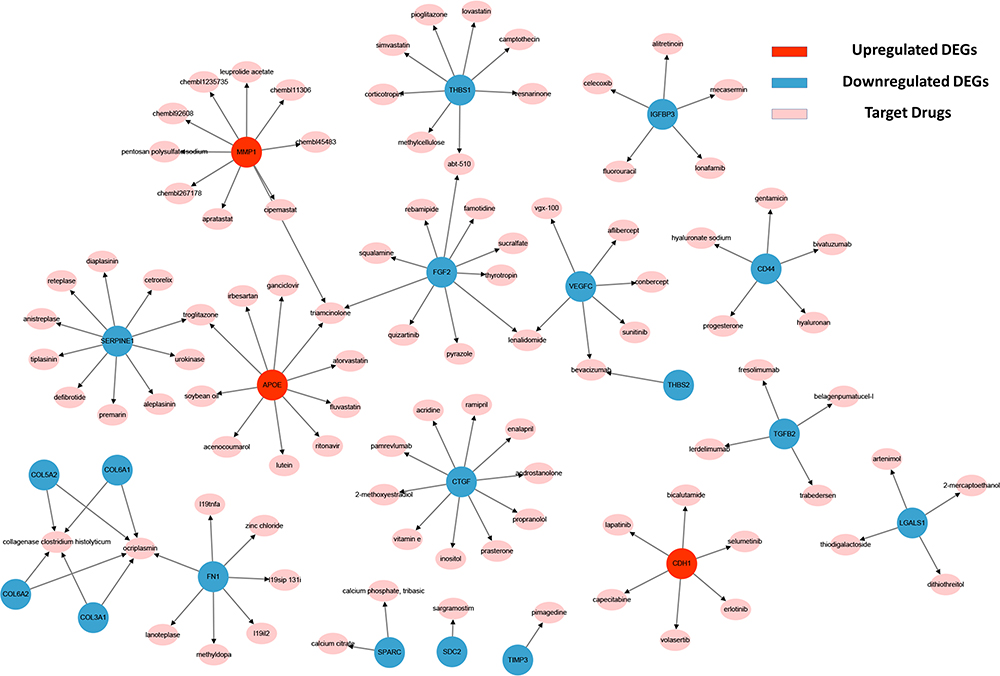 |
Figure 4 Regulatory networks of drug-hub gene interactions. Red nodes and blue nodes represent upregulated DEGs and downregulated DEGs, respectively. Pink nodes represent target drugs. |
Prediction of Target Genes for DEMs and miRNA–Target Gene Regulatory Network Establishment
Increasing evidence has demonstrated that miRNAs regulate tumorigenesis and progression mainly by binding to the 3ʹUTRs of mRNAs and thereby triggering degradation. MiRWalk2.0, a miRNA-target online tool, was implemented to predict target genes of candidate DEMs. After calculation by six bioinformatics algorithms, 2002 potential target genes were obtained and intersected with 400 candidate DEGs. Seventy overlapping genes, including 34 upregulated genes and 36 downregulated genes, were identified as DETGs for further analysis (Figure 5 and Supplementary Table 7). These DETGs were subjected to GO and KEGG pathway analyses and significantly enriched in blood vessel development, regulation of cell adhesion, cell migration, negative regulation of cell proliferation, and chemotaxis (Supplementary Table 8). The miRNA-target gene regulatory network between DEMs and DETGs was visualized using Cytoscape. As indicated in Figure 6, diamonds represent DEMs, red ellipses represent upregulated DETGs, and blue ellipses represent downregulated DETGs. The regulatory network included 34 upregulated DETGs, 36 downregulated DETGs, 79 DEMs and 253 interactions. According to the mechanism of miRNA negative regulation, DEMs were divided into two groups including upregulated and downregulated DEMs and ranked with the number of screened DETGs with an opposite trend to DEMs. Among the 79 DEMs, there were 64 upregulated DEMs and 15 downregulated DEMs. Among the upregulated DEMs, miR-29b-3p regulated 7 downregulated target genes, and it was the upregulated DEM with the largest number of opposite target genes (Supplementary Table 9). miR-519c-3p and miR-520a-5p were downregulated DEMs, both of which regulate three downregulated genes, and they are the downregulated DEMs with the largest number of downregulated genes (Supplementary Table 9). Herein, we identified 3 hub DEMs (upregulated miR-29b-3p and downregulated miR-519c-3p and miR-520a-5p). miR-29b-3p, miR-519c-3p and miR-520a-5p regulated 7, 3 and 3 screened DETGs, respectively.
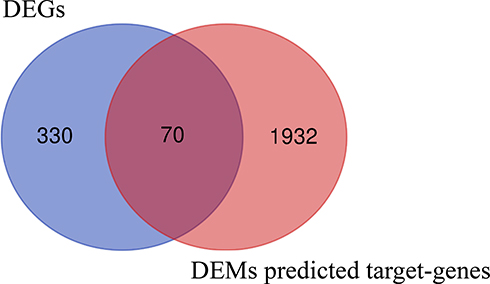 |
Figure 5 Identification of DETGs between DEGs and DEMs predicted target genes. |
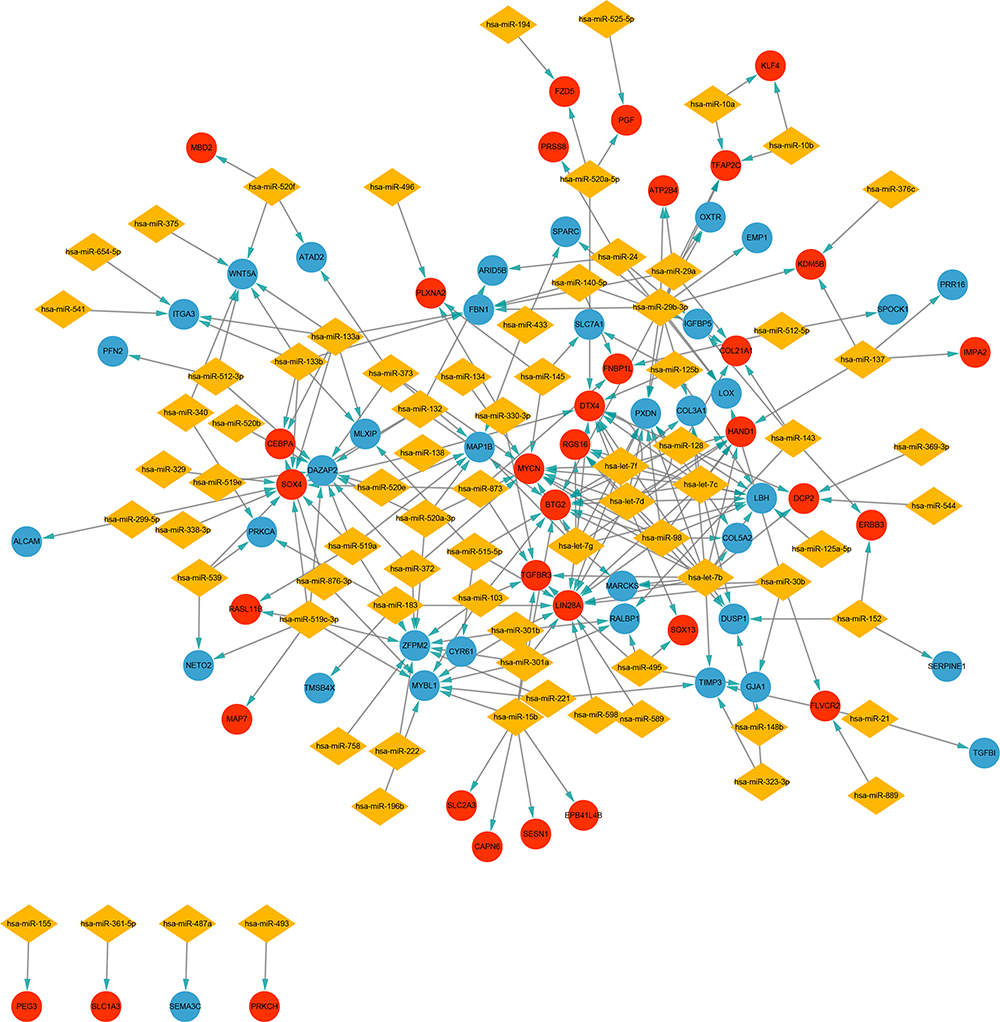 |
Figure 6 Construction of miRNA-target gene regulatory network. Red nodes and blue nodes indicate upregulated and downregulated DETGs, respectively. Diamonds represent DEMs. |
Functional and Pathway Analysis of Hub DEMs
The hub DEMs were subjected to GO and KEGG pathway analyses through miRPath v3.0. As indicated in Figure 7, these hub DEMs were enriched in cellular nitrogen compound metabolic process, protein modification and biosynthetic process in the BP-associated category, organelle and ion binding in the CC-associated category and nucleic acid binding transcription factor activity in the MF-associated category. The KEGG pathway analysis results demonstrated that hub DEMs were enriched in proteoglycans in cancer and lysine degradation.
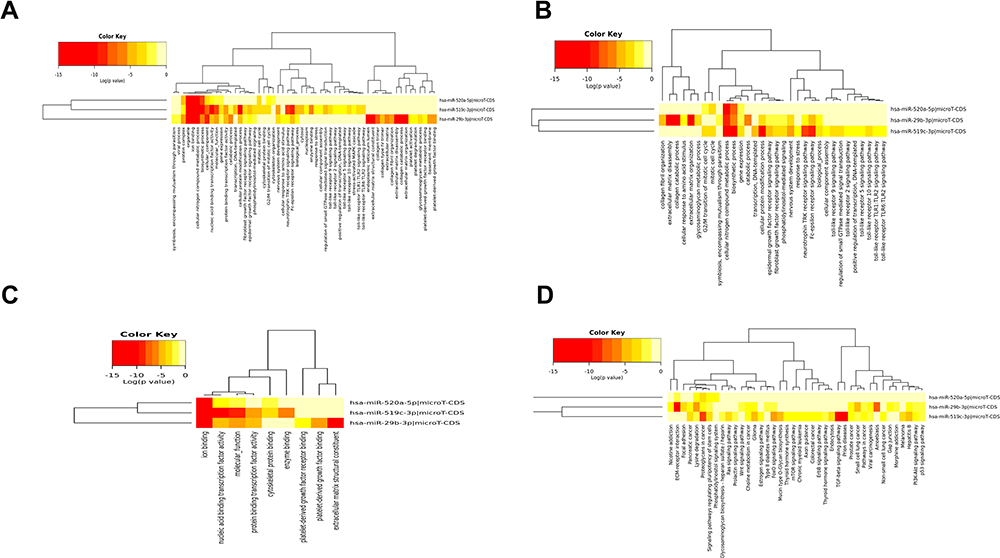 |
Figure 7 GO and KEGG analysis of hsa-miR-29b-3p, hsa-miR-519c-3p and hsa-miR-520a-5p. BP (A), CC (B) and MF (C) terms and enriched (D) KEGG pathways. |
Construction of the miRNA-TF-Target Gene Regulatory Network
To investigate the regulatory mechanism between hub DEMs and DETGs, miRNA-TF-target gene networks for these hub DEMs were established. The results showed that the regulatory networks for miR-29b-3p, miR-519c-3p and miR-520a-5p consisted of four TFs (STAT3, TFAP2C, TFAP2A and CHD1), three TFs (GATA2, HOXA11 and SMC3) and three TFs (FLI1, HNF4A and SOX11) (Figure 8).
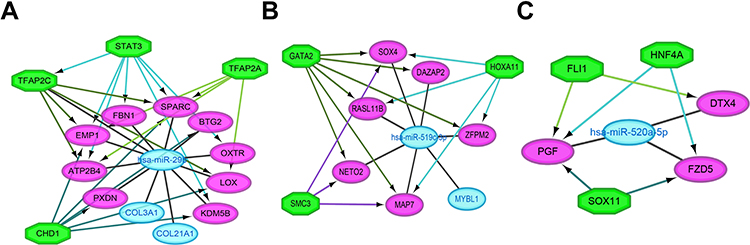 |
Figure 8 Regulatory networks of the key miRNAs, target genes and transcription factors. Network of hsa-miR-29b-3p and four transcription factors (A); network of hsa-miR-519c-3p and three transcription factors (B); network of hsa-miR-520a-5p and three transcription factors (C). Green octagons indicate transcription factors. Purple circles indicate target genes regulated by hub DEMs and transcription factors, and blue circles indicate target genes regulated by hub DEMs. |
Validation of Hub DEMs
As a rare disease, choriocarcinoma samples are difficult to obtain, and most tumour-associated databases do not contain their clinical data and tissue expression. Therefore, three hub DEMs were validated by RT-PCR and compared with normal trophoblast cells and choriocarcinoma cells. Consistent with the analysis of miRNA profile datasets, we found that miR-29b-3p was markedly upregulated while miR-519c-3p and miR-520a-5p were downregulated in JEG3 and JAR cells (Figure 9). The findings indicated that the analysis results were reproducible and reliable.
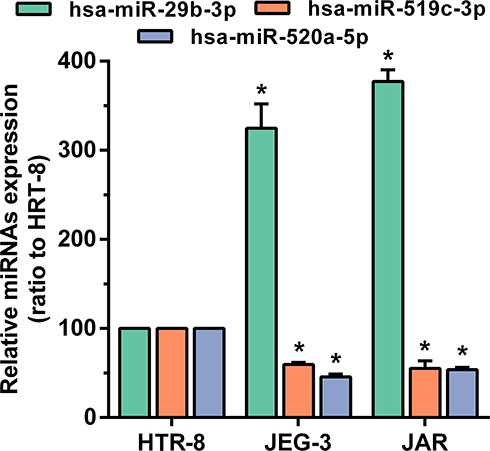 |
Figure 9 The expression of hsa-miR-29b-3, hsa-miR-519c-3p and hsa-miR-520a-5p in the comparison between the choriocarcinoma cell group and HRT-8 group. *p < 0.05 compared with HRT-8 group. |
The Effect of Hub DEMs on Choriocarcinoma Cell Proliferation
MiR-29b-3p, miR-519c-3p and miR-520a-5p were overexpressed or silenced in JEG3 and JAR cells to explore the effect of hub DEMs on choriocarcinoma cell proliferation. A CCK-8 assay was used to examine proliferation. As demonstrated in Figure 10A–D, overexpression of miR-29b-3p enhanced cell proliferation in JEG3 and JAR cells compared with NC mimics, while silencing of miR-29b-3p reversed the above effects. Moreover, miR-519c-3p and miR-520a-5p mimics inhibited cell proliferation, whereas downregulation of miR-519c-3p and miR-520a-5p exerted opposite effects. Consistent with the results of the CCK-8 assay, the EdU assay results also verified our hypothesis through quantification of percentage of EdU positive cells (Figure 10E and F).
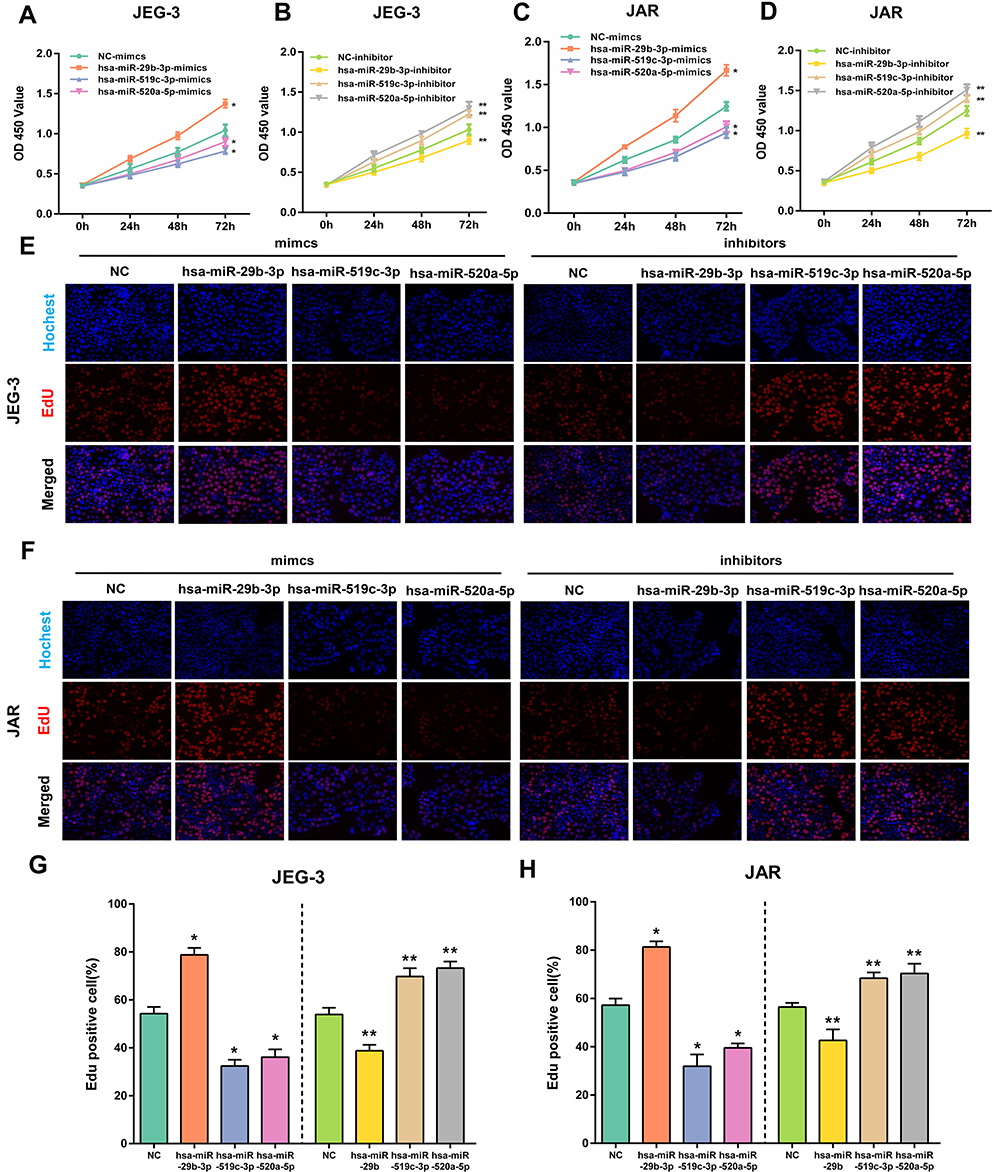 |
Figure 10 The effect of overexpression or silencing of hsa-miR-29b-3p, hsa-miR-519c-3p and hsa-miR-520a-5p on cell proliferation in JEG-3 and JAR cells. Viability of JEG-3 and JAR cells transfected with hub DEM mimics or inhibitors measured by CCK-8 (A–D) and EdU assays (E and F). The percentage of Edu positive JEG-3 and JAR. Proliferation ratio is assessed using EdU staining/Hoechst 33,342 (G and H). *p < 0.05 compared with NC-mimics in JEG-3 and JAR cells. **p < 0.05 compared with NC-inhibitor in JEG-3 and JAR cells. |
The Effect of Hub DEMs on Choriocarcinoma Cell Migration
We next assessed the functional effects of miR-29b-3p, miR-519c-3p and miR-520a-5p on cell migration. After transfection with miR-29b-3p mimics, the migration abilities of JEG3 and JAR cells were greatly improved, with many cells crossing through the membranes compared with the NC mimic group. In contrast, the miR-29b-3p inhibitor notably decreased the migration abilities of the cells. In addition, cells transfected with miR-519c-3p and miR-520a-5p mimics migrated quickly through the membranes, and an increased number of cells was observed on the upper layer of the Transwell chamber. Simultaneously, the migration abilities of cells transfected with miR-519c-3p and miR-520a-5p mimic inhibitors dramatically decreased through calculating numbers of cell migration, as shown in Figure 11. In summary, upregulation of miR-29b-3p and downregulation of miR-519c-3p and miR-520a-5p contributed to the migration ability of choriocarcinoma cells.
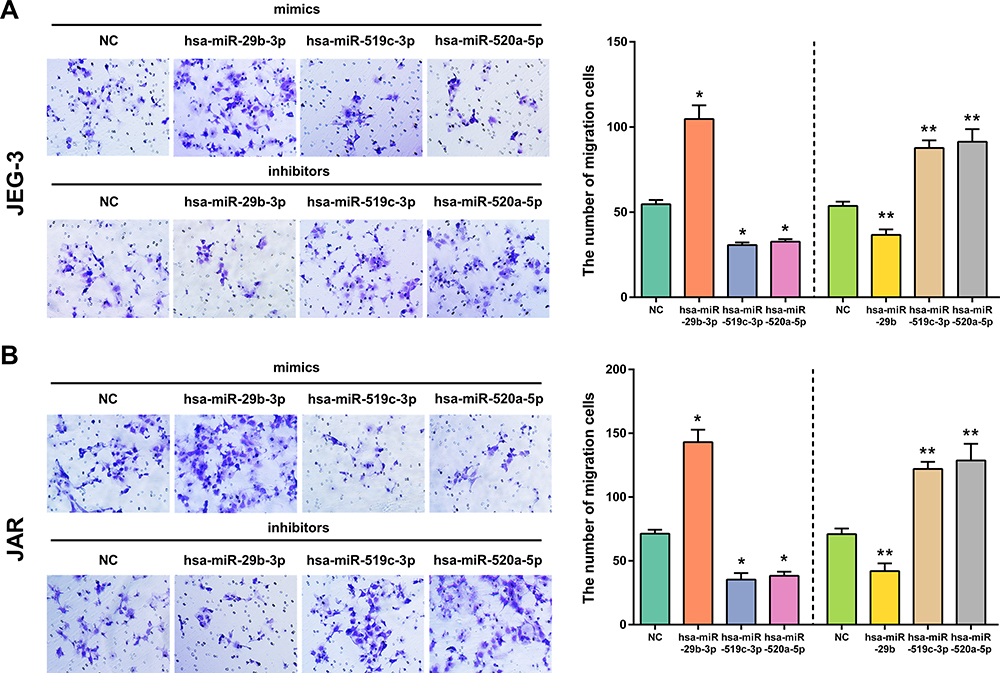 |
Figure 11 The effect of overexpression or silencing of hsa-miR-29b-3p, hsa-miR-519c-3p and hsa-miR-520a-5p on cell migration in JEG-3 (A) and JAR (B) cells. Cell migration was measured by Transwell assays. *p < 0.05 compared with NC-mimics in JEG-3 and JAR cells. **p < 0.05 compared with NC-inhibitor in JEG-3 and JAR cells. |
Discussion
Choriocarcinoma is a rare malignant trophoblastic neoplasm characterized by rapid proliferation and strong migration ability.2 Unlike other types of cancer originating from somatic cells, choriocarcinoma is derived from chorionic villi and extravillous trophoblasts, indicating that other tumour-related targets may not be suitable to prevent and treat choriocarcinoma.1 Studies have shown that the incidence of choriocarcinoma is 1:2416–1:2888 pregnancies in China,24 1:40,000 pregnancies in the United States and Europe,24 and 1:193 pregnancies in the Philippines.25 The mortality of low-risk and high-risk Chinese women is 0.3% and 15.1%, respectively.3,26 Unfortunately, the mechanism underlying choriocarcinoma is still not fully elaborated, and early interventions are lacking. Therefore, identification of hub miRNAs and mRNAs involved in the tumorigenesis and progression of choriocarcinoma is urgently needed. Moreover, the synergistic effects of TFs and miRNAs in genetic regulatory networks are new hot spots for deepening the understanding of molecular mechanisms.27 Unfortunately, to date, no associated research has been reported to construct miRNA-TF-target gene regulatory networks in choriocarcinoma. To the best of our knowledge, we are the first to attempt to elucidate interactions between DEGs and DEMs and construct miRNA-TF-target gene regulatory networks, providing novel therapeutic targets for early diagnosis, treatment and prevention.
Based on the gene expression profile, we identified the top 400 upregulated and downregulated DEGs from 2115 DEGs as candidate DEGs for further analysis. To explore DEG-associated functions and signalling pathways, we conducted GO category and pathway term enrichment analyses utilizing the ClueGO plugin. Functional enrichment analysis demonstrated that the DEGs were correlated with cell activity, including regulation of cell migration and cellular component movement, which are associated with tumour progression. Similarly, pathway enrichment analysis revealed that the DEGs were enriched in proteoglycans in cancer and were involved in cell proliferation, migration and neovascularization. SPARC is a matricellular glycoprotein that modulates the pathologies associated with tumorigenesis.28 Jiang et al found that the mRNA and protein expression of SPARC was downregulated in JEG-3 cells compared with HTR-8/SVneo cells.29 Furthermore, miRNAs in cancer were the primary pathway for DEG enrichment. This result suggested that miRNAs may play a vital role in mediating choriocarcinoma progression.
To explore the linkage between DEGs, we constructed a PPI network of candidate DEGs and obtained 29 hub genes, including upregulated DEGs and downregulated DEGs. Some of these hub genes were demonstrated to be involved in choriocarcinogenesis and progression in a previous study. Chen et al reported that TIMP3 was expressed less in JEG-3 and Bewo cells, consistent with the findings of the current study. Transferrin with adenovirus overexpressing TIMP3 decreased the possibility of tumour growth, adhesion and invasion.30 Similarly, TIMP1 was markedly upregulated in JEG-3 cells compared with HTR-8/SVneo cells in a previous study.31 CD44, the receptor of hyaluronic acid, was demonstrated to be highly expressed in choriocarcinoma cells, facilitate tumour cell adhesion to the extracellular matrix and basement membrane and to provide sites for tumour invasion.32 Lan et al revealed that CDH1 expression was significantly increased in JEG-3 and JAR cells compared with HTR-8/SVneo cells, and DNA methylation of the CDH1 promoter contributed to choriocarcinoma cell motility and invasion.33 TGF-β2 was dramatically downregulated in choriocarcinoma cell lines (JEG-3 and JAR) compared with a normal trophoblast cell line (HTR-8/SVneo).34 Insulin-like growth factor binding protein (IGFBP) has become a popular gene family for oncology research and is involved in the proliferation, metastasis and invasion of tumour cells, thus mediating the development of tumours, including choriocarcinoma. Liu et al found that IGFBP7 was abundantly expressed in normal trophoblast tissue samples rather than hydatidiform moles and inhibited the proliferation and invasion capacities of JEG-3 cells.35 IGFBP3 was dramatically downregulated in JEG-3 and JAR cells compared with normal trophoblastic cells.36 Jiang et al showed that SPARC depletion upregulated the expression of IGFBP4, which promoted the invasion of JEG-3.29 The above results were consistent with our study, strongly indicating that hub genes mostly participated in tumour proliferation and invasion.
Chemotherapy drug resistance remains one of the most important issues in the outcome of cancer treatment and affects the survival prognosis of patients. Thus, predicting and developing new drugs and designing a better treatment regimen to reduce drug resistance is crucial.37,38 We used DGIdb to predict drug-gene interactions and identified 99 drugs targeting 29 hub genes, 47 of which were FDA-approved drugs. Many kinds of drugs are used to treat tumours. For example, bevacizumab is used to treat advanced ovarian cancer,39 metastatic colorectal cancer40 and non-small cell lung cancer.41 Bicalutamide is used to treat metastatic hormone-sensitive prostate cancer.42 Lapatinib is widely used in patients with non-small cell lung cancer,43 breast cancer,44 aggressive prolactinomas45 and oesophageal cancers.46 The nonconventional drugs predicted by the study may have a new use in choriocarcinoma.
Increasing evidence has demonstrated that miRNAs, as pivotal functional molecules, are regarded as biomarkers for early screening and potential targets to block tumorigenesis and tumour progression.12 Various miRNAs are reportedly involved in the proliferation and migration of choriocarcinoma, suggesting that altered miRNA expression and miRNA-mediated downstream genes may be involved in the pathogenesis of choriocarcinoma.12,47 In our present study, we identified 140 consistently altered DEMs in both the GSE32346 and GSE130489 datasets. Moreover, we established a miRNA-target gene regulatory network according to the DEMs and the overlaps among the DEGs and potential candidate target genes. DEMs were divided into two groups, upregulated and downregulated DEMs, and ranked with the number of screened DETGs with an opposite trend to DEMs. MiR-29b-3p, miR-519c-3p and miR-520a-5p were identified as hub DEMs.
As upregulated DEMs, miR-29b-3p regulated 7 downregulated DETGs (PXDN, SPARC, OXTR, LOX, EMP1 COL3A1 and FBN1) and was identified as a tumour promoter by increasing cell proliferation, migration and chemotherapy tolerance through various pathways in different cancers. A previous study demonstrated the upregulation of miR-29b-3p in breast cancer tissues.48 Some studies found that miR-29b-3p improved the invasiveness of the breast cancer cell line MCF-7 by inhibiting the expression of SPARC and COL4A2.49 Notably, Sugio A showed that in ovarian cancer, the expression of miR-29b-3p was positively correlated with the level of chemotherapy tolerance.50 Okamoto K found that miR-29b-3p could improve the chemotherapy tolerance of cholangiocarcinoma to gemcitabine.51 Similarly, miR-29b-3p was highly expressed in a bladder cancer chemotherapy-sensitive cell line.52 The main treatment modality for choriocarcinoma is chemotherapy, but 20% of patients still fail to achieve a cure due to resistance after chemotherapy, so chemotherapy resistance has become a more difficult problem in clinical practice.2 Based on the data described above, we speculate that miR-29b may be related to chemoresistance in choriocarcinoma and may become a clinical diagnostic and therapeutic target. Some of these miR-29b-3p-mediated DETGs should be considered. Overexpressed SPARC may inhibit gastric cancer cell invasion and migration by downregulating the expression of VEGF, MMP-9, and MMP-7.53 In addition, methylation and low expression of FBN1 contributed to the progression of tumour cells in papillary thyroid carcinoma,54 ovarian cancer55 and endometrial cancer.56
Numerous studies have shown that miR-519c-3p, a tumour suppressor gene, is downregulated in most cancers,57 including cervical cancer, ovarian cancer, hepatocellular carcinoma and breast cancer. MiR-519c-3p overexpression suppresses tumour angiogenesis by targeting HIF-1α in lung adenocarcinoma cells.58 In this study, miR-29b-3p regulated 3 upregulated DETGs (MAP7, RASL11B and SOX4). SOX4 overexpression activates Wnt/β-catenin and promotes the proliferation and migration of osteosarcoma cells.59 The miR-519c-3p-regulated target gene SOX4 is regarded as a gene associated with embryonic development and an important transcription factor for T and B cells.60 In addition, MAP7 interacts with RC3H1 to upregulate the cell cycle progression of cervical cancer cells by activating NF-κB signalling.61 Previous studies showed that low expression of miR-520a-5p promotes cancer cell migration and invasion in tissues, such as lung cancer62 and breast cancer.63 A prospective pilot study showed that miR-520a-5p could be used as an effective foetal/placenta-specific marker for the diagnosis and continuous follow-up of GTD/GTN, especially for patients with HCG false-positive and HCG-negative results.64 PGF, FZD5 and DTX4 are the gene targets of hsa-miR-520a-5p. PGF is a potent stimulant of cancer invasion, mediating the growth of vascular endothelial cells, activating angiogenesis, and promoting tumour cell invasion and metastasis.65 Other studies have revealed that PGF regulates the expression of epithelial-mesenchymal transition-related proteins in cervical cancer.66 FZD5 induced the proliferation of cancer cells by activating the Wnt signalling pathway in triple-negative breast cancer.67
To further explore the function of hub DEMs, miRNA pathway enrichment analysis indicated that hub DEMs were enriched in the cellular nitrogen compound metabolic process, protein modification and biosynthetic process in the BP-associated category, organelle and ion binding in the CC-associated category and nucleic acid binding transcription factor activity and ion binding in the MF-associated category. The KEGG pathway analysis results demonstrated that hub DEMs were enriched in proteoglycans in cancer and lysine degradation. Moreover, we constructed a miRNA-TF-target gene regulatory network. MiR-29b-3p and four TFs, STAT3, TFAP2C, TFAP2A and CHD1, were verified to be coregulators of PXDN, ATP2B4, EMP1, FBN1, SPARC, BTG2, OXTR, LOX, and KDM5B. MiR-519c-3p and three TFs, GATA2, HOXA11 and SMC3, were verified to be coregulators of SOX4, DAZAP2, RASL11B, ZFPM2, NETO2 and MAP7. Additionally, miR-520a-5p and three TFs, FLI1, HNF4A and SOX11, were verified to be coregulators of PGF, DTX4 and FZD5. The networks provided us with a new way to elucidate the underlying mechanism and molecular targets of choriocarcinoma.
Since choriocarcinoma is a relatively rare disease worldwide, current data platforms and databases lack a summary and statistical analysis of clinicopathological characteristics and data related to the prognosis of choriocarcinoma. Moreover, the main treatment modality of choriocarcinoma is chemotherapy, so clinical samples and tissues are difficult to obtain.68 Therefore, we selected two choriocarcinoma cell lines, JEG-3 and JAR cells, for further study and validation. Compared with HTR-8/SVneo,29 upregulation of miR-29b-3p and downregulation of miR-519c-3p and miR-520a-5p were verified by RT-PCR, which was consistent with microarray analysis results. The results of overexpression and silencing these hub DEMs on cell proliferation and migration indicated that miR-29b-3p facilitated proliferation while miR-519c-3p and miR-520a-5p inhibited proliferation and migration in JEG-3 and JAR cells. Therefore, it is worth investigating the functions and underlying mechanisms of miR-29b-3p, miR-519c-3p and miR-520a-5p in choriocarcinoma.
Some limitations existed in the present study. Due to the lack of adequate clinical samples, the tissue expression and prognostic value of hub DEMs could not be evaluated. In addition, the expression and regulatory mechanism of TFs were not determined through experimental tests. Whether other noncoding RNAs, such as lncRNAs and circRNAs, play an essential role in the development of choriocarcinoma also deserves to be explored. Due to the lack of functional verification of the three key miRNAs in HTR-8 cells, there may be some deficiencies in tumour-specific verification of miRNAs. However, our experiment confirmed that these three key miRNAs can influence the regulation of choriocarcinoma cell proliferation and migration. In addition, we only performed in vitro experiments without an internal environment in vivo. We will perform animal experiments to strengthen the persuasiveness of the underlying mechanisms of these hub DEMs in the future.
Conclusion
In conclusion, we identified 400 DEGs and 140 DEMs based on bioinformatics analysis. Among these DEMs, three hub DEMs, miR-29b-3p, miR-519c-3p and miR-520a-5p, were confirmed in vitro as potential regulators of the proliferation and migration of choriocarcinoma cells. In addition, regulatory network analysis indicated the comodulating relationships among hub DEMs, TFs and corresponding DETGs in choriocarcinoma, which would provide novel diagnostic and therapeutic targets for choriocarcinoma.
Acknowledgments
This study was supported by the National Natural Science Foundation of China (Grant Number: 81472434), the Science and Technology Planning Project of Changsha (Grant Number: K1508031-31). We would like to acknowledge the helpful comments on this paper received from our reviewers.
Disclosure
The authors report no conflicts of interest in this work.
References
1. Cheung A, Zhang H, Xue W, Siu M. Pathogenesis of choriocarcinoma: clinical, genetic and stem cell perspectives. Future Oncol. 2009;5(2):217–231. doi:10.2217/14796694.5.2.217
2. Jung S, Choi Y, Kim M, et al. Distinct genomic profiles of gestational choriocarcinoma, a unique cancer of pregnant tissues. Exp Mol Med. 2020;52(12):2046–2054. doi:10.1038/s12276-020-00544-0
3. Lok C, Frijstein M, van Trommel N. Clinical presentation and diagnosis of gestational trophoblastic disease. Best Pract Res Clin Obstet Gynaecol. 2020. doi:10.1016/j.bpobgyn.2020.12.001
4. Gulyaeva L, Kushlinskiy N. Regulatory mechanisms of microRNA expression. J Transl Med. 2016;14(1):143. doi:10.1186/s12967-016-0893-x
5. Rupaimoole R, Slack F. MicroRNA therapeutics: towards a new era for the management of cancer and other diseases. Nat Rev Drug Discov. 2017;16(3):203–222. doi:10.1038/nrd.2016.246
6. Chaiwangyen W, Ospina-Prieto S, Photini S, Schleussner E, Markert U, Morales-Prieto D. Dissimilar microRNA-21 functions and targets in trophoblastic cell lines of different origin. Int J Biochem Cell Biol. 2015;68:187–196. doi:10.1016/j.biocel.2015.08.018
7. Lin LH, Maestá I, St Laurent JD, et al. Braga at risk of malignant progression. Am J Obstet Gynecol. 2021;224(4):
8. Pang R, Leung C, Lee C, et al. MicroRNA-34a is a tumor suppressor in choriocarcinoma via regulation of delta-like1. BMC Cancer. 2013;13:25. doi:10.1186/1471-2407-13-25
9. Wang Y, Zhao J, Xu Y, Wu W, Zhang H. miR-21 is overexpressed in hydatidiform mole tissues and promotes proliferation, migration, and invasion in choriocarcinoma cells. Int J Gynecol Cancer. 2017;27(2):364–374. doi:10.1097/IGC.0000000000000861
10. Gao Y, Zhang S, Zhang Y, Qian J. Identification of MicroRNA-target gene-transcription factor regulatory networks in colorectal adenoma using microarray expression data. Front Genet. 2020;11:463. doi:10.3389/fgene.2020.00463
11. Bilban M, Tauber S, Haslinger P, et al. Trophoblast invasion: assessment of cellular models using gene expression signatures. Placenta. 2010;31(11):989–996. doi:10.1016/j.placenta.2010.08.011
12. Morales-Prieto D, Chaiwangyen W, Ospina-Prieto S, et al. MicroRNA expression profiles of trophoblastic cells. Placenta. 2012;33(9):725–734. doi:10.1016/j.placenta.2012.05.009
13. Morales-Prieto D, Barth E, Murrieta-Coxca J, et al. Identification of miRNAs and associated pathways regulated by leukemia inhibitory factor in trophoblastic cell lines. Placenta. 2019;88:20–27. doi:10.1016/j.placenta.2019.09.005
14. Chen H, Boutros P. VennDiagram: a package for the generation of highly-customizable venn and euler diagrams in R. BMC Bioinform. 2011;12(1):35. doi:10.1186/1471-2105-12-35
15. Bindea G, Mlecnik B, Hackl H, et al. ClueGO: a cytoscape plug-in to decipher functionally grouped gene ontology and pathway annotation networks. Bioinformatics. 2009;25(8):1091–1093. doi:10.1093/bioinformatics/btp101
16. Bader G, Hogue C. An automated method for finding molecular complexes in large protein interaction networks. BMC Bioinform. 2003;4(1):2. doi:10.1186/1471-2105-4-2
17. Dweep H, Gretz N. miRWalk2.0: a comprehensive atlas of microRNA-target interactions. Nat Methods. 2015;12(8):697. doi:10.1038/nmeth.3485
18. Krek A, Grün D, Poy M, et al. Combinatorial microRNA target predictions. Nat Genet. 2005;37(5):495–500. doi:10.1038/ng1536
19. Kertesz M, Iovino N, Unnerstall U, Gaul U, Segal E. The role of site accessibility in microRNA target recognition. Nat Genet. 2007;39(10):1278–1284. doi:10.1038/ng2135
20. Miranda K, Huynh T, Tay Y, et al. A pattern-based method for the identification of MicroRNA binding sites and their corresponding heteroduplexes. Cell. 2006;126(6):1203–1217. doi:10.1016/j.cell.2006.07.031
21. Krüger J, Rehmsmeier M. RNAhybrid: microRNA target prediction easy, fast and flexible. Nucleic Acids Res. 2006;34:W451–W454. doi:10.1093/nar/gkl243
22. Lewis B, Burge C, Bartel D. Conserved seed pairing, often flanked by adenosines, indicates that thousands of human genes are microRNA targets. Cell. 2005;120(1):15–20. doi:10.1016/j.cell.2004.12.035
23. Janky R, Verfaillie A, Imrichová H, et al. iRegulon: from a gene list to a gene regulatory network using large motif and track collections. PLoS Comput Biol. 2014;10(7):e1003731. doi:10.1371/journal.pcbi.1003731
24. Shi YF, Li JQ, Zheng W, et al. Survey of gestational trophoblastic disease incidence among 3.6 million pregnancies in China. China J Obstet Gynecol. 2005;40(2):76–78.
25. Steigrad SJ. Epidemiology of gestational trophoblastic disease. Best Res Clin Obstet Gynaecol. 2003;17(6):837–847. doi:10.1016/S1521-6934(03)00049-X
26. Freitas F, Braga A, Viggiano M, et al. Gestational trophoblastic neoplasia lethality among Brazilian women: a retrospective national cohort study. Gynecol Oncol. 2020;158:452–459. doi:10.1016/j.ygyno.2020.04.704
27. Catalanotto C, Cogoni C, Zardo G. MicroRNA in control of gene expression: an overview of nuclear functions. Int J Mol Sci. 2016;17(10):1712. doi:10.3390/ijms17101712
28. Wang L, Wang W, Xu Y, Wang Q. Low Levels of SPARC are associated with tumor progression and poor prognosis in human endometrial carcinoma. Onco Targets Ther. 2020;13:11549–11569. doi:10.2147/OTT.S277795
29. Jiang Y, Zhu Y, Shi Y, et al. Downregulation of SPARC expression inhibits the invasion of human trophoblast cells in vitro. PLoS One. 2013;8(7):e69079. doi:10.1371/journal.pone.0069079
30. Chen Y, Qian H, Zhang Y, Ma Y, Lin C, Xiang Y. Effect of Ad-TIMP3 on biologic behavior of choriocarcinoma cells in vitro. J Reprod Med. 2008;53(8):608–614.
31. Godbole G, Suman P, Gupta S, Modi D. Decidualized endometrial stromal cell derived factors promote trophoblast invasion. Fertil Steril. 2011;95(4):1278–1283. doi:10.1016/j.fertnstert.2010.09.045
32. Mascaró M, Pibuel M, Lompardía S, et al. Low molecular weight hyaluronan induces migration of human choriocarcinoma JEG-3 cells mediated by RHAMM as well as by PI3K and MAPK pathways. Histochem Cell Biol. 2017;148(2):173–187. doi:10.1007/s00418-017-1559-3
33. Lan X, Fu L, Hu Z, et al. Methylated oligonucleotide (MON)-induced promoter hypermethylation is associated with repression of CDH1 expression and contributes to the migration and invasion of human trophoblast cell lines. Reprod Fertil Dev. 2017;29(8):1509–1520. doi:10.1071/RD16031
34. Xu G, Chakraborty C, Lala P. Expression of TGF-beta signaling genes in the normal, premalignant, and malignant human trophoblast: loss of smad3 in choriocarcinoma cells. Biochem Biophys Res Commun. 2001;287(1):47–55. doi:10.1006/bbrc.2001.5533
35. Liu Z, Liu H, Fang W, Yang Y, Wang H, Peng J. Insulin-like growth factor binding protein 7 modulates estrogen-induced trophoblast proliferation and invasion in HTR-8 and JEG-3 cells. Cell Biochem Biophys. 2012;63(1):73–84. doi:10.1007/s12013-012-9342-5
36. Feng H, Cheung A, Xue W, et al. Down-regulation and promoter methylation of tissue inhibitor of metalloproteinase 3 in choriocarcinoma. Gynecol Oncol. 2004;94(2):375–382. doi:10.1016/j.ygyno.2004.04.019
37. Adiga D, Eswaran S, Pandey D, Sharan K, Kabekkodu S. Molecular landscape of recurrent cervical cancer. Crit Rev Oncol Hematol. 2021;157:103178.
38. Mansoori B, Mohammadi A, Davudian S, Shirjang S, Baradaran B. The different mechanisms of cancer drug resistance: a brief review. Adv Pharm Bull. 2017;7(3):339–348. doi:10.15171/apb.2017.041
39. Liu S, Kasherman L, Fazelzad R, et al. The use of bevacizumab in the modern era of targeted therapy for ovarian cancer: a systematic review and meta-analysis. Gynecol Oncol. 2021;161(2):601–612. doi:10.1016/j.ygyno.2021.01.028
40. Gaibar M, Galán M, Romero-Lorca A, et al. ANGPT1Genetic variants of, and linked to clinical outcome of bevacizumab plus chemotherapy for metastatic colorectal cancer. Int J Mol Sci. 2021;22:3. doi:10.3390/ijms22031381
41. Tamiya M, Tamiya A, Suzuki H, et al. Phase 2 study of bevacizumab plus carboplatin/nab-paclitaxel followed by bevacizumab plus nab-paclitaxel for non-squamous non-small cell lung cancer with malignant pleural effusion. Invest New Drugs. 2021. doi:10.1007/s10637-021-01076-8
42. Vaishampayan U, Heilbrun L, Monk P, et al. Clinical efficacy of enzalutamide vs bicalutamide combined with androgen deprivation therapy in men with metastatic hormone-sensitive prostate cancer: a randomized clinical trial. JAMA Netw Open. 2021;4(1):e2034633. doi:10.1001/jamanetworkopen.2020.34633
43. Christodoulou C, Kalogera-Fountzila A, Karavasilis V, et al. Lapatinib with whole brain radiotherapy in patients with brain metastases from breast and non-small cell lung cancer: a Phase II study of the Hellenic Cooperative Oncology Group (HeCOG). J Neurooncol. 2017;134(2):443–451. doi:10.1007/s11060-017-2548-z
44. Khan M, Zhao Z, Arooj S, et al. Lapatinib plus local radiation therapy for brain metastases from HER-2 positive breast cancer patients and role of trastuzumab: a systematic review and meta-analysis. Front Oncol. 2020;10:576926. doi:10.3389/fonc.2020.576926
45. Cooper O, Bonert V, Rudnick J, et al. EGFR/ErbB2-targeting lapatinib therapy for aggressive prolactinomas. J Clin Endocrinol Metab. 2020;13(2):e917–e925. doi:10.1210/clinem/dgaa805
46. Shepard G, Arrowsmith E, Murphy P, et al. A Phase II Study with lead-in safety cohort of 5-fluorouracil, oxaliplatin, and lapatinib in combination with radiation therapy as neoadjuvant treatment for patients with localized HER2-positive esophagogastric adenocarcinomas. Oncologist. 2017;22(10):1152–e1198. doi:10.1634/theoncologist.2017-0186
47. Zhou W, She G, Yang K, Zhang B, Liu J, Yu B. MiR-384 inhibits proliferation and migration of trophoblast cells via targeting PTBP3. Pregnancy Hypertens. 2020;21:132–138. doi:10.1016/j.preghy.2020.05.017
48. Wang C, Bian Z, Wei D, Zhang J. miR-29b regulates migration of human breast cancer cells. Mol Cell Biochem. 2011;352:197–207. doi:10.1007/s11010-011-0755-z
49. Wang C, Gao C, Zhuang J, Ding C, Wang Y. A combined approach identifies three mRNAs that are down-regulated by microRNA-29b and promote invasion ability in the breast cancer cell line MCF-7. J Cancer Res Clin Oncol. 2012;138(12):2127–2136. doi:10.1007/s00432-012-1288-x
50. Sugio A, Iwasaki M, Habata S, et al. BAG3 upregulates Mcl-1 through downregulation of miR-29b to induce anticancer drug resistance in ovarian cancer. Gynecol Oncol. 2014;134(3):615–623. doi:10.1016/j.ygyno.2014.06.024
51. Okamoto K, Miyoshi K, Murawaki Y, Sarkar D. miR-29b, miR-205 and miR-221 enhance chemosensitivity to gemcitabine in HuH28 human cholangiocarcinoma cells. PLoS One. 2013;8(10):e77623. doi:10.1371/journal.pone.0077623
52. Lv L, Deng H, Li Y, et al. The DNA methylation-regulated miR-193a-3p dictates the multi-chemoresistance of bladder cancer via repression of SRSF2/PLAU/HIC2 expression. Cell Death Dis. 2014;5(9):e1402. doi:10.1038/cddis.2014.367
53. Ma Y, Zhu J, Chen S, et al. Low expression of SPARC in gastric cancer-associated fibroblasts leads to stemness transformation and 5-fluorouracil resistance in gastric cancer. Cancer Cell Int. 2019;19(1):137. doi:10.1186/s12935-019-0844-8
54. Ma X, Wei J, Zhang L, et al. miR-486-5p inhibits cell growth of papillary thyroid carcinoma by targeting fibrillin-1. Biomed Pharmacother. 2016;80:220–226. doi:10.1016/j.biopha.2016.03.020
55. Wang Z, Liu Y, Lu L, et al. Fibrillin-1, induced by aurora-A but inhibited by BRCA2, promotes ovarian cancer metastasis. Oncotarget. 2015;6(9):6670–6683. doi:10.18632/oncotarget.3118
56. Che X, Jian F, Wang Y, et al. FBXO2 promotes proliferation of endometrial cancer by ubiquitin-mediated degradation of FBN1 in the regulation of the cell cycle and the autophagy pathway. Front Cell Dev Biol. 2020;8:843. doi:10.3389/fcell.2020.00843
57. Abdelmohsen K, Kim M, Srikantan S, et al. miR-519 suppresses tumor growth by reducing HuR levels. Cell Cycle. 2010;9(7):1354–1359. doi:10.4161/cc.9.7.11164
58. Cha S, Chen P, Johansson G, et al. MicroRNA-519c suppresses hypoxia-inducible factor-1α expression and tumor angiogenesis. Cancer Res. 2010;70(7):2675–2685. doi:10.1158/0008-5472.CAN-09-2448
59. Tian Z, Yang G, Jiang P, Zhang L, Wang J, Sun S. Long non-coding RNA Sox4 promotes proliferation and migration by activating Wnt/β-catenin signaling pathway in osteosarcoma. Pharmazie. 2017;72(9):537–542. doi:10.1691/ph.2017.7548
60. Jafarnejad S, Ardekani G, Ghaffari M, Li G. Pleiotropic function of SRY-related HMG box transcription factor 4 in regulation of tumorigenesis. Cell Mol Life Sci. 2013;70(15):2677–2696.
61. Zhang R, Li L, Chen L, et al. MAP7 interacts with RC3H1 and cooperatively regulate cell-cycle progression of cervical cancer cells via activating the NF-κB signaling. Biochem Biophys Res Commun. 2020;527(1):56–63. doi:10.1016/j.bbrc.2020.04.008
62. Xu X, Tao R, Sun L, Ji X. Exosome-transferred hsa_circ_0014235 promotes DDP chemoresistance and deteriorates the development of non-small cell lung cancer by mediating the miR-520a-5p/CDK4 pathway. Cancer Cell Int. 2020;20(1):552. doi:10.1186/s12935-020-01642-9
63. Van der Auwera I, Limame R, van Dam P, Vermeulen P, Dirix L, Van Laere S. Integrated miRNA and mRNA expression profiling of the inflammatory breast cancer subtype. Br J Cancer. 2010;103(4):532–541. doi:10.1038/sj.bjc.6605787
64. Hromadnikova I, Kotlabova K, Krofta L, Hron F. Follow-up of gestational trophoblastic disease/neoplasia via quantification of circulating nucleic acids of placental origin using C19MC microRNAs, hypermethylated RASSF1A, and SRY sequences. Tumour Biol. 2017;39(4):1010428317697548. doi:10.1177/1010428317697548
65. Dewerchin M, Carmeliet P. Placental growth factor in cancer. Expert Opin Ther Targets. 2014;18(11):1339–1354. doi:10.1517/14728222.2014.948420
66. Tilborghs S, Corthouts J, Verhoeven Y, et al. The role of nuclear factor-kappa B signaling in human cervical cancer. Crit Rev Oncol Hematol. 2017;120:141–150. doi:10.1016/j.critrevonc.2017.11.001
67. Yin P, Wang W, Zhang Z, Bai Y, Gao J, Zhao C. Wnt signaling in human and mouse breast cancer: focusing on Wnt ligands, receptors and antagonists. Cancer Sci. 2018;109(11):3368–3375. doi:10.1111/cas.13771
68. Tsakiridis I, Giouleka S, Kalogiannidis I, Mamopoulos A, Athanasiadis A, Dagklis T. Diagnosis and management of gestational trophoblastic disease: a comparative review of National and International Guidelines. Obstet Gynecol Surv. 2020;75(12):747–756. doi:10.1097/OGX.0000000000000848
 © 2021 The Author(s). This work is published and licensed by Dove Medical Press Limited. The
full terms of this license are available at https://www.dovepress.com/terms
and incorporate the Creative Commons Attribution
- Non Commercial (unported, 3.0) License.
By accessing the work you hereby accept the Terms. Non-commercial uses of the work are permitted
without any further permission from Dove Medical Press Limited, provided the work is properly
attributed. For permission for commercial use of this work, please see paragraphs 4.2 and 5 of our Terms.
© 2021 The Author(s). This work is published and licensed by Dove Medical Press Limited. The
full terms of this license are available at https://www.dovepress.com/terms
and incorporate the Creative Commons Attribution
- Non Commercial (unported, 3.0) License.
By accessing the work you hereby accept the Terms. Non-commercial uses of the work are permitted
without any further permission from Dove Medical Press Limited, provided the work is properly
attributed. For permission for commercial use of this work, please see paragraphs 4.2 and 5 of our Terms.