Back to Journals » Journal of Inflammation Research » Volume 14
Bioinformatics Analysis for Identification of Key Genes in Salivary Gland and the Potential of a Combination of Biomarkers for the Diagnosis of SS
Authors Chen L, Lu D ![]() , Yu K, He S, Liu L, Zhang X, Feng B
, Yu K, He S, Liu L, Zhang X, Feng B ![]() , Wang X
, Wang X ![]()
Received 28 May 2021
Accepted for publication 9 August 2021
Published 25 August 2021 Volume 2021:14 Pages 4143—4153
DOI https://doi.org/10.2147/JIR.S322318
Checked for plagiarism Yes
Review by Single anonymous peer review
Peer reviewer comments 2
Editor who approved publication: Dr Monika Sharma
Liying Chen,1,* Dingqi Lu,2,* Kai Yu,1 Shiya He,1 Liu Liu,1 Xvfeng Zhang,1 Bo Feng,3 Xinchang Wang4
1Second Clinical Medical College, Zhejiang Chinese Medical University, Hangzhou, Zhejiang Province, 310053, People’s Republic of China; 2First Clinical Medical College, Zhejiang Chinese Medical University, Hangzhou, Zhejiang Province, 310053, People’s Republic of China; 3Department of Nephrology, Jiaxing Hospital of Traditional Chinese Medicine, Jiaxing, Zhejiang Province, 314001, People’s Republic of China; 4Department of Rheumatology, The Second Affiliated Hospital, Zhejiang Chinese Medical University, Hangzhou, Zhejiang Province, 310005, People’s Republic of China
*These authors contributed equally to this work
Correspondence: Xinchang Wang
Department of Rheumatology, The Second Affiliated Hospital, Zhejiang Chinese Medical University, Hangzhou, Zhejiang Province, People’s Republic of China
Tel +86 13065714635
Email [email protected]
Purpose: Sjögren’s syndrome (SS) is a systemic autoimmune disease mainly characterized by dysfunction of exocrine glands. Studies on diagnosis models specific for SS patients are very limited. We aimed to use gene expression datasets from salivary glands to identify aberrant differentially expressed genes (DEGs) and pathways by bioinformatics and validate candidate genes by clinical minor labial gland biopsy (MSGB) samples, and finally build a combined gene quantitative diagnosis model of SS.
Patients and Methods: Original datasets GSE23117, GSE7451, and GSE127952 were obtained from the Gene Expression Omnibus database (GEO) and integrated and analyzed for differentially expressed genes in SS salivary glands. ClueGO and Kyoto Encyclopedia of Genes and Genomes (KEGG) pathway enrichment analyses of upregulated and downregulated DEGs were performed, and protein–protein interaction (PPI) networks were constructed using the STRING and Cytoscape database. H&E staining and immunohistochemistry were used to validate the expression levels of four hub genes in salivary glands. Finally, a receiver operating characteristic (ROC) curve of the combined diagnosis of four hub genes was analyzed in SS patients and non-SS patients in order to explore the diagnostic efficacy of these genes compared with conventional FS in SS.
Results: Fifty-three upregulated genes and fifteen downregulated genes were identified. We analyzed the expression and function of four hub genes via H&E, immunohistochemistry, and ROC analysis. We then evaluated and verified the diagnosis value of four hub genes, STAT1, MNDA, IL10RA, and CCR1 in MSGB of SS and non-SS. A combined diagnosis model of four indicators was established to identify patients’ discrete data on the foci size (AUC=0.915).
Conclusion: The expression of STAT1, MNDA, and IL10RA may be potential biological indicators for SS diagnosis. Compared with FS, a combined diagnosis model of quantitative gene expression could potentially contribute to improving the sensitivity and specificity of MSGB of SS.
Keywords: Sjogren’s syndrome, bioinformatics analysis, hub genes, validation, diagnostic performance, focus score
Graphical Abstract:

Introduction
Sjogren’s syndrome (SS) is a systemic autoimmune disease primarily characterized by epithelitis in exocrine glands and the development of specific antibodies to SSA/SSB. Europe, North America, and Asia have a wide range of incidence rates for SS, and the prevalence rate in the population of three continents is 60.82 persons per 100,000 inhabitants,1 and the female versus male ratio is 14:1. Patients with SS typically present with dry mouth and eyes, joint pain, and fatigue.2,3 50% of patients present with systemic damage, and they have a 10–20-fold increased risk of developing B cell lymphoma.4
The etiology and pathogenesis of the characteristic progressive glandular dysfunction in SS have not been fully clarified. Genetic susceptibility, environmental factors, and immune disorders are thought to play a dominant role. Studies have found that susceptibility genes, such as human leukocyte antigen (HLA), Interferon Regulatory Factor 5 (IRF5), BLK, Interleukin 12A (IL12A), TNFAIP3 interaction protein 1 (TNIP1), and Chemokine receptor 5 (CXCR5), are closely related to the occurrence of SS.5 Activation of the type I interferon pathway, infiltration of T and B lymphocytes, and formation of ectopic germinal centers within salivary glands all cause damage in multiple tissues.6 The histopathology of salivary glands has the potential to both function as a biomarker and provide information regarding the prognostication and stratification in clinical trials.7
The main characteristic of SS upon biopsy, with 80.4% specificity and 86.2% sensitivity, is focal lymphocytic salivary adenitis (FLS).8 The key requirement of FLS is dense aggregates (foci) of ≥ 50 lymphocytes based on survey of at least four lobules, and the focus score (FS) calculation was defined as FS ≥ 1 focus per 4 mm2 area.9 EULAR-SS task force clinical recommendations state that focal lymphocytic salialitis is considered as an important marker and can be used for the early diagnosis of SS.10 During the early stage of SS, there are no obvious signs of dryness, but the immune microenvironment of the salivary gland changes. Imaging biomarkers, such as ultra-high frequency ultrasound (UHFUS), may help reduce unnecessary and inadequate biopsies, but it has limited evidence of efficacy and is seldom used in the clinic.11 With the rapid development of microarray technologies and bioinformatics analysis in the last few years, microarrays aimed at the genes and pathways of SS-like animals and SS patients have been studied.Nevertheless, single gene can not completely distinguish patients with from those with sicca symptoms or serological manifestations but no SS. Because of the highest item weights (scoring 3) of five items in 2016 American College of Rheumatology/European League Against Rheumatism classification criteria, variable sensitivity and specificity as well as low reproducibility, the diagnosis performance of MSGB could be further explored through multivariate and quantitative analyses of biomarkers.12 Therefore, we analyzed three microarray datasets of salivary glands via bioinformatics analysis and further identified key genes and functions in SS salivary glands for higher sensitivity and specificity of MSGB, and we demonstrated the potential of multiplexed measurement of salivary protein biomarkers compared with FS using diagnosis model.
Materials and Methods
Microarray Datasets and the Identification of Differentially Expressed Genes (DEGs)
The salivary gland gene expression profiles of GSE23117 (n = 4 control, n = 11 SS), GSE7451 (n = 10 control, n = 10 SS), and GSE127952 (n = 6 control, n = 8 SS) were obtained from NCBI-GEO (https://www.ncbi.nlm.nih.gov/), which together included 20 healthy controls and 29 SS patients. We used GEO2R online software (http://www.ncbi.nlm.nih.gov/geo/geo2r) to analyze three microarray datasets, including GSE23117, GSE7451, and GSE127952, that were provided by the original submitter in order to determine the DEGs. A P value < 0.05 and log | FC | ≥ 1 were used as our standard screening criteria for DEGs. Genes with a log | FC | ≥ 1 were considered to be upregulated genes, and those with a log | FC | ≤ –1 were considered downregulated genes. We also used the online drawing tool (https://bioinfogp.cnb.csic.es/tools/venny/index.html) on the DEGs of the three datasets to construct Venn diagrams.
ClueGO and Kyoto Encyclopedia of Genes and Genomes (KEGG) Enrichment Analysis
ClueGO plugin in Cytoscape 3.7.2 was used to perform Gene Ontology (GO) functions, and we used the David database (https://david.ncifcrf.go) to obtain the KEGG enrichment analysis of the DEGs, and we visualized the obtained data through the R “Bioconductor” package. DEGs and signaling pathway analysis was performed with the use of GlueGO and KEGG.
Construction and Analysis of Protein–Protein Interaction (PPI) Networks
All upregulated genes were imported into the STRING database (http://www.string-db.org). The protein species was set to “HomoSapiens,” the lowest interaction threshold was set as “low confidence” (0.15), and a PPI network was imported into Cytoscape software for visual analysis. Network topology analysis was carried out to obtain the hub genes with higher degree value. Top 20 degree genes were calculated and identified by CytoHubba as SS preselected hub genes.
Validation of Hub Genes and Evaluation of Their Efficacy Using Hematoxylin and Eosin (H&E) and Immunohistochemistry
In order to confirm the expression of hub genes in SS patients and suspected patients who were not yet diagnosed, 28 labial gland biopsy samples, including SS patients and non-SS patients (Table 1), were obtained from patients admitted to The Second Affiliated Hospital, Zhejiang Chinese Medical University, Hangzhou, Zhejiang Province, P.R.C, who received a definitive diagnosis of SS (they were diagnosed by the 2016 American College of Rheumatology/European League Against Rheumatism classification criteria for primary Sjögren’s syndrome12). Informed consents were received from all enrolled patients prior to MSGB. The Second Affiliated Hospital, Zhejiang Chinese Medical University Ethics Committees approved the protocols, and the International Conference on Harmonization guidelines and the principles of the Declaration of Helsinki were followed. Labial gland samples were fixed, embedded, sectioned (4 μm), dewaxed with xylene, rehydrated through an alcohol gradient, and stained with H&E. A STAT1 Rabbit IgG Polyclonal antibody (10144-2-AP) from Proteintech (Wuhan Sanying, D3-3, No. 666, Gaoxin Avenue, Wuhan East Lake Hi-tech Development Zone, Wuhan, Hubei, P.R.C.) and MNDA Rabbit IgG Polyclonal antibody (DF4191), IL-10RA Rabbit IgG Polyclonal antibody (DF6643), and CCR1 Rabbit IgG Polyclonal antibody (DF2710) all from Affinity (Xiangtai Biological Technology Co., Ltd., No. 128, Shen Jiang Bian village, Changzhou, Jiangsu, P.R.C.) were used at a 1:200 dilution in this study. For immunohistochemical analysis, sections were processed for antigen retrieval with citrate buffer solution (pH 6.0) before blocking endogenous peroxidase activity with 3% H2O2 for 15 minutes. Sections were blocked with goat serum for 15 minutes and incubated for 1 hour at 37°C. To evaluate antigen expression, each section was photographed at ×200 magnification, and five images were taken across sections. The optical density was analyzed by Image-Pro Plus 6.0 (integrated optical density (IOD) = mean optical density × area). Receiver operating characteristic (ROC) curves were adopted to analyze the diagnostic value of the IOD of four genes for SS. The plot area under the curve (AUC) was computed through numerical integration of the ROC curves. The genes with the highest AUC value were identified as having the strongest power for diagnosing SS.
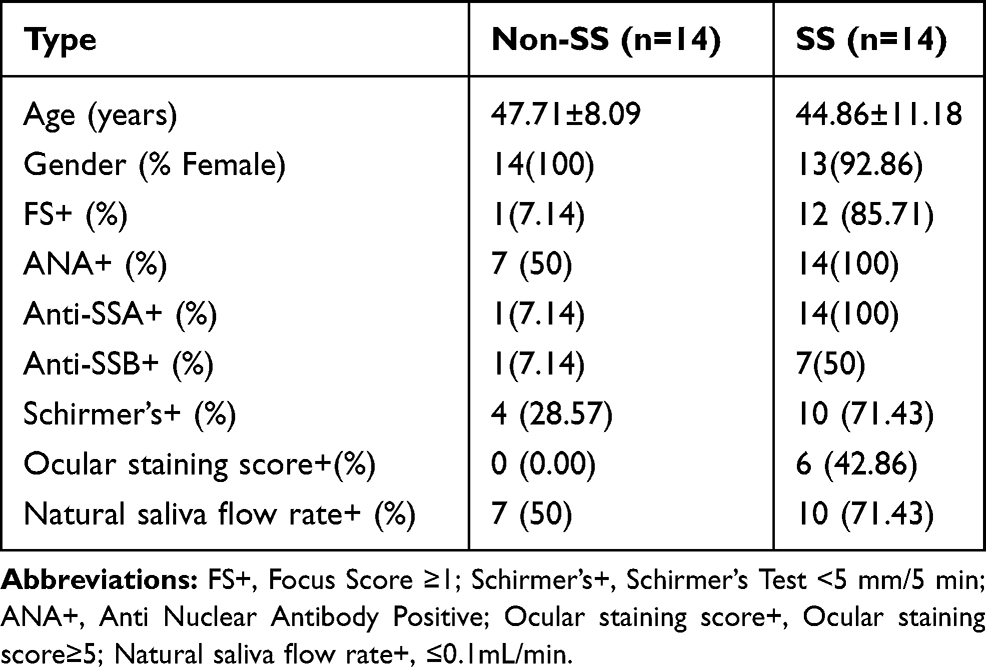 |
Table 1 Patients Clinical and Serological Information |
Statistical Analysis
Bioinformatics statistical analysis was performed using R version 4.0.3, and GraphPad Prism version 8.0.2 (GraphPad Software, San Diego, CA, USA) was used for computing ROC analysis. Numerical results were presented as the means ± standard deviations (SD) or medians with interquartile ranges (IQR), and Wilcoxon Mann–Whitney U two-sample rank sum test was used to analyze the statistical significance between two groups. P<0.05 was considered statistically significant.
Results
Identification of DEGs in Salivary Glands
Three microarray datasets, which included SS patients and healthy controls, were analyzed with Venn tool. We identified 53 upregulated DEGs and 15 downregulated DEGs (data not shown) from the GSE23117, GSE7451, and GSE127952 datasets (Figure 1).
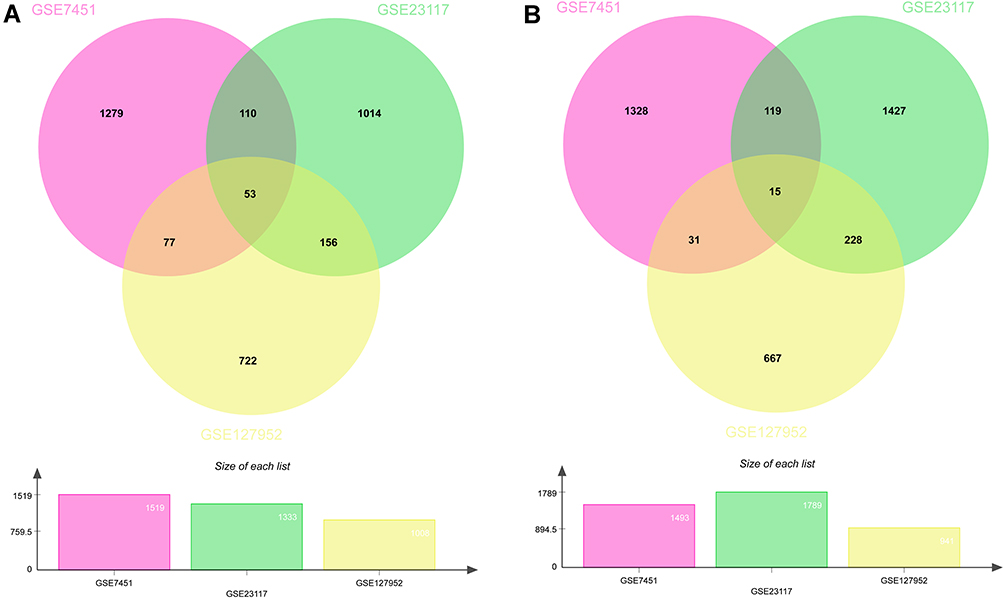 |
Figure 1 Venn diagrams show the DEGs in the salivary glands of patients with SS. Venn diagrams showing the upregulated DEGs (A) and downregulated DEGs (B). |
ClueGO Enrichment Analysis
Enrichment analysis was performed on 53 intersecting targets using the ClueGO v2.5.7 plugin. After setting the P value as < 0.05, Kappa Score Threshold as 0.4, and Golevel as 3Minimum#Genes and 4%#Genes, we identified 31 GO terms. The results showed that the genes were mainly functionally enriched in dendritic cell migration, regulation of the extrinsic apoptotic signaling pathway via death domain receptors, lymphocyte homeostasis, regulation of B cell proliferation, and response to type I interferon (Figure 2).
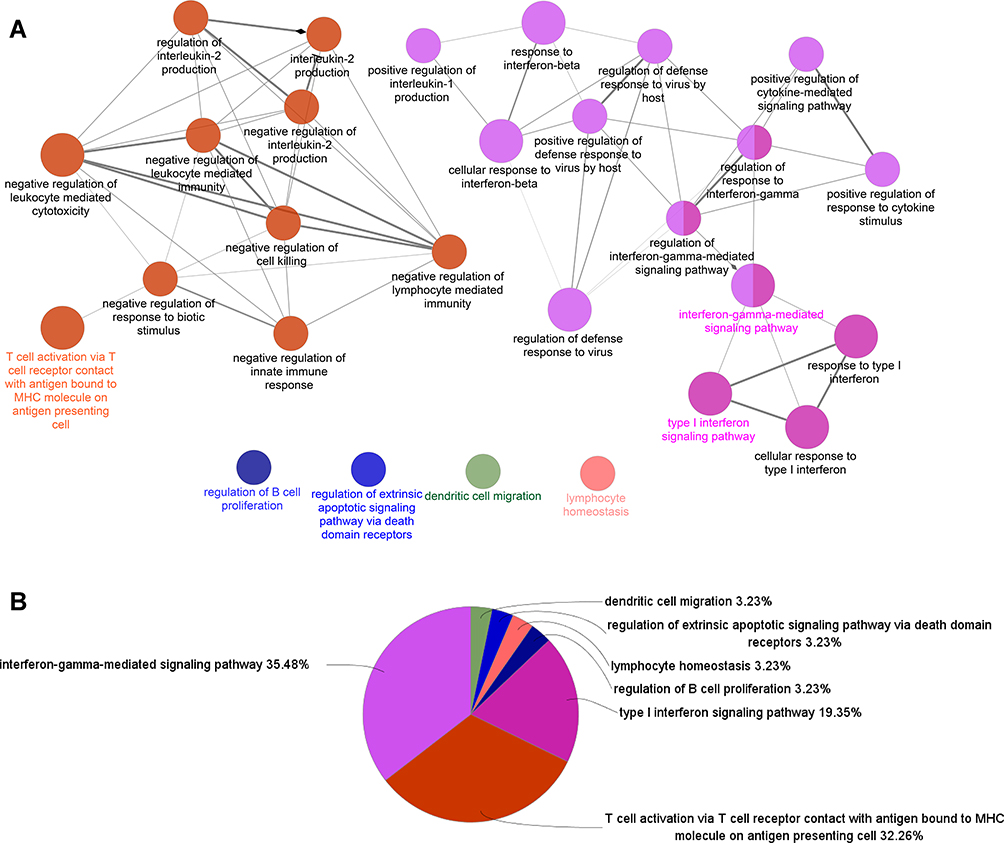 |
Figure 2 ClueGO enrichment analysis. Significantly enriched GO terms of DEGs in SS based on their GlueGO (Biological Processes) and CluePedia functions (A). The pie chart of ClueGO enrichment analysis (B). |
The Kyoto Encyclopedia of Genes and Genomes (KEGG) Pathway Enrichment Analysis
The results of KEGG analysis showed that the upregulated genes were associated with several pathways, including the NOD-like receptor signaling pathway, human cytomegalovirus infection, cytokine–cytokine receptor interaction, and herpes simplex virus 1 infection (Figure 3A). Downregulated genes showed low correlation with SS because of low score compared with upregulated genes (Figure 3B).
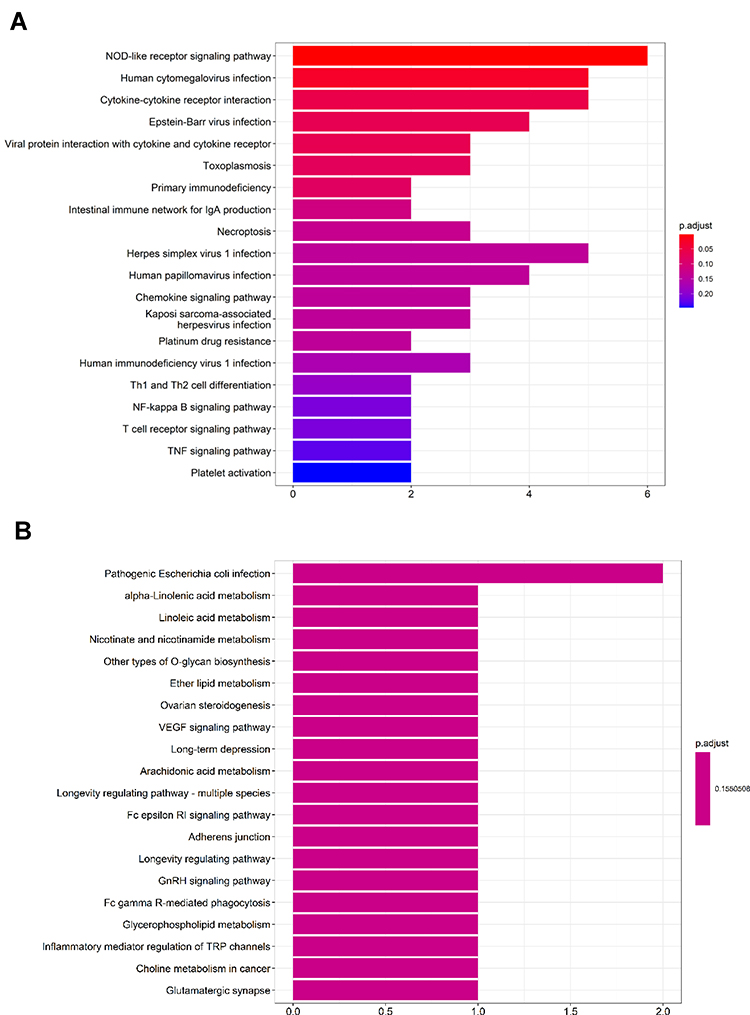 |
Figure 3 KEGG pathway terms of DEGs in SS. A histogram of KEGG enrichment analysis of upregulated genes, which shows a gradual change in color from red to purple, indicating the change in the P value from small to large (A). A histogram of KEGG enrichment analysis of downregulated genes (B). |
Construction of PPI Networks of the Upregulated Genes and Top 20 Hub Genes
PPI networks of the DEGs were constructed using STRING and Cytoscape. After removing three loose nodes, the PPI network contained a total of 50 nodes and 507 edges. We identified the top 20 hub genes, including PTPRC, CCR1, FGL2, MNDA, TNFSF13B, STAT1, IL10RA, LCP2, GBP5, GBP2, SAMD9L, NLRC5, TAGAP, CD53, IKZF1, GBP1, IFIT3, CXCR4, DOCK8, and XAF1 using Cytohubba according to degree. We found that the degree values were largest for Receptor-type tyrosine-protein phosphatase C (PTPRC), Signal transducer and activator of transcription 1(STAT1), Myeloid cell nuclear differentiation antigen (MNDA), Interleukin-10 receptor alpha (IL10RA), and C-C chemokine receptor type 1(CCR1) (Figure 4).
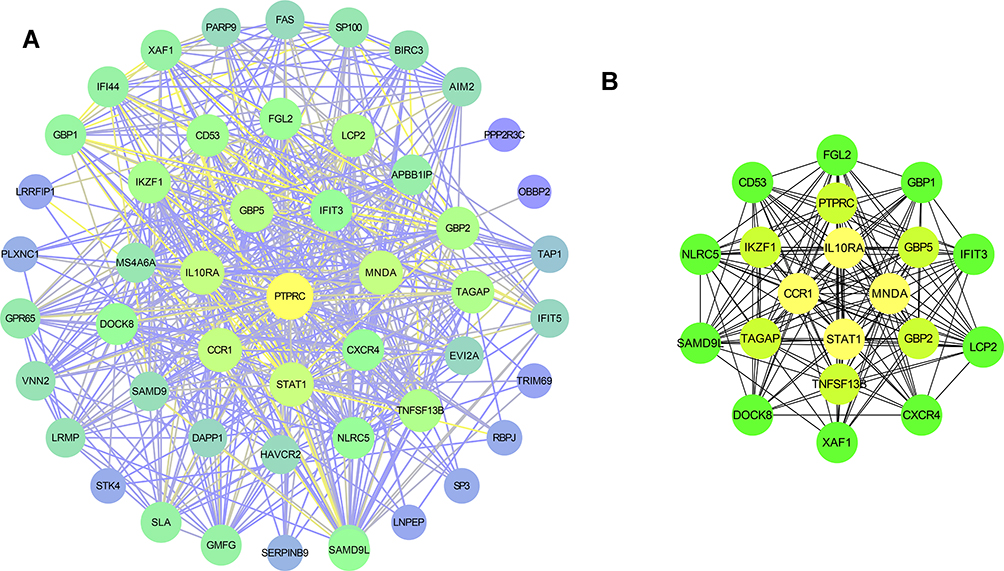 |
Figure 4 Protein–protein interaction (PPI) networks for 53 upregulated DEGs (A) and the top 20 hub genes (B) were constructed using Cytoscape visualization, which shows a gradual change in color from purple to yellow, indicating the change degree value from small to large. |
Expression of Hub Genes in Affected Labial Gland Tissues
In order to validate the diagnostic value of the hub genes, H&E and immunohistochemistry analysis of four upregulated candidate genes, including STAT1, MNDA, IL10RA, and CCR1, in 14 patients and 14 controls were assessed. There was no obvious atrophy in the glands of non-SS comparator group, and the stroma was infiltrated with scattered lymphocytes and plasma cells. The glands of SS patients exhibited various degrees of acinar atrophy and destruction, ductal dilatation, and interstitial fibrosis as compared to non-SS patients, some SS glands showed granulomatous inflammation, adiposis, and germinal centers as compared to non-SS patients. STAT1, MNDA, IL10RA, and CCR1 proteins had increased expression in the labial gland of SS patients as compared to non-SS patients (Figure 5). The IOD of STAT1 and IL10RA was significantly higher in MSGB from SS patients than from non-SS patients (P < 0.001).
 |
Figure 5 H&E and immunohistochemical analysis (A) of STAT1, MNDA, IL10RA, and CCR1 proteins in minor salivary gland biopsy (MSGB) staining from 14 SS patients and 14 non-SS patients (magnification: ×200 for H&E staining and ×200 for IHC). Blue marks the nucleus, and brown marks the target protein. The bar graph indicated medians with interquartile ranges of IOD value (B). ***P<0.001. |
Combination ROC Analysis
The IOD obtained from 14 SS and 14 non-SS patients was converted by logistic regression, and then the ROC value of FS and these hub genes was calculated. Each AUC and combined predicted probability were computed. FS showed a good performance with an AUC of 0.893 (Figure 6A). STAT1 (AUC = 0.807; P < 0.001) and IL10RA (AUC = 0.818; P < 0.001) had a high performance, while CCR1 (AUC = 0.587; P < 0.001) had a low performance. The multiple-gene predicted probability (AUC > 0.9) was higher than the single-gene predicted probability and FS, which signified that the above four genes can be used to distinguish SS from non-SS as compared to MSGB (Figure 6B).
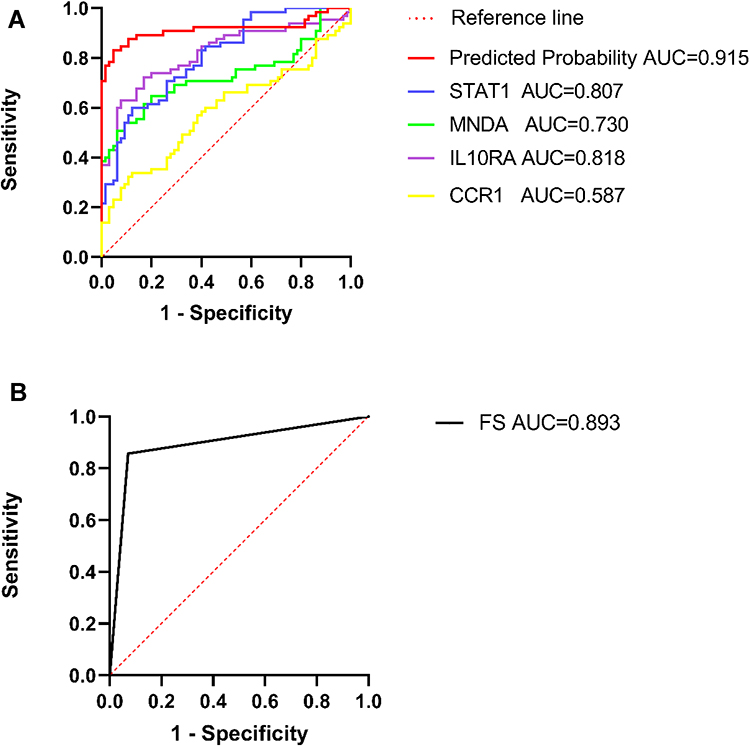 |
Figure 6 The single and combined diagnostic performance of the four genes. The diagnostic performance of FS (A). The diagnostic performance based on the IOD of four genes in SS patients (B). An AUC > 0.8 indicated that the predicted model had good efficacy. Abbreviations: ROC, receiver operating characteristic; AUC, area under the ROC curve. |
Discussion
Although SS is one of the autoimmune diseases, the early diagnosis and treatment of SS are far less studied than systemic lupus erythematosus and rheumatoid arthritis.13 A better understanding of the pathological processes is still needed.14 MSGB classification criteria have been based on three main classification systems including Chisholm and Mason, which described the degree of T or B lymphocyte infiltration or focus of lymphocytes around the salivary glands, with a sensibility and specificity of 72.1% and 80%, respectively.15 Greenspan and Daniels, defined the concept of the FS and FLS, and Tarpley, which added concepts of acinar destruction and fibrosis. While MSGB facilitates a diagnosis in some seronegative patients, it only has a moderate diagnostic performance and needs to be further refined. Subtle changes in foci size might not be accurately described, and the sensitivity and specificity of these scoring systems have never been compared before.16 There are some patients who have atypical clinical presentations and an FS of zero. The further quantification of foci per 4 mm2 tissue section utilizing key genes expression will help to accurately stratify those patients whose clinical information is not obvious, but have a higher risk of developing as SS.17 Our study identified hub genes through the bioinformatics analysis of three salivary gland datasets from SS patients and healthy controls. The hub genes were validated via MSGB of SS patients and non-SS patients. The ROC of the combined diagnostic model using the four indicators had better performance compared with single indicator or FS.
Our ClueGO and KEGG analysis revealed that genes were mainly enriched in viral infection and interferon and inflammation-related signaling pathways, including the NOD-like receptor signaling pathway and human cytomegalovirus (HCMV) infection. Gland invasion and damage caused by viral infection have been implied as mechanisms of SS. HCMV establishes latency in early myeloid lineage cells, and interferon-responsive genes which are targeted during the establishment of HCMV latency. Patients with compromised immune function will relapse once HCMV reactivation occurs.18 A previous study found that SS patients had a significantly higher prevalence of IgG-anti-EA and IgG-anti-VCA antibodies (which are specific in population with acute EBV infections) than healthy controls, and patients with SS that had higher levels of IgG-anti-EA antibodies, which were linked to low levels of C3 and C4, in a case-control study.19 Interferon (IFN) plays an important role in both the pathophysiology and clinical manifestations of SS.20 Most SS patients express a “type I IFN signature” in immune cells, which drive the production of auto-antibodies and a range of clinical manifestations.21 Infection and other factors are known to activate the expression of type I IFN and IFN-γ. These factors activate the NOD-like receptor signaling pathway or transcription of the STAT family, which induce expression of IFN-stimulated genes (ISGs), as well as feedback inhibitory molecules, such as IL-10, in diseased tissues.22 A previous study showed that increased virus-like repetitive elements, such L1 genomic repeat elements, represent endogenous nucleic acid triggers of the type I IFN pathway in SS and may contribute to injury of salivary gland tissue.23
In order to find potential biomarkers for SS, the expression of STAT1 in labial gland biopsy samples was assessed. Phosphorylation of STAT1, a type of signal transducer and transcription activator, mediates cellular inflammation responses in both type I and II IFN signaling pathways.24 Phosphorylated STAT1 induces complex of transcription factors 3(ISGF3) to translocate into the nucleus, where it binds to the IFN stimulation response element (ISRE) to activate the transcription of ISGs, leaving the cell in an antiviral state. Upon stimulation of IFNα2b, phosphorylation of STAT1 differed significantly between SS patients and healthy controls. Type I and II IFN-induced gene expression was positively correlated with the IFN-α2b-induced phosphorylation of STAT1 in B cells, which was associated with the production of auto-antibodies. Targeting STAT1 may contribute to the treatment of patients with SS.25 A JAK-1 inhibitor was thought to inhibit IFN-induced transcription genes and B lymphocyte stimulator (BLyS) dominating B-cell differentiation, homeostasis in human salivary glands, as well as regulate IFNα- and IFNγ-induced pSTAT-1 in human salivary gland epithelial cells (SGECs).26
Myeloid cell nuclear differentiation antigen (MDNA), considered to be an IFN-inducible gene, is a member of the family of the pyrin and HIN domain containing (PYHIN) proteins, and it plays an important role in innate immunity, especially in human granulocytes and monocytes and earlier stage cells in the myeloid lineage.27 MNDA plays an emerging role in inflammation and apoptosis in SS.28 It has been reported as a worthwhile biomarker in PBMCs, which can lead to highly sensitive and specific detection for SS (AUC = 0.84).29
The IL10 receptor α (IL10 Rα) and IL10 receptor β (IL10 Rβ) are members of the IFN receptor (IFNR) family. The IL10 signal is transmitted through two homodimers and a heteroprotein tetramer receptor complex consisting of two IL10 Rα and two IL10 Rβ. STAT signaling is induced downstream by phosphorylation of the cytoplasmic tail of the IL10 Rα and IL10 Rβ by JAK1 and Tyk2, respectively.30 IL10 suppresses proinflammatory responses and sometimes plays a protective role in SS. Possible linkage of IL10 polymorphisms to SS susceptibility has a critical role in the clinical symptoms and serological biomarkers.31 Functional mutations in genes, such as IL10 and IL10RA, have also been reported to be associated with immune dysregulation.32 IL10-producing regulatory B (Breg) cells have been shown to inhibit the follicular helper CD4 T cells (Tfh) cell response by promoting STAT5 phosphorylation and exerting an influence on the therapeutic effects in SS.33 Immunohistochemistry of salivary gland adipose tissue demonstrated that SS patients candidate genes leading to inflammation, such as IL10, IL10RA, and IFN production.33
C-C chemokine receptor 1 (CCR1) is one of the dominant regulators of leukocyte recruitment to resting sites in inflammatory disease. A previous study showed that CCR1-deficient mice exhibited blood and spleen defects, in addition to depletion of eosinophil numbers in the lungs.34 Another study reported that CCR1 antagonists had long-term anti-inflammatory effects and were effective in blocking splenocyte migration in vitro. As such, targeting chemokine receptors is a promising treatment strategy for chronic inflammation diseases.35 The role the CCR receptor family plays in leukocyte recruitment to salivary glands is unclear; therefore, the diagnosis efficacy of CCR1 is not important in this study.
Conclusion
Our results showed that both STAT1 and IL10RA contributed to the sensitive and specific of SS compared with MSGB. Detection of these biomarkers in salivary glands will provide a secondary application of MSGB, and demonstrate the potential of a combined measurement of salivary gland genes for the diagnosis of patients with SS. To our knowledge, this is the first study to develop a gene diagnosis model in SS patients using quantitative data of IHC. Further in vivo and in vitro experiments investigating the epigenetic regulation of interferon genes in lymphocytes are promising, and it is of great significance to the construction of the SS diagnosis model to synchronize interferon genes and inflammatory cytokines at the molecular level, which will help to realize precision medicine approaches of SS as soon as possible. However, it should be noted that this study only covered deficiency of salivary glands. Furthermore, evaluating the diagnostic and prognostic value of combined biomarkers of MSGB in a large cohort of patients with SS is necessary.
Abbreviations
GEO, Gene Expression Omnibus database; DEGs, differentially expressed genes; PPI, protein–protein interaction; ROC, receiver operating characteristic; AUC, area under the ROC curve; MSGB, minor salivary gland biopsy; FLS, focal lymphocytic salivary adenitis; FS, focus score.
Ethics Approval and Informed Consent
This study was performed in accordance with the Declaration of Helsinki. Approval was obtained from the Institutional Ethics Committee of The Second Affiliated Hospital, Zhejiang Chinese Medical University (2021-LW-003-01). Informed consent was waived due to the anonymized processing of patient data.
Funding
This research was supported by National Natural Science Foundation of China (82074341).
Disclosure
The authors report no conflicts of interest for this work.
References
1. Qin B, Wang J, Yang Z, et al. Epidemiology of primary Sjögren’s syndrome: a systematic review and meta-analysis. Ann Rheum Dis. 2015;74:1983–1989. doi:10.1136/annrheumdis-2014-205375
2. Brito-Zerón P, Acar-Denizli N, Ng WF, et al. Epidemiological profile and north-south gradient driving baseline systemic involvement of primary Sjögren’s syndrome. Rheumatology. 2020;59:2350–2359. doi:10.1093/rheumatology/kez578
3. Ramírez Sepúlveda JI, Kvarnström M, Eriksson P, et al. Long-term follow-up in primary Sjögren’s syndrome reveals differences in clinical presentation between female and male patients. Biol Sex Differ. 2017;8:25. doi:10.1186/s13293-017-0146-6
4. Cornec D, Devauchelle-Pensec V, Tobón GJ, Pers JO, Jousse-Joulin S, Saraux A. B cells in Sjögren’s syndrome: from pathophysiology to diagnosis and treatment. J Autoimmun. 2012;39:161–167. doi:10.1016/j.jaut.2012.05.014
5. Lessard CJ, Li H, Adrianto I, et al. Variants at multiple loci implicated in both innate and adaptive immune responses are associated with Sjögren’s syndrome. Nat Genet. 2013;45:1284–1292. doi:10.1038/ng.2792
6. Campos J, Hillen MR, Barone F. Salivary gland pathology in Sjögren’s syndrome. Rheum Dis Clin North Am. 2016;42:473–483. doi:10.1016/j.rdc.2016.03.006
7. Baldini C, Ferro F, Elefante E, Bombardieri S. Biomarkers for Sjögren’s syndrome. Biomark Med. 2018;12:275–286. doi:10.2217/bmm-2017-0297
8. Vitali C, Moutsopoulos HM, Bombardieri S. The European Community Study Group on diagnostic criteria for Sjögren’s syndrome. Sensitivity and specificity of tests for ocular and oral involvement in Sjögren’s syndrome. Ann Rheum Dis. 1994;53:637–647. doi:10.1136/ard.53.10.637
9. Fisher BA, Jonsson R, Daniels T, et al. Standardisation of labial salivary gland histopathology in clinical trials in primary Sjögren’s syndrome. Ann Rheum Dis. 2017;76:1161–1168. doi:10.1136/annrheumdis-2016-210448
10. Brito-Zerón P, Theander E, Baldini C, et al. Early diagnosis of primary Sjögren’s syndrome: EULAR-SS task force clinical recommendations. Expert Rev Clin Immunol. 2016;12:137–156. doi:10.1586/1744666X.2016.1109449
11. Aringhieri G, Izzetti R, Vitali S, et al. Ultra-high frequency ultrasound (UHFUS) applications in Sjogren syndrome: narrative review and current concepts. Gland Surg. 2020;9:2248–2259. doi:10.21037/gs-20-529
12. Shiboski CH, Shiboski SC, Seror R, et al. 2016 American College of Rheumatology/European League Against Rheumatism classification criteria for primary Sjögren’s syndrome: a consensus and data-driven methodology involving three international patient cohorts. Ann Rheum Dis. 2017;76:9–16. doi:10.1136/annrheumdis-2016-210571
13. Fox RI. Sjögren’s syndrome. Lancet. 2005;366:321–331. doi:10.1016/S0140-6736(05)66990-5
14. Wang B, Chen S, Zheng Q, et al. Early diagnosis and treatment for Sjögren’s syndrome: current challenges, redefined disease stages and future prospects. J Autoimmun. 2021;117:102590. doi:10.1016/j.jaut.2020.102590
15. Cui G, Sugai S, Ogawa Y, Takeshita S, Masaki Y. [Evaluation of the histologic criteria for the diagnosis of Sjögren’s syndrome]. Nihon Rinsho Men’eki Gakkai Kaishi = Japanese Journal of Clinical Immunology. 1999;22:72–79. Japanese. doi:10.2177/jsci.22.72
16. Bautista-Vargas M, Vivas AJ, Tobón GJ. Minor salivary gland biopsy: its role in the classification and prognosis of Sjögren’s syndrome. Autoimmun Rev. 2020;19:102690. doi:10.1016/j.autrev.2020.102690
17. Kroese F, Haacke E, Bombardieri M. The role of salivary gland histopathology in primary Sjögren’s syndrome: promises and pitfalls. Clin Exp Rheumatol. 2018;36:222–233.
18. Elder EG, Krishna BA, Williamson J, et al. Interferon-responsive genes are targeted during the establishment of human cytomegalovirus latency. mBio. 2019;10:e02574–19. doi:10.1128/mBio.02574-19
19. Xuan J, Ji Z, Wang B, et al. Serological evidence for the association between Epstein-Barr virus infection and Sjögren’s syndrome. Front Immunol. 2020;11:2826. doi:10.3389/fimmu.2020.590444
20. Marketos N, Cinoku I, Rapti A, Mavragani CP. Type I interferon signature in Sjögren’s syndrome: pathophysiological and clinical implications. Clin Exp Rheumatol. 2019;37(Suppl 118):185–191.
21. Bodewes I, Björk A, Versnel M, Wahren-Herlenius M. Innate immunity and interferons in the pathogenesis of Sjögren’s syndrome. Rheumatology. 2019;60:2561–2573.
22. Barrat F, Crow M, Ivashkiv L. Interferon target-gene expression and epigenomic signatures in health and disease. Nat Immunol. 2019;20:1574–1583. doi:10.1038/s41590-019-0466-2
23. Mavragani C, Sagalovskiy I, Guo Q, et al. Expression of long interspersed nuclear element 1 retroelements and induction of type I interferon in patients with systemic autoimmune disease. Arthritis Rheum. 2016;68:2686–2696. doi:10.1002/art.39795
24. Rauch I, Müller M, Decker T. The regulation of inflammation by interferons and their STATs. Jak-Stat. 2013;2:e23820. doi:10.4161/jkst.23820
25. Davies R, Hammenfors D, Bergum B, et al. Aberrant cell signalling in PBMCs upon IFN-α stimulation in primary Sjögren’s syndrome patients associates with type I interferon signature. Eur J Immunol. 2018;48:1217–1227. doi:10.1002/eji.201747213
26. Lee J, Lee J, Kwok SK, et al. JAK-1 inhibition suppresses interferon-induced BAFF production in human salivary gland: potential therapeutic strategy for primary Sjögren’s syndrome. Arthritis Rheumatol. 2018;70:2057–2066. doi:10.1002/art.40589
27. Briggs RC, Briggs JA, Ozer J, et al. The human myeloid cell nuclear differentiation antigen gene is one of at least two related interferon-inducible genes located on chromosome 1q that are expressed specifically in hematopoietic cells. Blood. 1994;83:2153–2162. doi:10.1182/blood.V83.8.2153.2153
28. Mondini M, Costa S, Sponza S, Gugliesi F, Gariglio M, Landolfo S. The interferon-inducible HIN-200 gene family in apoptosis and inflammation: implication for autoimmunity. Autoimmunity. 2010;43:226–231. doi:10.3109/08916930903510922
29. Hu S, Gao K, Pollard R, et al. Preclinical validation of salivary biomarkers for primary Sjögren’s syndrome. Arthritis Care Res. 2010;62:1633–1638. doi:10.1002/acr.20289
30. Moore KW, de Waal Malefyt R, Coffman RL, O’Garra A. Interleukin-10 and the interleukin-10 receptor. Annu Rev Immunol. 2001;19:683–765. doi:10.1146/annurev.immunol.19.1.683
31. Colafrancesco S, Ciccacci C, Priori R, et al. STAT4, TRAF3IP2, IL10, and HCP5 polymorphisms in Sjögren’s syndrome: association with disease susceptibility and clinical aspects. J Immunol Res. 2019;2019:7682827. doi:10.1155/2019/7682827
32. Cabral-Marques O, Schimke LF, de Oliveira EB, et al. Flow cytometry contributions for the diagnosis and immunopathological characterization of primary immunodeficiency diseases with immune dysregulation. Front Immunol. 2019;10:2742. doi:10.3389/fimmu.2019.02742
33. Lin X, Wang X, Xiao F, et al. IL-10-producing regulatory B cells restrain the T follicular helper cell response in primary Sjögren’s syndrome. Cell Mol Immunol. 2019;16:921–931. doi:10.1038/s41423-019-0227-z
34. Dyer DP, Medina-Ruiz L, Bartolini R, et al. Chemokine receptor redundancy and specificity are context dependent. Immunity. 2019;50(2):378–389.e5. doi:10.1016/j.immuni.2019.01.009
35. Chou PH, Chee A, Shi P, et al. Small molecule antagonist of C-C chemokine receptor 1 (CCR1) reduces disc inflammation in the rabbit model. Spine J. 2020;20:2025–2036. doi:10.1016/j.spinee.2020.07.001
 © 2021 The Author(s). This work is published and licensed by Dove Medical Press Limited. The
full terms of this license are available at https://www.dovepress.com/terms
and incorporate the Creative Commons Attribution
- Non Commercial (unported, 3.0) License.
By accessing the work you hereby accept the Terms. Non-commercial uses of the work are permitted
without any further permission from Dove Medical Press Limited, provided the work is properly
attributed. For permission for commercial use of this work, please see paragraphs 4.2 and 5 of our Terms.
© 2021 The Author(s). This work is published and licensed by Dove Medical Press Limited. The
full terms of this license are available at https://www.dovepress.com/terms
and incorporate the Creative Commons Attribution
- Non Commercial (unported, 3.0) License.
By accessing the work you hereby accept the Terms. Non-commercial uses of the work are permitted
without any further permission from Dove Medical Press Limited, provided the work is properly
attributed. For permission for commercial use of this work, please see paragraphs 4.2 and 5 of our Terms.