Back to Journals » Cancer Management and Research » Volume 12
Bioinformatics Analysis and Validation Identify CDK1 and MAD2L1 as Prognostic Markers of Rhabdomyosarcoma
Authors Lu S, Sun C, Chen H, Zhang C, Li W ![]() , Wu L, Zhu J
, Wu L, Zhu J ![]() , Sun F
, Sun F ![]() , Huang J
, Huang J ![]() , Wang J, Zhen Z
, Wang J, Zhen Z ![]() , Cai R, Sun X, Zhang Y, Zhang X
, Cai R, Sun X, Zhang Y, Zhang X
Received 8 July 2020
Accepted for publication 16 September 2020
Published 26 November 2020 Volume 2020:12 Pages 12123—12136
DOI https://doi.org/10.2147/CMAR.S265779
Checked for plagiarism Yes
Review by Single anonymous peer review
Peer reviewer comments 2
Editor who approved publication: Dr Sanjeev K. Srivastava
Suying Lu,1,2,* Chengtao Sun,3,* Huimou Chen,1,2,* Chao Zhang,1,4,* Wei Li,5 Liuhong Wu,1,2 Jia Zhu,1,2 Feifei Sun,1,2 Junting Huang,1,2 Juan Wang,1,2 Zijun Zhen,1,2 Ruiqing Cai,1,2 Xiaofei Sun,1,2 Yizhuo Zhang,1,2 Xing Zhang1,6
1State Key Laboratory of Oncology in South China, Collaborative Innovation Center for Cancer Medicine, Guangzhou, Guangdong, 510060, People’s Republic of China; 2Department of Pediatric Oncology, Sun Yat-Sen University Cancer Center, Guangzhou, Guangdong 510060, People’s Republic of China; 3Department of Hematology, Tianjin Medical University Cancer Institute and Hospital, National Clinical Research Center for Cancer, Key Laboratory of Cancer Prevention and Therapy, Tianjin, Tianjin’s Clinical Research Center for Cancer, Tianjin 300060, People’s Republic of China; 4Department of Pathology, Sun Yat-Sen University Cancer Center, Guangzhou, Guangdong 510060, People’s Republic of China; 5Department of Cardiology, Guangzhou Women and Children’s Medical Center, Guangzhou Medical University, Guangzhou, People’s Republic of China; 6Department of Medical Melanoma and Sarcoma, Sun Yat-Sen University Cancer Center, Guangzhou, Guangdong 510060, People’s Republic of China
*These authors contributed equally to this work
Correspondence: Xing Zhang
Department of Medical Melanoma and Sarcoma, Sun Yat-Sen University Cancer Center, 651 East Dongfeng Road, Guangzhou, Guangdong 510060, People’s Republic of China
Tel/Fax +86-020-87343629
Email [email protected]
Yizhuo Zhang Department of Pediatric Oncology
Sun Yat-sen University Cancer Center, 651 East Dongfeng Road, Guangzhou, Guangdong 510060, People’s Republic of China
Tel/Fax +86-020-87342458
Email [email protected]
Purpose: The goal of the current study was to identify potential prognostic biomarkers of rhabdomyosarcoma (RMS).
Materials and Methods: We screened chip sequencing datasets of RMS through the gene expression omnibus (GEO) database. A total of 74 RMS patient tissues and 39 normal muscle cell tissues were analyzed. Limma R software was used to identify the differentially expressed genes (DEGs) between RMS tissues and normal controls. The GO plot R package was used to visualize the results of the GO analysis. We screened for pathaffy package enrichment of DEGs by the Kyoto Encyclopedia of Genes and Genomes (KEGG). The cutoff criterion was a P-value < 0.05. Immunohistochemistry (IHC) was applied to validate the expression of CDK1 (cyclin-dependent kinases 1) and MAD2L1 (Mitotic Arrest Deficient 2 Like 1) in RMS.
Results: We obtained a total of 498 up- and 480 down-regulated DEGs. The hub genes are mainly involved in the cell cycle and P53 singling pathway. CDK1 expression was associated with tumor size and COG-STS (Children’s Oncology Group-soft tissue sarcoma) staging of RMS. For the low CDK1 expression group and high CDK1 expression group, the 5-year overall survival (OS) rate was 83.0% vs 63.5% (P = 0.004), and the 5-year event-free survival (EFS) rate was 47.5% vs 27.5% (P = 0.049) respectively. When compared low MAD2L1 expression group with high MAD2L1 expression group, the 5-year OS rate was 80.0% vs 43.2% (P = 0.001), and the 5-year EFS rate was 45.1% vs 21.8% (P = 0.038), respectively. If patients were divided into three groups: low CDK1 and low MAD2L1 expression group, high CDK1 or high MAD2L1 expression group, and high CDK1 and high MAD2L1 expression group, the 5-year OS rate was 87.1%, 58.6%, 39.6% (P = 0.001), while the 5-year EFS rate of RMS patients was 54.2%, 23.2%, 21.7% (P = 0.028), respectively.
Conclusion: This study has identified that CDK1 and MAD2L1 were adverse prognostic factors of RMS.
Keywords: rhabdomyosarcoma, GEO, TCGA, CDK1, MAD2L1, prognosis
Introduction
Rhabdomyosarcoma (RMS) is the most common soft tissue sarcoma in children, which accounts for about 50% of all childhood soft tissue sarcoma1. It is an aggressive childhood cancer that is generally defined as skeletal muscle tumor, mainly because it typically arise in or near muscle beds and represent features of myogenic differentiation.2,3 Over the past 30 years, the survival of patients with the non-metastatic disease has improved owing to the application of a multimodality approach that includes chemotherapy coordinated with surgery and radiotherapy. In large cooperative group clinical trials, the 5-year OS of RMS has improved substantially, such that it now exceeds 70%.4–8 However, the progression-free survival remained around 55–70%,9 It remains challenging to define risk factors in a rare cancer type with an incidence of 4~5 patients per million individuals. Historically, pediatric RMS mainly consisted of embryonal RMS (ERMS) and alveolar RMS (ARMS). For ARMS, PAX-FOXO1 fusion status is a key poor prognostic biomarker.10,11 One study demonstrated that FANCD2 may be a biomarker and therapeutic target in ARMS harboring the PAX3–FOXO1 fusion gene.12 Studies also found that enrichment of copy number aberrations and mutations include CDK4, MYCN, and CDKN2A/B affecting cell-cycle regulators. For ERMS, Previous studies demonstrated that approximately 50% to 75% of intermediate- and high-risk RMS patients have a gene mutation in the RAS pathway (including HRAS, NRAS, KRAS, and NF1).13,14 And RAS pathway mutations are more likely to happen in the embryonal histologic subtype. Elizabeth Stewart et al also identified the most altered in RMS integrated analysis pathways were G2/M-mitotic spindle and UPR checkpoint. Other less commonly mutated genes consisted of TP53, PI3KCA, FBXW7, BCOR, FGFR4, and CTNNB1.13 However, the effect of targeted therapy for RMS is not satisfactory. It is extremely urgent to identify new tumor markers of RMS and transform them into clinical practice.
Bioinformatics analysis has gradually been used to explore the mechanisms of cancer initiation and progression to clarify important cancer-related genes in recent years. The Gene Expression Omnibus (GEO, http://www.ncbi.nlm.nih.gov/ge) experiments and curated gene expression profiles,15–19 The Cancer Genome Atlas (TCGA, http://cancergenome.nih.gov/) is a large-scale cancer genome program, molecularly characterized over 20,000 primary cancers and matched normal samples spanning 33 types of cancer. One obvious advantage of GEO and TCGA is that the data from the different centers can be integrated to obtain a greater number of clinical samples for achieving a more robust analysis, and novel cancer-related genes can be found efficiently by mining big data sets.20–22 However, few studies focused on the prognostic biomarkers of RMS.23 Therefore, we integrated datasets selected from the GEO database to identify hub genes of RMS and then validated them in RMS human tissue samples.
Materials and Methods
Collection of Datasets
In this study, the chip sequencing datasets of RMS were identified from the GEO data-base. Gene expression profiles of GSE66533, GSE68012, and GSE16382 were selected. A total of 74 samples of RMS patient tissues were screened, including GSE66533 (N = 58), GSE68012 (N = 8), and GSE16382 (N = 8). And 39 normal muscle cell tissues consisting of GSE12474 (N = 4), GSE48574 (N = 5), GSE38417 (N = 6), GSE39454 (N = 5), GSE38680 (N = 9), and GSE13608 (N = 10) were analyzed. To ensure the consistency of data analysis, all data were obtained from the GPL570 platform (Affymetrix Human Genome U133 Plus 2.0 Array, Affymetrix, Santa Clara, CA, U.S.A.).
Analysis of DEGs
Affy package was used to read the original CEL files, and then the data was integrated. The batch effect was removed by the bladder batch package and the data was normalized by the limma package. DEGs between RMS tissues and normal controls were calculated by the limma package. Limma R software was used to compare and identify the DEGs between RMS tissues and normal controls. DEGs were identified based on the following criteria: they had a |log2FC| = 2 and a P-value <0.01. The DEGs were identified by a comprehensive analysis of the above datasets between RMS patient tissues and normal muscle cell tissues.
Functional Enrichment and Pathway Analysis
Integrating biological information of DEGs was analyzed by the Database for Annotation, Visualization, and Integrated Discovery (DAVID, version 6.7, https://david.ncifcrf.gov/) and FUNRICH Software. Gene ontology (GO) enrichment analysis was conducted to analyze the functions of the DEGs. The Kyoto Encyclopedia of Genes and Genomes (KEGG) pathway analysis was applied to explore the pathway enrichment of DEGs. All the analyses were performed using the cluster Profiler package. The cutoff criterion was a P-value <0.05.
PPI Network Construction and Module Production
The Search Tool for the Retrieval of Interacting Genes/Proteins (STRING; http://www.string-db.org/) was utilized to identify the relevant protein-protein interaction (PPI) for the key genes. Only protein pairs with a confidence score that was >0.7 were utilized to construct the PPI network. Besides, Cytoscape software (http://www.cytoscape.org/) was used for visualizing the PPI network of common DEGs. Furthermore, with a node score cutoff of 0.2, a degree cutoff of 2, a k-core of 2, and a max depth of 100,24 the gene modules in the PPI network were extracted from the Cluster Finding algorithm in MCODE. The plugins CytoHubba and MCODE25 of Cytoscape26 were applied to select hub genes and the most important modules in the network to gain high-connectivity genes and functional enrichment.
Bioinformatics Analysis of the Association Between Hub Genes and Overall Survival in Patients with Sarcoma
Then a set of hub genes signature selected from DEGs were validated by GEPIA based on TCGA data and demonstrated good performance for predicting 5-year OS. The clinical data and gene expression data of patients from TCGA were used to validate the hub genes selected from DEGs. Kaplan–Meier survival curves of 10-year overall survival (OS) were plotted for the TCGA cohorts. The survival R package was used for survival analysis. And a P-value <0.05 was set as the cutoff criterion.
Quantitative RT-PCR for the TOP10 Hub Genes
Robust up-regulation of TOP10 hub genes was confirmed by quantitative polymerase chain reaction (qRT-PCR). RNeasy Plus Mini Kit (Qiagen) was sued for RNA isolation from RMS cells. And mRNA expression was determined by Roche LightCycler® 480 SYBR Green I Master. Each experiment was repeated at least three times. Forward and reverse primers used for quantitative RT-PCR are listed in Table S2. The primers were purchased from Shanghai General Biotechnology Co., Ltd.
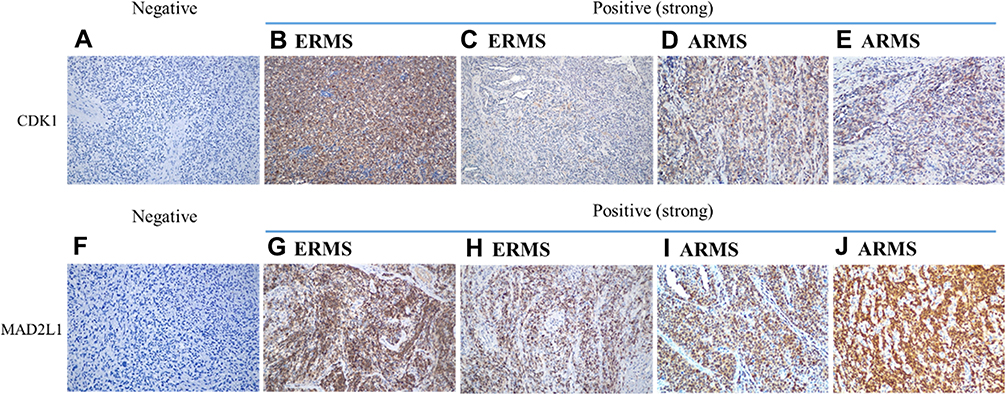 |
Figure 1 IHC staining of CDK1 and MAD2L1 expression in RMS. IHC staining for CDK1 demonstrated strong nuclear expression in RMS. (A) Negative control (× 200). (B) ERMS (× 200). (C) ERMS (× 200). (D) ARMS (× 200). (E) ARMS (× 200). IHC staining for MAD2L1 demonstrated nuclear or cytoplasm expression in RMS. (F) Negative control (× 200); (G) ERMS (× 200). (H) ERMS (× 200). (I) ARMS (× 200). (J) ARMS (× 200). |
Collection of Patients’ Tissue Specimens and Clinical Data
We reviewed the medical records of all patients aged <18 years with RMS treated at Sun Yat-sen University Cancer Center from May 2003 to November 2017. Detailed medical records were collected from our institutional database. We extracted data on clinical characteristics, histopathology, staging, treatment, and outcomes. All patients’ paraffin-embedded RMS specimens were collected. As all patients analyzed were under the age of 18 years, informed consent was obtained from all patients as well as their custodian. This research has been approved by the Ethics committee of Sun Yat-sen University Cancer Center.
Immunohistochemistry (IHC)
The antibodies used for IHC consisted of anti-CDK1 rabbit monoclonal antibody (EPR165 [ab133327]; Abcam) and anti-MAD2L1 mouse monoclonal antibody (17D10 [ab10691]; Abcam). Slides with lengths of 1~2mm formalin-fixed, paraffin-embedded tissue sections from RMS were stained manually. For IHC staining, each slide was deparaffinized and rehydrated using xylene and then washed by a graded alcohol series and phosphate buffer saline (PBS). Antigen repair was performed by boiling the tissue slice in 0.01M citric acid buffer (pH6.0) for 15min and cooling it naturally to room temperature. Endogenous peroxidase was blocked using TBS/H2O2. The sections were incubated with first antibodies against human CDK1 and MAD2L1, and then incubated with goat secondary antibody against rabbit and mouse immunoglobulins (DAKO) at 37°C for 30 min.
IHC Assessment
Two independent pathologists without knowledge of the pathologic and clinical features of the cases assessed IHC staining. The CDK1 and MAD2L1 scores were calculated as the score of the positive cells count × the score of staining intensity. Scores (0~4) indicate low expression levels, while scores (5~9) indicate high expression levels. The percentage of positive cells were divided into four levels (0 [0%], 1 [<25%],2 [25–75%]), and 3 [>75%].27 And the staining intensity was differentiated into four levels (0 [No staining], 1 [Weak: weak staining of a minority of the cells], 2 [Moderate: weak staining of the majority of the cells or strong staining of a minority of the cells], 3 [Strong: strong staining of the majority of the cells]).28
Statistical Analysis
SPSS version 21.0 (SPSS, Inc., Chicago, IL, USA) was used for statistical analyses. For survival analysis, OS was defined as the time from the diagnosis of disease to death or last follow-up. EFS was defined as the time from the diagnosis of disease to metastatic disease or recurrent disease or death or last follow-up. Survival analysis was performed using the Kaplan-Meier plotter with the Log rank test. Multivariate analyses for OS and EFS were performed using the Cox proportional hazards model. A Chi-square test was used to analyze the associations between protein expressions and patient characteristics. P < 0.05 was considered as statistical significance.
Results
Datasets from the GEO
Based on the cut-off criteria of P < 0.01 and [logFC] = 2 for selecting DEGs, a total of 978 DEGs, including 498 up-regulated DEGs and 480 down-regulated DEGs were identified. All DEG volcano diagrams are shown in Figure 2A. As shown in Figure 2B, the heat map of the common DEGs between RMS tissues and normal controls were shown.
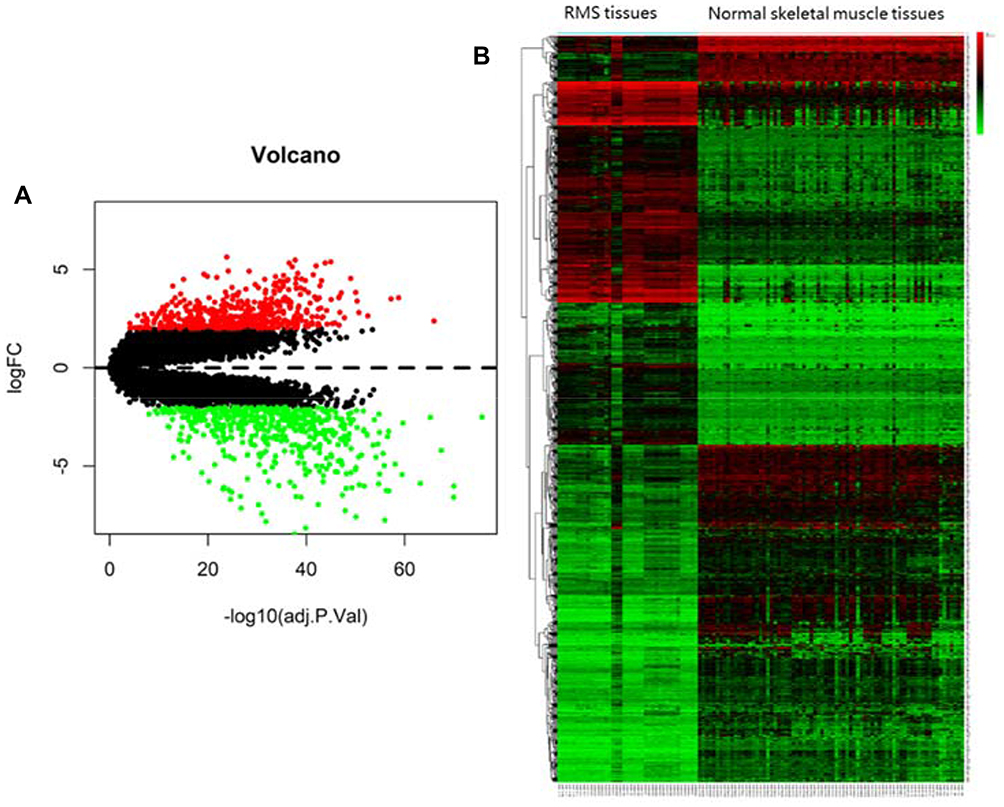 |
Figure 2 (A) Volcanic diagram of differentially expressed genes (DEGs). (B) The Heat map of the common DEGs between RMS tissues and normal skeletal muscle tissues. Volcano plots for microarray data on DEGs between RMS and normal tissues. Red dots represent up-regulated and green dots indicate down-regulated DEGs. Black dots indicate genes that are not differentially expressed. The x-axis indicates transformed (−log10) FDR and the y-axis denotes the value of log2FC. Higher, lower, and same expression levels of genes are shown in red, green, and black respectively. Color bars on top of the heat map indicate sample types, with blue and pink representing RMS tissues and normal skeletal muscle tissues, respectively. |
Functional and Pathway Analysis of DEGs in RMS
As shown in Figure 3A, GO enriched functions for the 498 overlapped up-regulated genes were mainly involved in tubulin binding, microtubule-binding, ATPase activity, catalytic activity (acting on DNA), extracellular matrix structural constituent, and so on. KEGG pathway analysis for the 498 overlapped up-regulated genes showed that RMS mRNAs have a clear relationship with cell cycle, cellular senescence, P53 singling pathway, and so on (Figure 3B). While, the GO enriched functions for the overlapped 480 down-regulated DEGs included actin binding, actin filament binding, coenzyme binding, phosphoric ester hydrolase activity, calmodulin-binding, actinin binding, and so on (Figure 4A). And KEGG pathways for the 480 overlapped down-regulated genes consisted of Adrenergic signaling in cardiomyocytes, Cardiac muscle contraction, Calcium signaling pathway, Hypertrophic cardiomyopathy (HCM), Dilated cardiomyopathy (DCM), cGMP-PKG signaling pathway, and so on (Figure 4B).
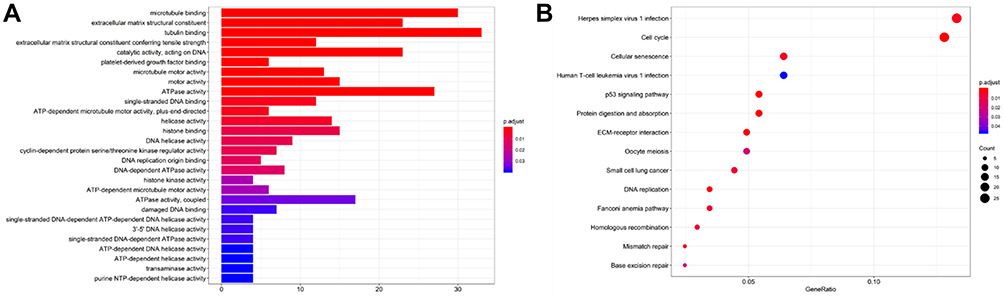 |
Figure 3 (A) The GO functions of up-regulated genes. (B) The KEGG functions of up-regulated genes. The functions of up-regulated genes were predicted by the analysis of KEGG by DAVID tools (https://david.ncifcrf.gov/summary.jsp). |
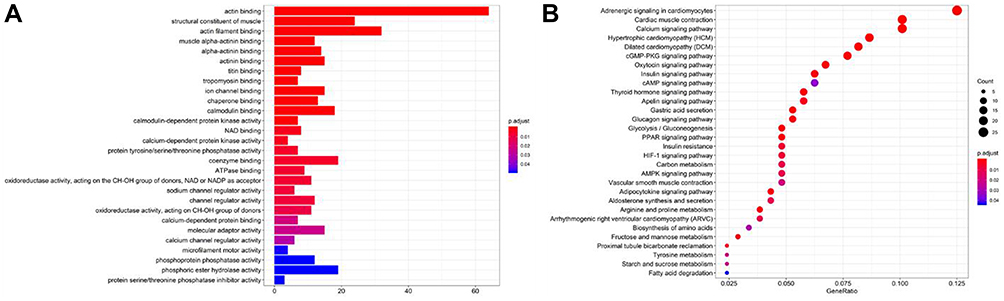 |
Figure 4 (A) The GO functions of down-regulated genes. (B) The KEGG functions of down-regulated genes. |
TOP 10 Hub Genes of RMS
DEGs PPI network complex and modular analysis were shown in Figure S1. The PPI network contains 612 nodes and 5129 edges. We screened the top 10 hub genes with cytohubba. The TOP ten hub genes included TOP2A (DNA Topoisomerase II Alpha), CCNB1 (cyclin B1), UBE2C (ubiquitin-conjugating enzyme E2C), KIF11 (kinesin family member 11), NCAPG (non-SMC condensin I complex, subunit G), CDC20 (cell division cycle 20), CDK1, MAD2L1, CCNA2 (cyclin A2), and CCNB2 (cyclin B2) (Figure 5A) (Table S1). All the hub genes were up-regulated. Heat map of the TOP10 hub genes between RMS tissues and normal controls were shown in Figure 5B. The GO plot R package was used to visualize the results of the GO analysis. We screened for pathway enrichment of DEGs by KEGG. GO enriched functions for the Top 10 hub genes were involved in cyclin-dependent protein serine/threonine kinase regulator activity, protein kinase regulator activity, protein C-terminus binding, kinase regulator activity, histone kinase activity, cyclin-dependent protein kinase activity, histone deacetylase binding, cyclin-dependent protein serine/threonine kinase activity, cyclin binding, and so on (Figure 5C). KEGG pathways of TOP10 genes consisted of Cell cycle, Cellular senescence, p53 signaling pathway, FoxO signaling pathway, and Ubiquitin mediated proteolysis, and so on (Figure 5D).
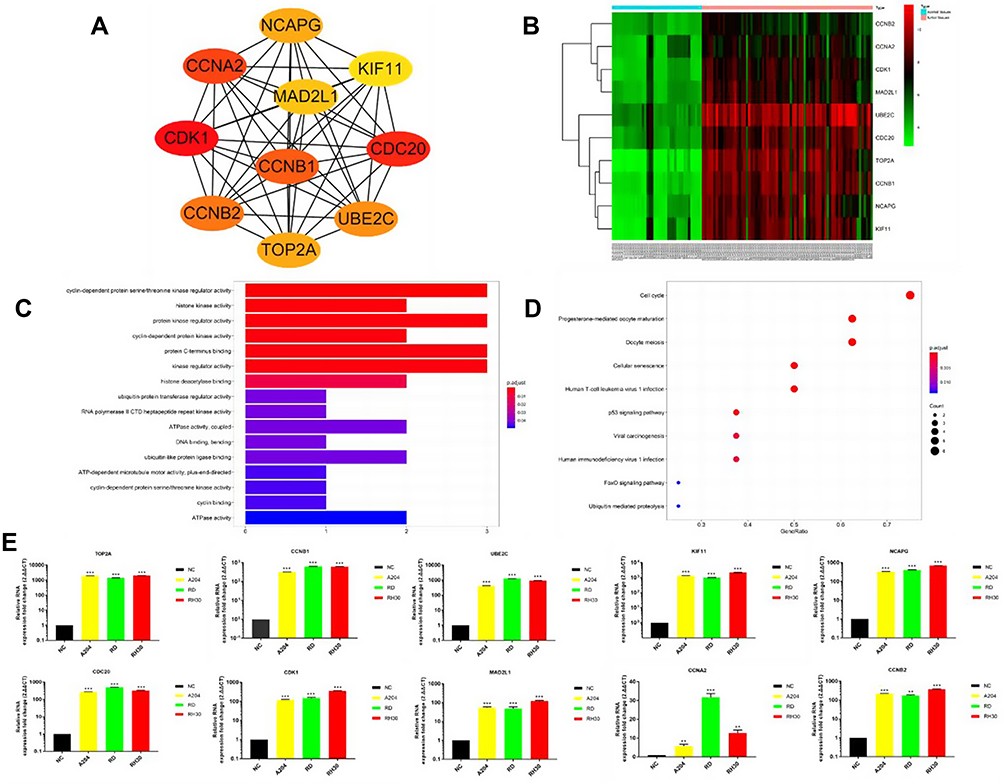 |
Figure 5 (A) TOP10 hub genes. (B) The Heat map of the TOP10 hub genes between RMS tissues and normal skeletal muscle tissues. (C) The GO functions of TOP10 hub genes. (D) The KEGG functions of TOP10 hub genes. Higher, lower, and same expression levels of genes are shown in red, green, and black respectively. Color bars on top of the heat map indicate sample types, with blue and pink representing RMS tissues and normal skeletal muscle tissues, respectively. (E) Quantitative RT-PCR (qRT-PCR) results for TOP10 hub genes. RNA isolated from normal muscle tissue was used as NC. **P<0.01, ***P<0.001. |
Network Construction and Module Analysis of PPI
Module analysis of the PPI network was carried out by using mode plug-in of Cytoscape software, and the first four core modules were obtained according to the scores (Figure 6A, C, E and G). The KEGG pathways of the module 1 section were involved in the cell cycle, oocyte meiosis, human T-cell leukemia virus 1 infection, p53 signaling pathway, cellular senescence, progesterone-mediated oocyte maturation, mismatch repair, viral carcinogenesis, human immunodeficiency virus 1 infection, DNA replication, FoxO signaling pathway, pyrimidine metabolism (Figure 6B).
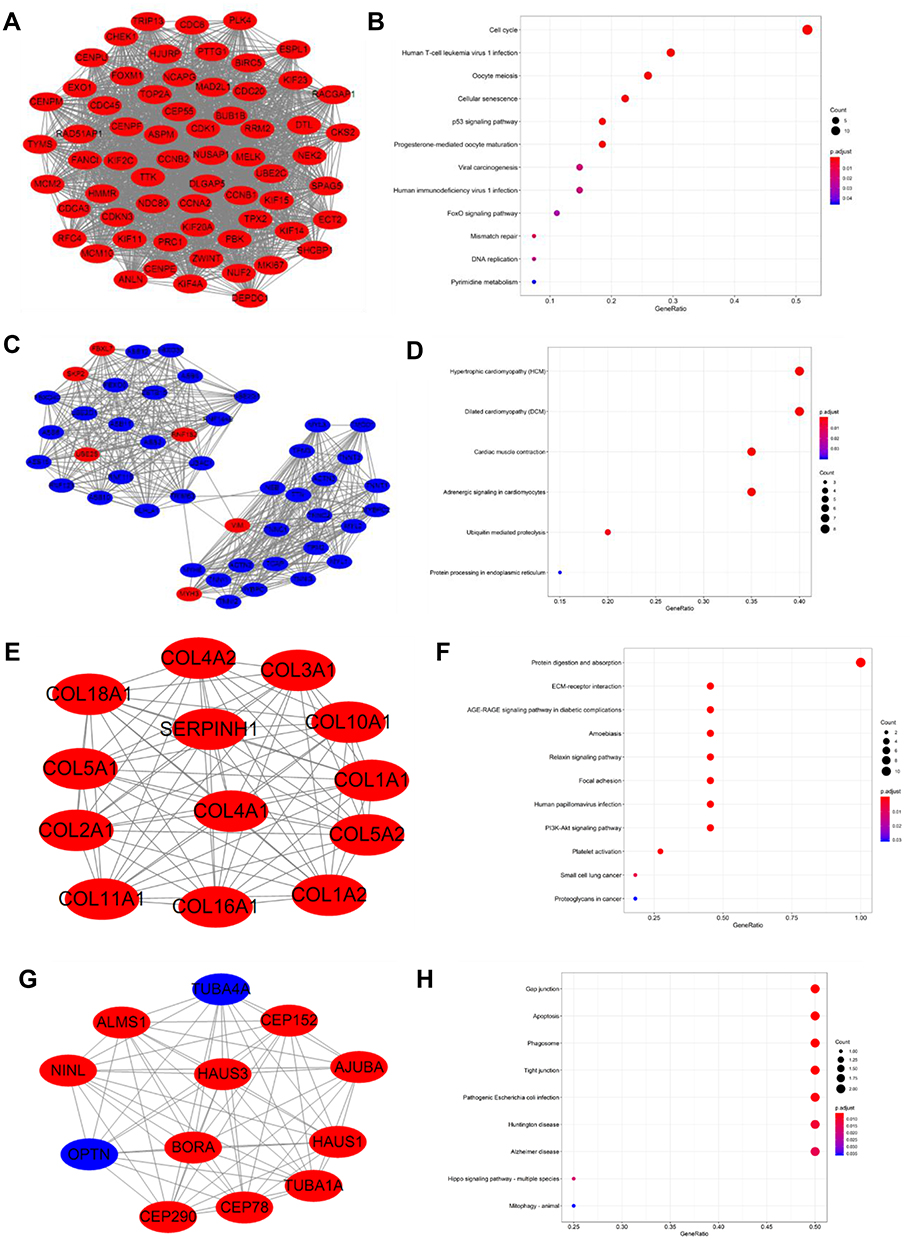 |
Figure 6 Top 4 modules with enrichment pathways identified from PPI of DEGs. (A) Module 1; (B) The KEGG functions of Module 1; (C) Module 2; (D) The KEGG functions of Module 2; (E) Module 3; (F) The KEGG functions of Module 3; (G) Module 4; (H) The KEGG functions of Module 4. Red nodes represent up-regulated and blue nodes indicate down-regulated DEGs. |
The KEGG pathways of the module 2 section contain hypertrophic cardiomyopathy (HCM), dilated cardiomyopathy (DCM), cardiac muscle contraction, adrenergic signaling in cardiomyocytes, ubiquitin-mediated proteolysis, protein processing in the endoplasmic reticulum (Figure 6D).
The KEGG pathways of the module 3 section contain protein digestion and absorption, ECM-receptor interaction, AGE-RAGE signaling pathway in diabetic complications, amoebiasis, relaxin signaling pathway, focal adhesion, human papillomavirus infection, PI3K-Akt signaling pathway, platelet activation, small cell lung cancer, proteoglycans in cancer (Figure 6F).
The KEGG pathways of the module 4 section were involved gap junction, apoptosis, phagosome, tight junction, pathogenic escherichia coli infection, huntington disease, alzheimer disease, hippo signaling pathway - multiple species, mitophagy – animal (Figure 6H).
Survival Analysis Validation in TCGA
Since there is no database of RMS in TCGA, we used the sarcoma database to validate. Firstly, among all the TOP 10 hub genes, we validated that the expression levels of CCNA2, CDK1, CCNB2, MAD2L1, KIF11, and NCAPG were higher in sarcoma tissue than in normal tissue by GEPIA (Gene Expression Profiling Interactive Analysis, http://gepia.cancer-pku.cn/) (Figure 7). Then the associations between the expression of hub genes and OS in sarcoma were identified by GEPIA. Our analysis demonstrated that high CCNA2 (Figure 7A), CDK1 (Figure 7B), CCNB2 (Figure 7C), MAD2L1 (Figure 7D), KIF11 (Figure 7E), and NCAPG (Figure 7F) expression were significantly associated with poor OS (P=0.0022, 0.0063, 0.017, 0.018, 0.023 and 0.037) respectively, while the other four hub genes were not associated with OS.
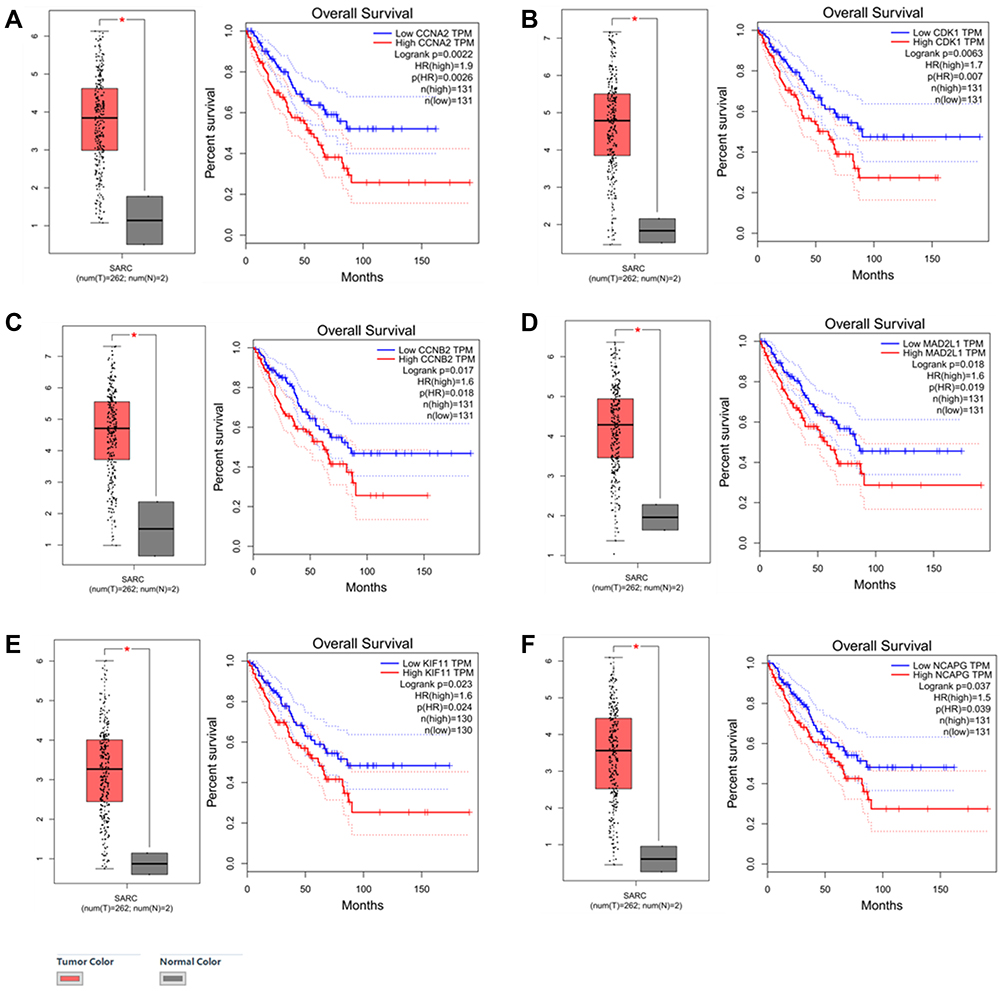 |
Figure 7 The expression of six hub genes in SARC compared with normal tissue, And OS by low and high gene expression in SARC in TCGA datasets. (A) CCNA2. (B) CDK1. (C) CCNB2. (D) MAD2L1. (E) KIF11. (F) NCAPG. *P<0.05. |
Quantitative RT-PCR for the TOP10 Hub Genes
RNA isolated from normal muscle tissue was used as normal control (NC). The results of quantitative RT-PCR (qRT-PCR) confirmed that the mRNA expression of TOP10 genes was significantly higher than the NC (Figure 5E).
Patient Characteristics
As shown in Table 1, among of the total 107 cases, 74 were male (69.2%). The median age at the time of diagnosis was 7 years (range 1~18). Histologic subtypes included embryonal rhabdomyosarcoma (ERMS) (n = 88, 82.6%), alveolar rhabdomyosarcom (ARMS) (n = 14, 13.0%), spindle cell/sclerosing rhabdomyosarcoma (SSRMS) (n = 2, 1.7%), pleomorphic rhabdomyosarcoma (PRMS) (n = 1, 0.9%), mixed rhabdomyosarcoma of embryonal and alveolar types (n = 1, 0.9%), and undifferentiated rhabdomyosarcoma (n = 1, 0.9%). Primary tumor sites included head and neck (n = 38, 36.5%), genito-urinary region (n = 20, 20.0%), Abdominal and pelvic region (n = 18, 16.5%), trunk (n = 17, 14.8%), extremity (n = 13, 11.3%), and other (n = 1, 0.9%). More than half (56.5%) of patients tumor size was > 5cm. Most patients had no distant metastasis at the time of diagnosis (n = 93, 86.1%). Nearly half of the patients received the combination therapy of surgery, chemotherapy, and radiotherapy (n = 47, 40.9%). The median follow-up time was 60 months (14.07~159).
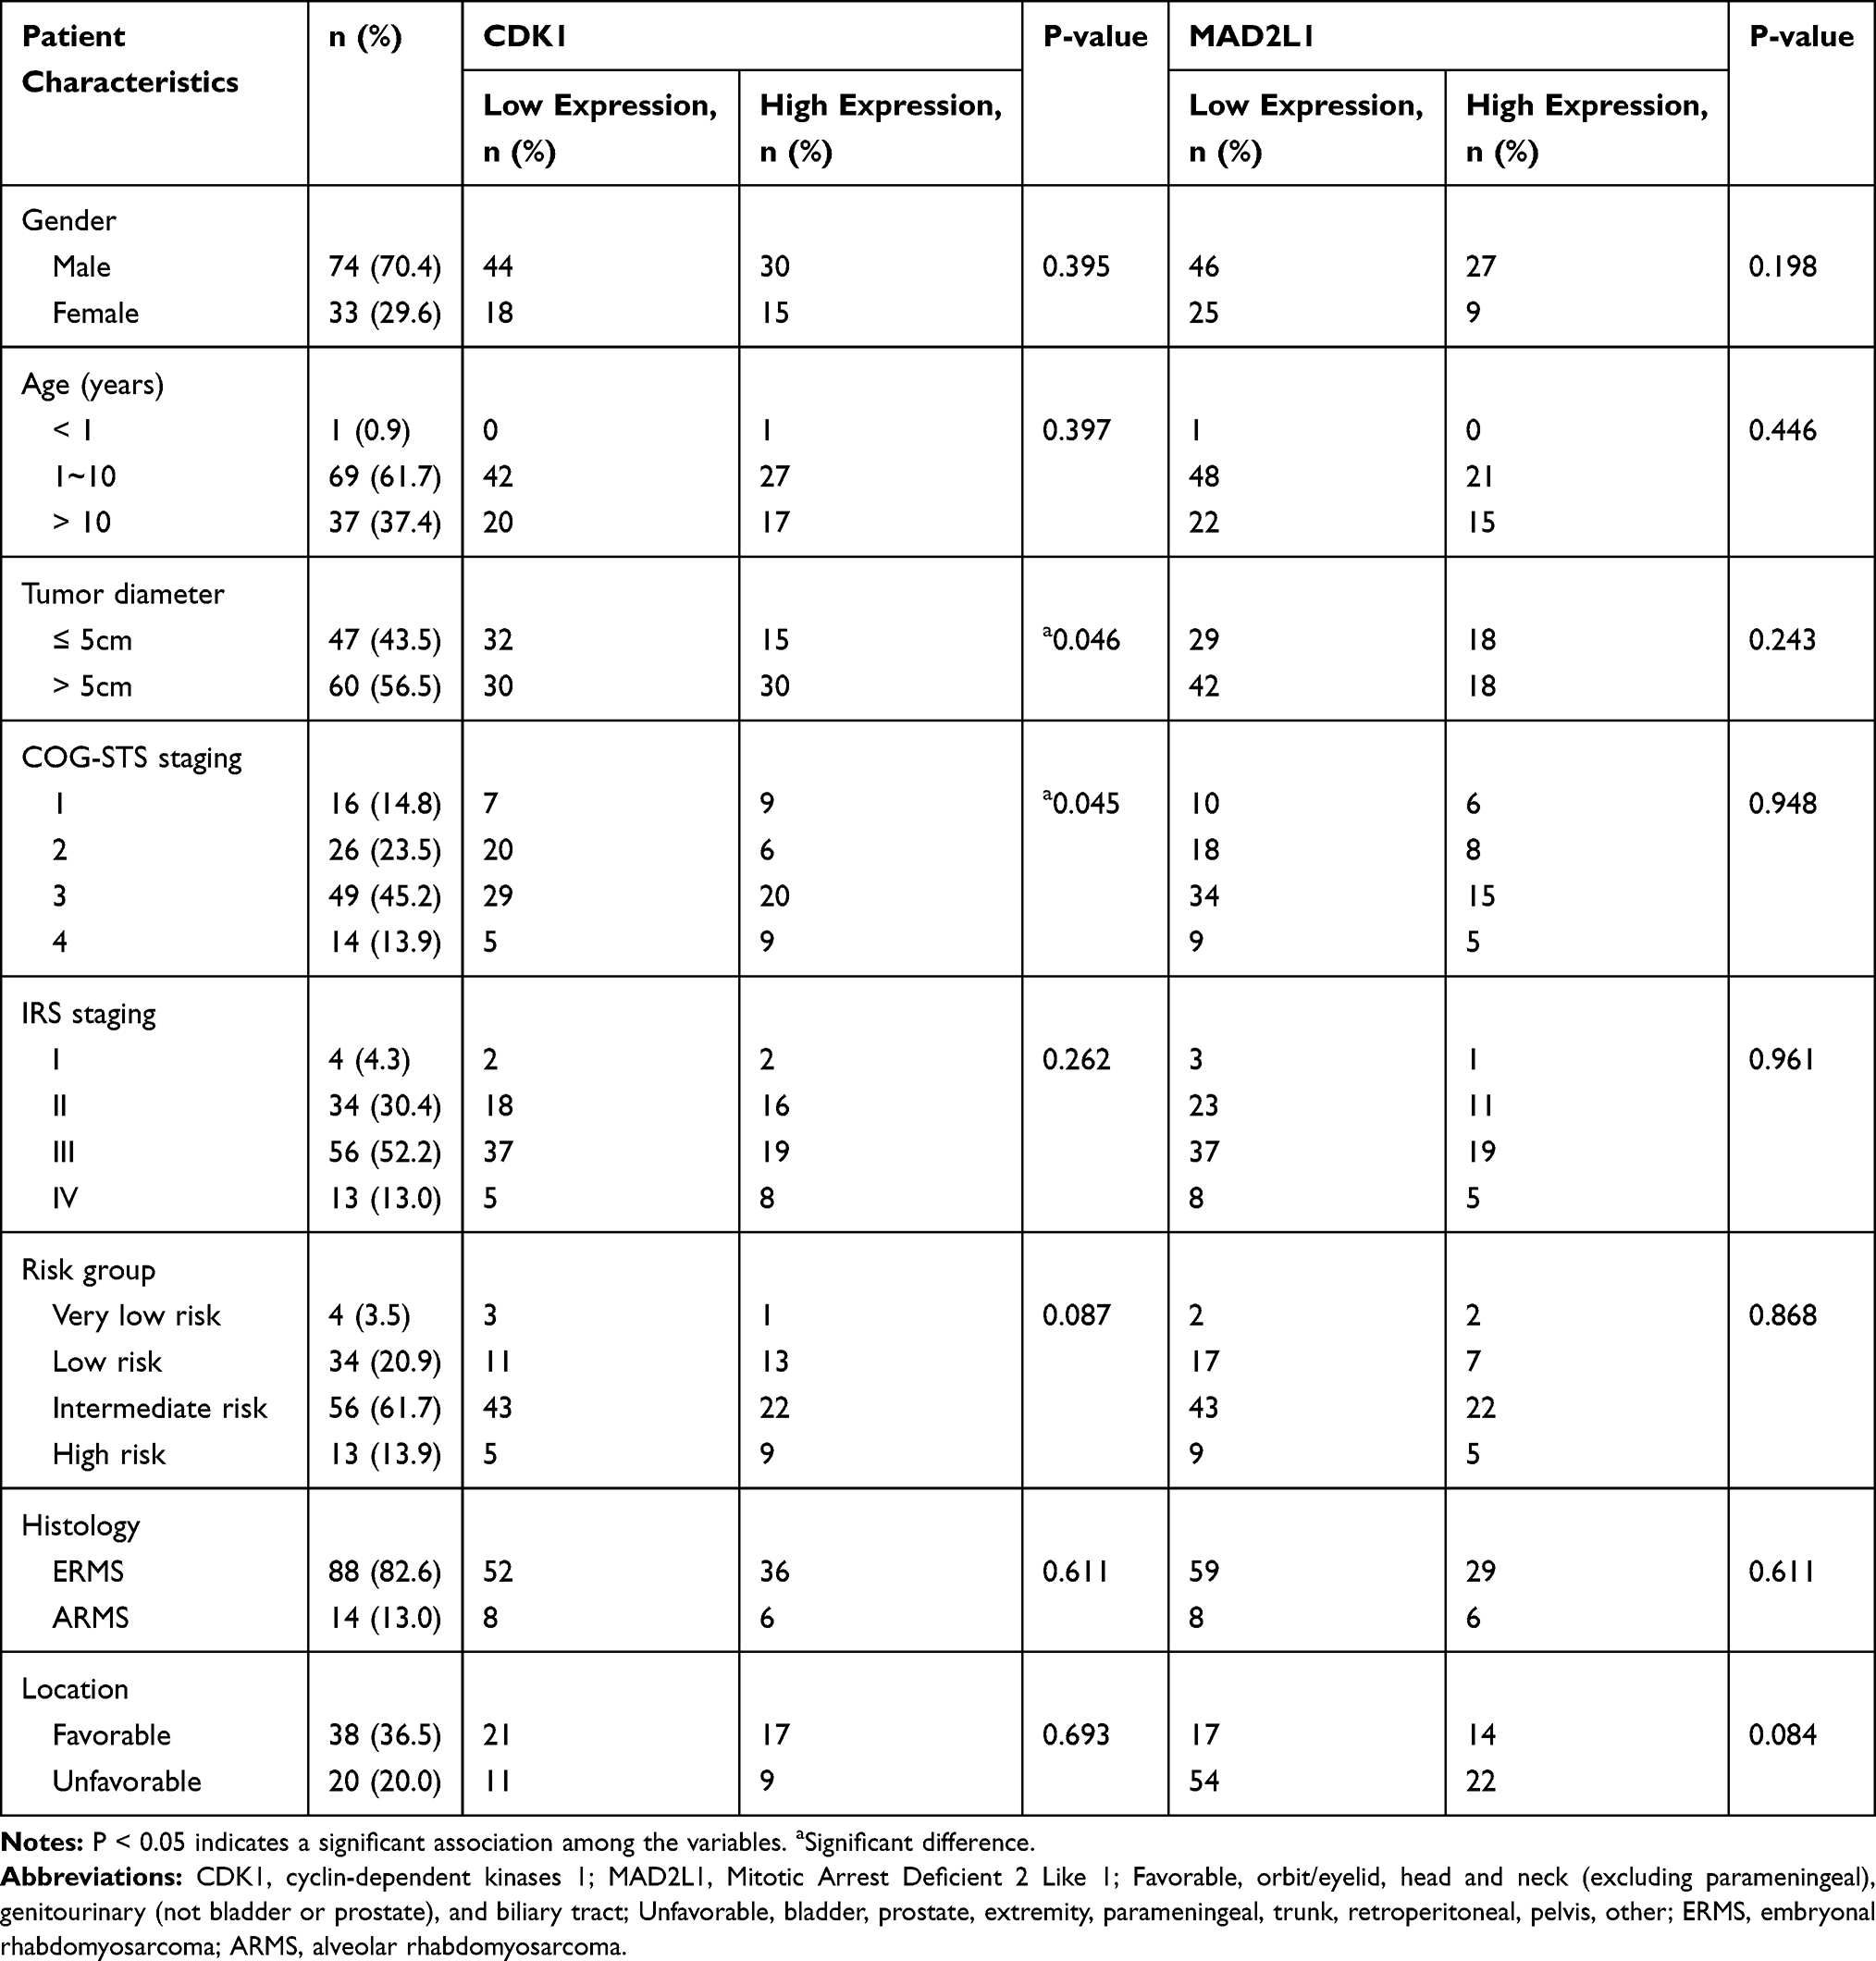 |
Table 1 Association Between CDK1 and MAD2L1 Protein Expression and Patient Clinical Characteristics |
CDK1 and MAD2L1 Were Highly Expressed in RMS Patients and Was Associated with OS and EFS
We performed immunohistochemistry (IHC) to test two up-regulated hub genes CDK1 (Figure 1A–E) and MAD2L1 (Figure 1F–J) protein expression in RMS tissues. Association between CDK1 and MAD2L1 protein expression and patient clinical characteristics were summarized in Table 1. Both CDK1 and MAD2L1 mainly showed staining in the nucleus. The results revealed a high CDK1 expression rate of 42.1% and a high MAD2L1 expression rate of 33.6% in 107 RMS cases. According to the Chi-square test, a significant difference in CDK1 expression was observed between patients with tumor size ≤ 5cm and patients with tumor > 5cm (P = 0.046, Table 1). The patients with tumor diameter > 5cm had more susceptible to high CDK1 expression. Besides, CDK1 expression was associated with COG-STS staging of RMS (P = 0.045, Table 1). There were no statistically significant differences between MAD2L1 expression and clinical characteristics. It was found that the 5-year OS rate of patients with RMS was 83.0% vs 63.5% (P = 0.004, Figure 8A) in the low CDK1 expression group and high CDK1 expression group, respectively, and the 5-year EFS rate of patients with RMS was 47.5% vs 27.5% (P = 0.049, Figure 8B) in the CDK1 low expression group and high expression group, respectively. The results showed a high MAD2L1 expression rate of 33.6% in 107 RMS cases. There was no significant difference between the expression of MAD2L1 and patient characteristics. The 5-year overall survival rate of RMS patients was 80.0% vs 43.2% (P = 0.001, Figure 8C), and the 5-year EFS rate of patients with RMS was 45.1% vs 21.8% (P = 0.038, Figure 8D) in low MAD2L1 expression group and high MAD2L1 expression group, respectively.
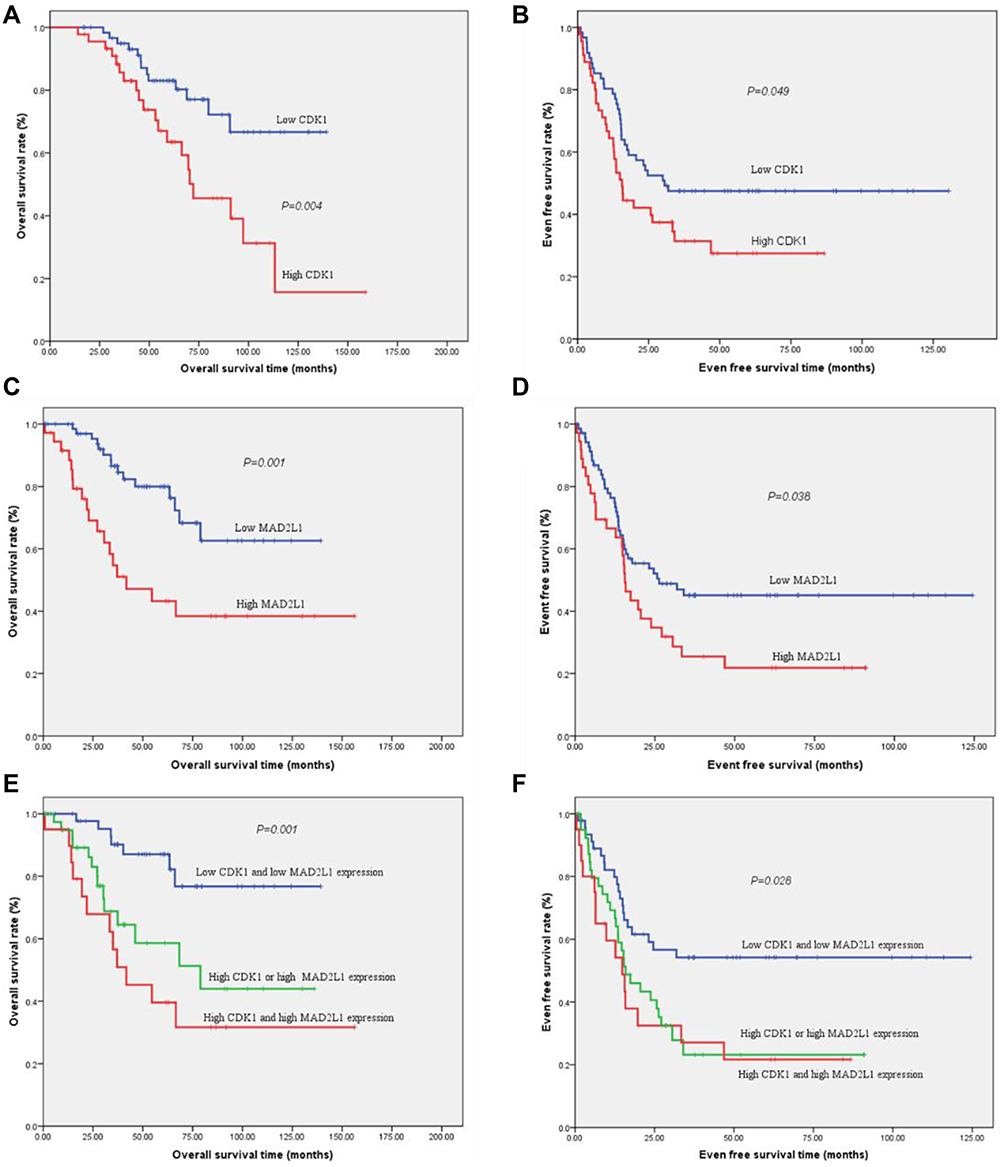 |
Figure 8 The expression of CDK1 and MAD2L1 was significantly associated with OS and EFS prognosis. (A) The 5-year OS rates of patients with low CDK1 expression and high CDK1 expression were 83.0% VS 63.5% (P = 0.004) respectively. (B) The 5-year EFS survival rates of patients with low CDK1 expression and high CDK1 expression were 47.5% VS 27.5% (P = 0.049) respectively. (C) The 5-year OS rates of patients with low MAD2L1 expression and high MAD2L1 expression were 80.0% VS. 43.2% (P = 0.001) respectively. (D) The 5-year EFS survival rates of patients with low MAD2L1 expression and high MAD2L1 expression were 45.1% VS. 21.8% (P = 0.038) respectively. When patients were divided into three groups: low CDK1 and low MAD2L1 expression group, high CDK1 or high MAD2L1 expression group, high CDK1 and high MAD2L1 expression group, the 5-year OS rates were 87.1%, 58.6%, and 39.6% (P = 0.001, Figure (E)), while the 5-year EFS rates of RMS patients were 54.2%, 23.2% and 21.7% (P = 0.028, Figure (F)) respectively. |
Co-Expression of CDK1 and MAD2L1
With condition cor > 0.5 and P < 0.05, CDK1 and MAD2L1 were co-expressed in tumor chip (Figure S2). CDK1 and MAD2L1 are linearly correlated. When patients were divided into three groups: low CDK1 and low MAD2L1 expression group, high CDK1 or high MAD2L1 expression group, high CDK1 and high MAD2L1 expression group, the 5-year OS rate were 87.1%, 58.6%, and 39.6% (P = 0.001, Figure 8E), while the 5-year EFS rate of RMS patients was 54.2%, 23.2% and 21.7% (P = 0.028, Figure 8F) respectively.
Discussion
RMS represents a high-grade neoplasm of skeletal myoblast-like cells. Although advancements in molecular biology and genetics have enabled a more sophisticated understanding of RMS pathogenesis, the next step towards precision medicine entails the development of robust, objective, and accessible biomarkers that are highly predictive of response to targeted therapy. Genomics approaches are being complemented by functional approaches to study RMS mechanisms in various models. In this work, we identified a total of 498 up- and 480 down-regulated DEGs. The PPI network of DEGs was constructed by using the STRING online database and Cytoscape.
In this study, 498 up-regulated genes were mainly involved in the cell cycle pathway and P53 singling pathway. All the TOP10 hub genes were up-regulated genes. GO analysis of the TOP10 genes mainly enriched in cyclin-dependent protein serine/threonine kinase regulatory activity and the KEGG of TOP10 genes were mainly involved in the cell cycle pathway. Furthermore, the KEGG of the core module-enrichment is also mainly involved in the cell cycle pathway and P53 singling pathway. Similar findings were obtained by the previous study, in which hub genes were involved in changes in the cell cycle and P53 signaling pathways in RMS.23 Another study demonstrated that all p53 family members were involved in regulating the process of muscle differentiation.29 Masafumi Seki et al studied 60 RMSs by whole-exome/-transcriptome sequencing, copy number, and DNA methylome analyses to discover the genetic/epigenetic basis of RMS, they found that cell cycle and p53 signaling are frequently altered.30 ERMS also associates with familial syndromes caused by mutations in prominent oncogenesis-related signaling pathways such as p53.31 All these results demonstrated that the cell cycle and P53 singling pathway play an important role in the development of RMS.
TOP2A, CCNB1, UBE2C, KIF11, NCAPG, CDC20, CDK1, MAD2L1, CCNA2, and CCNB2 were selected as top 10 hub genes. All these top 10 hub genes were up-regulated. qRT-PCR also confirmed that the mRNA expression of TOP10 genes was significantly higher than the NC. Then we demonstrated that the expressions of CCNA2, CDK1, CCNB2, MAD2L1, KIF11, and NCAPG were higher in sarcoma tissue than the normal tissue. And the Kaplan-Meier analysis found that high expression of CCNA2, CDK1, CCNB2, MAD2L1, KIF11, and NCAPG in sarcoma were significantly associated with poor OS. These six hub genes may be important prognosis factors of sarcoma. Cyclin-dependent kinases (CDKs) are the most important regulatory enzymes that drive all cell cycle transitions. Their activity is under strict control to ensure successful cell division. Cancer represents a pathological manifestation of uncontrolled cell division; so it has long been anticipated that CDKs inhibitors would be key effective therapeutic targets. Among the six hub genes, CCNA2, CDK1, CCNB2, and MAD2L1 are primarily involved in the cell cycle. In particular, CDK1 emerged as a critical determinant of mitotic progression, and CDK2 was revealed as being more relevant for DNA replication in higher eukaryotes.32 The studies show that promoter methylation, allelic loss, and mutation of the tumor suppressor CDKN2A are frequent. The finding of loss of CDKN2A or p53 pathway disruption in RMS is concordant with RMS PAX3–FOXO1 transgenic mouse models model systems.30,33–35 Studies also found increased cyclin B2 and cyclin B1 levels are associated with cancer aggressiveness and poor clinical outcome.
Among the six hub genes, CDK1, MAD2L1, and KIF11 have corresponding inhibitors Dinaciclib, M2I-1, and Monastrol. Dinaciclib, a small-molecule, cyclin-dependent kinase inhibitor of CDK1, CDK2, CDK5, and CDK9. M2I-1 is an inhibitor of MAD2L1 and MAD2L2. The anti-tumor effect of Dinaciclib and M2I-1 in RMS were few reported. Monastrol is a small cell-permeable heterocyclic molecule that is recognized as an inhibitor of mitotic kinesin KIF11. As the results of this study identified that 498 up-regulated genes were mainly involved in the cell cycle pathway and P53 singling pathway. GO analysis of the TOP10 genes mainly enriched in cyclin-dependent protein serine/threonine kinase regulatory activity and the KEGG of TOP10 genes were mainly involved in the cell cycle pathway. Based on the above reasons, we chose CDK1 and MAD2L1 to further validate in tissue by immunohistochemistry (IHC). We found that patients with tumor diameter > 5cm had more susceptible to high CDK1 expression. Besides, CDK1 expression was associated with COG-STS staging of RMS. Interestingly, CDK1 was significantly associated with poor OS and EFS in RMS. Although no significant association between CDK1 and clinical features was witnessed, Qianru Li also reported that CDK1 was the hub genes of RMS and was highly expressed in RMS patients.23 Dinaciclib, which is a novel drug that potently and selectively inhibits CDK1, CDK2, CDK5, and CDK9,36,37 showed an interesting tumor growth inhibitory activity in vivo, suggesting it may have potential applicability against selected subtypes of childhood cancer, including RMS.38 It will be important to further elucidate the mechanisms of CDK1 and to explore the potential utility of Dinaciclib.
The MAD2 protein is a centrally important regulator of the mitotic checkpoint machinery. Studies demonstrated that MAD2 overexpression is a critical mediator of the chromosome instability (CIN) observed upon inactivation of two major tumor suppressor pathways including Rb and P53 pathway.39 One study suggested that the aberrant MAD2 expression was potentially associated with abnormal mitosis in soft-tissue sarcomas, and with high-grade tumor progression in its translocation-associated subset.40 Although there were no statistically significant differences between MAD2L1 expression and clinical characteristics, MAD2L1 was associated with poor OS and EFS. It fits well with the previously defined role in the development and/or progression of osteosarcoma.41 MAD2L was also selected as hub genes by Cytoscape analyses by Qianru Li.23 This study provides novel insights into the role of MAD2L1 in RMS. Dedicated studies are warranted to further dissect the mechanism of MAD2L1 in the regulation of RMS.
CDK1 and MAD2L1 are linearly co-expressed. When patients were divided into three groups: low CDK1 and low MAD2L1 expression group, high CDK1 or high MAD2L1 expression group, high CDK1 and high MAD2L1 expression group, the 5-year OS rate and the 5-year EFS rate were significant difference. Both CDK1 and MAD2L1 are involved in the cell cycle of RMS. Since the relationship between CDK1 and MAD2L1 is complex, Additional studies will be needed however to determine the exact mechanisms responsible for the associations between CDK1 and MAD2L1.
Several limitations to the present study should be considered. Firstly, only expressions of CDK1 and MAD2L1 with clinical data were analyzed to predict OS and EFS in this study. Secondly, Future research is required to explore the mechanism between CDK1, MAD2L1, and carcinogenesis of RMS.
Conclusion
The hub genes of RMS are mainly involved in cell cycle and P53 singling pathway. And we have presented evidence implicating that CDK1 and MAD2L1 could be potential Prognostic biomarkers of RMS.
Acknowledgments
We acknowledge the contributions of the GEO database and the TCGA Research Network. Besides, the authors want to express gratitude to all participants.
Disclosure
The authors report no conflicts of interest in this work.
References
1. Sultan I, Qaddoumi I, Yaser S, Rodriguez-Galindo C, Ferrari A. Comparing adult and pediatric rhabdomyosarcoma in the surveillance, epidemiology, and end results program, 1973 to 2005: an analysis of 2600 patients. J Clin Oncol. 2009;27(20):3391–3397. doi:10.1200/JCO.2008.19.7483
2. Lisboa S, Cerveira N, Vieira J, et al. Genetic diagnosis of alveolar rhabdomyosarcoma in the bone marrow of a patient without evidence of primary tumor. Pediatr Blood Cancer. 2008;51(4):554–557. doi:10.1002/pbc.21646
3. Shinkoda Y, Nagatoshi Y, Fukano R, Nishiyama K, Okamura J. Rhabdomyosarcoma masquerading as acute leukemia. Pediatr Blood Cancer. 2009;52(2):286–287. doi:10.1002/pbc.21783
4. Crist WM, Anderson JR, Meza JL, et al. Intergroup rhabdomyosarcoma study-IV: results for patients with nonmetastatic disease. J Clin Oncol. 2001;19(12):3091–3102. doi:10.1200/JCO.2001.19.12.3091
5. Arndt CA, Stoner JA, Hawkins DS, et al. Vincristine, actinomycin, and cyclophosphamide compared with vincristine, actinomycin, and cyclophosphamide alternating with vincristine, topotecan, and cyclophosphamide for intermediate-risk rhabdomyosarcoma: children’s oncology group study D9803. J Clin Oncol. 2009;27(31):5182–5188. doi:10.1200/JCO.2009.22.3768
6. Stevens MC, Rey A, Bouvet N, et al. Treatment of nonmetastatic rhabdomyosarcoma in childhood and adolescence: third study of the International Society of Paediatric Oncology–SIOP Malignant Mesenchymal Tumor 89. J Clin Oncol. 2005;23(12):2618–2628.
7. Ferrari A, Casanova M, Collini P, et al. Adult-type soft tissue sarcomas in pediatric-age patients: experience at the Istituto Nazionale Tumori in Milan. J Clin Oncol. 2005;23(18):4021–4030. doi:10.1200/JCO.2005.02.053
8. Blakely ML, Andrassy RJ, Raney RB, et al. Prognostic factors and surgical treatment guidelines for children with rhabdomyosarcoma of the perineum or anus: a report of Intergroup Rhabdomyosarcoma Studies I through IV, 1972 through 1997. J Pediatr Surg. 2003;38(3):347–353. doi:10.1053/jpsu.2003.50106
9. Oberlin O, Rey A, Sanchez DTJ, et al. Randomized comparison of intensified six-drug versus standard three-drug chemotherapy for high-risk nonmetastatic rhabdomyosarcoma and other chemotherapy-sensitive childhood soft tissue sarcomas: long-term results from the International Society of Pediatric Oncology MMT95 study. J Clin Oncol. 2012;30(20):2457–2465.
10. Chaturvedi S, McCrae KR. Diagnosis and management of the antiphospholipid syndrome. Blood Rev. 2017;31(6):406–417.
11. Rosenberg AR, Skapek SX, Hawkins DS. The inconvenience of convenience cohorts: rhabdomyosarcoma and the PAX-FOXO1 biomarker. Cancer Epidemiol Biomarkers Prev. 2012;21(7):1012–1018. doi:10.1158/1055-9965.EPI-12-0207
12. Singh M, Leasure JM, Chronowski C, et al. FANCD2 is a potential therapeutic target and biomarker in alveolar rhabdomyosarcoma harboring the PAX3-FOXO1 fusion gene. Clin Cancer Res. 2014;20(14):3884–3895. doi:10.1158/1078-0432.CCR-13-0556
13. Pappo AS, Dirksen U. Rhabdomyosarcoma, ewing sarcoma, and other round cell sarcomas. J Clin Oncol. 2018;36(2):168–179. doi:10.1200/JCO.2017.74.7402
14. Stewart E, McEvoy J, Wang H, et al. Identification of therapeutic targets in rhabdomyosarcoma through integrated genomic, epigenomic, and proteomic analyses. Cancer Cell. 2018;34(3):411–426. doi:10.1016/j.ccell.2018.07.012
15. Barrett T, Edgar R. Mining microarray data at NCBI’s Gene Expression Omnibus (GEO)*. Methods Mol Biol. 2006;338:175–190.
16. Clough E, Barrett T. The gene expression omnibus database. Methods Mol Biol. 2016;1418:93–110.
17. Lee JS. Exploring cancer genomic data from the cancer genome atlas project. BMB Rep. 2016;49(11):607–611. doi:10.5483/BMBRep.2016.49.11.145
18. Lin XF, Zhang CQ, Dong BR. MiR-421 expression independently predicts unfavorable overall survival in patients with esophageal adenocarcinoma. Eur Rev Med Pharmacol Sci. 2019;23(9):3790–3798.
19. Jiao Y, Fu Z, Li Y, Meng L, Liu Y. High EIF2B5 mRNA expression and its prognostic significance in liver cancer: a study based on the TCGA and GEO database. Cancer Manag Res. 2018;10:6003–6014. doi:10.2147/CMAR.S185459
20. Leemans CR, Snijders P, Brakenhoff RH. The molecular landscape of head and neck cancer. Nat Rev Cancer. 2018;18(5):269–282.
21. Kandoth C, McLellan MD, Vandin F, et al. Mutational landscape and significance across 12 major cancer types. Nature. 2013;502(7471):333–339. doi:10.1038/nature12634
22. Zhang B, Wang J, Wang X, et al. Proteogenomic characterization of human colon and rectal cancer. Nature. 2014;513(7518):382–387. doi:10.1038/nature13438
23. Li Q, Zhang L, Jiang J, et al. CDK1 and CCNB1 as potential diagnostic markers of rhabdomyosarcoma: validation following bioinformatics analysis. BMC Med Genomics. 2019;12(1):198. doi:10.1186/s12920-019-0645-x
24. von Mering C, Huynen M, Jaeggi D, Schmidt S, Bork P, Snel B. STRING: a database of predicted functional associations between proteins. Nucleic Acids Res. 2003;31(1):258–261. doi:10.1093/nar/gkg034
25. O’Driscoll P, Merenyi E, Karmonik C, Grossman R. SOM and MCODE methods of defining functional clusters in MRI of the brain. Conf Proc IEEE Eng Med Biol Soc. 2014;2014:734–737.
26. Shannon P, Markiel A, Ozier O, et al. Cytoscape: a software environment for integrated models of biomolecular interaction networks. Genome Res. 2003;13(11):2498–2504. doi:10.1101/gr.1239303
27. Chisholm KM, Krishnan C, Heerema-McKenney A, Natkunam Y. Immunohistochemical profile of MYC protein in pediatric small round blue cell tumors. Pediatr Dev Pathol. 2017;20(3):213–223. doi:10.1177/1093526616689642
28. Wachtel M, Runge T, Leuschner I, et al. Subtype and prognostic classification of rhabdomyosarcoma by immunohistochemistry. J Clin Oncol. 2006;24(5):816–822. doi:10.1200/JCO.2005.03.4934
29. Cam H, Griesmann H, Beitzinger M, et al. p53 family members in myogenic differentiation and rhabdomyosarcoma development. Cancer Cell. 2006;10(4):281–293. doi:10.1016/j.ccr.2006.08.024
30. Seki M, Nishimura R, Yoshida K, et al. Integrated genetic and epigenetic analysis defines novel molecular subgroups in rhabdomyosarcoma. Nat Commun. 2015;6:7557. doi:10.1038/ncomms8557
31. Estep AL, Tidyman WE, Teitell MA, Cotter PD, Rauen KA. HRAS mutations in Costello syndrome: detection of constitutional activating mutations in codon 12 and 13 and loss of wild-type allele in malignancy. Am J Med Genet A. 2006;140A(1):8–16. doi:10.1002/ajmg.a.31078
32. Asghar U, Witkiewicz AK, Turner NC, Knudsen ES. The history and future of targeting cyclin-dependent kinases in cancer therapy. Nat Rev Drug Discov. 2015;14(2):130–146.
33. Keller C, Arenkiel BR, Coffin CM, El-Bardeesy N, DePinho RA, Capecchi MR. Alveolar rhabdomyosarcomas in conditional Pax3: fkhrmice: cooperativity of Ink4a/ARF and Trp53 loss of function. Genes Dev. 2004;18(21):2614–2626. doi:10.1101/gad.1244004
34. Naini S, Etheridge KT, Adam SJ, et al. Defining the cooperative genetic changes that temporally drive alveolar rhabdomyosarcoma. Cancer Res. 2008;68(23):9583–9588. doi:10.1158/0008-5472.CAN-07-6178
35. Hayes MN, Langenau DM. Discovering novel oncogenic pathways and new therapies using zebrafish models of sarcoma. Methods Cell Biol. 2017;138:525–561.
36. Parry D, Guzi T, Shanahan F, et al. Dinaciclib (SCH 727965), a novel and potent cyclin-dependent kinase inhibitor. Mol Cancer Ther. 2010;9(8):2344–2353. doi:10.1158/1535-7163.MCT-10-0324
37. Guzi TJ, Paruch K, Dwyer MP, et al. Targeting the replication checkpoint using SCH 900776, a potent and functionally selective CHK1 inhibitor identified via high content screening. Mol Cancer Ther. 2011;10(4):591–602. doi:10.1158/1535-7163.MCT-10-0928
38. Gorlick R, Kolb EA, Houghton PJ, et al. Initial testing (stage 1) of the cyclin dependent kinase inhibitor SCH 727965 (dinaciclib) by the pediatric preclinical testing program. Pediatr Blood Cancer. 2012;59(7):1266–1274. doi:10.1002/pbc.24073
39. Schvartzman JM, Duijf PH, Sotillo R, Coker C, Benezra R. Mad2 is a critical mediator of the chromosome instability observed upon Rb and p53 pathway inhibition. Cancer Cell. 2011;19(6):701–714.
40. Hisaoka M, Matsuyama A, Hashimoto H. Aberrant MAD2 expression in soft-tissue sarcoma. Pathol Int. 2008;58(6):329–333. doi:10.1111/j.1440-1827.2008.02232.x
41. Shen H, Wang W, Ni B, Zou Q, Lu H, Wang Z. Exploring the molecular mechanisms of osteosarcoma by the integrated analysis of mRNAs and miRNA microarrays. Int J Mol Med. 2018;42(1):21–30.
 © 2020 The Author(s). This work is published and licensed by Dove Medical Press Limited. The
full terms of this license are available at https://www.dovepress.com/terms
and incorporate the Creative Commons Attribution
- Non Commercial (unported, 3.0) License.
By accessing the work you hereby accept the Terms. Non-commercial uses of the work are permitted
without any further permission from Dove Medical Press Limited, provided the work is properly
attributed. For permission for commercial use of this work, please see paragraphs 4.2 and 5 of our Terms.
© 2020 The Author(s). This work is published and licensed by Dove Medical Press Limited. The
full terms of this license are available at https://www.dovepress.com/terms
and incorporate the Creative Commons Attribution
- Non Commercial (unported, 3.0) License.
By accessing the work you hereby accept the Terms. Non-commercial uses of the work are permitted
without any further permission from Dove Medical Press Limited, provided the work is properly
attributed. For permission for commercial use of this work, please see paragraphs 4.2 and 5 of our Terms.