Back to Journals » Infection and Drug Resistance » Volume 12
Biochemical but not compositional recovery of skin mucosal microbiome communities after disruption
Authors Brumlow CE, Luna RA, Hollister EB, Gomez JA, Burcham LA, Cowdrey MB ![]() , Primm TP
, Primm TP
Received 31 August 2018
Accepted for publication 15 December 2018
Published 13 February 2019 Volume 2019:12 Pages 399—416
DOI https://doi.org/10.2147/IDR.S185992
Checked for plagiarism Yes
Review by Single anonymous peer review
Peer reviewer comments 2
Editor who approved publication: Dr Joachim Wink
Chelcy E Brumlow,1 Ruth A Luna,2,3 Emily B Hollister,2,3 Javier A Gomez,1 Lindsey A Burcham,1 Madison B Cowdrey,1 Todd P Primm1
1Department of Biological Sciences, Sam Houston State University, Huntsville, TX, USA; 2Department of Pathology, Texas Children’s Microbiome Center, Texas Children’s Hospital, Houston, TX, USA; 3Department of Pathology and Immunology, Baylor College of Medicine, Houston, TX, USA
Background: The microbiomes of animals are complex communities that strongly affect the health of the hosts. Microbiomes on mucosal surfaces have the highest densities and most extensive biochemical exchanges with the hosts. Although antibiotics are potent tools to manage infections, they can disrupt the normal microbiota, causing numerous side effects.
Materials and methods: Taking a community ecology approach, mucosal microbiome community responses to five disruptive conditions (two broad-spectrum antibiotics, a biocide, elevated temperature, and rinsing) were analyzed. Skin of the fish Gambusia affinis was the mucosal model. Microbiome recovery was measured by culturable counts, community biochemical profiles, genetic fingerprinting, and community 16S gene sequencing (rinsing condition only).
Results: Following all disruptions, the total counts rose and then returned to the pre-treatment (PT) level. This overgrowth was confirmed via direct staining and community metabolic activity measurements. After rinsing, diversity decreased and one taxon dominated (family Aeromonadaceae) temporarily, the findings similar to numerous other studies with antibiotics. While the community did not return to the PT taxonomic composition, the biochemical profile did.
Conclusion: This suggests that the biochemical pathways in a community are important during recovery, and a return to the original composition is not required to restore original function.
Keywords: Gambusia affinis, rifampicin, tetracycline, chlorhexidine
Introduction
Disruption of the microbiome, mainly focused on the gut, has been analyzed in humans1–3 and multiple model organisms, including mice,4,5 zebrafish,6 and mosquitofish.7,8 During recovery of the microbiome communities following antibiotic treatments, numerous changes have been noticed, including lowering of community diversity and loss of rare species. In humans, these changes may lead to negative effects such as post-antibiotic enterocolitis or expansion of Clostridium difficile. To better understand if observations during recovery of these microbiome systems directly result from the antibiotics or are more general and intrinsic features of a microbiome community recovering after a disruption, we took a community ecology approach and performed a comparison of multiple disruptions. Looking at microbiome recovery following disruptions with different mechanisms can reveal common features, which would likely be intrinsic to and derived from the microbial community itself.
A model organism was chosen that is hardy (to allow experimental manipulations), has a mucosal surface that is easy to sample, and is small to allow sufficient numbers inexpensively. The fish Gambusia affinis (Western mosquitofish) is resilient as an invasive species. For example, while preferring 31°C in the wild,9 mosquitofish can live at a range of 5°C to 38°C,10 a broad range for a poikilotherm. In addition to having a vertebrate acquired immune system like all fish, mosquitofish are a member of the Poeciliid fish, having internal fertilization and giving live birth, thus sharing this physiology with humans (most fish lay eggs and have external fertilization).
This study examined the recovery of the fish skin mucosal microbiome following four different disruptive conditions: antibiotics, a biocide, elevated temperature, and rinsing. Recovery was monitored through culturable counts, community biochemical activities, and genetic fingerprinting. For the rinsing disruption, the community composition was also examined using 16S community gene sequencing. The two antibiotics used were both broad spectrum, rifampicin (RIF) and tetracycline (TET). RIF blocks transcription through the RNA polymerase, whereas TET blocks translation through the ribosome. These antibiotics were chosen because of previous data in this experimental system with RIF,7,8 they were expected to be strong disruptions to the microbiome, and they are well tolerated by the fish. Antibiotics provide continuous selective pressure, presumably directional selection, over time (3 days in this case). The biocide chosen was chlorhexidine (CHX), which is not only commonly used as a disinfectant in medical settings but is also one of the most common antiseptics on skin. This would provide a presumably even more broad-spectrum selection, for a 30-minute exposure, with some potential for residual effects. The elevated temperature (10°C increase for 3 days) is a physical, environmental comparison to the chemical methods of antibiotics or the biocide. Finally, the rinse is a rapid, acute disruption with presumably no ongoing selection during recovery. The strongly disruptive depletion of the microbiota provided by the rinse is a good experimental contrast to the other methods, allowing observation of the secondary recovery of the microbiome without residual effects. Comparing all these disruptions is intended to provide a background control comparison for interpreting the many other published studies of the effects of antibiotics on the microbiome.
Materials and methods
Fish collection and handling
Fish were collected from Woodland Hills Lake (Walker County, TX, USA) using dip nets. Fish were maintained in 37 L aquaria, with a 12-hour light/12-hour dark cycle in groups of 40–60 and given a minimum of 1 week for their microbial flora to stabilize. Fish were fed daily store-purchased fish flakes. The room temperature varied from 21°C to 24°C. All experiments were performed with Sam Houston State University IACUC approval (ID # 14-10-17-1018-3-01), following the Guidelines for the Use of Fishes in Research (American Fisheries Society, 2004) and the Guide for the Care and Use of Laboratory Animals (8th ed., National Research Council, 2011).
Experimental design
The design for the disruption experiments is shown in Figure 1.
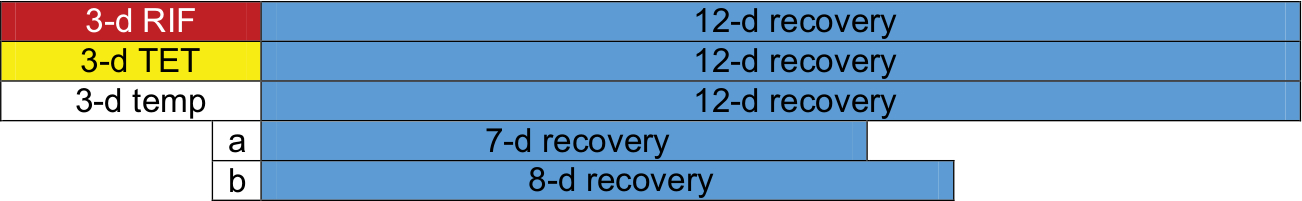 | Figure 1 Treatment protocols for the five disruptions. Notes: a: 30-minute exposure to chlorhexidine. b: 3-minute rinsing procedure. Abbreviations: d, day; RIF, rifampicin; temp, temperature; TET, tetracycline. |
RIF antibiotic treatment
Powdered RIF (MilliporeSigma, Burlington, MA, USA) was dissolved in dimethyl sulfoxide (DMSO; MilliporeSigma) to create a 50 mg/mL stock solution. For this experiment, 2 L of artificial pond water (APW; 0.1 g/L CaCl2, 0.1 g/L MgSO4, and 0.04 g/L CH3COONa) was added to a container with an air stone and then 1 mL of RIF stock solution was added; treatment RIF concentration was 25 µg/mL. After 10 minutes for RIF to evenly distribute, 33 fish were added and the treatment phase began. Eleven control fish were exposed to an equivalent concentration of DMSO. Pre-treatment (PT) fish were taken from the source aquarium. Samples for the skin microflora were taken after 3 days of treatment, and remaining fish were transferred via net to a container with 2 L of sterile APW, beginning the recovery phase. During recovery, samples from the skin microflora were taken at 10 hours and 1, 3, 5, 7, and 12 days. Fish were fed 10 mg flakes per fish once daily, beginning on the second day of recovery.
TET antibiotic treatment
A TET stock solution was prepared at 50 mg/mL in DMSO. Two liters of APW were added to a container with an air stone and 0.5 mL of TET stock was added; treatment TET concentration was 12.5 µg/mL. After 10 minutes for TET distribution, 30 fish were added. Ten control fish were exposed to an equivalent concentration of DMSO. PT fish were taken from the source aquarium. Treatment samples were taken after 3 days, and remaining fish were transferred via net to a container with 2 L of sterile APW for recovery phase. During recovery, samples from the skin microflora were taken at 10 hours and 1, 3, 5, 7, and 9 days. Fish were fed 10 mg flakes per fish once daily, beginning on the second day of recovery.
Biocide treatment
A 50 mg/mL CHX stock solution was prepared in DMSO. Fish were treated individually in 12 oz Styrofoam cups. In each experimental cup, 52 µL of the CHX stock solution was added to 130 mL of sterile APW (20 µg/mL treatment concentration), and one fish was placed in each cup and treated for 30 minutes at room temperature. Fish were transferred via net to sterile 2 L APW for group recovery. Fish were fed flakes at 10 mg/fish, beginning on the second day of recovery.
Temperature treatment
Fish were placed in 3 L of 24°C APW in a container with a submerged thermometer. The container was placed in an incubator set to 35°C. The water temperature reached 34°C after 10 hours and was stable for the remaining 3-day treatment period, during which ~10% of the volume evaporated. For recovery, the container was moved back to 24°C. Fish were sampled at the end of treatment and after 1, 3, 4, 7, and 12 days of recovery. Only in this experiment colony-forming unit (CFU) plating on nutrient agar (NA) was performed in triplicate, with one set of plates incubated each at 25°C, 37°C, and 42°C.
Rinsing treatment
Rinsing was accomplished by four serial washes. Twenty-one fish from the same aquarium were individually placed into 5 mL of PBS with Tween 80 (PBST; 2 mM NaCl, 10 mM KCl, 137 mM PO43–, and 0.05% Tween 80, pH 7.4) in a sterile 15 mL conical tube, and vortexed for 20 seconds. After a 10-second rest, fish were transferred to a second PBST tube and vortexed again. After four rinses, fish were transferred to a group recovery container with 2 L of APW. Three fish were samples as PT from the same aquarium. Fish were sampled after 5 and 10 hours and daily for 8 days of recovery.
Skin microbiome sampling
To sample the skin microflora of G. affinis, fish were individually removed from the aquarium or experiment container using a net and placed into a 15 mL sterile conical tube containing 2 mL of PBST or for the biochemical tests, 0.85% saline. Fish weight was recorded, and the tube was then placed on a vortexer for four consecutive bursts of 15 seconds for a total vortex time of 1 minute. After vortexing, the resulting suspension was removed via a micropipettor and placed into a sterile microcentrifuge tube, Petri dish, or 15 mL conical tube depending on the tests to be run.
CFU plating
A 100 µL aliquot from the 2 mL fish microflora suspension was used to perform 1:10 serial dilutions using PBST. The serial dilutions were plated onto NA in duplicate and counted after 2 days at 25°C. NA was prepared by adding 2.5 g of peptone, 1.5 g of beef extract, and 7.5 g of agar to 500 mL of deionized water. To recover drug-resistant colonies, dilutions were plated onto NA with 50 µg/mL of RIF or 25 µg/mL of TET. Plate counts are reported as colony-forming units per gram (CFU/g) of fish weight, to standardize for variances in fish size.
Gram stain and metabolic dye assays
Five fish were rinsed as described earlier. A PT fish was sampled from the aquarium, whereas other fish were sampled during recovery in APW. For each sample, an individual fish was scraped, and this was directly applied to a glass slide. After air drying and fixation with methanol, the sample was Gram stained. To measure whole skin community metabolic rate, six fish were rinsed as earlier. Daily during recovery, the skin microbiome was sampled as earlier by suspending in PBST. One milliliter of this sample was placed in a cuvette with 215 µM of resazurin. Fluorescence emission intensity was measured at 583 nm (exciting at 520 nm) in 15-minute increments for 4 hours at 25°C. Since the first hour was a lag period, the rate was calculated over the next 3 hours as increase in fluorescent intensity per hour per gram of fish weight.
Skin mucus measurement
Fish skin mucus was quantified after extraction from fish by vortexing with PBST. Alcian blue binding was used to quantify acidic mucins via the method from the study by Ouwehand et al.11
Community biochemical profiling
Fish skin microbiome suspension in saline was added to an API-20E strip (bioMerieux, Marcy-l’Étoile, France) or GNA and GNB strips (Microgen Bioproducts, Camberley, UK) as per instructions and incubated 24 hours at 25°C. The test results were read by following manufacturer’s instructions.
DNA fingerprinting
Two PCR-based methods were used in generating community fingerprints to map community composition changes during the temperate and rinsing experiments. Ribosomal intergenic spacer analysis (RISA) amplifies sequences between the 16S and 23S genes, which vary in size and sequence between species.12 Enterobacterial repetitive intergenic consensus (ERIC) sequence analysis was first used to amplify short sequences that are scattered in species of enterobacteria.13 However, it has been adapted to also fingerprint microbial communities, regardless of enterobacterial content.14,15 For the RISA method, based on the study by Jones et al,12 400 µL of a skin microbiome suspension was transferred to a tube and centrifuged at 14,000 rpm for 5 minutes to pellet bacteria. Pellet was resuspended in 450 µL Tris–EDTA (TE), and 50 µL of 10% sodium dodecyl sulfate was added and incubated at 50°C for 30 minutes. After lysis, 500 µL of phenol/chloroform 1:1 was added, and the tube was vortexed. After 5 minutes to settle and centrifugation at 14,000 rpm for 5 minutes, aqueous phase was transferred to a new tube, and 1 mL of pure ethanol was added. Then, 50 µL of 3 M sodium acetate was added, and tubes were incubated at –20°C for 1 hour. Tubes were removed from the freezer and centrifuged at 14,000 rpm for 5 minutes. The supernatant was carefully removed using a micropipettor, and tubes were placed in a 45°C heat block, with the lid open to evaporate any residual ethanol. Pellets were resuspended in 100 µL of TE buffer and stored at –20°C until further use. One microliter of this template DNA was added to a PCR tube (Illustra PuReTaq Ready-to-Go Beads [GE Healthcare Life Sciences, Pittsburgh, PA, USA]) with 0.5 µL of 23Sr primer, 0.5 µL of 1406R primer, and 23 µL of sterile deionized water. Touchdown PCR was performed with the following steps: 95°C, 5 minutes and then 12 cycles of 95°C, 30 seconds; 66°C, 30 seconds (with a 1° drop per cycle until 54°C reached); 72°C, 1 minute; and then 32 cycles of 95°C, 30 seconds; 54°C, 30 seconds; and 72°C, 1 minute. For the ERIC method, based on the study by Chen et al,14 1 µL of the same template DNA as above was added to a Ready-to-Go PCR tube with 0.5 µL of ERIC-1R primer, 0.5 µL of ERIC-2 primer, and 23 µL of sterile deionized water. PCR was performed using 95°C, 5 minutes and then 30 cycles of 94°C, 1 minute; 52°C, 1 minute; 49°C, 1 minute; 72°C, 3 minutes, followed by 72°C for 10 minutes. For both RISA and ERIC, PCR products were electrophoresed on a 2.5% agarose gel and visualized by ethidium bromide staining. Gel bands were imaged and sized using ChemiDoc system (Bio-Rad Laboratories Inc., Hercules, CA, USA).
Community susceptibility
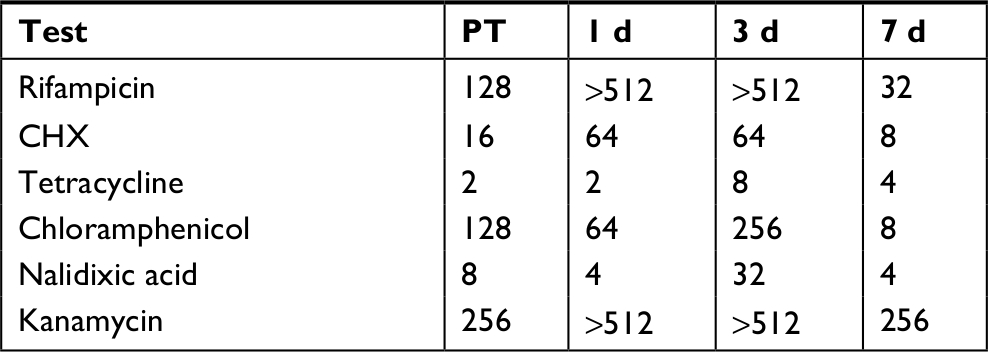
During the CHX treatment experiment, skin microbiome community susceptibility was determined using a microbroth method. From PBST suspensions of fish skin, 1.2 mL was added to 9.8 mL of nutrient broth (NB, same as NA except no agar). Into each well of a 96-well microplate, 120 µL of the suspension was added, antibiotic stock solutions added so that the first well contained 512 µg/mL, and then twofold serial dilutions down the plate (0.25 µg/mL in the last well). Positive control well had no drug and negative had media only. Growth was visually read after 48 hours at 25°C. For the rinsing experiment, community susceptibility was measured using a disk diffusion method. For each fish PBST suspension, 300 µL was added to a Muller Hinton agar plate and spread evenly. Six antibiotic disks were added to the plate, and zones of inhibition recorded after 24 hours. The 18 antibiotics used are listed in Table 1.
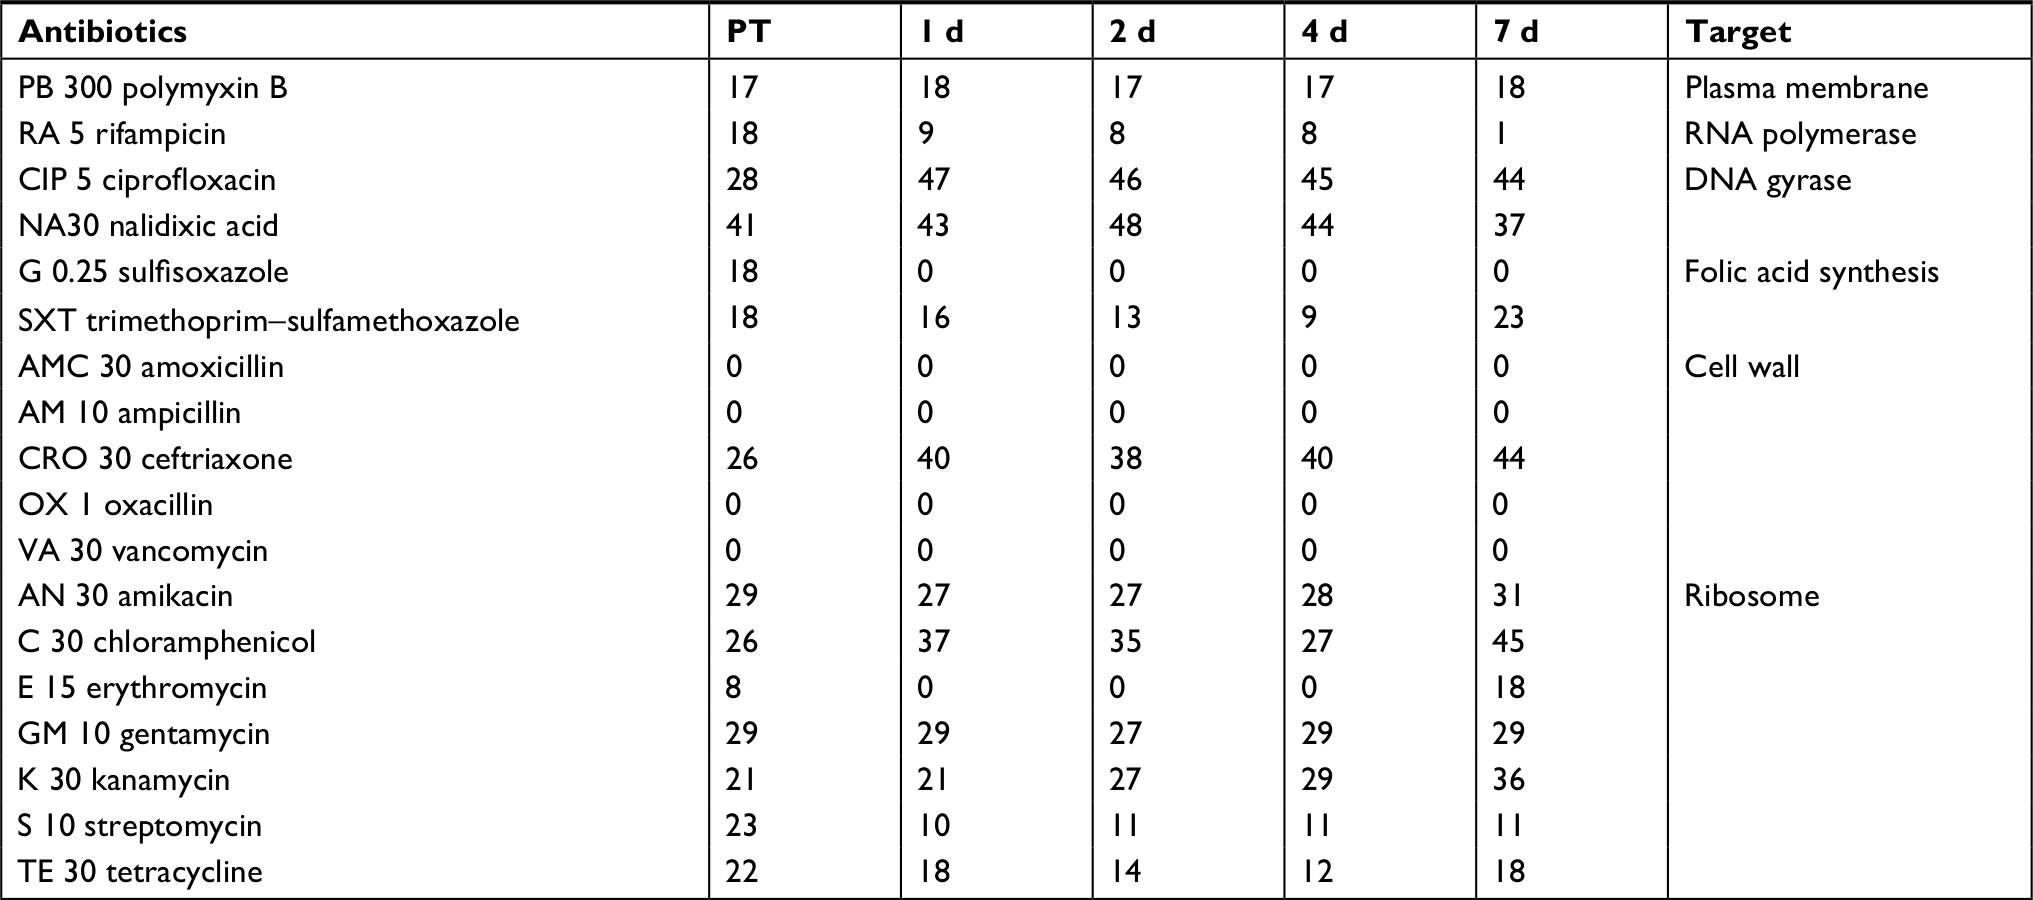 | Table 1 Community susceptibility after rinsing treatment Notes: Numbers are the size of the zones of inhibition in millimeter. Quantity of antibiotic in the paper disk in micrograms is notated in the name, for example, RA 5 disk contains 5 µg of rifampicin. Abbreviations: d, days; PT, pre-treatment. |
Community composition
One fish was sampled for each data point. Bacteria from all 2 mL of the fish skin PBST suspension were pelleted by centrifugation at 14,000 rpm for 5 minutes. After removing supernatant, pellet was stored at –80°C until use. After thawing, DNA was extracted from pellets following instructions of the DNeasy MoBio PowerSoil kit (Qiagen NV, Venlo, the Netherlands). 16S DNA gene sequence libraries were generated using V3–V5 primers and sequenced on the 454 Life Sciences platform (Roche, Basel, Schweiz, Switzerland) at the Texas Children’s Microbiome Center. The 16S rRNA gene libraries were parsed by barcode and quality filtered using the QIIME package (version 1.8.0).16 Sequences shorter than 200 bp, with average quality scores <20, containing ambiguous base calls, mismatches to barcode or primer sequence, or homopolymer runs longer than six were excluded from analysis. Sequences were clustered into operational taxonomic units (OTUs) using an open-reference approach with the ULCUST algorithm,17 the Greengenes reference database (version 13_8),18 and a 97% similarity threshold. There were 3,125 mean reads per sample. Taxonomic assignments were likewise assigned using UCLUST and Greengenes. Potentially chimeric OTUs were identified using the ChimeraSlayer algorithm19 and were excluded from downstream analysis.
Results and discussion
Culturable sensitive and resistant bacteria
Total plate counts at the end of the 3-day RIF treatment were 2.7-fold higher than PT (Figure 2A). Previous work showed a strong decline in total counts during the first day of treatment, followed by a recovery at 38 hours during exposure.7 In this study, total counts continue to rise during early recovery, peaking after the first day at 58-fold above the PT level, an interesting overgrowth effect. After that, counts drop gradually to match the PT level after 12 days of recovery. No RIF-resistant colonies were observed from the PT microbiome, with 83% resistance (comparing counts from plates with and without RIF) appearing after the 3-day treatment. Resistance rate drops after that, being 44% at 1 day into recovery and 2.4% after 12 days. In the matching solvent-exposed control fish, total counts rose 29-fold after 7 days of recovery and continued high at 38-fold after 12 days. Resistance to RIF was low, being 0.03% after 7 days of recovery and 0.05% after 12 days.
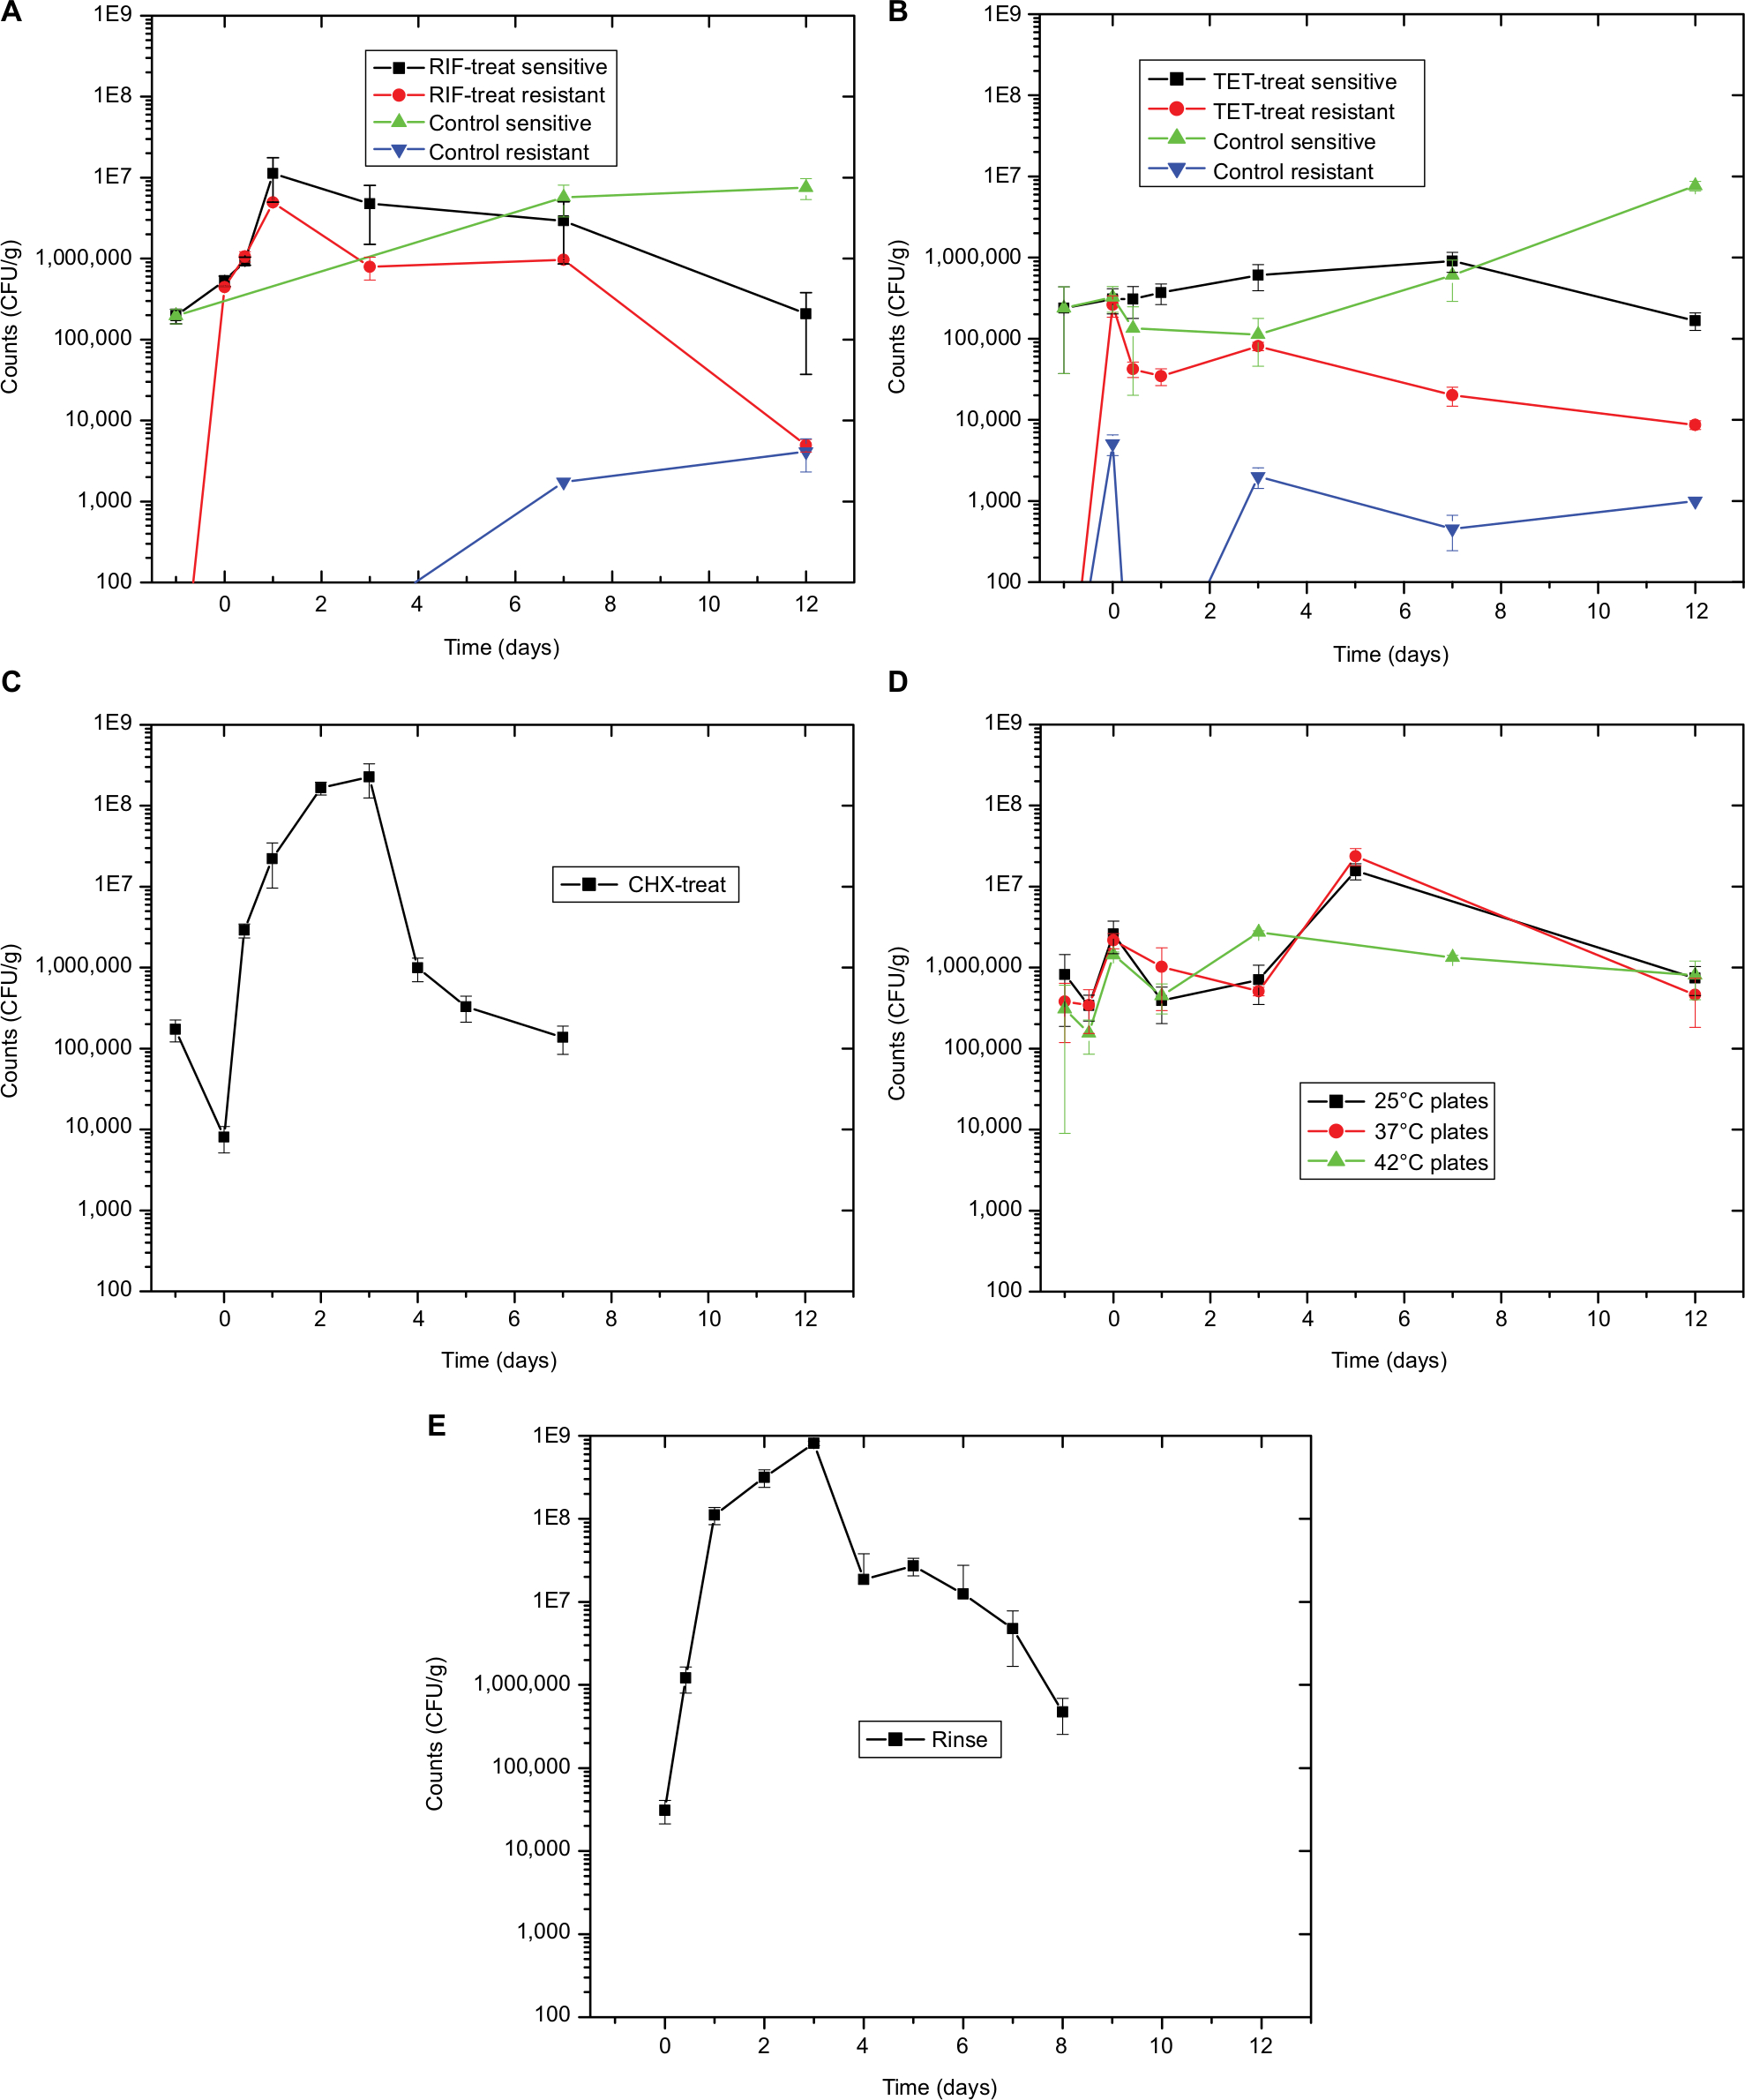 | Figure 2 Sensitive and resistant culturable numbers. Notes: (A) Data from the PT fish shown at −1 on the X-axis. Data from the fish after 3 days of RIF treatment shown at 0 on the X-axis. All other points shown at days after recovery. PT resistant count is 0. All five graphs share the same axes for ease of comparison. (B) Data from the PT fish shown at −1 on the X-axis. Data from the fish after 3 days of TET treatment shown at 0 on the X-axis. All other points shown at days after recovery. There were no TET-resistant colonies from PT fish or at the 1 day time point for the control fish. (C) Data from the PT fish shown at −1 on the X-axis. Counts after 30-minute CHX treatment shown at 0 on the X-axis. All other points shown at days after recovery. (D) Data from the PT fish shown at −1 on the X-axis. Data at 10 hours, just after final temperature reached, shown at −0.5 on the X-axis. Data from the fish after 3 days of 34°C treatment shown at 0 on the X-axis. All other points shown at days after recovery. (E) Data from the PT fish shown at 0 on the X-axis. All other points shown at days after recovery. This first time point is after 10 hours of recovery. Abbreviations: CFU, colony-forming unit; CHX, chlorhexidine; PT, pre-treatment; RIF, rifampicin; TET, tetracycline; treat, treatment. |
Total plate counts after the 3 days of TET treatment rose 1.3-fold (Figure 2B). Counts gradually rose during recovery, peaking at 3.8-fold above the PT level after 7 days of recovery and dropping to 70% of initial counts after 12 days. Again, no TET-resistant colonies were recovered from the skin microbiome before treatment, and resistance rose to 85% after the 3-day treatment. Once again, resistance rates dropped across recovery, being 9.4% after 1 day and 5.2% after 12 days. The solvent control for this experimental run was consistent with the RIF experiment, with total counts gradually rising, being 2.6-fold higher than PT after 7 days of recovery and 32-fold higher after 12 days. As expected, resistance to TET was low, being 0.9% after 3 days of exposure to DMSO, whereas 1.8% after 3 days of recovery and 0.01% after 12 days. Resistance to both RIF and TET appears quickly and persists in the skin microbiome for at least 12 days. In the microbiome community, this is more likely selection of intrinsically resistance species rather than of mutants in normally susceptible species; however, this is still unknown.
Total plate counts strongly dropped (to 4.6% counts of the PT level) after the 30-minute treatment with CHX (Figure 2C). Counts then rose consistently, peaking at 1,310-fold above PT levels after 3 days of recovery. After that, counts trended downward, reaching just below (79%) PT levels after 12 days.
During the elevated temperature disruption experiment, skin microbiome dilutions were plated onto NA and incubated at four different temperatures, 25°C, 37°C, 42°C, and 45°C, to measure the potential selection of thermophiles (Figure 2D). Looking at colonies from the 25°C plates, total counts increased during the 3-day treatment by 3.2-fold compared to the PT levels (8.20±6.32 × 10⁵ CFU/g). Counts peak after 5 days of recovery, being 19-fold higher (1.56±0.35 × 10⁷ CFU/g) than the initial PT level, and then falls to just below initial levels (7.42±2.90 × 10⁵ CFU/g) by day 12. Counts from the PT fish skin microbiome at 37°C were 46% that of counts at 25°C, and 42°C counts were 38% of those at room temperature. Just after 3 days of temperate treatment, counts from 37°C rose to 83% of those from plates incubated at 25°C from the same sample, whereas the 42°C counts were 55%. Counts from the 45°C plates were too low (<20 colonies per plate) to be statistically reliable. Colonies at 45°C were not recovered from the PT fish and only seen on plates from the 3-day treatment, 3-day recovery, and 5-day recovery samples. Nutrient broth tubes were also inoculated from fish at all time points and incubated at 45°C. All tubes were positive for growth except 10-hour treatment and 12-day recovery samples.
The rinse protocol was effective in removing viable skin bacteria, as the plate counts from a fish sampled after 5 hours of recovery were below detectable levels. Counts rose dramatically after that, peaking at 26,200-fold higher (8.12±0.52 × 10⁸ CFU/g) than PT levels (3.10±0.98 × 10⁴ CFU/g) after 3 days of recovery (Figure 2E). Counts then fell gradually, ending at 15-fold (4.72±2.19 × 10⁵ CFU/g) above PT levels on day 8.
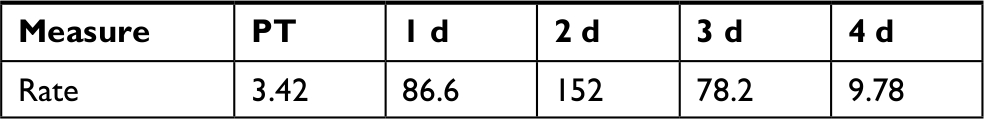
Overgrowth, as observed by total CFU counts on NA plates, is slowly and gradually increased in RIF and TET control experiments (Figure 2A and B). This is possibly explained by the move to a new environment of the APW, which is initially sterile, with constant inflow of nutrients via the fish food. A different pattern in total counts is observed following disruptions, that of a drop followed by overgrowth peak, then decline back to initial numbers (Figure 2A–C). The cause for the overgrowth is unclear. Overgrowth after antibiotic disruption is not commonly mentioned in the literature; however, almost all studies rely on 16S profiling, which does not determine total microbial abundance, only normalized community abundance. Similarly, metagenomic sequencing is not quantitative. The overgrowth effect is small in TET (3.8-fold above initial CFU numbers on day 7), higher in RIF (58-fold on day 1), and much higher in CHX (1,310-fold on day 3) and rinse (26,200-fold on day 3), whereas the pattern (decline, rise, and then back to initial levels) is similar in all conditions. Looking at the rinse disruption, perhaps the high colony counts (Figure 2E) result from the community being heavily dominated by one OTU (Figure 3), namely Aeromonadaceae. One possibility is that the fish respond to being rinsed by generating an excess of skin mucus, thus making more bacterial habitat, and so increasing the total counts per fish. However, measurement of skin mucin levels before and after rinsing in two independent runs revealed that skin mucin levels only rise to a small degree and do not peak the same days as the total counts (Table 2). Another possibility is that the total density of bacteria in the skin microbiome does not change, but instead simply the numbers of bacteria culturable (that form colonies on NA) are increased, with the total numbers unchanged. This was examined by measuring total bacterial numbers from the fish skin using two culture-independent methods. Bacterial skin numbers visible by direct Gram stain increased 12-fold following rinse (Table 3) and the rate of metabolic activity of total skin microbiome samples increased (peaking at 44-fold above PT level on day 2) after rinsing (Table 4), confirming that total numbers have increased, not just a few culturable organisms.
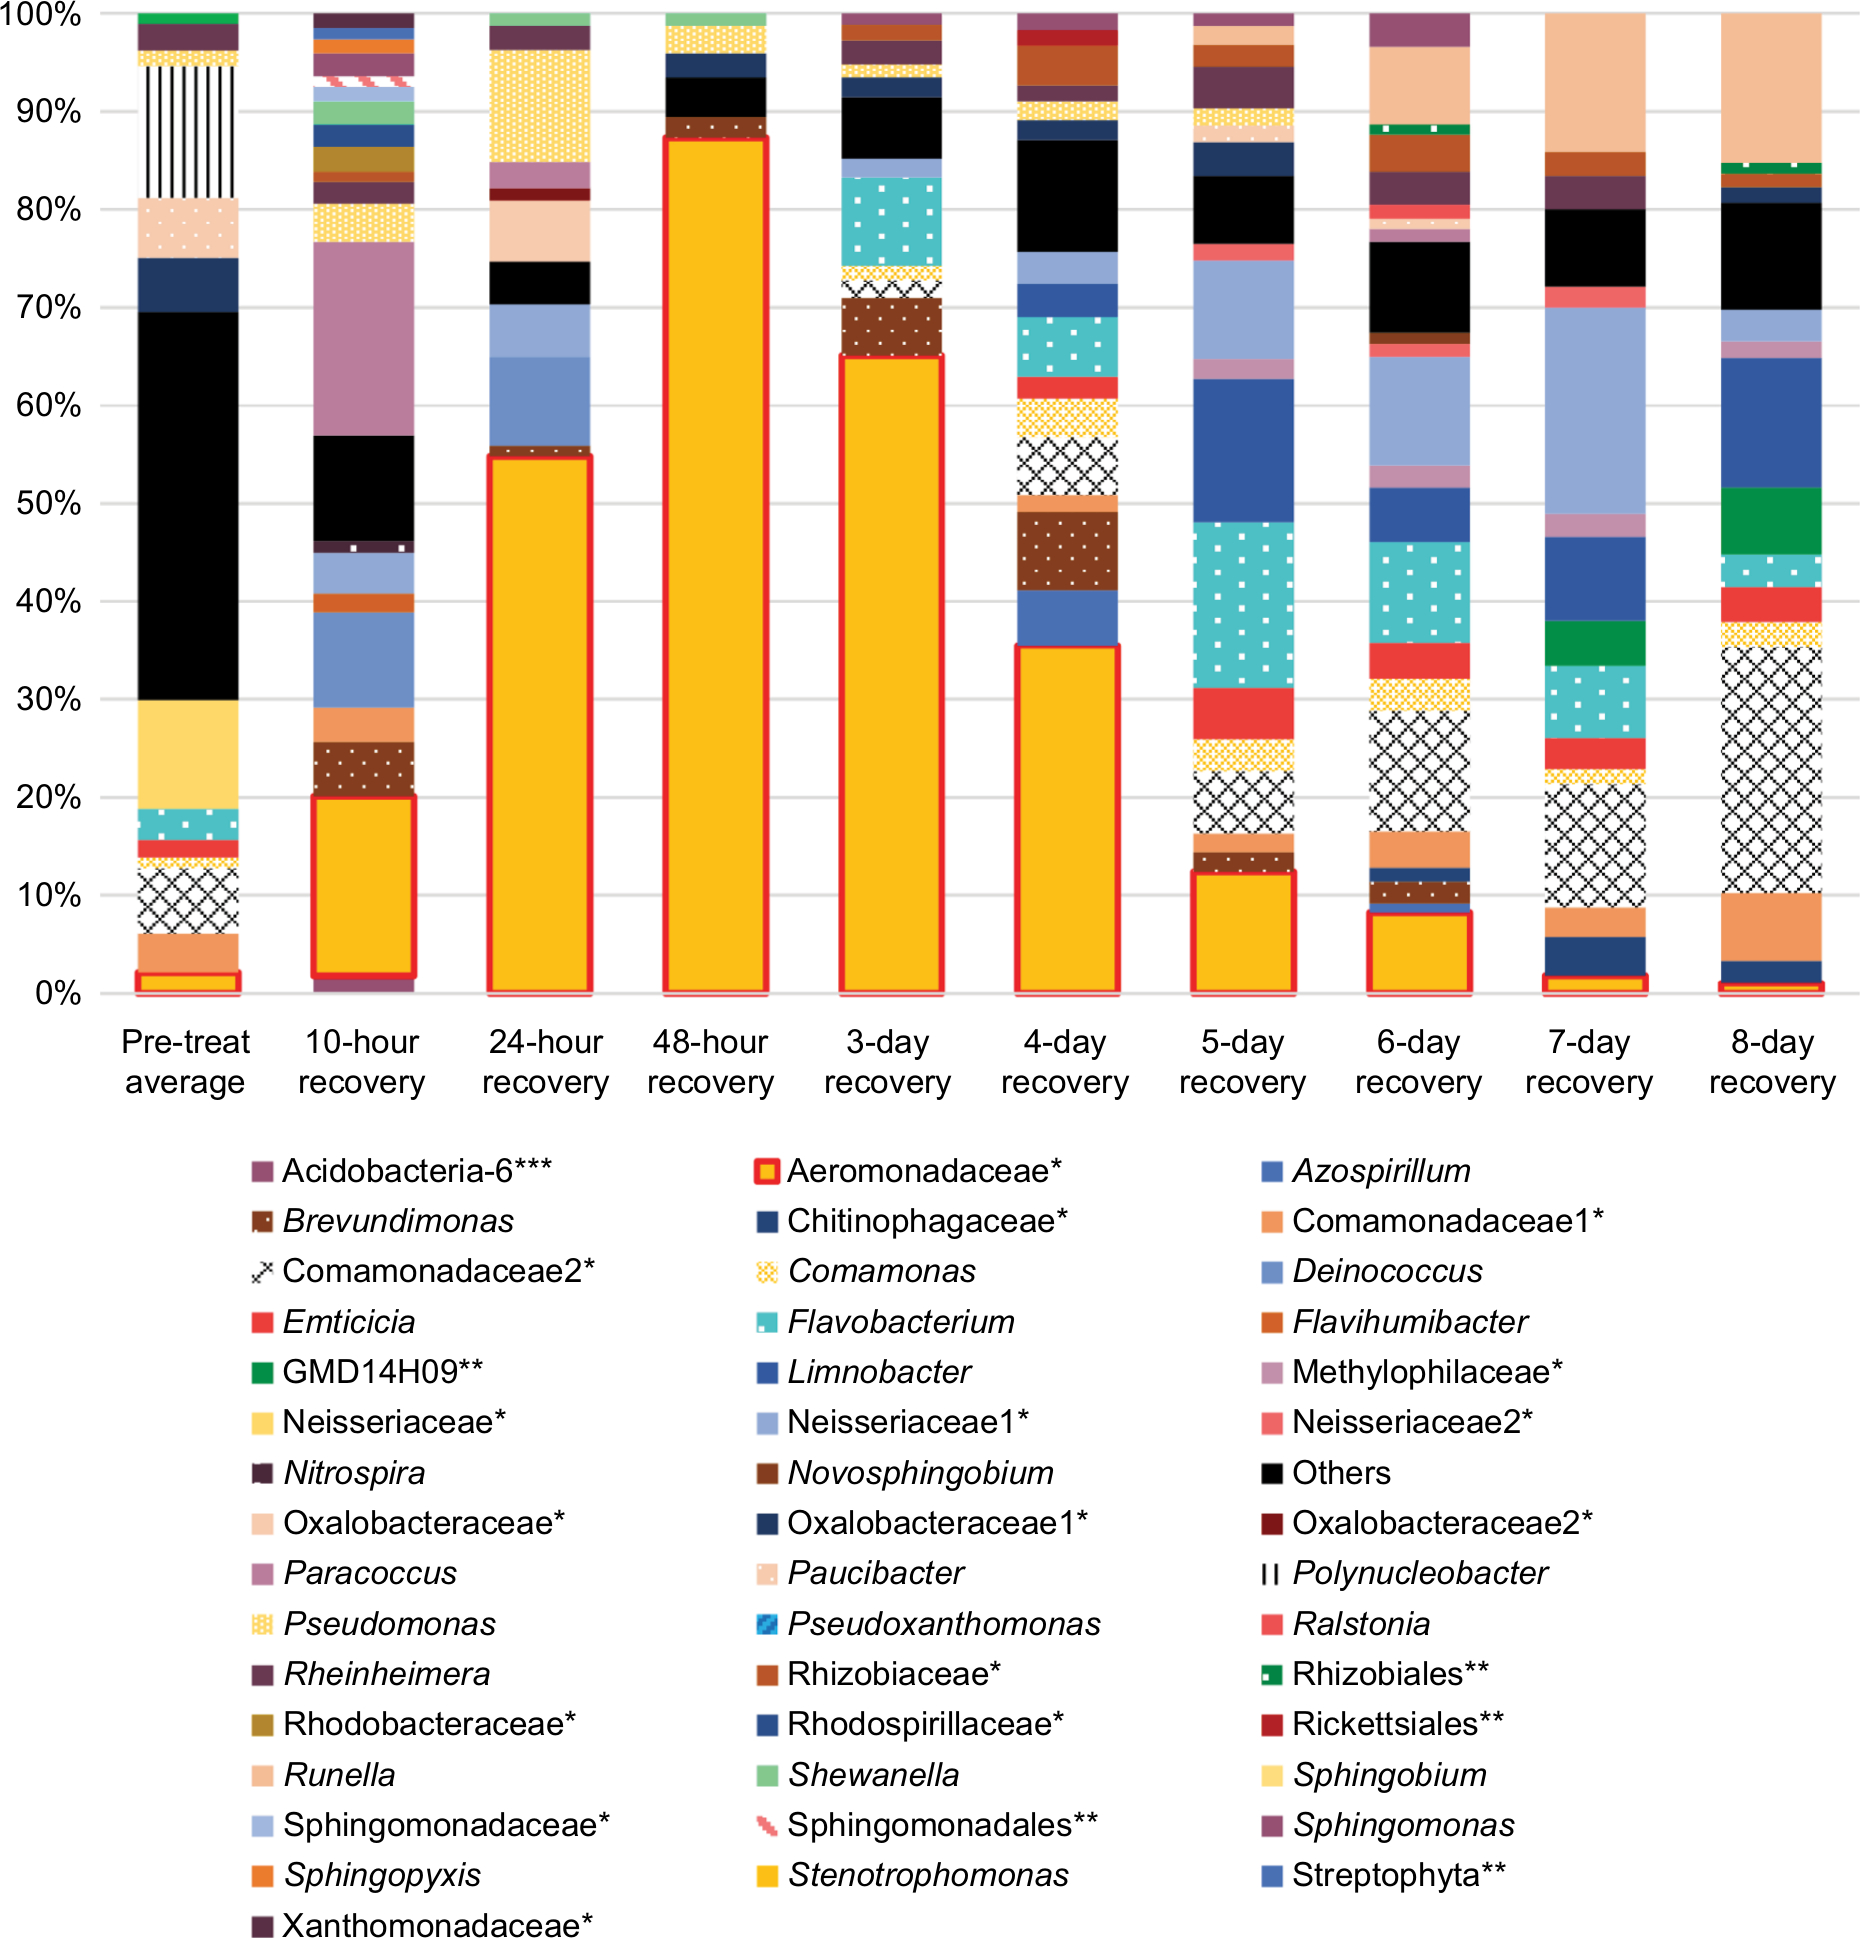 | Figure 3 Community composition rinse experiment. Notes: Normalized abundance of community members at most precise level of taxonomic identification (mostly genus). OTUs that are identified at the family level have a single asterisk, ones identified at the order level have two asterisks, and class level with three asterisks. Names without an asterisk are at the genus level. Only shown are members with >1% abundance in at least one sample. The pre-treatment fish skin microbiome is an average abundance from three fish. All other columns represent one fish. Abbreviation: OTU, operational taxonomic unit. |
 | Table 2 Skin mucin levels after rinsing Notes: Mucin is the mean percentage and SD of mucin levels per fish, with pre-treated levels set to 100% (which was 980 µg mucin/g fish weight). Two fish were measured per time point, except at day 8, which is just one animal. 0 d is immediately after rinsing. 1 d, 2 d, 4 d, and 8 d are days after rinsing. Abbreviations: d, days; PT, pre-treatment. |
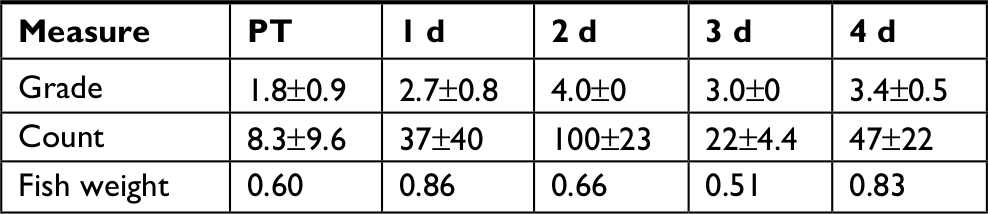 | Table 3 Skin Gram stain after rinsing Notes: Grading is according to a standard scale.32 Both count (number of bacteria per field) is the mean number and SD per microscopic field. Ten fields were counted per sample. Fish weight is in grams. Other time points are days of recovery. Abbreviations: d, days; PT, pre-treatment. |
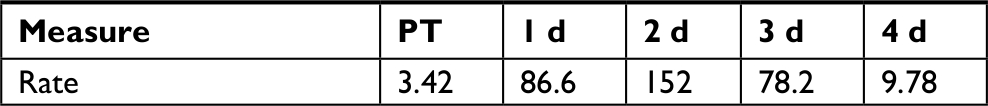 | Table 4 Skin microbiome metabolic activity after rinsing Notes: Rate is the rate of gain of fluorescent intensity at 583 nm per hour per gram of fish weight. Other time points are days of recovery. Abbreviations: d, days; PT, pre-treatment. |
Community biochemical profiles
Twenty biochemical activities were measured in the extracted skin microbiome communities of fish before treatment with RIF and during recovery after treatment (Table 5) using the API-20E system. Six activities were present in the PT community, and all these were maintained across the recovery samples. Three new activities, arginine dihydrolase, tryptophan deaminase (TDA), and arabinose utilization, appeared in the recovery samples. Fish skin samples taken after the 3-day treatment and after 10 hours of recovery were both negative for all activities (data not shown), probably because of low viability and/or post-antibiotic effect. TDA and arabinose utilization were also gained in the microbiomes of the control fish, appearing in both 7-day and 12-day recovery time points.
 | Table 5 Biochemical community profiles after RIF treatment Notes: Activities determined using the API-20E system. DMSO-treated control fish activities were measured only on days 7 and 12 of recovery, with results displayed after the slash. Differing results between RIF and control are highlighted in red. Tests that are negative in all samples and thus not shown in the table include LDC; ODC, CIT (citrate utilization), H2S (hydrogen sulfide production), URE, VP (acetoin production), INO (inositol utilization), SOR (sorbitol utilization), RHA (rhamnose utilization), and MEL (melibiose utilization). Abbreviations: d, days; DMSO, dimethyl sulfoxide; LDC, lysine decarboxylase; ODC, ornithine decarboxylase; PT, pre-treatment; RIF, rifampicin; URE, urease; ONPG, o-nitrophenyl-D-galactopyranoside. |
Twenty-five skin community biochemical activities were measured using the Microgen GN A + B system following TET treatment (Table 6). Eleven activities were present in the PT sample, with seven of those positive across all recovery samples as well. Acetoin production was not present after the 3-day treatment and apparently lost during treatment. During recovery, lysine decarboxylase, hydrogen sulfide production, and arginine dihydrolase were also lost, whereas arabinose utilization was gained.
 | Table 6 Biochemical community profiles after TET treatment Notes: Activities determined using the Microgen GN A + B system. T is after the 3-day treatment. Other time points are days of recovery. DMSO-treated control fish activities were measured after the 3-day treatment, and on 0.42 d, 3 d, 7 d, and 12 d of recovery, with results displayed after the slash. Differing results between TET and control are highlighted in red. Tests negative for all samples include ODC, CIT (citrate utilization), URE, TDA, GEL, INO (inositol utilization), SOR (sorbitol utilization), RHA (rhamnose utilization), XYL (xylose utilization), MAL (malonate utilization), LAC (lactose utilization), ADO (adonitol utilization), and RAF (raffinose utilization). VP, acetoin production. Abbreviations: d, days; DMSO, dimethyl sulfoxide; GEL, gelatinase; ODC, ornithine decarboxylase; PT, pre-treatment; TET, tetracycline; URE, urease; ONPG, o-nitrophenyl-D-galactopyranoside. |
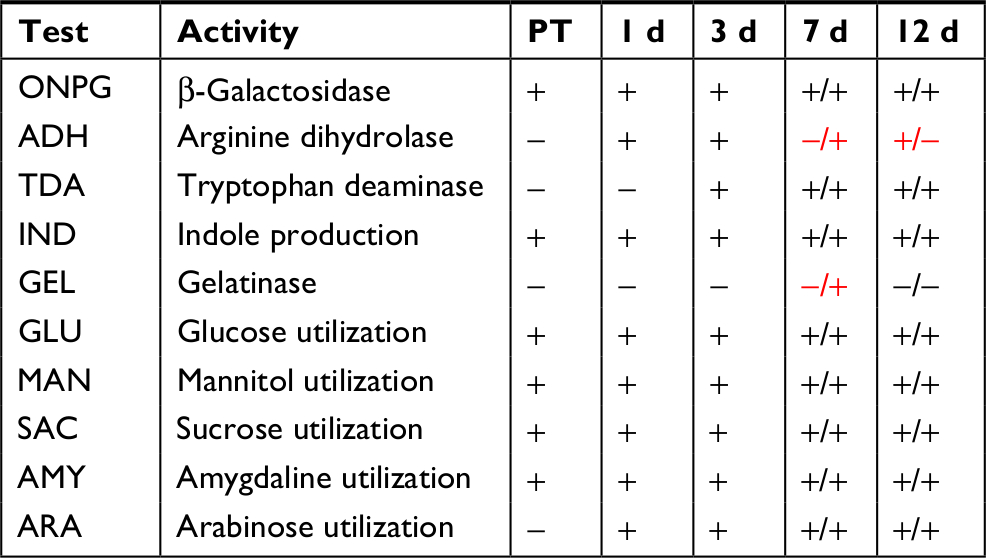
Community biochemical profiles exhibited a biphasic pattern during recovery after CHX treatment (Table 7). Ten activities were present in the PT community, and little change (only one activity lost) was observed immediately after the 30- minute treatment. The pattern across recovery time points of 10 hours, 1 day, 2 days, and 3 days was consistent, and then changed to a different consistent pattern on days 4, 5, and 7. The first pattern had four activities added to the ones present in the PT, including arginine dihydrolase, lysine decarboxylase, acetoin production, and gelatinase (GEL). All four of those were lost in the second pattern, and two additional activities were lost, indole production and arabinose utilization.
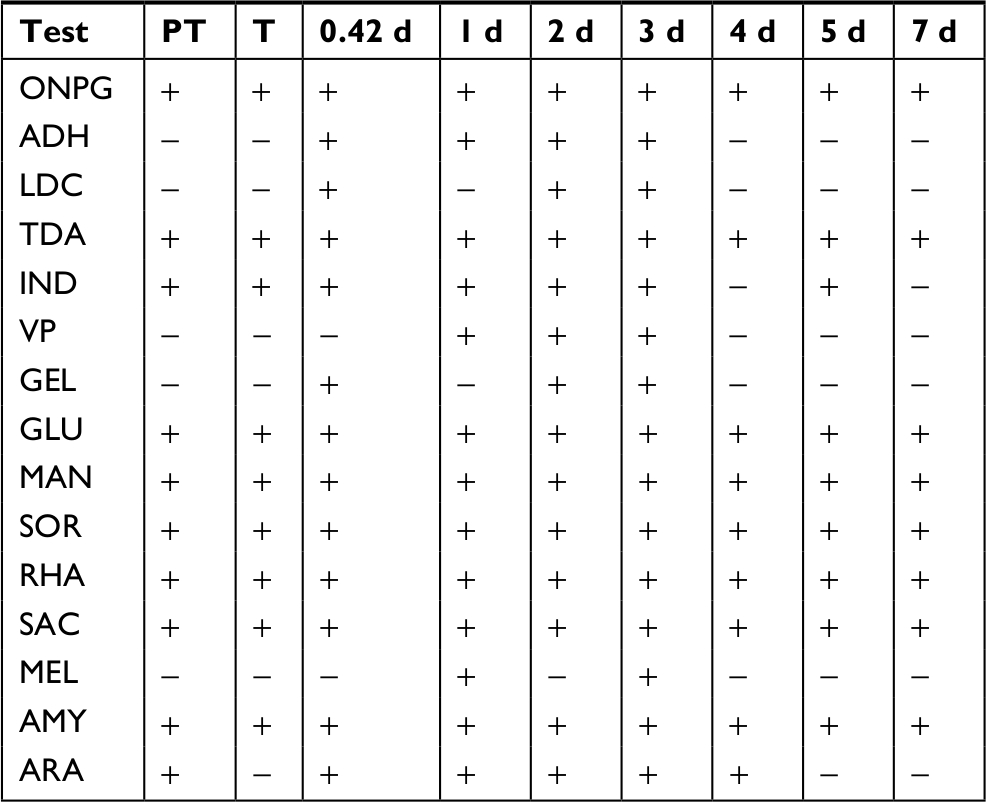 | Table 7 Biochemical community profiles after CHX treatment Notes: Activities determined using the API-20E system. Other time points are days of recovery. T is after the 30-minute treatment. Tests negative for all samples include ODC, CIT, H2S, URE, and INO. ADO, adonitol utilization; AMY, amygdaline utilization; ARA, arabinose utilization; CIT, citrate utilization; GLU, glucose utilization; H2S, hydrogen sulfide production; IND, indole utilization; INO, inositol utilization; LAC, lactose utilization; MAL, malonate utilization; MAN, mannitol utilization; MEL, melibiose utilization; RHA, rhamnose utilization; SAC, sucrose utilization; SOR, sorbitol utilization; VP, acetoin production; XYL, xylose utilization. Abbreviations: ADH, arginine dihydrolase; CHX, chlorhexidine; d, days; GEL, gelatinase; LDC, lysine decarboxylase; ODC, ornithine decarboxylase; PT, pre-treatment; TDA, tryptophan deaminase; URE, urease; ONPG, o-nitrophenyl-D-galactopyranoside. |
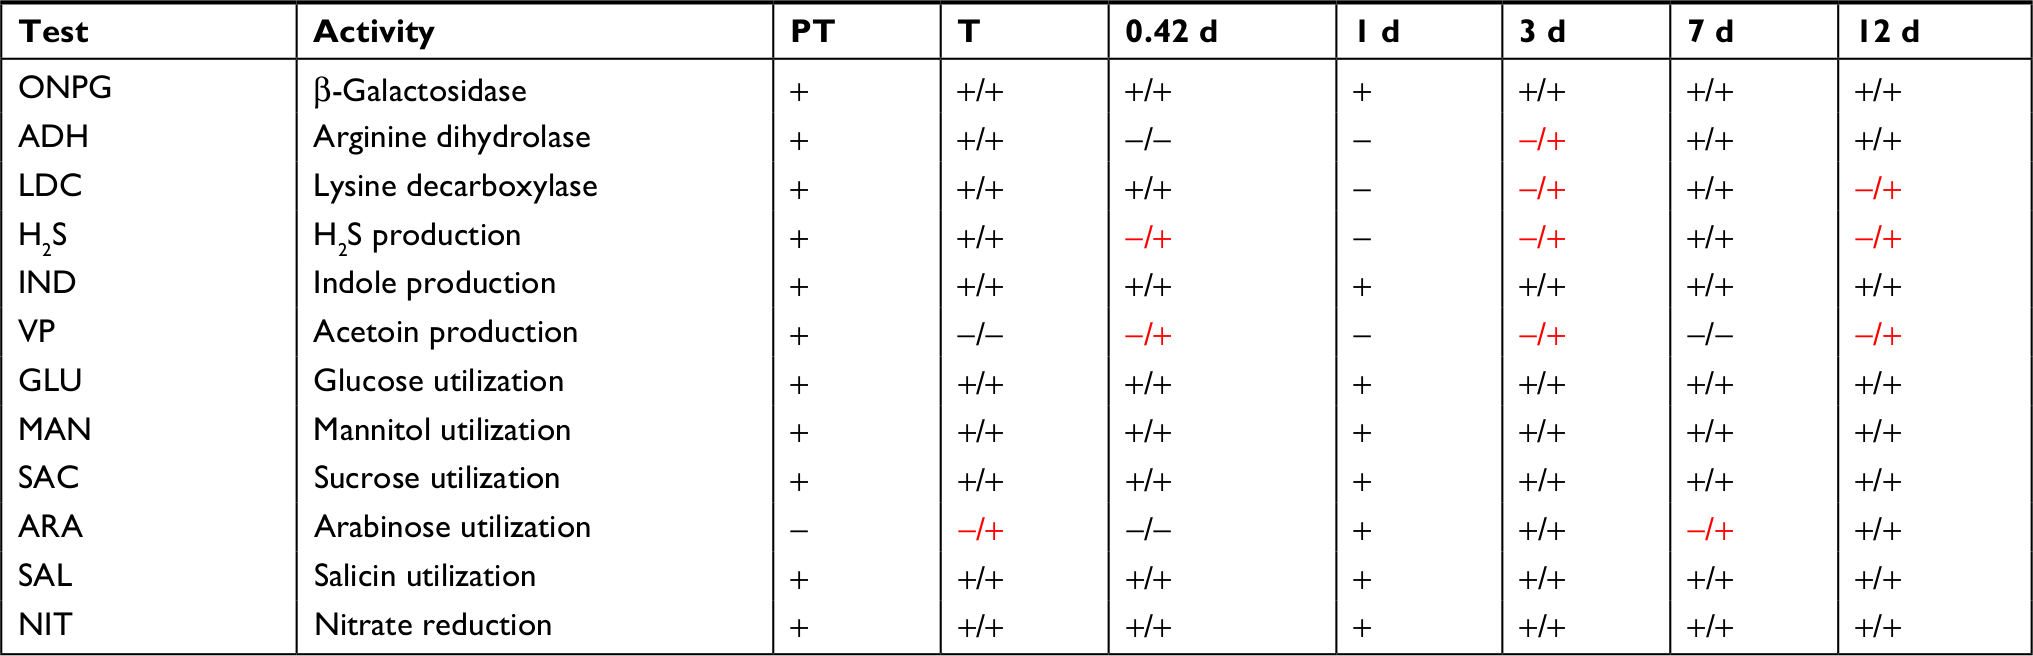
The PT-extracted skin microbiome exhibited eight biochemical activities in the Microgen GN A + B system before exposure to elevated temperature (Table 8). Six were consistently present at all treatment and recovery time points. Two activities, arginine dihydrolase and lysine decarboxylase, were gained during the treatment and persisted throughout recovery, while arabinose utilization and salicin utilization were present in the PT activities but lost during treatment and recovery.
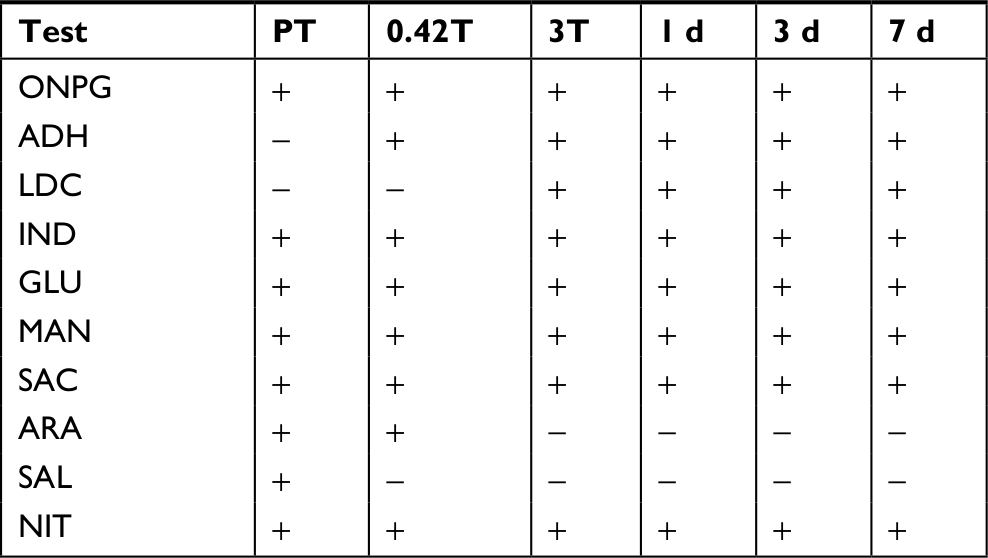 | Table 8 Biochemical community profiles after temperature treatment Notes: Activities determined using the Microgen GN A + B system. 0.42T is 10 hours of treatment. 3T is 3 days of treatment. Other time points are days of recovery. Tests negative for all samples include ODC, CIT, H2S, URE, TDA, VP, GEL, INO, SOR, RHA, XYL, MAL, LAC, ADO, and RAF. ADO, adonitol utilization; ARA, arabinose utilization; CIT, citrate utilization; GLU, glucose utilization; H2S, hydrogen sulfide production; IND, indole utilization; INO, inositol utilization; LAC, lactose utilization; LDC, lysine decarboxylase; MAL, malonate utilization; MAN, mannitol utilization; NIT, nitrate reduction; RAF, raffinose utilization; RHA, rhamnose utilization; SAC, sucrose utilization; SAL, salicin utilization; SOR, sorbitol utilization; VP, acetoin production; XYL, xylose utilization. Abbreviations: ADH, arginine dihydrolase; d, days; GEL, gelatinase; ODC, ornithine decarboxylase; PT, pre-treatment; TDA, tryptophan deaminase; URE, urease; ONPG, o-nitrophenyl-D-galactopyranoside. |
Ten biochemical activities were present in the extracted PT skin microbiome of fish before rinsing (Table 9). No activities were observed in the skin microbiome extracted from a fish 5 hours after rinsing, likely because of low counts (data not shown). Compared to the PT, three activities were different after 10 hours of recovery; however, all three reverted to the PT pattern in later time points. All activities were consistent across the 1-, 2-, 3-, and 4-day recovery samples, which exhibited all the ten PT activities plus two additional activities: arginine dihydrolase and GEL. The biochemical profile after 7 days of recovery was identical to the PT sample.
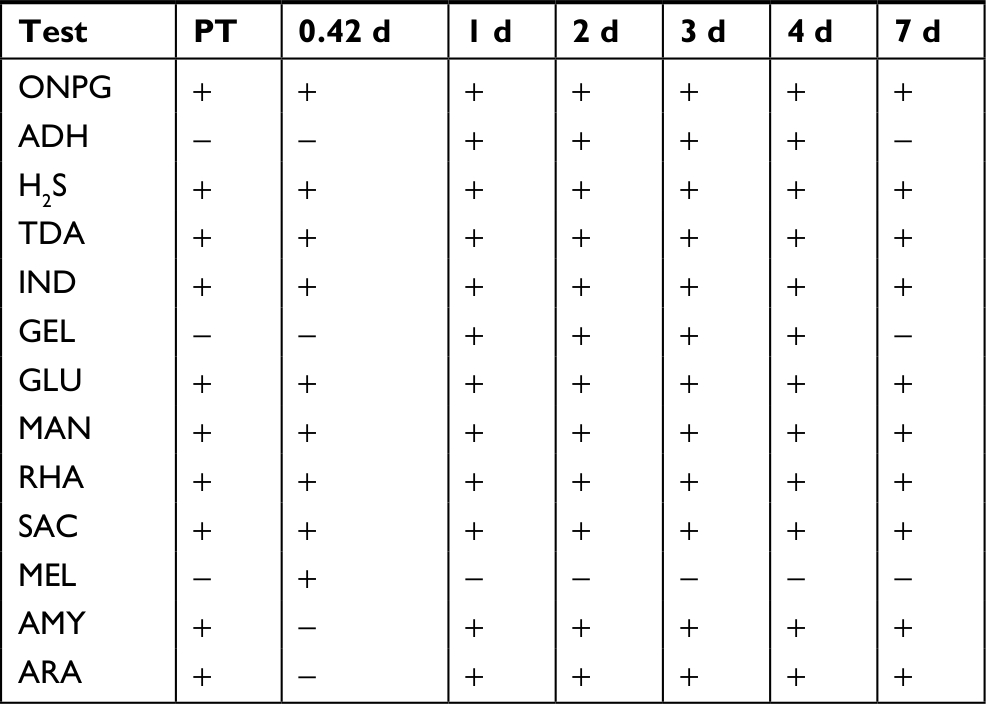 | Table 9 Biochemical community profiles after rinsing Notes: Activities determined using the API-20E system. All other samples are during recovery. Tests negative for all samples include LDC, ODC, CIT, URE, VP, INO, and SOR. AMY, amygdaline utilization; ARA, arabinose utilization; CIT, citrate utilization; GLU, glucose utilization; H2S, hydrogen sulfide production; IND, indole utilization; INO, inositol utilization; LAC, lactose utilization; LDC, lysine decarboxylase; MAL, malonate utilization; MAN, mannitol utilization; MEL, melibiose utilization; RHA, rhamnose utilization; SAC, sucrose utilization; SOR, sorbitol utilization; VP, acetoin production; XYL, xylose utilization. Abbreviations: ADH, arginine dihydrolase; d, days; GEL, gelatinase; ODC, ornithine decarboxylase; PT, pre-treatment; TDA, tryptophan deaminase; URE, urease; ONPG, o-nitrophenyl-D-galactopyranoside. |
Comparing skin microbiome community biochemical activities across all five of the PT samples reveals that there is some variation before disruption (Tables 4–9). Nineteen tests are shared between the API 20E and Microgen A + B systems, with 11 results (six positive and five negative) consistent, a further four mostly consistent (negative in four PT populations but positive in one), and four (namely, arabinose utilization, rhamnose utilization, TDA, and hydrogen sulfide production) flexible, giving a mixture of positive and negative results. So, the untreated fish skin community across different aquaria is 79% consistent. Within one aquarium, the variation between fish is very small (skin microbiomes are homogenized), with three fish from the same aquarium having identical biochemical profiles.7 This is likely because the skin microbiomes are immersed, making individual fish physically connected via the water.
Looking across the five disruption experiments, the skin community biochemical profiles are mostly consistent following disruption, with only three or four activities changing. So, untreated fish skin communities exhibit ~20% variability and following disruption, about 20% variability is observed. While arginine dihydrolase is negative in all PT communities except one, and so consistently not observed, it fluctuates after all five disruptions. It is gained after RIF treatment (but not in the DMSO control), gained in the short-term pattern after CHX treatment (then lost in the long-term), gained after the temperature increase, temporarily gained after the rinse, and temporarily lost after TET exposure. This suggests that arginine dihydrolase activity appears to be due to some taxa sensitive to disruption. Likewise, lysine decarboxylase is negative in all PT communities except one yet fluctuates following three disruptions. It is gained in the short-term pattern after CHX treatment (then lost in the long-term), gained after temperate increase, and temporarily lost after TET exposure. GEL is also negative in all PT fish microbiomes, yet temporarily appears following the rinse and CHX treatment. Acetoin production (VP reaction) is lacking in all PT fish except the TET experiment, where it is lost after treatment, but not by the control fish microbiome. The larger functional role of these fluctuating activities is still unclear and will be further investigated. Arabinose utilization is present in three PT communities and absent in two and is also gained during both RIF and TET treatments and during both of the control groups in those runs. Furthermore, it is lost in the CHX long-term pattern and in recovery after the high temperature. So, this activity is presumably from one or more taxa that are variable in untreated communities and sensitive to disruption. Finally, while rhamnose utilization varies among PT skin communities (present in two and lacking in three), it never changes after any disruption. Rhamnose is often a component of lipopolysaccharide and given that the majority of the microbiome is Gram negative, utilization pathways may be common among many taxa.
The skin community biochemical profiles exhibit two patterns during the recovery experiments. The first pattern is a consistent change in activities without a return to the PT pattern. RIF treatment results in a 15% change and no return, whereas TET results in a 12% change and high temperature in a 16% change. The second pattern is a change in activities followed by a return to the original PT pattern. CHX treatment resulted in a 20% change in activities, but then returned to a pattern that was only different from the PT pattern by one activity (so 5% different). Following the rinse, the pattern changed 10% from the PT pattern, but then returned to a pattern identical to PT.
Community fingerprinting
The skin microbiome community fingerprint was observed using ERIC during elevated temperature treatment and recovery (Figure 4). The PT gel lane was faint and displayed two prominent bands, at ~475 and 900 bp in size. The same two bands were dominant in the 0.42-day treatment sample, which was darker, which also revealed major bands at 375 and 275 bp. The 3-day treatment sample was extremely faint, only showing the two bands present in the PT community. The 1-day recovery sample was similar to the 0.42-day treatment sample, with addition of a band at about 680 bp. The 7- and 12-day recovery samples were also similar to the PT and 0.42-day treatment patterns, and thus ERIC was not able to detect significant community fingerprint changes, with too few bands for patterns. It is unclear if this is an accurate representation of the communities or a limitation of the method.
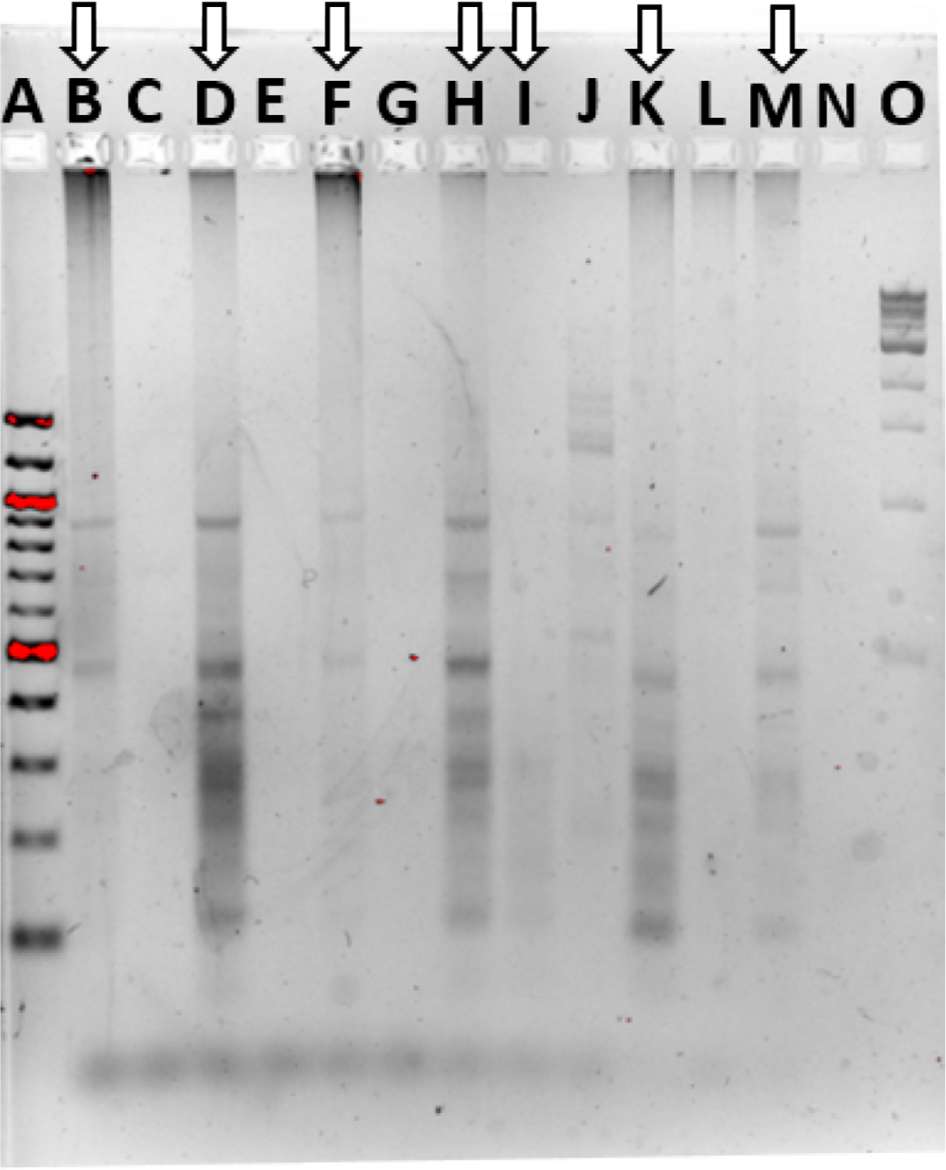 | Figure 4 Community fingerprint during and following elevated temperature. Notes: Community fingerprint before, during, and after exposure of the fish skin microbiome to elevated temperatures. A: 100 bp DNA ladder, B: pre-treatment fish skin microbiome sample, C: pre-treatment aquarium water sample, D: 10-hour treatment, E: 10-hour treatment APW water sample, F: 3-day treatment, G: 3-day treatment APW sample, H: 24-hour recovery, I: 3-day recovery, J: 3-day recovery APW sample, K: 7-day recovery, L: 7-day recovery APW sample, M: 12-day recovery, N: empty lane, and O: 1 kb DNA ladder. Lanes with arrows are fish skin microbiome, other lanes are surrounding water samples. Abbreviation: APW, artificial pond water. |
Community fingerprints were also determined during the rinse experiment, using both the RISA method (Figure 5A) and the ERIC method (Figure 5B). Performing both from the same DNA samples allowed comparison of those methods to each other and to the 16S sequence profiles from this experiment. The most dominant RISA band appeared in all samples, from PT to 7-day recovery, at about 850 bp. A second band, just below at 800 bp, was also in all samples, but varied in intensity across samples. The 1- and 2-day recovery samples had minor bands at 750, 600, and 500 bp, yet these were missing in the 4-day recovery sample. The 7-day recovery sample also had the 500 bp band and added a 400 bp band. ERIC analysis revealed consistent patterns in the PT, 0.42-day recovery, and 4-day recovery time points, with dominant bands at about 450 and 300 bp. The patterns do show variation in several bands as well. The 1- and 2-day recovery samples are much fainter and have different patterns. The 7-day recovery lane showed no signal, whereas the 5-hour recovery lane only had a smear with no discernable bands.
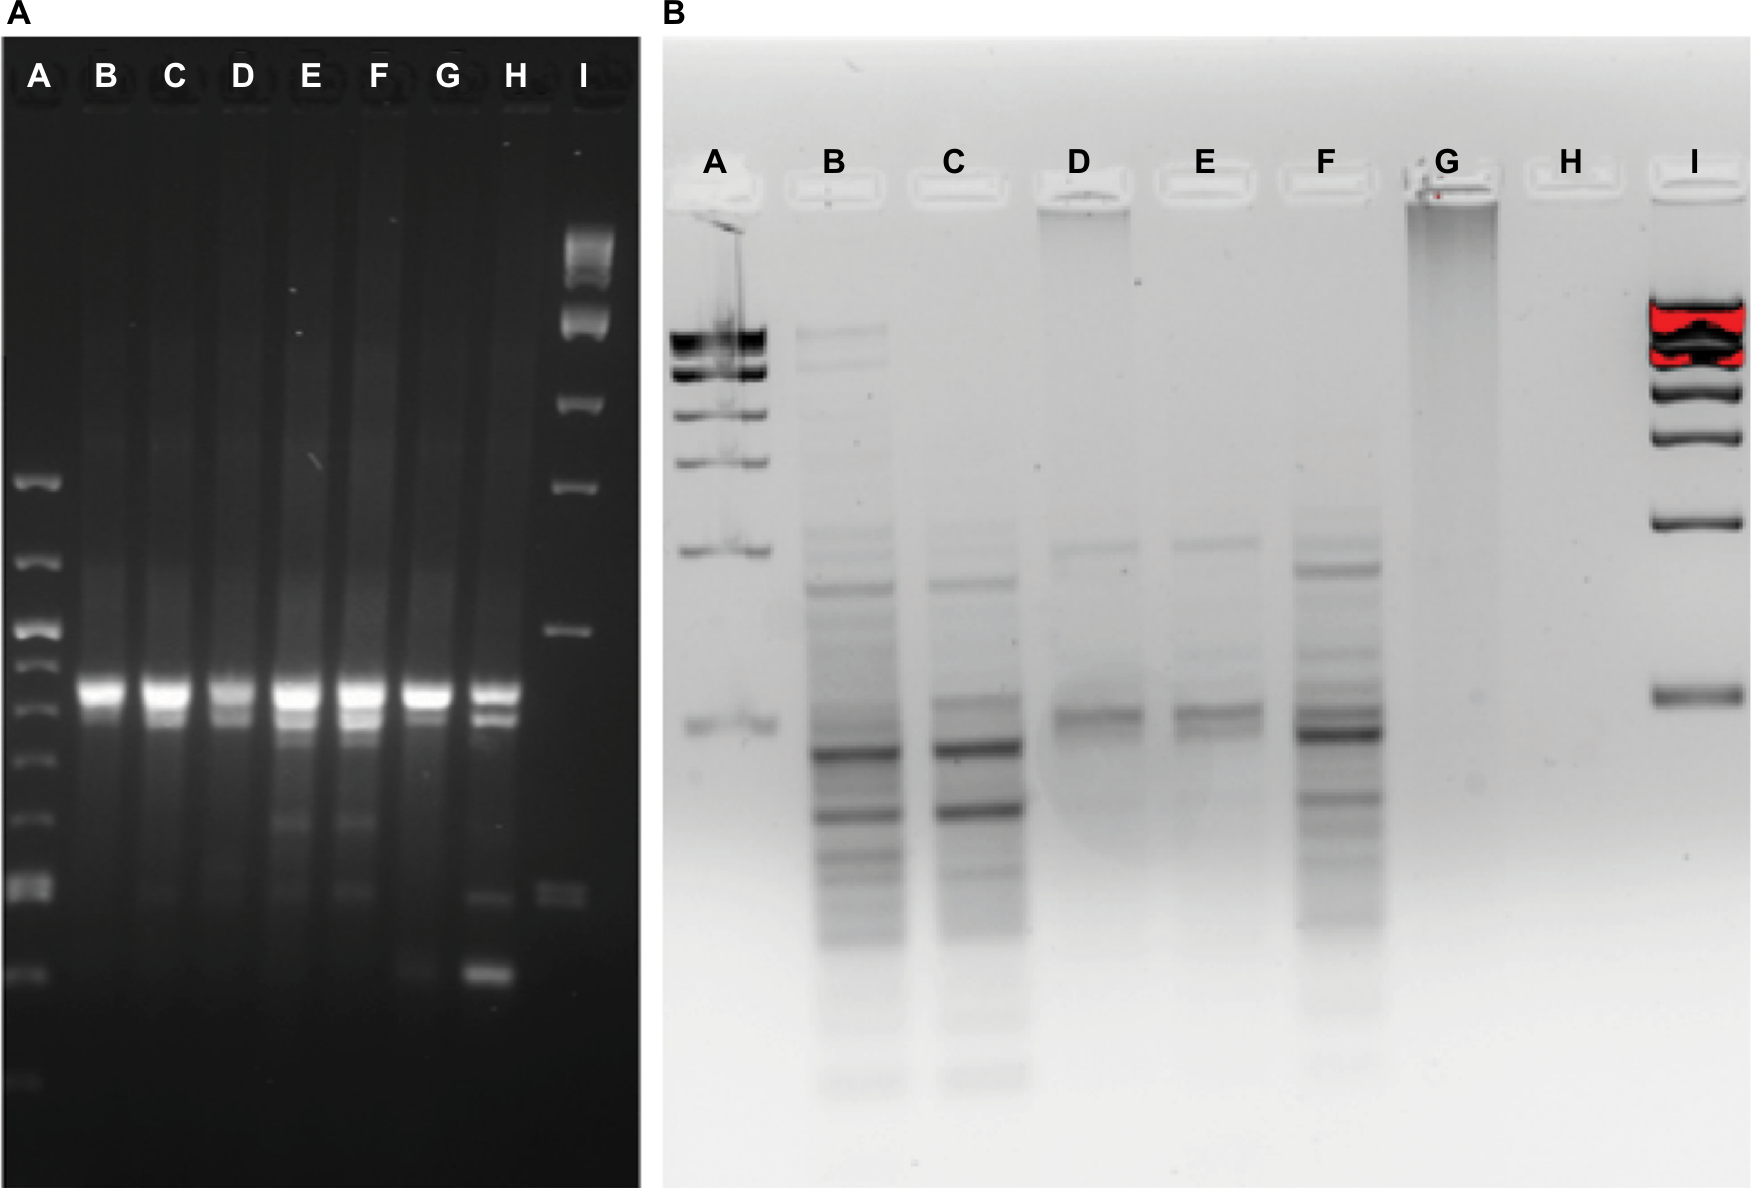 | Figure 5 Community fingerprint during rinse experiment. Notes: (A) RISA pattern from physical rinse disruption experiment. A: 100 bp DNA ladder, B: pre-treatment fish skin microbiome sample, C: 5-hour recovery, D: 10-hour recovery, E: 24-hour recovery, F: 48-hour recovery, G: 4-day recovery, H: 7-day recovery, and I: 1 kb DNA ladder. (B) ERIC PCR pattern from physical rinse disruption experiment. A: 1 kb DNA ladder, B: pre-treatment fish skin microbiome sample, C: 10-hour recovery, D: 1-day recovery, E: 2-day recovery, F: 4-day recovery, G: 5-hour recovery, H: 7-day recovery, and I: 1 kb DNA ladder. Abbreviations: ERIC, enterobacterial repetitive intergenic consensus; RISA, ribosomal intergenic spacer analysis. |
RISA suggests increased diversity at the 1- and 2-day time points, and composition differences between the PT, the 1- and 2-day and the 7-day communities. The ERIC suggests some composition differences between the PT, 0.42-day recovery, and 4-day recovery time points. The 16S community composition results show clearly that alpha diversity is lowest on 1- and 2-day recovery, and thus the RISA is misleading. While other researchers have used RISA successfully to analyze fish skin microbiomes,20 for our fish skin microbiome community, 16S sequence profile data were far superior in detail to either fingerprinting technique.
Community susceptibility
The antibiotic susceptibility of the fish skin community was examined using the microbroth method during the CHX treatment experiment (Table 10). Changes in twofold (one well) in the microbroth are not considered significant because they are within normal variability of replicate samples. Community susceptibility had the same pattern with the antibiotics RIF and kanamycin and the biocide CHX, with decreased susceptibility (compared to the PT community) 1 and 3 days after treatment, and then returning to susceptibility similar to that of PT 7 days after treatment. With chloramphenicol, susceptibility is not changed 1 day after treatment, but then decreases after 3 days, and then moves to strongly increased (16-fold) susceptibility after 7 days.
 | Table 10 Community susceptibility after CHX treatment Note: Numbers are MIC values in microgram per milliliter concentration. Abbreviations: CHX, chlorhexidine; d, days; MIC, minimum inhibitory concentration; PT, pre-treatment. |
Community susceptibility was examined following the rinse experiment using the disk diffusion method (Table 11). The community displayed no susceptibility at any time point to amoxicillin, ampicillin, oxacillin, or vancomycin, which all target the cell wall. This may be due to the microbiome being dominated by Gram-negative members. During the experiment, the community had no change (10% or less in the size of the zone of inhibition) in susceptibility to polymyxin B, nalidixic acid, amikacin, or gentamycin. Sensitivity was lowered (smaller zone of inhibition) to RIF, sulfisoxazole, streptomycin, and TET. Sensitivity was increased to ciprofloxacin, ceftriaxone, chloramphenicol, and kanamycin. Two antibiotics, trimethoprim–sulfamethoxazole and erythromycin, shared the same pattern of reduced sensitivity during recovery followed by increased sensitivity on day 7. Fluctuations in the community antibiotic susceptibility profile after rinsing are most likely due to changes in the community composition following disruptions. The fish skin microbiome is not susceptible to the b-lactam antibiotics, amoxicillin, ampicillin, or oxacillin, but is susceptible to ceftriaxone (Table 11). Interestingly, community susceptibility to ceftriaxone increases across recovery after the rinse disruption. This may be related to the fact that the skin microbiome is Gram negative dominated, and ceftriaxone is a third-generation cephalosporin that is more active against Gram negatives. No susceptibility to vancomycin is observed, and this is expected given the Gram-negative population. Since the Aeromonadaceae OTU is the majority of the 2-day skin community, the susceptibility profile on that day likely is mostly a reflection of the susceptibility of that particular OTU. Comparing susceptibilities from day 2 vs PT (2.1% Aeromonadaceae) and day 7 (1.8% Aeromonadaceae) should reveal characteristics of that particular taxa. On day 2, susceptibility is lower to SXT, ERY, and TET, compared to both PT and after 7 days. Assuming this OTU is one organism, in the future we need to culture it if possible and analyze susceptibility and biochemical data. Perhaps, erythromycin can be used as a selective agent to isolate it, given the potential intrinsic resistance.
 | Table 11 Skin microbiome metabolic activity after rinsing Notes: Rate is the rate of gain of fluorescent intensity at 583 nm per hour per gram of fish weight. Timepoints other than PT are days of recovery. Abbreviation: PT, pre-treatment. |
Community composition
The fish skin microbiome community composition was determined during the rinsing experiment (Figure 3). Diversity is lost in the microbiome following the disruption, with a minimum diversity reached after 2 days of recovery, followed by a partial return by 8 days (Table 12). All the microbiomes were dominated by the phylum Proteobacteria, with the minimum abundance being 70.4% in the 7-day sample and maximum being 99.6% in the 2-day sample.
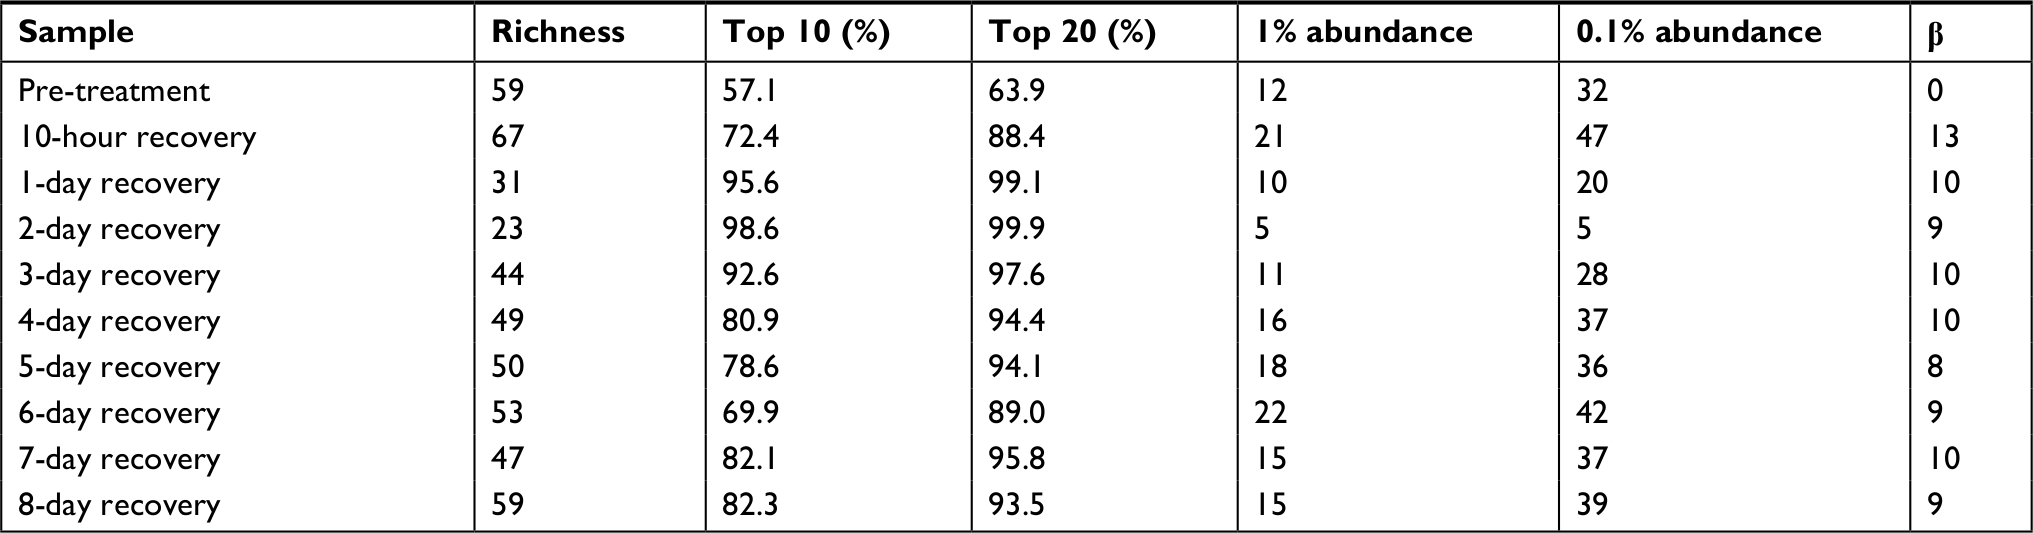 | Table 12 Diversity of dominant community members Notes: % abundance is those with 0.1% or above. β is beta 1% abundance, which is the number of OTU with a normalized abundance of 1% or higher in that sample and 0.1. Richness is the total number of OTU in the sample (alpha diversity) at the most accurate taxonomy level, usually genus. Top 10 is the cumulative percentage abundance of the 10 most abundant taxa in that diversity, the absence/presence difference in the most abundant 20 OTU between that sample and the pre-treatment average, with a value of 0 representing a perfect match and 20 meaning all different taxa sample, a measure of evenness. Top 20 is the cumulative percentage abundance of the 20 most abundant taxa in that sample. Abbreviation: OTU, operational taxonomic unit. |
Water microbiota
For comparison to the fish skin microbiome, samples were taken from the surrounding water during the RIF, TET, and rinse experiments. In all experiments, fish are transferred as a group to fresh APW, which is initially sterile, so the major source of bacteria initially are the fish themselves. Other sources would be from the air and in fish food (added daily). In the water, plate counts are high on day 1 recovery after rinsing (5.70±3.82 × 10⁷ CFU/mL) and then decline (2.18±1.17 × 10⁶ CFU/mL on day 4 and 1.94±0.43 × 10⁵ CFU/mL on day 8). Biochemical activities are similar but not identical to the fish skin microbiome (overall 84% similar in RIF experiment, 86% in TET experiment; data not shown). Community composition was determined from water samples during the rinse experiment, on days 1, 4, and 8 of recovery. Consistent with fish being the main source of bacteria initially, five families were higher than 1% abundance in the water on day 1 of recovery (Aeromonadaceae, Pseudomonadaceae, Deinococcaceae, Oxalobacteraceae, and Shewanellaceae), and all five of these were also dominant members in the fish skin microbiome at the same time point. The abundance of Aeromonadaceae was highest in both environments (73.5% in water and 54.8% in skin microbiome). By day 4, the water community had expanded to 13 families, 11 of those shared with the fish. None were unique to the fish skin, while additional two families, Deinococcaceae and Rhodobacteraceae, were unique to the water. But the diversity of the water decreased on day 8, having only seven families, with one strongly dominating (Cytophagaceae at 71.4%, which was 18.8% on fish skin at day 8). So, water did not exhibit the same large expansion of Comamonadaceae at the end like skin did (47.9% abundance on day 8 on skin while only 8.6% in water), instead have the peak of Cytophagaceae (mainly OTU of genus Runella). Runella grew in abundance on both fish and in the water toward the end of the experiment (by day 8, 67.8% in water and 15.2% in skin microbiome). Taken together, the 16S profile data support the concept that the water is reflecting organisms coming from the fish, but the composition is not identical because the environments are not the same.
The most striking observation from the community composition data of the rinse experiment is the domination during early recovery (Figure 3, days 1–3) of the fish skin microbiome by one taxa, identified at the family level as Aeromonadaceae. Unfortunately, given the vagueness of the family-level identification, prediction of biochemical activities and thus being able to integrate the 16S results and biochemical community profiles from the rinse experiment are not possible. This OTU is observed in PT control fish as the ninth most abundant, at 2.1%. It rises during recovery after the rinsing, being the most abundant taxa in the microbiome (peaking at 87.3% in the 2-day sample) at every sample until day 5 of recovery (where it is still the third-most abundant). This is perhaps an example of a pioneer species in secondary succession following a severe disruption. The high abundance of Aeromonadaceae is apparently not stable, as it falls to 1.0% abundance by day 8 of recovery. The abundance of this taxa has an inverse relationship to the community richness of the microbiome, which reaches a minimum of 23 detected taxa on day 2, less than half of the PT microbiome (compare Figure 3 and Table 12). The number of taxa that dominate the community, as measured by the taxa ≥1% or ≥0.1% abundance, follows the overall richness, with the final community at 8 days (39 of 59 community members being at or above 0.1% abundance) being more even than the PT community (32 of 59 being ≥0.1%). So, when Aeromonadaceae is most dominant, the community is least even. Three other genera exhibit similar patterns of a strong rise in abundance during recovery, followed by a decline. These may be influencing or influenced by Aeromonadaceae. Flavobacterium is a dominant member of the PT skin microbiome, at 3.2% abundance. This OTU rises and peaks at 16.9% abundance in the 6-day community, then falls to 3.3% in the 8-day community. Brevundimonas is an invader, not present in the PT community, and rises to 7.9% in the 4-day community, then falls to 0.09% in the 8-day community. Sphingomonas is 0.03% of the PT community, peaks at 3.4% in the 6-day community, and falls to 0.43% in the 8-day community. Potential interactions between these four OTUs will be explored in the future.
Transient domination by one OTU is a common principle after antibiotic disruption of a microbiome. In mice treated with three antibiotic courses, a strong decline in alpha diversity in the gut microbiome was seen after amoxicillin treatment but not after tylosin, with a bloom of Akkermansia muciniphila observed after both antibiotics.4 Escherichia coli abundance increased in pig gut microbiota following exposure to a mixture of chlortetracycline, sulfamethazine, and penicillin.21 Likewise, E. coli bloomed in rats following metronidazole treatment and in combination with Salmonella in mice treated with streptomycin. Indeed, a transient bloom in Enterobacteriaceae may be a general event in the mammalian gut microbiome after antibiotic treatment.5 This may be driven by host inflammation, resulting in an increase in nitrate and other electron acceptors, favoring the metabolism of Enterobacteriaceae.22,23 While the bloom in the gut may be driven by higher levels of oxidative species,24 the bloom on the fish skin may not be, as unlike the mammalian gut, the skin is not normally dominated by obligate anaerobes. Other non-antibiotic disturbances can lead to domination as well, with E. coli blooms in mice after surgery and in cattle after short-term starvation. In our laboratory, when fish were exposed to RIF for 7 days, the genus Myroides temporarily dominated the skin microbiome.7 Furthermore, fish with microbiomes altered by 3-day RIF treatment exhibited negative side effects, including pathogen susceptibility.8,25 Higher susceptibility to Aeromonas hydrophila was observed in zebrafish with long-term (6 weeks) antibiotic treatment.6 Whether the Aeromonadaceae OTU we observed is pathogenic to fish is not yet determined. Given the lack of fish death in the rinse recovery period of 8 days despite the very high levels of this OTU, pathogenicity seems to be unlikely. Our simple and tractable fish skin microbiome model may prove useful in discovering factors that correlate with the bloom, particularly ones beyond oxidative compounds, and ultimately what determines which particular organism overgrows. In the murine gut microbiome, which organisms emerge in abundance after antibiotic treatment may depend on the initial microbiome composition.26
The drop in diversity following rinsing (2-day rinsing has less than half the richness of PT, Table 12) is not surprising, as lowering of diversity is common in antibiotic treatments in experimental animals and humans. This accompanies the bloom mentioned earlier. Whether the bloom causes the low diversity or vice versa is yet to be determined. The composition of the fish microbiome community changes from the PT membership (as shown by the beta diversity score of 13 in the first 10-hour recovery sample), and then stays fairly constant in its distance from the original composition, ending at 8 days only sharing nine of the 20 most dominant OTUs. In contrast to the biochemical activity profiles, which are consistent (80% or higher) across the recovery time points, the abundances of OTUs in the skin communities across time points fluctuate greatly. For example, comparing all 9 recovery samples, the SD for each of the 10 most abundant OTUs is larger than the mean abundance in 8 of those 10 and in the 20 most abundant, the SD is larger in 13 of 20. By the end of the recovery period (8 days), the community has not returned to the original PT composition. While the alpha diversity (59 OTUs) after 8 days of recovery has returned to the same as the PT level, the community is less even, as shown by higher top 10 and top 20 values (Table 12). Viewing composition at the family level using Venn diagrams visualizes these changes; the diversity loss after rinsing shown by four families unique to the PT community (Figure 6A), the return of diversity which is mostly complete by day 6, as new families are not gained on days 7 or 8 (Figure 6B), and differences that remain late in recovery from the PT composition (Figure 6C).
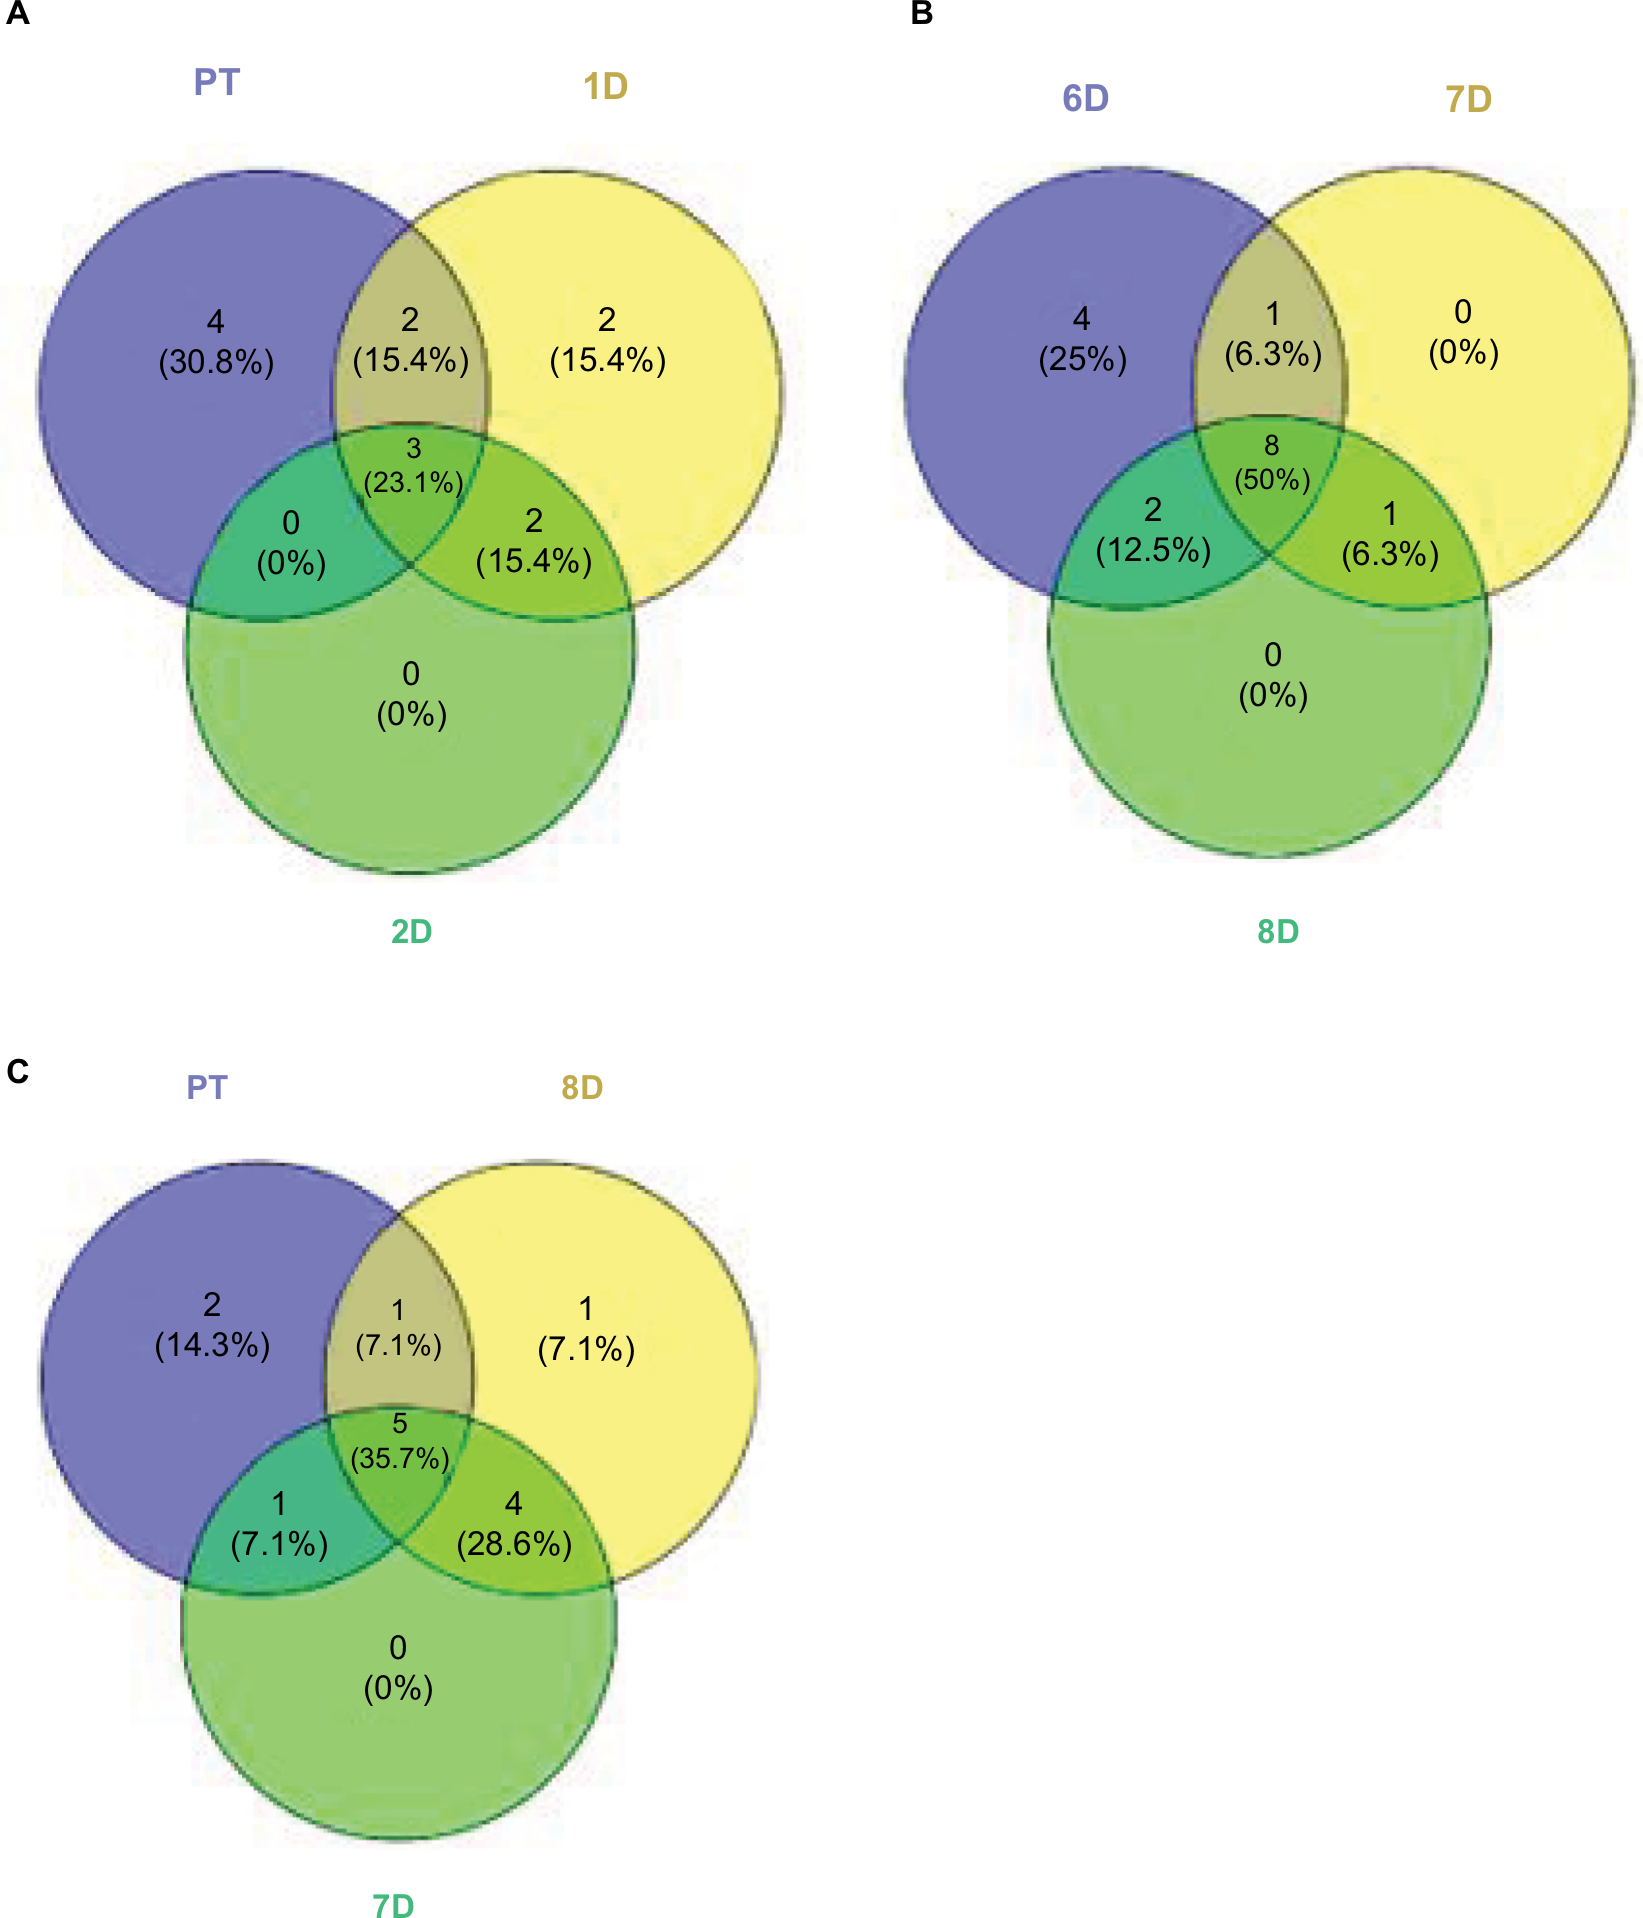 | Figure 6 Venn diagrams comparing community compositions during rinse recovery (A–C). Notes: Numbers represent bacterial families. PT is pre-treatment community. Other communities are days of recovery. |
Twenty-two rare (all <0.4% each in abundance) OTUs present (all 22 together total 2.2% cumulative abundance of the community) in the PT microbiome were lost during recovery (not present in recovery communities). Furthermore, Polynucleobacter was 13.6% of the PT community, but was lacking from all but two of the recovery communities, including the last 8-day point. This was the only dominant (≥1%) member that was lost following the disruption. Polynucleobacter is common across freshwater habitats.27 Some species are obligate symbionts of protozoa,28 whereas the free-living strains have low metabolic flexibility, which may explain the loss of this OTU in the disrupted microbiome environment. Despite this loss of taxa, the total number of taxa detected in the 8-day community was the same as the PT community, namely 59 OTUs. Thirty-five taxa that were not present in the PT sample appeared in at least one of the recovery communities and can therefore be considered invading organisms after the disruption. All but 10 of those 35 invasive taxa were Proteobacteria. Of the 35, 20 were present in the 8-day sample, with 8 of those taxa being above 0.1% abundance and 2 being above 1%. The most prominent invader, in the GMD14H09 order (a Delta Proteobacteria), was 6.8% of the 8-day microbiome (fifth most abundant OTU). The second most prominent was in the Chitinophagaceae family (phylum Bacteroidetes) and was 2.3% in the 8-day sample. GMD refers to agarose gel microdroplets, an innovative method used to culture bacteria from the Sargasso Sea.29 No further identification or functional information was given for this organism.
One group clearly gained the most in abundance during recovery after the rinse. Seven OTUs in the family Comamonadaceae together represented 18.2% abundance of the PT microbiome yet grew to 49.2% abundance of the 8-day microbiome. The strongest gain in that group was with Limnobacter (0.03% in PT and 13.3% in 8-day microbiome), with Azohydromonas being an invader (not present in PT, 0.38% in 8-day microbiome). It is possible that recovery conditions following the rinse somehow favored the Comamonadaceae. One other OTU gained in abundance during recovery, the genus Runella (0.14% in PT, peaking at 15.2% in 8-day microbiome, with a mean of 8.0% across all recovery communities). The type strain of this psychrotolerant genus from the phylum Bacteroidetes has been gnomically sequenced, with many isolations of this genus from freshwater aquatic ecosystems.30 The large (6.9 Mbp) genome suggests metabolic diversity, which may lead to an advantage after disruption conditions in the microbiome.
Comparing composition of the microbiome communities with non-metric multidimensional scaling (Figure 7) supports the idea that rinsing is a strong disruption, as the 0.42-day, 1-day, and 2-day communities are most divergent from the PT in composition. The compositions across the 2- to 8-day recovery communities show a trend, but not back toward the PT composition, instead toward a possible alternative stable state.
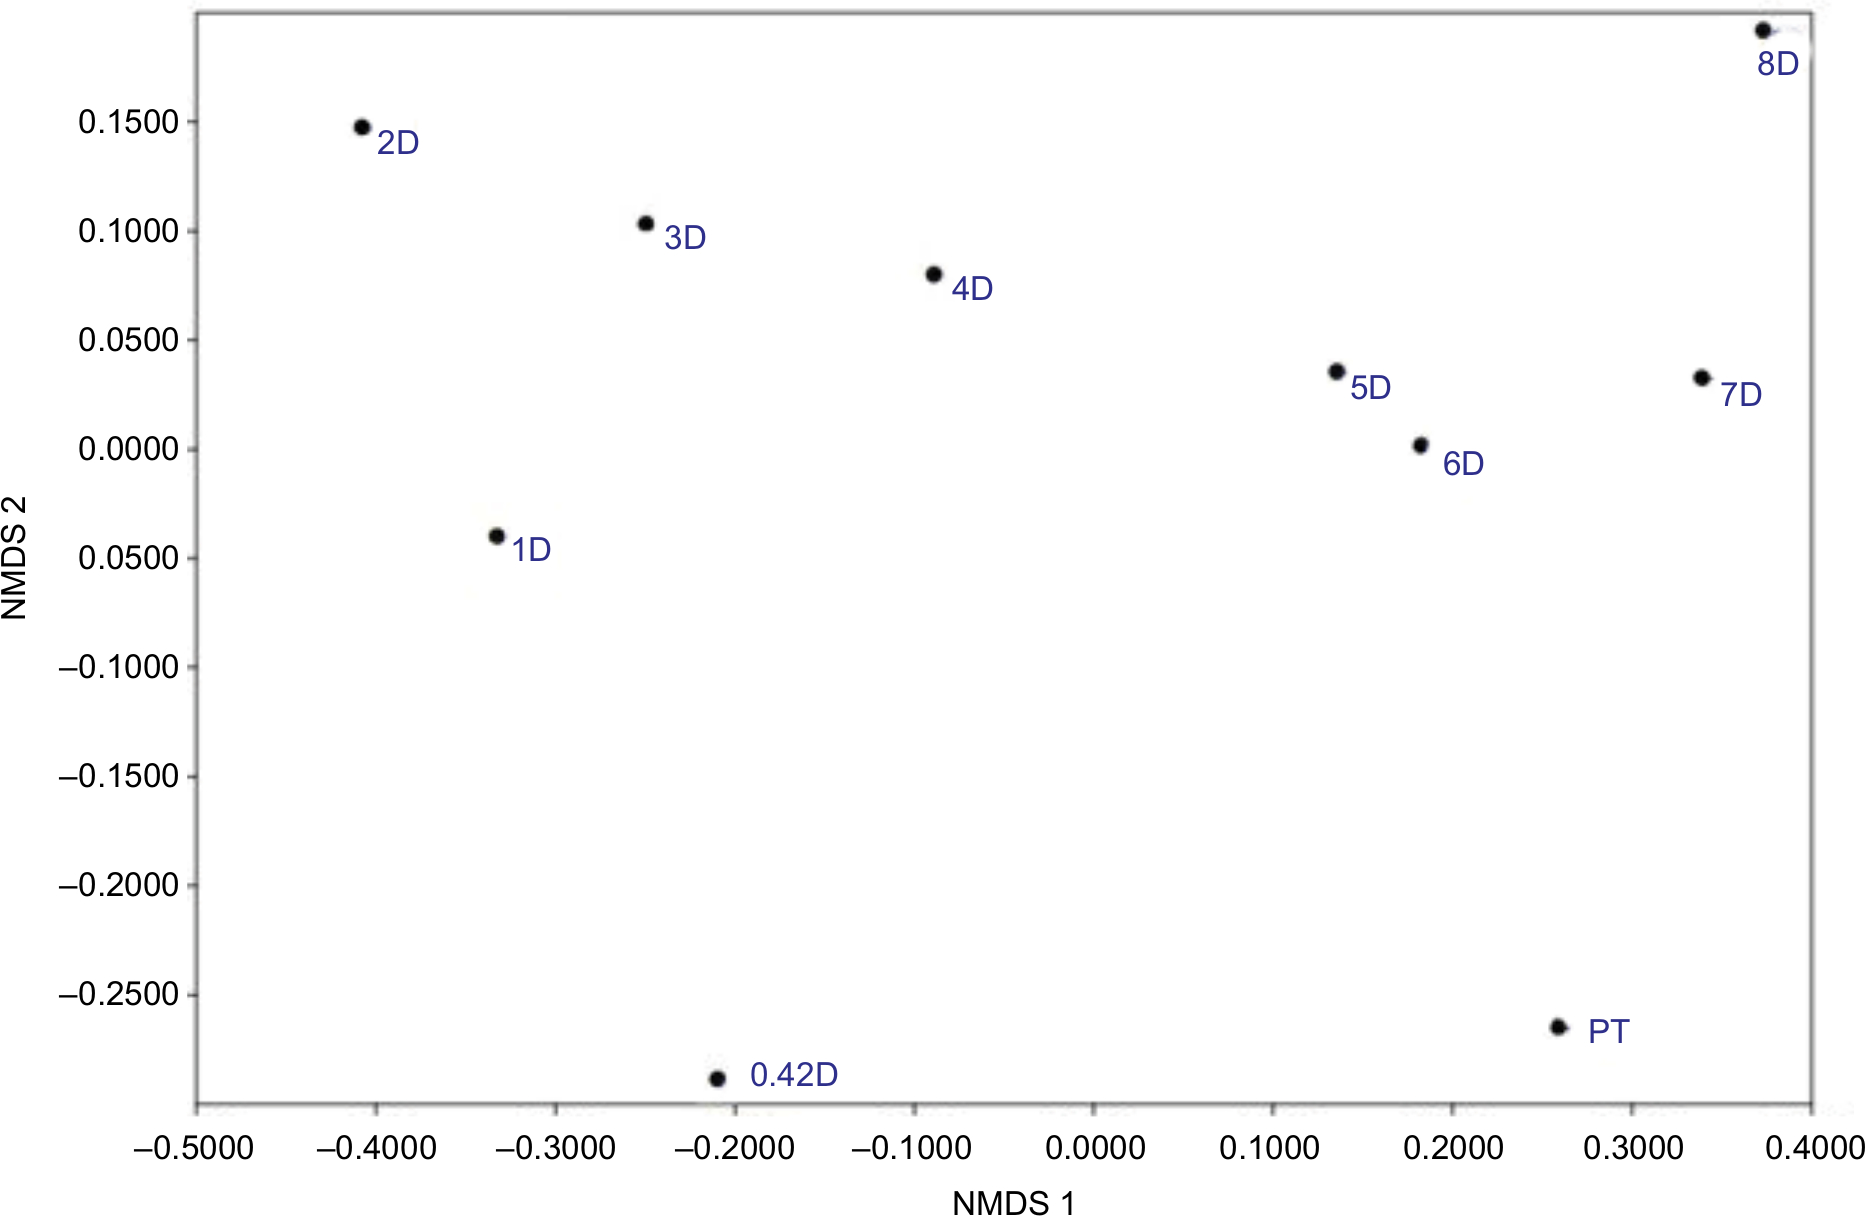 | Figure 7 NMDS comparing community compositions during rinse recovery. Notes: NMDS is non-metric multidimensional scaling, performed by the PAST program, version 3.21.33 PT is pre-treatment, and all communities represented by a number with D are days of recovery. |
Conclusion
A major conclusion from this study is that after the rinsing disruption, while community composition changes and does not return, biochemical functions of community members appear to return to a PT pattern. This finding relates to data from the Human Microbiome Project that while community composition varies widely at one site (for example, the tongue) between healthy humans, the presence of genes in metabolic pathways is very similar (Figure 2).31 This supports the concept that metabolic function drives microbiome community structure, not taxonomy of members.
Disclosure
The authors report no conflicts of interest in this work.
References
Dethlefsen L, Relman DA, Dethlefsen L, Relman DA. Incomplete recovery and individualized responses of the human distal gut microbiota to repeated antibiotic perturbation. Proc Natl Acad Sci U S A. 2011;108(Suppl 1):4554–4561. | ||
Rashid MU, Zaura E, Buijs MJ, et al. Determining the long-term effect of antibiotic administration on the human normal intestinal microbiota using culture and pyrosequencing methods. Clin Infect Dis. 2015;60 (Suppl 2):S77–S84. | ||
Zaura E, Brandt BW, Teixeira de Mattos MJ, et al. Same exposure but two radically different responses to antibiotics: resilience of the salivary microbiome versus long-term microbial shifts in feces. MBio. 2015;6(6):e01693–15. | ||
Nobel YR, Cox LM, Kirigin FF, et al. Metabolic and metagenomic outcomes from early-life pulsed antibiotic treatment. Nat Commun. 2015;6(1):7486. | ||
Reese AT, Cho EH, Klitzman B, et al. Antibiotic-induced changes in the microbiota disrupt redox dynamics in the gut. Elife. 2018;7:e35987. | ||
Zhou L, Limbu SM, Qiao F, du ZY, Zhang M. Influence of long-term feeding antibiotics on the gut health of zebrafish. Zebrafish. 2018;15(4):340–348. | ||
Carlson JM, Leonard AB, Hyde ER, Petrosino JF, Primm TP. Microbiome disruption and recovery in the fish Gambusia affinis following exposure to broad-spectrum antibiotic. Infect Drug Resist. 2017;10:143–154. | ||
Carlson JM, Hyde ER, Petrosino JF, Manage ABW, Primm TP. The host effects of Gambusia affinis with an antibiotic-disrupted microbiome. Comp Biochem Physiol C: Toxicol Pharmacol. 2015;178:163–168. | ||
Pyke GH. A review of the biology of Gambusia affinis and G. holbrooki. Rev Fish Biol Fish. 2005;15(4):339–365. | ||
Blaylock BG, Mitchell TJ. The effect of temperature on the dose response of Gambusia affinis affinis from two natural populations. Radiat Res. 1969;40(3):503–511. | ||
Ouwehand AC, Gråsten S, Niemi P, Mykkänen H, Salminen S. Wheat or rye supplemented diets do not affect faecal mucus concentration or the adhesion of probiotic micro-organisms to faecal mucus. Lett Appl Microbiol. 2000;31(1):30–33. | ||
Jones SE, Shade AL, McMahon KD, Kent AD. Comparison of primer sets for use in automated ribosomal intergenic spacer analysis of aquatic bacterial communities: an ecological perspective. Appl Environ Microbiol. 2007;73(2):659–662. | ||
Versalovic J, Koeuth T, Lupski JR. Distribution of repetitive DNA sequences in eubacteria and application to fingerprinting of bacterial genomes. Nucleic Acids Res. 1991;19(24):6823–6831. | ||
Chen L, Tai WC, Brar MS, Leung FC, Hsiao WL. Tumor grafting induces changes of gut microbiota in athymic nude mice in the presence and absence of medicinal Gynostemma saponins. PLoS One. 2015;10(5):e0126807. | ||
Dash HR, das S, Diversity DS. Diversity, community structure, and bioremediation potential of mercury-resistant marine bacteria of estuarine and coastal environments of Odisha, India. Environ Sci Pollut Res Int. 2016;23(7):6960–6971. | ||
Caporaso JG, Kuczynski J, Stombaugh J, et al. QIIME allows analysis of high-throughput community sequencing data. Nat Methods. 2010;7(5):335–336. | ||
Edgar RC. Search and clustering orders of magnitude faster than BLAST. Bioinformatics. 2010;26(19):2460–2461. | ||
Desantis TZ, Hugenholtz P, Larsen N, et al. Greengenes, a chimera-checked 16S rRNA gene database and workbench compatible with ARB. Appl Environ Microbiol. 2006;72(7):5069–5072. | ||
Haas BJ, Gevers D, Earl AM, et al. Chimeric 16S rRNA sequence formation and detection in Sanger and 454-pyrosequenced PCR amplicons. Genome Res. 2011;21(3):494–504. | ||
Larsen A, Tao Z, Bullard SA, Arias CR. Diversity of the skin microbiota of fishes: evidence for host species specificity. FEMS Microbiol Ecol. 2013;85(3):483–494. | ||
Looft T, Allen HK. Collateral effects of antibiotics on mammalian gut microbiomes. Gut Microbes. 2012;3(5):463–467. | ||
Hughes ER, Winter MG, Duerkop BA, et al. Microbial respiration and formate oxidation as metabolic signatures of inflammation-associated dysbiosis. Cell Host Microbe. 2017;21(2):208–219. | ||
Winter SE, Bäumler AJ. Why related bacterial species bloom simultaneously in the gut: principles underlying the ‘Like will to like’ concept. Cell Microbiol. 2014;16(2):179–184. | ||
Litvak Y, Byndloss MX, Tsolis RM, Bäumler AJ. Dysbiotic Proteobacteria expansion: a microbial signature of epithelial dysfunction. Curr Opin Microbiol. 2017;39:1–6. | ||
Carlson JM, Chavez O, Aggarwal S, Primm TP. Examination of host phenotypes in Gambusia affinis following antibiotic treatment. J Vis Exp. 2017;(120):e55170. | ||
Ju T, Shoblak Y, Gao Y, et al. Initial gut microbial composition as a key factor driving host response to antibiotic treatment, as exemplified by the presence or absence of commensal Escherichia coli. Appl Environ Microbiol. 2017;83(17):e01107–e01117. | ||
Jezberová J, Jezbera J, Brandt U, Lindström ES, Langenheder S, Hahn MW. Ubiquity of Polynucleobacter necessarius ssp. asymbioticus in lentic freshwater habitats of a heterogeneous 2000 km area. Environ Microbiol. 2010;12(3):658–669. | ||
Boscaro V, Felletti M, Vannini C, et al. Polynucleobacter necessarius, a model for genome reduction in both free-living and symbiotic bacteria. Proc Natl Acad Sci U S A. 2013;110(46):18590–18595. | ||
Zengler K, Toledo G, Rappe M, et al. Cultivating the uncultured. Proc Natl Acad Sci U S A. 2002;99:15681–15686. | ||
Copeland A, Zhang X, Misra M, et al. Complete genome sequence of the aquatic bacterium Runella slithyformis type strain (LSU 4(T)). Stand Genomic Sci. 2012;6(2):145–154. | ||
Human Microbiome Project Consortium. Structure, function and diversity of the healthy human microbiome. Nature. 2012;486(7402):207–214. | ||
Church D, Melnyk E, Unger B. Quantitative Gram stain interpretation criteria used by microbiology laboratories in Alberta, Canada. J Clin Microbiol. 2000;38(11):4266–4268. | ||
Hammer O, Harper DAT, Ryan PD. PAST: paleontological statistics software package for education and data analysis. Palaeontologia Electronica. 2001;4:9. |
 © 2019 The Author(s). This work is published and licensed by Dove Medical Press Limited. The
full terms of this license are available at https://www.dovepress.com/terms
and incorporate the Creative Commons Attribution
- Non Commercial (unported, 3.0) License.
By accessing the work you hereby accept the Terms. Non-commercial uses of the work are permitted
without any further permission from Dove Medical Press Limited, provided the work is properly
attributed. For permission for commercial use of this work, please see paragraphs 4.2 and 5 of our Terms.
© 2019 The Author(s). This work is published and licensed by Dove Medical Press Limited. The
full terms of this license are available at https://www.dovepress.com/terms
and incorporate the Creative Commons Attribution
- Non Commercial (unported, 3.0) License.
By accessing the work you hereby accept the Terms. Non-commercial uses of the work are permitted
without any further permission from Dove Medical Press Limited, provided the work is properly
attributed. For permission for commercial use of this work, please see paragraphs 4.2 and 5 of our Terms.