Back to Archived Journals » Advances and Applications in Bioinformatics and Chemistry » Volume 15
Binding Analysis Using Accelerated Molecular Dynamics Simulations and Future Perspectives
Authors Pawnikar S, Bhattarai A, Wang J ![]() , Miao Y
, Miao Y
Received 29 December 2020
Accepted for publication 20 February 2021
Published 6 January 2022 Volume 2022:15 Pages 1—19
DOI https://doi.org/10.2147/AABC.S247950
Checked for plagiarism Yes
Review by Single anonymous peer review
Peer reviewer comments 3
Editor who approved publication: Dr Juan Fernandez-Recio
Shristi Pawnikar, Apurba Bhattarai, Jinan Wang, Yinglong Miao
Center for Computational Biology and Department of Molecular Biosciences, University of Kansas, Lawrence, KS, 66047, USA
Correspondence: Yinglong Miao
Center for Computational Biology, University of Kansas, 2030 Becker Drive, Room 200D MRB, Lawrence, KS, 66047, USA
Email [email protected]
Abstract: Biomolecular recognition such as binding of small molecules, nucleic acids, peptides and proteins to their target receptors plays key roles in cellular function and has been targeted for therapeutic drug design. Molecular dynamics (MD) is a computational approach to analyze these binding processes at an atomistic level, which provides valuable understandings of the mechanisms of biomolecular recognition. However, the rather slow biomolecular binding events often present challenges for conventional MD (cMD), due to limited simulation timescales (typically over hundreds of nanoseconds to tens of microseconds). In this regard, enhanced sampling methods, particularly accelerated MD (aMD), have proven useful to bridge the gap and enable all-atom simulations of biomolecular binding events. Here, we will review the recent method developments of Gaussian aMD (GaMD), ligand GaMD (LiGaMD) and peptide GaMD (Pep-GaMD), which have greatly expanded our capabilities to simulate biomolecular binding processes. Spontaneous binding of various biomolecules to their receptors has been successfully simulated by GaMD. Microsecond LiGaMD and Pep-GaMD simulations have captured repetitive binding and dissociation of small-molecule ligands and highly flexible peptides, and thus enabled ligand/peptide binding thermodynamics and kinetics calculations. We will also present relevant application studies in simulations of important drug targets and future perspectives for rational computer-aided drug design.
Keywords: biomolecular recognition, accelerated molecular dynamics, thermodynamics, kinetics, drug design
Introduction
Cellular functions such as gene translation, protein folding, ligand binding and signaling often require conformational transitions of biological macromolecules such as proteins, nucleic acids and lipids into various low-energy states.1–4 Free energy landscapes of biomolecules essentially determine their structure, dynamics and functions.5,6 It is important to comprehend the dynamic nature of biomolecules. Experimental techniques including nuclear magnetic resonance (NMR), X-ray crystallography and cryo-electron microscopy (cryo-EM) have greatly advanced structural characterizations of the biomolecular binding processes, but these efforts are time-consuming and very expensive. Moreover, these techniques often provide a rather static picture of the biomolecular interactions and conformations, whereas biomolecules are dynamic in vivo to perform the necessary cellular functions. It remains challenging and critical for us to understand the mechanisms, thermodynamics and kinetics of biomolecular recognition.
Molecular dynamics (MD) is a powerful “computational microscope” that helps us to visualize atomistic time evolution of biomolecules.7 Remarkable advances have been made in computing hardware (eg, Anton supercomputers and GPUs) and algorithm developments over the past several decades for running longer and cheaper MD simulations.8–12 With microsecond-timescale conventional MD (cMD) simulations, spontaneous ligand/drug binding was successfully captured to the Src protein kinase,13 the β1- and β2-adrenergic receptors (β1AR and β1AR)14 and the M2 and M3 muscarinic receptors15 by the DE Shaw Research Group using the Anton supercomputer, for which the simulation predicted ligand binding poses closely matched those determined in the X-ray crystal structures. Moreover, hundreds-of-nanosecond cMD simulations were combined in Markov State Models to characterize the benzamidine ligand binding to the trypsin model protein by the De Fabritiis group.16
In addition, microsecond-timescale cMD simulations have been successful to capture peptide binding in several peptide-protein complexes, including proline-rich motif (PRM)-SH3,17 BAD-BclXL and p53-MDM2.18 The “folding-upon-binding” mechanism of peptides was investigated using a measles virus nucleoprotein fragment and X domain of its phosphoprotein complex.19 Anton supercomputer was used to run ~200 μs MD simulations at 400 K elevated temperature. The simulations could capture 70 binding and unbinding events of the peptide fragment to the protein domain. Therefore, cMD has been successful to capture binding of ligands and peptides on the microsecond timescales. However, cMD with limited simulation timescales still lacks the power to study slower biological processes that would occur over longer timescales (eg, milliseconds and beyond).15
Metadynamics,20,21 umbrella sampling,22,23 adaptive biasing force (ABF) calculations24,25 and conformational flooding26,27 represent more advanced simulation methods for enhanced sampling of biomolecules developed over the past few decades. Metadynamics, in particular, has enabled investigating ligand binding to receptors in terms of the kinetic rates of binding and unbinding, residence time28,29 and binding free energies.30–33 The binding rate constant of peptide p53 to MDM2 protein predicted by ~120 μs weighted ensemble simulations was in good agreement with the experimentally calculated values.34 Enhanced sampling implemented with a combination of long microsecond cMD and Hamiltonian replica exchange method could simulate rare events such as binding and unbinding of the PMI peptide inhibitor-MDM2 oncoprotein fragment complex35 and the resulting kinetic rates agreed well with experiments.35 Moreover, infrequent metadynamics could predict peptide association and dissociation rates of the p53-MDM2 peptide-protein complex, whereas, bias-exchange metadynamics could calculate binding free energy of the same system with 27 μs simulations.36 Although these methods have shown remarkable improvements in sampling and capturing rare events that happen over exceedingly long timescales, they often pose a limitation for the requirement of predefined reaction coordinates and collective variables (CVs).27,37,38
To address the above limitations, more enhanced sampling methods that do not require CVs have been developed,39 including replica exchange MD,40,41 self-guided MD,42–45 and accelerated MD (aMD),46–55 etc. In particular, aMD adds a boost potential ΔV to smooth the system potential energy surface to sample biomolecular transitions across reduced energy barriers.55,56 The aMD simulations have been successful in capturing spontaneous ligand binding to a muscarinic G-protein-coupled receptor (GPCR).57 However, aMD poses a drawback of large energetic noise during reweighting because of very high boost potential that is normally on the order of tens to hundreds of kcal/mol.58 Recovering the original free energy landscapes represents a major limitation of aMD simulations.57,59,60 To address this issue, Gaussian aMD (GaMD)61,62 has been developed using a harmonic function to construct the boost potential that exhibits a Gaussian distribution. Through cumulant expansion to the second order, accurate reweighting can be achieved from GaMD simulations.63 Without the need of predefined CVs, GaMD provides “unconstrained” enhanced sampling and can be easier to use for simulations of complex biomolecules than CV-based enhanced sampling methods. GaMD has been also shown to clearly identify distinct low-energy intermediate states during large protein conformational changes, ligand binding and protein–protein interactions. These intermediate states may not be sufficiently sampled in the CV-biasing simulation methods. On the other hand, relatively longer GaMD simulations could be needed in order to achieve sufficient sampling. Nevertheless, hundreds-of-nanosecond to microsecond timescale GaMD simulations have been successfully applied to sample large conformational changes of various biomolecules, including fast-folding proteins,61,62,64 the CRISPR-Cas9 gene-editing system,65,66 GPCRs,62,67–71 protein kinases,72,73 ligand binding61,62,67–71,74,75 and protein-protein/membrane/nucleic acid interactions.66,76–80
The principles of GaMD and notably applications in understanding drug binding pathways were reviewed recently.74,81 Here, we will review recent method developments of GaMD, Ligand GaMD (LiGaMD)82 and Peptide GaMD (Pep-GaMD),83 which have greatly expanded our capabilities to simulate biomolecular binding processes. More recently, spontaneous binding of various biomolecules to their receptors such as drug binding to membrane proteins like chemokine GPCRs,71 human angiotensin-converting enzyme 2 (ACE2),84 and RNA-protein binding85,86 has been demonstrated by GaMD simulations. Furthermore, microsecond LiGaMD and Pep-GaMD simulations were able to simulate repetitive binding and dissociation of small-molecule ligands82 and highly flexible peptides,83 and thus enabled ligand/peptide binding thermodynamics and kinetics calculations. We will also present relevant application studies in simulations of important drug targets and future perspectives for rational computer-aided drug design.
Materials and Methods
Gaussian Accelerated Molecular Dynamics (GaMD)
GaMD is an unconstrained enhanced sampling technique that reduces the system energy barriers by adding a harmonic boost potential to the system potential energy terms.61 The added boost potential smooths the system potential energy surface and allows biomolecules to sample large conformational space. The method is briefly illustrated here. For a system with N atoms at positions  , when the system potential
  is lower than a threshold energy E, a boost potential is added as:
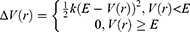
where k is the harmonic force constant. The two adjustable parameters E and k are automatically determined based on three enhanced sampling principles.61 The reference energy needs to be set in the following range:
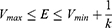
where Vmax and Vmin are the system minimum and maximum potential energies. To ensure that Eqn. (2) is valid, k has to satisfy:  Let us define
  , then
  . The standard deviation of
  needs to be small enough (ie, narrow distribution) to ensure proper energetic reweighting:63
 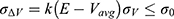 where
where  and
and  are the average and standard deviation of the system potential energies,
  is the standard deviation of
  with
with  as a user-specified upper limit (eg, 10kBT) for proper reweighting. When E is set to the lower bound E=Vmax,
  can be calculated as:
Alternatively, when the threshold energy E is set to its upper bound  ,
,  is set to:
if  is found to be between 0 and 1. Otherwise,
  is calculated using Eqn. (3).
Like aMD, GaMD also provides options to add only the total potential boost, only dihedral potential boost, or the dual potential boost. The dual-boost GaMD (GaMD_Dual) simulation generally provides higher acceleration than the other two types of simulations for enhanced sampling.56 The simulation parameters comprise of the threshold energy values and the effective harmonic force constants for the total and dihedral potential boost, respectively.
Energetic Reweighting of GaMD for Free Energy Calculations
For energetic reweighting to calculate the potential of mean force (PMF), the probability distribution along a reaction coordinate is written as  . Given the boost potential
  of each frame,
  can be reweighted to recover the canonical ensemble distribution,
  , as:
, as:
where M is the number of bins,  and
and  is the ensemble-averaged Boltzmann factor of
  for simulation frames found in the jth bin. The ensemble-averaged reweighting factor can be approximated using cumulant expansion:
where the first two cumulants are given by:
The boost potential obtained from GaMD simulations usually follows near-Gaussian distribution.74 Cumulant expansion to the second order thus provides a good approximation for computing the reweighting factor.61,63 The reweighted free energy  is calculated as:
where  is the modified free energy obtained from GaMD simulation and
  is a constant. A free Python scripts toolkit “PyReweighting”63 is developed and distributed at http://miao.compbio.ku.edu/PyReweighting/.
Ligand Gaussian Accelerated Molecular Dynamics (LiGaMD)
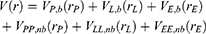
LiGaMD is developed based on GaMD61 and efficiently sample ligand binding and unbinding by selectively boosting non-bonded interaction potential energy between the ligand-receptor and ligand/environment. A detailed description of the method has been provided in the previous LiGaMD report.82 A brief summary is provided below. Let us assume a system containing protein P with ligand L and a biological environment E. The system has N atoms with their coordinates  and momenta
  . The system Hamiltonian can be expressed as:

where  and
and  are the system kinetic and total potential energies, respectively. Now, the potential energy can be expressed as:
where  ,
,  and represent the bonded potential energies in protein P, ligand L and environment E, respectively.
  ,
,  and
and  are the self non-bonded potential energies in protein P, ligand L and environment E, respectively.
  ,
,  and
and  represent the non-bonded interaction energies between P-L, P-E and L-E, respectively. As we know, in the classical molecular mechanics force fields,87–90 the non-bonded potential energies are usually calculated as:

Where  and
and  represent the system electrostatic and van der Waals potential energies. Let us assume, while the ligand binds to the receptor, it mainly involves the non-bonded interaction energies,
  . In accordance with the previous GaMD algorithm, we will add boost potential to the essential ligand non-bonded potential energy in the LiGaMD method:
where kL,nb represents the harmonic constant and EL,nb represents the threshold energy for applying boost potential. These parameters can be based on three enhanced sampling principles as described in GaMD.61
Next, one can add multiple ligand molecules in the solvent to facilitate ligand binding to proteins in MD simulations.14,70 This is based on the fact that the ligand-binding rate constant kon is inversely proportional to the ligand concentration. The higher the ligand concentration, the faster the ligand binds, provided that the ligand concentration is still within its solubility limit. In addition to selectively boosting the bound ligand, another boost potential could thus be applied on the unbound ligand molecules, protein and solvent to facilitate both ligand dissociation and rebinding. The second boost potential is calculated using the total system potential energy other than the non-bonded potential energy of the bound ligand in Eqn. (10) as:
where ED and kD are the corresponding threshold energy for applying the second boost potential and the harmonic constant, respectively. This leads to dual-boost LiGaMD (LiGaMD_Dual) with the total boost potential  .
.
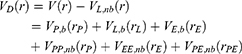
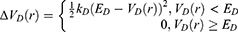
Peptide Gaussian Accelerated Molecular Dynamics (Pep-GaMD)
Peptides often undergo large conformational changes during binding to target proteins, being distinct from small-molecule ligand binding or protein–protein interactions (PPIs). Another algorithm called peptide GaMD or “Pep-GaMD” has been developed to enhance sampling of peptide binding.83 In Pep-GaMD, we consider a system of peptide L binding to a protein P in a biological environment E. We decompose the potential energy into similar terms as in Eqn. (10). Presumably, peptide binding mainly involves in both the bonded and non-bonded interaction energies of the peptide since peptides often undergo large conformational changes during binding to the target proteins. Thus, the essential peptide potential energy is  In Pep-GaMD, we add boost potential selectively to the essential peptide potential energy according to the GaMD algorithm:
where EL is the threshold energy for applying boost potential and kL is the harmonic constant. The Pep-GaMD simulation parameters are derived similarly as in GaMD.
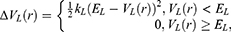
A second boost is added to the interaction between the protein and the environment/solvent to accelerate the peptide binding, along with the selective boost added to the peptide. This boost represents the total system potential energy without the essential peptide potential energy included:
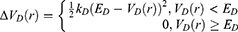
Where VD represents the total system potential energy without the essential peptide potential energy included, ED represents the second boost potential threshold energy and kD represents the harmonic constant. Hence, this contributes to the dual-boost Pep-GaMD as the total boost potential  .
.
Applications
Mechanism of Drug Binding to Chemokine Receptor
Chemokine receptors are key GPCRs with involvement in many biological functions including immune cell response, growth and development of bodily structure like cardiac tissues and central nervous system, and several cancers.91,92 In particular, CXCR4 facilitates the entry of HIV into host immune cells.93–95 Plerixafor (PLX) was discovered as the first selective small-molecule inhibitor of CXCR4 (Mozobil®, AMD3100), however, is suggested to have multiple binding modes to CXCR4.96–98 Here, GaMD simulations were performed to study the pathway and binding mechanism of the PLX drug to the CXCR4 receptor.71
The X-ray structure of CXCR4 (PDB: 3ODU) with the highest resolution (2.5 Å) was used to build the simulation system. The conformation of PLX with positively charged N1, N3, N4 and N7 of the bicyclam rings at physiological pH was also added to the system. GaMD simulations were performed for ligand in both unbound and bound state with ten ligand molecules >15 Å away from CXCR4 (Figure 1A), and with the lowest energy bound conformation of PLX obtained from rigid-body docking using Autodock.99 GaMD_Dual_NB boost scheme was used in which system nonbonded and dihedral energy terms were boosted. GaMD_Dual_NB was applied to five independent 800–1000 ns GaMD production runs to capture PLX drug binding to CXCR4 from an unbound state.
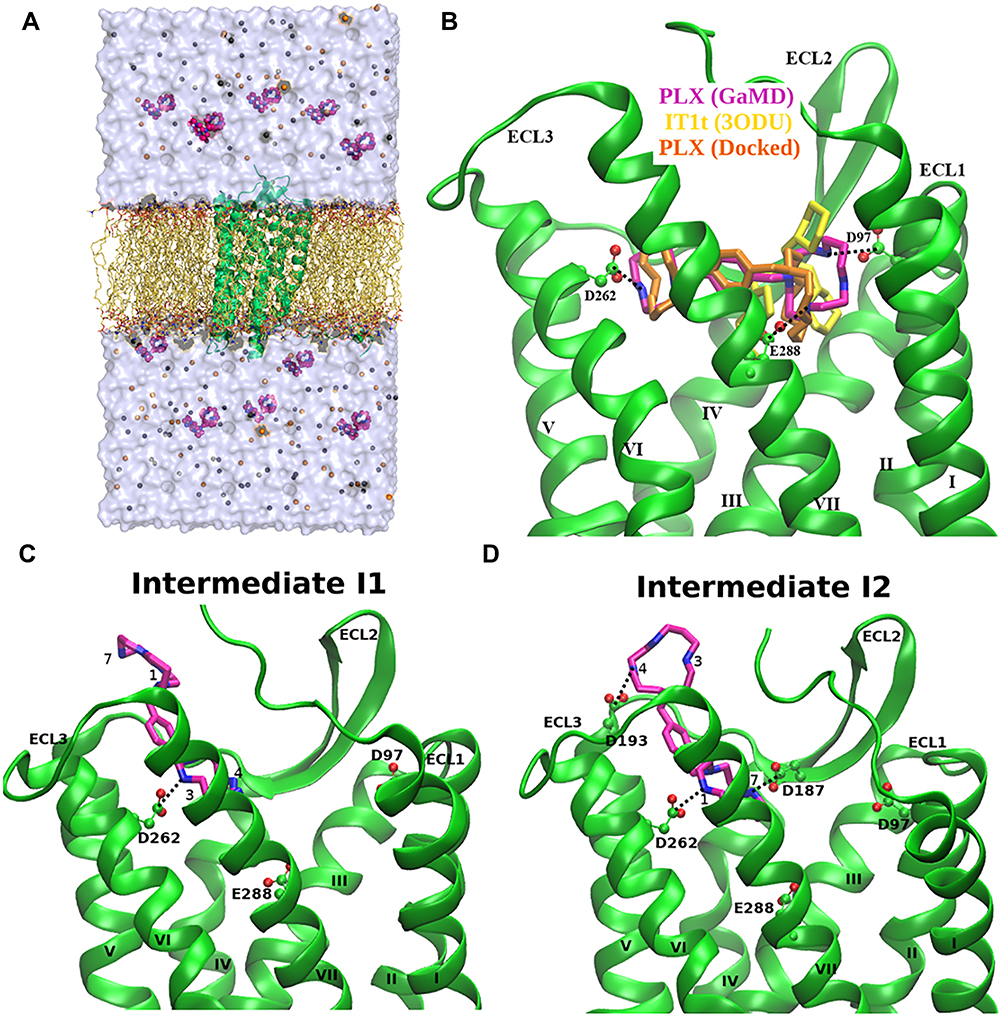 |
Figure 1 (A) Computational representation of the CXCR4 receptor (green ribbons) with 10 PLX drug molecules (magenta spheres) placed away in the solvent used in the simulation. The receptor was placed in a POPC lipid bilayer (sticks) and solvated in 0.15 M NaCl aqueous solution. (B) GaMD predicted binding pose of PLX (magenta sticks) at the orthosteric site of CXCR4 (green ribbons) with their interacting residues labeled and highlighted in green ball and sticks. Antagonist IT1t (yellow) and docking conformation of PLX (orange) are shown for reference. The seven transmembrane helices I–VII and three extracellular loops (ECL) 1–3 are labeled in the CXCR4 receptor; (C) Intermediate I1 state with interacting residues highlighted in green sticks, including D187ECL2 and D2626.58 that formed ionic interactions with PLX atoms N4 and N3, respectively; (D) Intermediate I2 state with interacting residues highlighted in green sticks, including D187ECL2, D1935.32 and D2626.58 that formed salt bridges with positively charged N7, N4 and N1 of PLX, respectively. |
The PLX bound simulations showed stable binding of PLX in the CXCR4 orthosteric site. The simulations were used for hierarchical agglomerative clustering to obtain five clusters; the top-ranked cluster was selected as a reference, termed the “bound state”. Spontaneous binding of PLX was captured to the orthosteric site of the receptor during one of the five replicas. Complete binding of PLX was observed at ~480 ns with minimum RMSD of 2.76 Å relative to the X-ray structure of CXCR4 (PDB: 3ODU). The positively charged PLX formed stable salt bridge interactions with residues Asp972.63, Asp2626.58 and Glu2887.39 occupying both major and minor sub-pockets of the receptor (Figure 1B). Other simulations revealed important drug–receptor interactions significant in the recognition and binding of PLX to the CXCR4 receptor.
Free energy profiles of PLX binding to the CXCR4 receptor were calculated using the PLX RMSD and the distance between the PLX and the receptor as reaction coordinates of all five GaMD_Dual_NB simulations combined. The 2D PMF profile helped identify four low-energy conformational states of PLX including “Bound (B)”, “Intermediate 1 (I1)”, “Intermediate 2 (I2)” and “Unbound (U)”. In the I1 and I2 state, polar residues in the ECL2-TM5-TM6 region of the CXCR4, namely, D187ECL2, D1935.32 and D2626.58 formed favourable interactions with the nitrogen atoms of PLX which are positively charged (Figure 1C and D). A single novel intermediate drug binding site was identified in the CXCR4 as the two intermediate states shared the common key residues including D187ECL2, D1935.32 and D2626.58 because the symmetric ligand flips its conformation at the same site of the receptor in the ECL2-TM5-TM6. GaMD simulations also identified PLX drug binding pathway to the CXCR4. Starting from diffusion in the solvent, PLX binds to an intermediate site between ECL2-TM5-TM6 and then the final orthosteric site. This study reveals a novel allosteric site that is expected to facilitate drug design of CXCR4.
Mechanism of Ligand Recognition by Human ACE2 Receptor
Human ACE2 receptor has been of critical importance in biology and medicine. It is highly expressed in different organ epithelial cells such as heart, kidney, pancreas and lungs. Human ACE2 receptor is an excellent therapeutic target to severe acute respiratory syndrome coronavirus (SARS-Cov) as it serves as receptor for both SARS-CoV and SARS-CoV-2. It is critically important to study drug binding mechanism to this receptor, which remains elusive till today, for the development of effective treatment against SARS-CoV-2.
In order to study the molecular and structural basic of ligand binding to the human ACE2, LiGaMD simulations were performed using the X-ray structure of the inhibitor MLN-4760-bound ACE2 as model (PDB: 1R4L).84 The AMBER ff19SB force field and GAFF-2 were used to model the protein and ligand, respectively. In addition to the MLN-4760 in the X-ray structure, 9 MLN-4760 molecules were added to the solvent to build the initial simulation systems. 64 ns LiGaMD equilibration followed by ten independent 700-2000 ns LiGaMD productions were performed. Dissociation of MLN-4760 from the ACE2 active site was captured during LiGaMD equilibration. Protein conformational change was observed upon ligand dissociation where the receptor subdomain I transited from “Closed” to “Open” state. Ligand binding and unbinding to the ACE2 active site was captured in three of the ten LiGaMD simulations (“Sim1”, “Sim2” and “Sim3”) with minimum ligand RMSD relative to the X-ray structure of ~0.99 Å (Figure 2A). Large-scale conformational changes of the ACE2 were sampled in LiGaMD. In addition, LiGaMD identified four low-energy conformations of the ACE2 receptor, viz. “Open”, “Partially Open”, “Closed”, and “Fully Closed”. The “Fully Closed” conformation was newly discovered through LiGaMD simulations, whereas, the three “Open”, “Partially Open” and “Closed” conformations were highly consistent with the experimentally resolved structures.
Particularly, in Sim2, within ~100 ns, one MLN-4760 initially interacted to the receptor interface between the α5 and 310 H4 helices. In ~100–160 ns, the ligand further entered the ACE2 active site through the cavity between the subdomain I and II, bound to the active site up to ~500 ns and then dissociated (Figure 2B). Ligand dissociation pathway was completely different than that of the ligand binding (Figure 2C and D). When the ligand dissociated, the conformation of receptor subdomain I was changed from “Closed” to “Open” through opening between the receptor helices α2 and α4.
 |
Figure 2 (A) “Bound” state conformation of the ACE2 receptor and MLN-4760 inhibitor (green) in comparison to the X-ray conformation (Orange, PDB: 1R4L) (B) RMSD of MLN-4760 ligands relative to the bound X-ray conformation (PDB: 1R4L) calculated from “Sim 2” LiGaMD simulations. (C) Rotated views of ligand binding pathway with MLN-4760 central ring (lines) colored in a blue-white-red (BWR) color scale along simulation time. (D) Rotated views of ligand dissociation pathway with MLN-4760 central ring (lines) colored in a blue-white-red (BWR) color scale along simulation time. (E) Free energy profile of the ligand RMSD and interdomain distance highlighting nine low-energy conformational states: one Bound (B), four Intermediate (I-1, I-2, I-3, I-4), and four Unbound (U-1, U-2, U-3, U-4). Adapted with permission from Bhattarai A, Pawnikar S, Miao Y. Mechanism of ligand recognition by human ACE2 receptor. J Phys Chem Lett. 12:4814-4822. Copyright 2021 American Chemical Society.84 |
Using the ligand RMSD relative to the X-ray structure and interdomain distance as reaction coordinates, free energy landscape was calculated by combining all LiGaMD simulation trajectories. The free energy landscape identified nine low-energy conformations of the receptor-ligand complex, namely, “Bound (B)”, “Intermediate-1 (I-1)”, “Intermediate-2 (I-2)”, “Intermediate-3 (I-3)”, “Intermediate (I-4)”, “Unbound-1 (U-1)”, “Unbound-2 (U-2)”, “Unbound-3 (U-3)” and “Unbound-4 (U-4)” (Figure 2E). Ligand bound at the active site with minimum ligand RMSD of 0.99 Å was termed as the “Bound” conformation, in which the receptor interdomain distance was ~12-14 Å (Figure 2A). In the I-1 state, ligand interacted with residues in the α5 helix, α11 helix, α14 helix, α18 helix and 310H4 helix loop in the two protein subdomains. The ligand RMSD and interdomain distance in the I-1 state were ~9.8 Å and ~18–22 Å, respectively. The receptor adopted a “Partially-open” conformation in this state. In the I-2 state, ligand interacted with receptor subdomain II involving the α17 helix, α18 helix, and α19 helix. The ligand RMSD and interdomain distance was located at (~25.6 Å, ~5-7 Å). In the I-3 state, ligand interactions were observed with the α2 helix and α4 helix in the protein subdomain I and II, respectively, in which the ligand RMSD and interdomain distance was located at (~30.4 Å, ~13-20 Å). In the I-4 state, ligand interacted with the protein subdomain II involving the α8 helix, α14 helix, and 310H4 with ligand RMSD and the interdomain distance located at (~31.7 Å, ~25-26 Å). In the unbound states U-1, U-2, U-3 and U-4 exhibited interdomain distances of ~5-7, ~10-12, ~20-21, and ~25 Å, respectively, at ligand RMSD ~80 Å.
LiGaMD has successfully captured the dissociation and rebinding pathways of MLN-4760 to the human ACE2 receptor. With detailed analysis of the receptor and protein conformations, LiGaMD simulations suggested that the binding of MLN-4760 to human ACE2 mainly followed the conformational selection mechanism as the ligand binding shifted the receptor conformation to the “Closed” state. These simulation findings provide important insights for design and development of drugs for therapeutic treatment of COVID-19 and other diseases associated with the ACE2 receptor.
In case of SARS-CoV-2 infection, RBD of the viral spike protein attaches to the top region of subdomain I in the ACE2 receptor, which is distant from the receptor peptidase active site. Thus, the MLN-4760 inhibitor does not compete directly with the RBD of SARS-CoV-2. However, there have been evidences of allosteric modulation in the ACE2 receptor, which could be utilized for antiviral drug design. Hernandez Prada et al100 identified two small-molecule compounds from in silico screening that bound to the hinge region of ACE2 and could activate the receptor ~2 fold in an in vitro ACE2 activity assay, with EC50 values of approximately 20 μM. Huentelman et al101 also discovered a novel ACE2 inhibitor from virtual screening, which bound the receptor active site but also allosterically blocked SARS-CoV spike protein-mediated receptor attachment. Here, we have characterized the mechanism of ligand binding/dissociation and further highlighted the dynamic nature of the ACE2 receptor in terms of the large-scale movement of subdomain I upon ligand binding. LiGaMD simulations also showed that MLN-4760 could form hydrophobic interactions with the RBD binding site in subdomain I of the receptor in the closed state. This information could be helpful in designing drugs that could block RBD binding to the receptor. Furthermore, since the human ACE2 receptor shows conformational selection for ligand binding as revealed from the LiGaMD simulations, virtual screening using ensemble docking102–104 with receptor structural ensembles generated from the LiGaMD simulations will be a promising approach to designing potent drug molecules of the ACE2 receptor against coronavirus infection.
Mechanism of RNA Binding to M2-1 Protein
As one of non-segmented negative-sense (NNS) RNA viruses, human respiratory syncytial virus (HRSV) including rabies and Ebola virus could cause severe lower track respiratory diseases.105–108 The function of RNA-dependent RNA polymerase (RdRP) is regulated by a zinc-binding transcription terminator, M2-1 protein, in HRSV. Thus, M2-1 protein is an important therapeutic target for drug design. The structure of a short positive-sense gene-end RNA (SH7) binding to the HRSV M2-1 was resolved, suggesting multiple M2-1 residues were interacted with the RNA.85 Five independent 300 ns dual-boost GaMD simulations were performed to investigate the binding mechanism between RNA and the M2-1 protein.85 The initial simulation model was prepared by placing the seven-nucleotide SH7 RNA (AGUUAAU) at a distance >20 Å from the M2-1 protein (PDB: 6PZQ). Spontaneous binding of the SH7 RNA to the M2-1 protein was captured. Structural clustering of the SH7 RNA was performed to obtain the top five clusters using a hierarchical agglomerative algorithm. The first and second top-ranked cluster showed RNA binding to the ZBD and the CD of M2-1, respectively. In the ZBD of M2-1, protein residue R4 formed polar contact with the nucleotide U-4 of SH7 RNA (Figure 3B and D). In the CD of M2-1, protein residue K92 formed ionic interaction with the phosphodiester backbone of U-4 RNA nucleotide (Figure 3A and C), being consistent with the crystal structure that a direct interaction of K92 and the phosphodiester backbone of RNA1ʹ was observed.
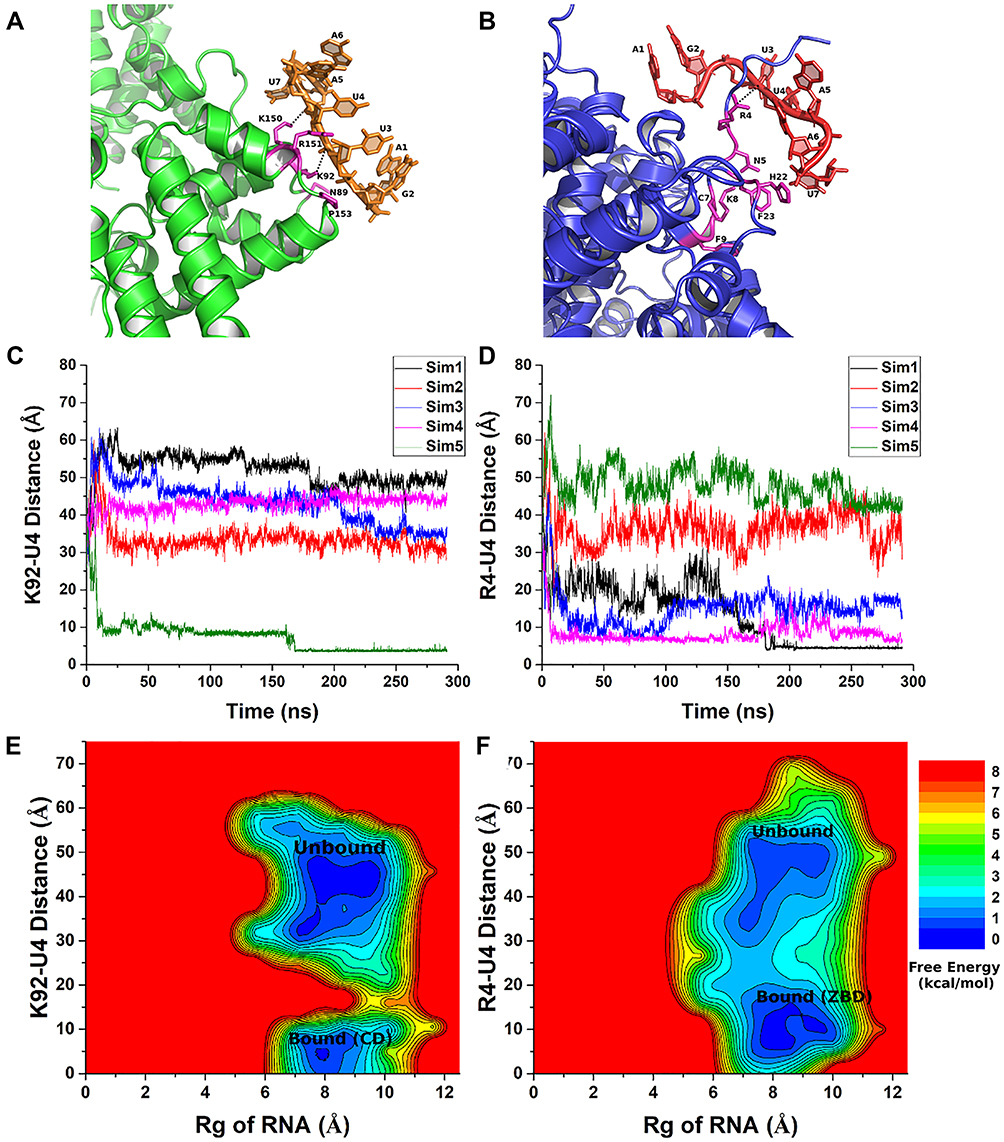 |
Figure 3 (A and B) RNA (orange) bound to the Core domain (CD) and RNA (red) bound to the Zn-binding domain (ZBD) of the M2-1 protein (blue ribbons) with highlighted M2-1 interacting residues (magenta sticks) (C) Combined time course distance plots of CD M2-1 residue K92:NZ and RNA base U-4:P (D) Combined time course distance plots of ZBD M2-1 residue R4 and RNA base U-4:P (E) Free energy profiles with radius of gyration (Rg) of RNA and the distance between M2-1 residue K92 and RNA base U4 revealed low-energy Unbound and Bound states of the RNA on M2-1 CD surface (F) Free energy profiles with Rg of RNA and the distance between protein residue R4 and RNA base U4 revealed low-energy Unbound and Bound states of the RNA on M2-1 ZBD. Reprinted from Structure, 28(9), Gao Y, Cao D, Pawnikar S, et al. Structure of the Human Respiratory Syncytial Virus M2-1 Protein in Complex with a Short Positive-Sense Gene-End RNA. 979-990. e974. Copyright © 2020 Elsevier Ltd., with permission from Elsevier.85 |
Free energy profiles were calculated from GaMD simulations by using the polar interactions and the radius of gyration (Rg) of the SH7 RNA as reaction coordinates. With the RNA molecule being very small, the end-to-end distance can also be used to characterize the molecular conformational changes although it often undergoes high fluctuations. Here, using Rg as a reaction coordinate to calculate free energy profiles allowed us to capture different conformational states of the system. For SH7 binding to the CD of M2-1 protein, the distance between M2-1 residue K92 and RNA base U4 was ~3 Å in the free energy minimum (Figure 3E); While for RNA binding to the ZBD of M2-1, free energy minimum was located at M2-1 residue R4 and RNA base U4 distance ~5 Å (Figure 3F).
In agreement with the experimental results, GaMD simulations revealed that binding of RNA to the CD or ZBD of the M2-1 protein are independent events. Together, the results provided important insights into the recognition mechanism between RNA and HRSV M2-1 protein, which can be valuable for effective drug design and development for its related diseases.
Mechanism of RNA Binding to a Musashi RNA-Binding Proteins
The Musashi 1 (MSI1) protein serves as a therapeutic drug target for treating several cancers such as colorectal, ovarian, bladder and myeloid leukemia. It is known to bind and suppresses translation of the 3ʹ-UTR of Numb mRNA,109 however, the molecular mechanism of this interaction remains elusive which is important for effective drug design.
We performed all-atom GaMD simulations to study the binding mechanism between Numb RNA and MSI1.86 For system setup, the Numb RNA was placed ~30 Å away from the MSI1. The AMBER force fields were used with ff14SBonlysc for protein, RNA.LJbb110–112 for RNA and TIP3P model for water molecules. Spontaneous binding of Numb RNA to the MSI1 protein was successfully captured in 6 out of the 19 independent 1200 ns of GaMD simulations. In Sim1, RNA binding was observed at ~100 ns where the RMSD of RNA relative to the NMR structure reduced to ~2.50 Å (Figure 4A). In Sim2, RNA binding was observed at ~1010–1130 ns followed by RNA dissociation into the bulk solvent (Figure 4A). The RNA bound to MSI1 after ~800 ns in Sim3, Sim4 and Sim5 (Figure 4A). In Sim6, spontaneous binding of RNA wasobserved after ~1000 ns (Figure 4A).
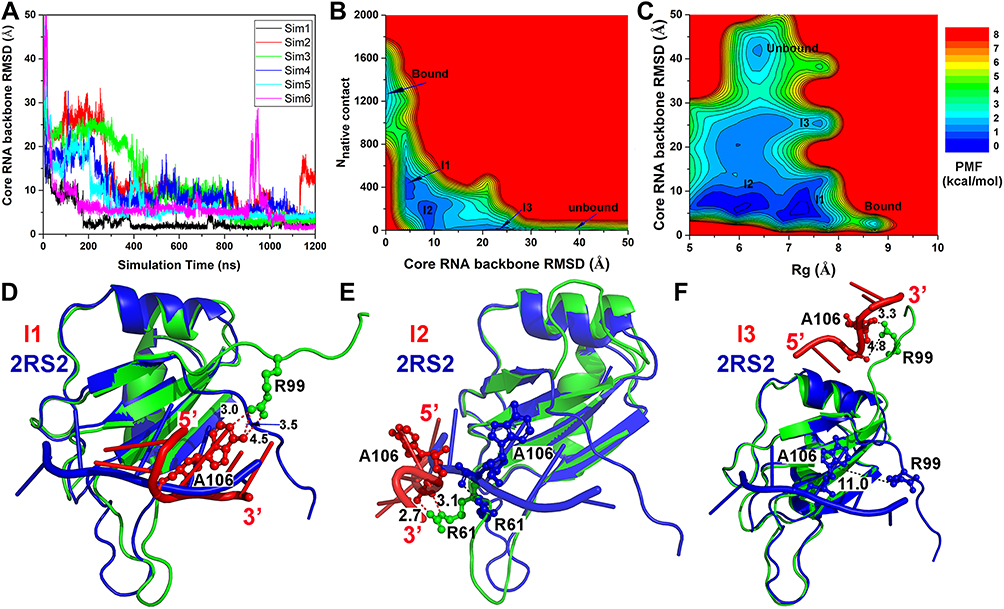 |
Figure 4 GaMD simulation of Numb RNA-MSI1 protein interaction. (A) Time courses plots of backbone RMSD of core RNA (central three nucleotides GUA of the Numb RNA) relative to the NMR structure (PDB: 2RS2); (B) Free energy profiles of the backbone RMSD of core RNA relative to the NMR structure and number of native contacts between MSI1 and Numb RNA; (C) Free energy profiles of Rg of the Numb RNA and backbone RMSD of core RNA relative to the NMR structure; (D–F) Low-energy intermediate conformational states I1 (D), I2 (E) and I3 (F) as identified from the free energy profile of the Numb RNA-MSI1 simulation system. Reprinted from Wang J, Lan L, Wu X, Xu L, Miao Y. Mechanism of RNA recognition by a Musashi RNA-binding protein. Curr Res Struct Biol. 2022.4:10-20. Creative Commons license and disclaimer available from: http://creativecommons.org/licenses/by/4.0/legalcode.86 |
Free energy profiles were calculated by using reaction coordinates including backbone RMSD of RNA core relative to its NMR bound conformation, radius of gyration (Rg) and the number of native contacts (Ncontact). Five low-energy minima were characterized - “Bound”, “Intermediate I1”, “Intermediate I2”, “Intermediate I3” and “Unbound”. These states were identified at the backbone RMSD of the RNA core and Ncontacts being (2.0 Å, 1500), (5.2 Å, 480), (9.5 Å, 200), (25.0 Å, 10) and (40 Å, 0), respectively (Figure 4B). The “Unbound”, “Intermediate I1”, “Intermediate I2” and “Intermediate I3” states were identified at the backbone RMSD of the RNA core and Rg of Numb being (40.0 Å, 6.2 Å), (5.0 Å, 7.2 Å), (6.9 Å, 6.2 Å), respectively (Figure 4C). From the GaMD simulations, the Rg of the Numb RNA in the “Bound” state was observed to have a wider range as compared to the “Unbound” and “Intermediate” conformations (Figure 4B and C) which suggested an induced fit mechanism of Numb RNA binding to MSI1. The I1 state showed interactions of Numb RNA with the β2-β3 loop and C terminus of MSI1 (Figure 4D). Three hydrogen bonds were formed between MS1 C terminus residue Arg99 and the RNA nucleotide A106 (Figure 4D). The I2 state showed flipping of the MS1 residue Arg61 sidechain towards the solvent leading to the formation of hydrogen bond and salt-bridge interactions with the phosphate oxygen of the sidechain and backbone of RNA nucleotide A106, respectively (Figure 4E). The I3 state showed large conformational changes in the MS1 C terminus where hydrogen bond and salt bridge interactions were observed between the C terminus residue Arg99 and the sidechain and backbone of RNA nucleotide A106, respectively (Figure 4F). These important understandings of the RNA binding mechanism to MSI1 provided by GaMD simulations can aid rational structure-based drug design against MSI1 and other related diseases.
Ligand Binding Thermodynamics and Kinetics Characterized by LiGaMD
LiGaMD simulations performed on model systems such as host-guest and protein-ligand enabled ligand binding thermodynamics and kinetics calculations through repetitive events of binding and dissociation observed of small-molecule ligands.82 Calculations were done using LiGaMD and LiGaMD_Dual schemes where a boost potential is applied to the non-bonded and bonded interactions between the ligand-protein/environment, respectively, along with GAFF and q4MD force field parameters used to simulate binding of aspirin and 1-butanol (two guest molecules) to cyclodextrin (CD) (host). PMF profiles were calculated regarding the distance between the guest and host molecules using multiple independent 300 ns LiGaMD simulations. For most of the systems, the bound state was located at the global energy minima. The PMF plot showed similar results as compared to 6500ns cMD simulations in terms of low energy states including “Bound”, “Intermediate” and “Unbound”. Further, to characterize the conformational changes in the host, PMF profiles were calculated using the radius of gyration (Rg) as the reaction coordinate. The apo system and bound guest 1-butanol biased the system to adopt “Compact” (lower Rg) low energy conformational state whereas aspirin bound system predominately adopted “Open” (higher Rg) state. LiGaMD PMF profiles showed that the q4MD force field preferred open conformation where the host predominantly adopted compact conformation using GAFF forcefield. Similarly, the binding free energies of the host-guest systems were calculated using LiGaMD 3D PMF profiles. The binding free energies calculated from hundreds of nanoseconds of LiGaMD simulations were in excellent agreement with that of the experiments and previous “converged” microsecond-timescale cMD simulations. In addition to cMD, LiGaMD simulations’ errors in these values were less than 1.0 kcal/mol. Moreover, LiGaMD simulations were also used to calculate the kinetic binding and dissociation constants. Reweighting of kinetics of the LiGaMD simulations was done using the Transition state theory and Kramer’s rate theory. The kinetic binding rate calculated from the LiGaMD simulations decreased to some degree as compared to the previous cMD simulations while guest dissociation rates increased significantly in LiGaMD_Dual simulations.
Similarly, repetitive binding and dissociation of benzamidine inhibitor in trypsin were observed during microsecond LiGaMD simulations (Figure 5A, B and F). 2D reweighted PMF profile was plotted regarding the atom distances benzamidine:C-Asp189:CG and Trp215:NE-Asp189:CG to characterize conformational changes of protein during ligand binding/unbinding (Figure 5C). Five low-energy wells were characterized from the free energy profiles- Bound, Intermediate 1, Intermediate 2, Unbound 1, and Unbound 2. When the inhibitor was bound to the protein, benzamidine:C-Asp189:CG distance was ~4 Å whereas Trp215:NE-Asp189:CG distance was ~12.5 Å. Here, the inhibitor was bound to the Asp189 residue of the protein S1 pocket as seen in the X-ray crystal conformation. The Intermediate 1 showed inhibitor bound near Trp215 “gate” close to His57-Asp102-Ser214 catalytic whereas the Intermediate 2 showed ligand bound to the open S1* pocket (Figure 5D and E). Rearrangement of Trp215 loop and sidechain flipping of Trp215 residue facilitated the opening of S1* pocket in the Intermediate 2 state. Additionally, the ligand binding free energy of trypsin-benzamidine complex calculated from the 3D PMF profile was −6.13 ± 0.35 kcal/mol which agreed excellently with the experimental value of −6.2 kcal/mol.111 Similarly, with the recorded time periods of ligand binding and unbinding, the reweighted kon and koff values were calculated as 1.15 ± 0.79 × 10⁷ M−1·s−1 and 3.53 ± 1.41 s−1, respectively. Similar protocol was applied, as in the host-guest binding, to calculate these values using Kramer’s rate theory. These data were comparable to the values calculated from experiments.111
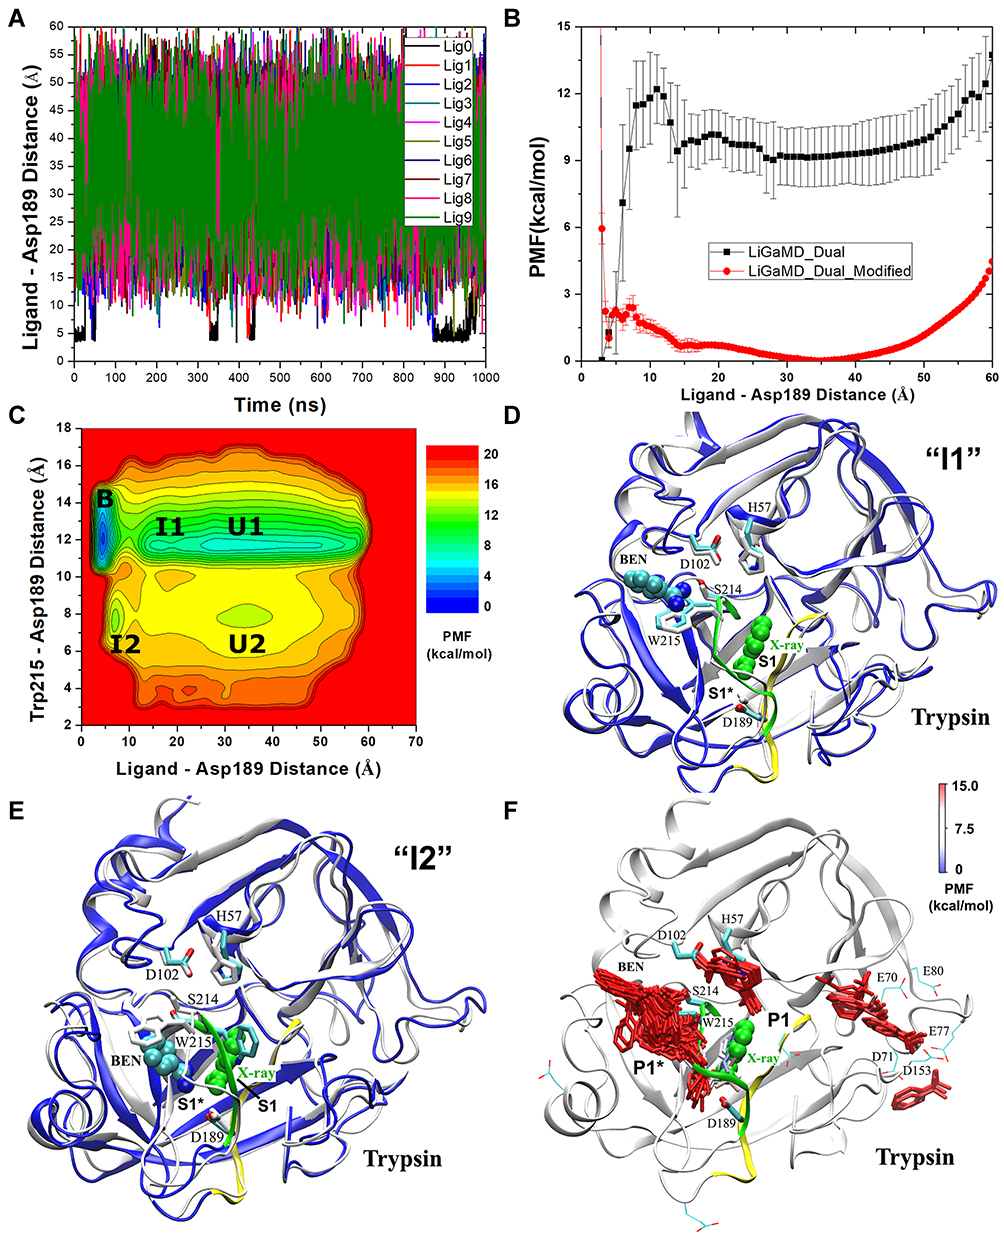 |
Figure 5 LiGaMD simulations of benzamidine binding/dissociation to trypsin. (A) Time course plot of distance between benzamidine amidine:C atom and trypsin Asp189:CG atom calculated from representative LiGaMD simulation. (B) Reweighted (LiGaMD_Dual) and non-reweighted (LiGaMD_Dual_Modified) PMF profiles regarding distance between benzamidine amidine:C atom and trypsin Asp189:CG atom. (C) Reweighted 2D PMF profile regarding benzamidine amidine:C – trypsin Asp189:CG and trypsin Trp215:NE – Asp189:CG atom distances. (D and E) Intermediate 1 (I1) and Intermediate 2 (I2) low energy conformational states identified from 2D PMF profiles. (F) Benzamidine (sticks) binding pathway to trypsin (ribbon) obtained from LiGaMD simulations. Catalytic triad (His57, Asp102 and Ser214), Asp189 and Trp215 residues important for trypsin–benzamidine interaction are shown in sticks. Reprinted with permission from Miao Y, Bhattarai A, Wang J. Ligand Gaussian accelerated molecular dynamics (LiGaMD): characterization of ligand binding thermodynamics and kinetics. J Chem Theory Comput. 2020;16(9):5526–5547. Copyright © 2020, American Chemical Society.82 |
Peptide Binding Thermodynamics and Kinetics Characterized by Pep-GaMD
Pep-GaMD simulations have allowed us to capture repetitive binding and dissociation of highly flexible peptides,83 and thus enabled peptide binding thermodynamics and kinetics calculations. In Pep-GaMD, potential energy of the peptide is selectivity boosted allowing it to sample higher flexibility during the simulation. In the dual boost scheme, the entire system potential energy is boosted. Three model peptide systems including “PAMPAR” (PDB: 1SSH), “PPPALPPKK” (PDB: 1CKA) and “PPPVPPRR” (PDB: 1CKB) were used to capture the binding/dissociation to the SH3 domains.113,114 1 μs Pep-GaMD allowed us to capture repetitive binding and dissociation of the three model peptides during three independent production runs. In the 1 μs Pep-GaMD simulations, the 1SSH peptide bound 3–4 times and dissociated 3 times to the SH3 domains. The 1CKA peptide was observed having 3–5 binding events whereas 2–5 dissociation events. Similarly, in the 1CKB simulation, the peptide bound 3–4 times to the receptor whereas it dissociated 2–3 times (Figure 6).
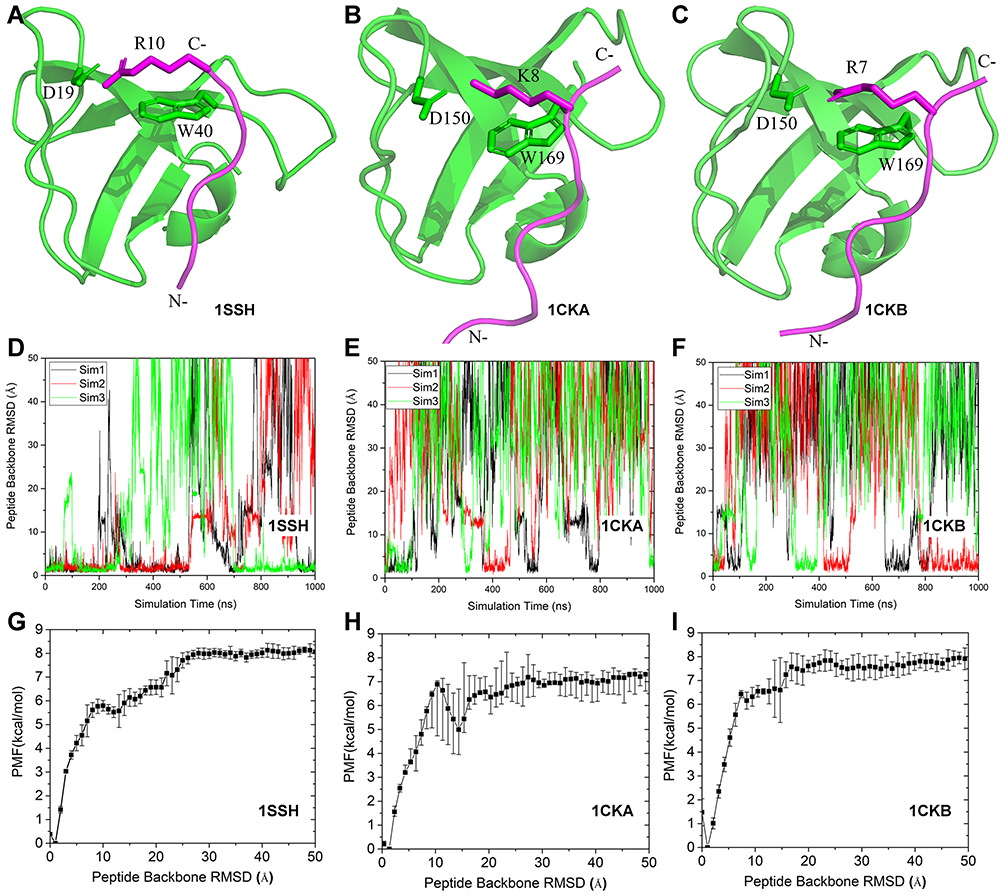 |
Figure 6 Pep-GaMD simulations of binding/dissociation of three model peptides to the SH3 domains: (A–C) X-ray crystal structures of the SH3 domains (green cartoon) bound by three different peptides (magenta cartoon) including (A) “PAMPAR” (PDB: 1SSH), (B) “PPPALPPKK” (PDB: 1CKA) and (C) “PPPVPPRR” (PDB: 1CKB). Key interaction residues are highlighted in sticks. Time courses of (D) 1SSH, (E) 1CKA and (F) 1CKB peptide RMSDs relative to X-ray structures calculated from three independent Pep-GaMD simulations. (G–I) 1D PMF profiles regarding the peptide backbone RMSDs of the (G) 1SSH, (H) 1CKA and (I) 1CKB structures calculated from the Pep-GaMD simulations. Reprinted from Wang J, Miao Y. Peptide Gaussian accelerated molecular dynamics (Pep-GaMD): enhanced sampling and free energy and kinetics calculations of peptide binding. J Chem Phys, 2020;153(15):154109, with the permission of AIP Publishing. © 2020 Author(s). Published under license by AIP Publishing.83 |
3D Pyreweighting scripts were used to calculate the peptide binding free energies. These values agreed well with the experimental findings. Pep-GaMD predicted the binding free energy value to be −7.72 ± 0.54 kcal/mol for the 1CKA peptide which agreed well with the experimental value of −7.84 kcal/mol.112 The 1CKB peptide had −6.84 ± 0.14 kcal/mol binding free energy which is close to −7.24 kcal/mol112 as calculated from the experiments. The differences of binding free energies between the simulation predictions and experiments were less than 1.0 kcal/mol. In addition, with efficient sampling of peptide binding/dissociation Pep-GaMD helped us to predict the peptide binding kinetics. For the 1CKA system, the kon and koff were calculated as 4.06 ± 2.26×10¹⁰ M−1⋅s−1 and 1.45 ± 1.07×10³ s−1, respectively. This was in excellent agreement with the experimental values115 of  = 1.5 × 10⁹ M−1⋅s−1 and
  = 8.9 × 10³ s−1. Hence, the Pep-GaMD simulation has enabled us to study the mechanism of peptide binding/dissociation to proteins by accelerating the interactions between them. This is a significant contribution to the field as it is difficult to attain correct sampling of biomolecules that involves long-range electrostatic interactions and conformational selection.
Conclusions
GaMD presents to be an unconstrained enhanced sampling technique, which can sample the conformational space of biomolecules and their interactions without the need of predefined CVs. Using cumulant expansion to the second order, GaMD can achieve accurate reweighting of the simulations because the added boost potential exhibits a Gaussian distribution. GaMD can be implemented to a broad range of biological systems. In particular, recent GaMD simulations have revealed important binding mechanisms of small-molecule ligands,71,84 peptides,116,117 proteins78 and nucleic acids85,86 to the target receptors. 300 ns of GaMD simulations has successfully captured complete folding of chignolin (10 residues) into its native conformation61 with a minimum RMSD of 0.2 Å relative to the NMR native conformation (PDB: 1UAO). The reweighted free energy profiles calculated showed distinct low-energy conformational states of chignolin as “Folded”, “Intermediate” and “Unfolded”. With the same simulation time, however, aMD failed to distinguish between the unfolded and intermediate states.118 GaMD has been further developed for more powerful techniques of improved sampling such as LiGaMD82 and Pep-GaMD.83 Altogether, novel GaMD methods and advancement in computer hardware will enable us to approach and simulate complex biomolecular interactions at atomic level.
Future Perspectives
GaMD has been a successful enhanced sampling method to characterize biomolecular interactions and binding processes. The novel selective GaMD algorithms including LiGaMD and Pep-GaMD can efficiently calculate the binding free energy of ligand/peptide and their kinetic rate constants by adding a selective boost to the essential ligand/peptide potential energy terms. Important mechanistic insights into drug binding to the ACE2 receptor have provided a significant perspective for rational drug development against the COVID-19 pandemic. RNA binding to the M2-1 and MSI1 model proteins depicted by GaMD simulations was in good agreement with the experimentally resolved structures. However, only very few binding events were captured in GaMD simulations of the CXCR4-drug (Figure 1) and protein-RNA (Figures 3 and 4) systems and LiGaMD simulations of the ACE2-inhibitor system (Figure 2). The simulations did not sample enough binding and unbinding events (eg, at least 3–5 or more) in order to estimate the ligand/RNA binding free energies and kinetics for comparison with experimental data. Therefore, these simulations still suffered from insufficient sampling. Further method developments and advances in supercomputing are still needed to obtain converged binding simulations and thus calculate accurate biomolecular binding thermodynamics and kinetics. In addition to binding of the small-molecule ligands and flexible peptides/RNA, new platforms also need to be explored to study biomolecular interactions of larger complexes such as protein–protein interactions. The binding analysis using GaMD and further improved simulation methods shall provide significant contributions in rational computer-aided drug design.
Acknowledgments
This work used supercomputing resources with allocation awards TG-MCB180049 through the Extreme Science and Engineering Discovery Environment (XSEDE), which is supported by National Science Foundation grant number ACI-1548562, project M2874 through the National Energy Research Scientific Computing Center, which is a US Department of Energy Office of Science User Facility operated under Contract No. DE-AC02-05CH11231, and computational resources provided by the Research Computing Cluster at the University of Kansas. This work was supported in part by the American Heart Association (Award 17SDG33370094), the National Institutes of Health (R01GM132572) and the startup funding in the College of Liberal Arts and Sciences at the University of Kansas.
Author Contributions
All authors made a significant contribution to the work reported, whether that is in the conception, study design, execution, acquisition of data, analysis and interpretation, or in all these areas; took part in drafting, revising or critically reviewing the article; gave final approval of the version to be published; have agreed on the journal to which the article has been submitted; and agree to be accountable for all aspects of the work.
Disclosure
The authors report no conflicts of interest in this work.
References
1. Henzler-Wildman K, Kern D. Dynamic personalities of proteins. Nature. 2007;450(7172):964–972. doi:10.1038/nature06522
2. Hatoum-Aslan A, Marraffini LA. Impact of CRISPR immunity on the emergence and virulence of bacterial pathogens. Curr Opin Microbiol. 2014;17:82–90. doi:10.1016/j.mib.2013.12.001
3. Englander SW, Mayne L. The nature of protein folding pathways. Proc Natl Acad Sci. 2014;111(45):15873–15880. doi:10.1073/pnas.1411798111
4. Ritter SL, Hall RA. Fine-tuning of GPCR activity by receptor-interacting proteins. Nat Rev Mol Cell Biol. 2009;10(12):819–830. doi:10.1038/nrm2803
5. Onuchic JN, Luthey-Schulten Z, Wolynes PG. Theory of protein folding: the energy landscape perspective. Annu Rev Phys Chem. 1997;48(1):545–600. doi:10.1146/annurev.physchem.48.1.545
6. Deupi X, Kobilka BK. Energy landscapes as a tool to integrate GPCR structure, dynamics, and function. Physiology. 2010;25(5):293–303. doi:10.1152/physiol.00002.2010
7. Karplus M, McCammon JA. Molecular dynamics simulations of biomolecules. Nat Struct Biol. 2002;9(9):646–652. doi:10.1038/nsb0902-646
8. Harvey MJ, Giupponi G, Fabritiis GD. ACEMD: accelerating biomolecular dynamics in the microsecond time scale. J Chem Theory Comput. 2009;5(6):1632–1639. doi:10.1021/ct9000685
9. Johnston JM, Filizola M. Showcasing modern molecular dynamics simulations of membrane proteins through G protein-coupled receptors. Curr Opin Struct Biol. 2011;21(4):552–558. doi:10.1016/j.sbi.2011.06.008
10. Shaw DE, Maragakis P, Lindorff-Larsen K, et al. Atomic-level characterization of the structural dynamics of proteins. Science. 2010;330(6002):341–346. doi:10.1126/science.1187409
11. Lane TJ, Shukla D, Beauchamp KA, Pande VS. To milliseconds and beyond: challenges in the simulation of protein folding. Curr Opin Struct Biol. 2013;23(1):58–65. doi:10.1016/j.sbi.2012.11.002
12. Hollingsworth SA, Dror RO. Molecular dynamics simulation for all. Neuron. 2018;99(6):1129–1143. doi:10.1016/j.neuron.2018.08.011
13. Shan Y, Kim ET, Eastwood MP, Dror RO, Seeliger MA, Shaw DE. How does a drug molecule find its target binding site? J Am Chem Soc. 2011;133(24):9181–9183. doi:10.1021/ja202726y
14. Dror RO, Pan AC, Arlow DH, et al. Pathway and mechanism of drug binding to G-protein-coupled receptors. Proc Natl Acad Sci. 2011;108(32):13118–13123. doi:10.1073/pnas.1104614108
15. Kruse AC, Hu J, Pan AC, et al. Structure and dynamics of the M3 muscarinic acetylcholine receptor. Nature. 2012;482(7386):552. doi:10.1038/nature10867
16. Buch I, Giorgino T, De fabritiis G. Complete reconstruction of an enzyme-inhibitor binding process by molecular dynamics simulations. Proc Natl Acad Sci. 2011;108(25):10184–10189. doi:10.1073/pnas.1103547108
17. Ahmad M, Gu W, Helms V. Mechanism of fast peptide recognition by SH3 domains. Angew Chem Int Ed. 2008;47(40):7626–7630. doi:10.1002/anie.200801856
18. Salmaso V, Sturlese M, Cuzzolin A, Moro S. Exploring protein-peptide recognition pathways using a supervised molecular dynamics approach. Structure. 2017;25(4):655–662 e652. doi:10.1016/j.str.2017.02.009
19. Robustelli P, Piana S, Shaw DE. Mechanism of coupled folding-upon-binding of an intrinsically disordered protein. J Am Chem Soc. 2020;142(25):11092–11101. doi:10.1021/jacs.0c03217
20. Laio A, Gervasio FL. Metadynamics: a method to simulate rare events and reconstruct the free energy in biophysics, chemistry and material science. Rep Prog Phys. 2008;71(12):126601. doi:10.1088/0034-4885/71/12/126601
21. Bešker N, Gervasio FL. Using metadynamics and path collective variables to study ligand binding and induced conformational transitions. In: Computational Drug Discovery and Design. New York, NY: Springer; 2012:501–513.
22. Torrie GM, Valleau JP. Nonphysical sampling distributions in Monte Carlo free-energy estimation: umbrella sampling. J Comput Phys. 1977;23(2):187–199. doi:10.1016/0021-9991(77)90121-8
23. Kumar S, Rosenberg JM, Bouzida D, Swendsen RH, Kollman PA. The weighted histogram analysis method for free-energy calculations on biomolecules. I. The method. J Comput Chem. 1992;13(8):1011–1021. doi:10.1002/jcc.540130812
24. Darve E, Rodríguez-Gómez D, Pohorille A. Adaptive biasing force method for scalar and vector free energy calculations. J Chem Phys. 2008;128(14):144120. doi:10.1063/1.2829861
25. Darve E, Wilson MA, Pohorille A. Calculating free energies using a scaled-force molecular dynamics algorithm. Mol Simul. 2002;28(1–2):113–144. doi:10.1080/08927020211975
26. Grubmuller H. Predicting slow structural transitions in macromolecular systems: conformational flooding. Phys Rev E Stat Phys Plasmas Fluids Relat Interdiscip Topics. 1995;52(3):2893–2906. doi:10.1103/physreve.52.2893
27. Bouvier B, Grubmuller H. A molecular dynamics study of slow base flipping in DNA using conformational flooding. Biophys J. 2007;93(3):770–786. doi:10.1529/biophysj.106.091751
28. Sun HY, Li YY, Shen MY, Li D, Kang Y, Hou TJ. Characterizing drug target residence time with metadynamics: how to achieve dissociation rate efficiently without losing accuracy against time-consuming approaches. J Chem Inf Model. 2017;57(8):1895–1906. doi:10.1021/acs.jcim.7b00075
29. Casasnovas R, Limongelli V, Tiwary P, Carloni P, Parrinello M. Unbinding kinetics of a p38 MAP kinase Type II inhibitor from metadynamics simulations. J Am Chem Soc. 2017;139(13):4780–4788. doi:10.1021/jacs.6b12950
30. Provasi D, Bortolato A, Filizola M. Exploring molecular mechanisms of ligand recognition by opioid receptors with metadynamics. Biochemistry-Us. 2009;48(42):10020–10029. doi:10.1021/bi901494n
31. Sun HY, Chen PC, Li D, Li YY, Hou TJ. Directly binding rather than induced-fit dominated binding affinity difference in (S)- and (R)-crizotinib bound MTH1. J Chem Theory Comput. 2016;12(2):851–860. doi:10.1021/acs.jctc.5b00973
32. Sun HY, Li YY, Tian S, Wang JM, Hou TJ. P-loop conformation governed crizotinib resistance in G2032R-mutated ROS1 tyrosine kinase: clues from free energy landscape. PLoS Comput Biol. 2014;10(7):e1003729. doi:10.1371/journal.pcbi.1003729
33. Saleh N, Ibrahim P, Saladino G, Gervasio FL, Clark T. An efficient metadynamics-based protocol to model the binding affinity and the transition state ensemble of G-protein-coupled receptor ligands. J Chem Inf Model. 2017;57(5):1210–1217. doi:10.1021/acs.jcim.6b00772
34. Zwier MC, Pratt AJ, Adelman JL, Kaus JW, Zuckerman DM, Chong LT. Efficient atomistic simulation of pathways and calculation of rate constants for a protein-peptide binding process: application to the MDM2 protein and an intrinsically disordered p53 peptide. J Phys Chem Lett. 2016;7(17):3440. doi:10.1021/acs.jpclett.6b01502
35. Paul F, Wehmeyer C, Abualrous ET, et al. Protein-peptide association kinetics beyond the seconds timescale from atomistic simulations. Nat Commun. 2017;8(1):1095. doi:10.1038/s41467-017-01163-6
36. Zou R, Zhou Y, Wang Y, et al. Free energy profile and kinetics of coupled folding and binding of the intrinsically disordered protein p53 with MDM2. J Chem Inf Model. 2020;60(3):1551–1558. doi:10.1021/acs.jcim.9b00920
37. Abrams C, Bussi G. Enhanced sampling in molecular dynamics using metadynamics, replica-exchange, and temperature-acceleration. Entropy-Switz. 2014;16(1):163–199. doi:10.3390/e16010163
38. Zuckerman DM. Equilibrium sampling in biomolecular simulations. Annu Rev Biophys. 2011;40:41–62. doi:10.1146/annurev-biophys-042910-155255
39. Miao Y, McCammon JA. Unconstrained enhanced sampling for free energy calculations of biomolecules: a review. Mol Simulat. 2016;42(13):1046–1055. doi:10.1080/08927022.2015.1121541
40. Sugita Y, Okamoto Y. Replica-exchange molecular dynamics method for protein folding. Chem Phys Lett. 1999;314(1–2):141–151. doi:10.1016/S0009-2614(99)01123-9
41. Okamoto Y. Generalized-ensemble algorithms: enhanced sampling techniques for Monte Carlo and molecular dynamics simulations. J Mol Graph Model. 2004;22(5):425–439. doi:10.1016/j.jmgm.2003.12.009
42. Wu X, Wang S. Crossing the time scale of protein folding through self-guided molecular dynamics simulation. J Mol Graph Model. 1998;16(4–6):290.
43. Wu XW, Wang SM. Self-guided molecular dynamics simulation for efficient conformational search. J Phys Chem B. 1998;102(37):7238–7250. doi:10.1021/jp9817372
44. Wu XW, Brooks BR. Self-guided Langevin dynamics simulation method. Chem Phys Lett. 2003;381(3–4):512–518. doi:10.1016/j.cplett.2003.10.013
45. Wu X, Brooks BR, Vanden-Eijnden E. Self-guided Langevin dynamics via generalized Langevin equation. J Comput Chem. 2015. doi:10.1002/jcc.24015
46. Pierce LC, Salomon-Ferrer R, Augusto F, McCammon JA, Walker RC. Routine access to millisecond time scale events with accelerated molecular dynamics. J Chem Theory Comput. 2012;8(9):2997–3002. doi:10.1021/ct300284c
47. Miao Y, Nichols SE, Gasper PM, Metzger VT, McCammon JA. Activation and dynamic network of the M2 muscarinic receptor. Proc Natl Acad Sci. 2013;110(27):10982–10987. doi:10.1073/pnas.1309755110
48. Miao Y, Caliman Alisha D, McCammon JA. Allosteric effects of sodium ion binding on activation of the M3 muscarinic G-protein-coupled receptor. Biophys J. 2015;108(7):1796–1806. doi:10.1016/j.bpj.2015.03.003
49. Wereszczynski J, McCammon JA. Nucleotide-dependent mechanism of Get3 as elucidated from free energy calculations. Proc Natl Acad Sci U S A. 2012;109(20):7759–7764. doi:10.1073/pnas.1117441109
50. Gasper PM, Fuglestad B, Komives EA, Markwick PR, McCammon JA. Allosteric networks in thrombin distinguish procoagulant vs. anticoagulant activities. Proc Natl Acad Sci U S A. 2012;109(52):21216–21222. doi:10.1073/pnas.1218414109
51. Pierce LC, Markwick PR, McCammon JA, Doltsinis NL. Accelerating chemical reactions: exploring reactive free-energy surfaces using accelerated ab initio molecular dynamics. J Chem Phys. 2011;134(17):174107. doi:10.1063/1.3581093
52. Bucher D, Grant BJ, Markwick PR, McCammon JA. Accessing a hidden conformation of the maltose binding protein using accelerated molecular dynamics. PLoS Comput Biol. 2011;7(4):e1002034. doi:10.1371/journal.pcbi.1002034
53. Wang Y, Markwick PR, de Oliveira CA, McCammon JA. Enhanced lipid diffusion and mixing in accelerated molecular dynamics. J Chem Theory Comput. 2011;7(10):3199–3207. doi:10.1021/ct200430c
54. Voter AF. Hyperdynamics: accelerated molecular dynamics of infrequent events. Phys Rev Lett. 1997;78(20):3908. doi:10.1103/PhysRevLett.78.3908
55. Hamelberg D, Mongan J, McCammon JA. Accelerated molecular dynamics: a promising and efficient simulation method for biomolecules. J Chem Phys. 2004;120(24):11919–11929. doi:10.1063/1.1755656
56. Hamelberg D, de Oliveira CAF, McCammon JA. Sampling of slow diffusive conformational transitions with accelerated molecular dynamics. J Chem Phys. 2007;127(15):10B614. doi:10.1063/1.2789432
57. Kappel K, Miao Y, McCammon JA. Accelerated molecular dynamics simulations of ligand binding to a muscarinic G-protein-coupled receptor. Q Rev Biophys. 2015;48(4):479–487. doi:10.1017/S0033583515000153
58. Shen T, Hamelberg D. A statistical analysis of the precision of reweighting-based simulations. J Chem Phys. 2008;129(3):034103. doi:10.1063/1.2944250
59. Miao Y, Nichols SE, McCammon JA. Free energy landscape of G-protein coupled receptors, explored by accelerated molecular dynamics. Phys Chem Chem Phys. 2014;16(14):6398–6406. doi:10.1039/c3cp53962h
60. Jiang W, Thirman J, Jo S, Roux B. Reduced free energy perturbation/hamiltonian replica exchange molecular dynamics method with unbiased alchemical thermodynamic axis. J Phys Chem B. 2018;122(41):9435–9442. doi:10.1021/acs.jpcb.8b03277
61. Miao Y, Feher VA, McCammon JA. Gaussian accelerated molecular dynamics: unconstrained enhanced sampling and free energy calculation. J Chem Theory Comput. 2015;11(8):3584–3595. doi:10.1021/acs.jctc.5b00436
62. Pang YT, Miao Y, Wang Y, McCammon JA. Gaussian accelerated molecular dynamics in NAMD. J Chem Theory Comput. 2017;13(1):9–19. doi:10.1021/acs.jctc.6b00931
63. Miao Y, Sinko W, Pierce L, Bucher D, Walker RC, McCammon JA. Improved reweighting of accelerated molecular dynamics simulations for free energy calculation. J Chem Theory Comput. 2014;10(7):2677–2689. doi:10.1021/ct500090q
64. Tyagi C, Marik T, Vagvolgyi C, Kredics L, Otvos F. Accelerated molecular dynamics applied to the peptaibol folding problem. Int J Mol Sci. 2019;20(17):4268. doi:10.3390/ijms20174268
65. East KW, Newton JC, Morzan UN, et al. Allosteric motions of the CRISPR–Cas9 HNH nuclease probed by NMR and molecular dynamics. J Am Chem Soc. 2020;142(3):1348–1358. doi:10.1021/jacs.9b10521
66. Ricci CG, Chen JS, Miao Y, et al. Deciphering off-target effects in CRISPR-Cas9 through accelerated molecular dynamics. ACS Cent Sci. 2019;5(4):651–662. doi:10.1021/acscentsci.9b00020
67. Miao Y, McCammon JA. Graded activation and free energy landscapes of a muscarinic G-protein–coupled receptor. Proc Natl Acad Sci. 2016;113(43):12162–12167. doi:10.1073/pnas.1614538113
68. Wang YT, Chan YH. Understanding the molecular basis of agonist/antagonist mechanism of human mu opioid receptor through gaussian accelerated molecular dynamics method. Sci Rep. 2017;7(1):7828. doi:10.1038/s41598-017-08224-2
69. Liao JM, Wang YT. In silico studies of conformational dynamics of Mu opioid receptor performed using gaussian accelerated molecular dynamics. J Biomol Struct Dyn. 2018:1–12.
70. Miao Y, Bhattarai A, Nguyen ATN, Christopoulos A, May LT. Structural basis for binding of allosteric drug leads in the adenosine A1 receptor. Sci Rep. 2018;8(1):16836. doi:10.1038/s41598-018-35266-x
71. Pawnikar S, Miao Y. Pathway and mechanism of drug binding to chemokine receptors revealed by accelerated molecular simulations. Future Med Chem. 2020;12(13):1213–1225. doi:10.4155/fmc-2020-0044
72. Moffett AS, Shukla D. Structural consequences of multisite phosphorylation in the BAK1 kinase domain. Biophys J. 2020;118(3):698–707. doi:10.1016/j.bpj.2019.12.026
73. Koh A, Gibbon MJ, Van der Kamp MW, Pudney CR, Gebhard S. Conformation control of the histidine kinase BceS of Bacillus subtilis by its cognate ABC-transporter facilitates need-based activation of antibiotic resistance. Mol Microbiol. 2020.
74. Miao Y, McCammon JA. Gaussian accelerated molecular dynamics: theory, implementation and applications. Annu Rep Comp Chem. 2017;13:231–278.
75. Chuang CH, Chiou SJ, Cheng TL, Wang YT. A molecular dynamics simulation study decodes the Zika virus NS5 methyltransferase bound to SAH and RNA analogue. Sci Rep. 2018;8(1):6336. doi:10.1038/s41598-018-24775-4
76. Sibener LV, Fernandes RA, Kolawole EM, et al. Isolation of a structural mechanism for uncoupling T cell receptor signaling from peptide-MHC binding. Cell. 2018;174(3):672–687 e627. doi:10.1016/j.cell.2018.06.017
77. Park JB, Kim YH, Yoo Y, et al. Structural basis for arginine glycosylation of host substrates by bacterial effector proteins. Nat Commun. 2018;9(1):4283. doi:10.1038/s41467-018-06680-6
78. Miao Y, McCammon JA. Mechanism of the G-protein mimetic nanobody binding to a muscarinic G-protein-coupled receptor. Proc Natl Acad Sci. 2018;115(12):3036–3041. doi:10.1073/pnas.1800756115
79. Palermo G, Miao Y, Walker RC, Jinek M, McCammon JA. CRISPR-Cas9 conformational activation as elucidated from enhanced molecular simulations. Proc Natl Acad Sci. 2017;114(28):7260–7265. doi:10.1073/pnas.1707645114
80. Bhattarai A, Wang J, Miao Y. G-protein-coupled receptor-membrane interactions depend on the receptor activation state. J Comput Chem. 2019;41:460–471. doi:10.1002/jcc.26082
81. Bhattarai A, Miao Y. Gaussian accelerated molecular dynamics for elucidation of drug pathways. Expert Opin Drug Dis. 2018;13(11):1055–1065. doi:10.1080/17460441.2018.1538207
82. Miao Y, Bhattarai A, Wang J. Ligand Gaussian accelerated molecular dynamics (LiGaMD): characterization of ligand binding thermodynamics and kinetics. J Chem Theory Comput. 2020;16(9):5526–5547. doi:10.1021/acs.jctc.0c00395
83. Wang J, Miao Y. Peptide Gaussian accelerated molecular dynamics (Pep-GaMD): enhanced sampling and free energy and kinetics calculations of peptide binding. J Chem Phys. 2020;153(15):154109. doi:10.1063/5.0021399
84. Bhattarai A, Pawnikar S, Miao Y. Mechanism of ligand recognition by human ACE2 receptor. J Phys Chem Lett.12:48814-4822
85. Gao Y, Cao D, Pawnikar S, et al. Structure of the human respiratory syncytial virus M2-1 protein in complex with a short positive-sense gene-end RNA. Structure. 2020;28(9):979–990. e974. doi:10.1016/j.str.2020.07.001
86. Wang J, Lan L, Wu X, Xu L, Miao Y. Mechanism of RNA recognition by a Musashi RNA-binding protein. Curr Res Struct Biol.2022.4:10-20. doi:10.1016/j.crstbi.2021.12.002
87. Vanommeslaeghe K, MacKerell AD
88. Vanommeslaeghe K, Hatcher E, Acharya C, et al. CHARMM general force field: a force field for drug-like molecules compatible with the CHARMM all-atom additive biological force fields. J Comput Chem. 2010;31(4):671–690. doi:10.1002/jcc.21367
89. Duan Y, Wu C, Chowdhury S, et al. A point-charge force field for molecular mechanics simulations of proteins based on condensed-phase quantum mechanical calculations. J Comput Chem. 2003;24(16):1999–2012. doi:10.1002/jcc.10349
90. Cornell WD, Cieplak P, Bayly CI, et al. A second generation force field for the simulation of proteins, nucleic acids, and organic molecules (vol 117, pg 5179, 1995). J Am Chem Soc. 1996;118(9):2309. doi:10.1021/ja955032e
91. Balkwill F The significance of cancer cell expression of the chemokine receptor CXCR4.
92. Koelink PJ, Overbeek SA, Braber S, et al. Targeting chemokine receptors in chronic inflammatory diseases: an extensive review. Pharmacol Ther. 2012;133(1):1–18.
93. Qin L, Kufareva I, Holden LG, et al. Crystal structure of the chemokine receptor CXCR4 in complex with a viral chemokine. Science. 2015;347(6226):1117–1122. doi:10.1126/science.1261064
94. Wu B, Chien EY, Mol CD, et al. Structures of the CXCR4 chemokine GPCR with small-molecule and cyclic peptide antagonists. Science. 2010;330(6007):1066–1071. doi:10.1126/science.1194396
95. Zheng Y, Han GW, Abagyan R, et al. Structure of CC chemokine receptor 5 with a potent chemokine antagonist reveals mechanisms of chemokine recognition and molecular mimicry by HIV. Immunity. 2017;46(6):1005–1017. e1005. doi:10.1016/j.immuni.2017.05.002
96. Fricker SP. Physiology and pharmacology of plerixafor. Transfus Med Hemother. 2013;40(4):237–245. doi:10.1159/000354132
97. Allegretti M, Cesta MC, Locati M. Allosteric modulation of chemoattractant receptors. Front Immunol. 2016;7:170. doi:10.3389/fimmu.2016.00170
98. Rosenkilde MM, Gerlach L-O, Jakobsen JS, Skerlj RT, Bridger GJ, Schwartz TW. Molecular mechanism of amd3100 antagonism in the cxcr4 receptor transfer of binding site to the cxcr3 receptor. J Biol Chem. 2004;279(4):3033–3041. doi:10.1074/jbc.M309546200
99. Morris GM, Huey R, Lindstrom W, et al. AutoDock4 and AutoDockTools4: automated docking with selective receptor flexibility. J Comput Chem. 2009;30(16):2785–2791. doi:10.1002/jcc.21256
100. Hernández Prada JA, Ferreira AJ, Katovich MJ, et al. Structure-based identification of small-molecule angiotensin-converting enzyme 2 activators as novel antihypertensive agents. Hypertension. 2008;51(5):1312–1317. doi:10.1161/HYPERTENSIONAHA.107.108944
101. Huentelman MJ, Zubcevic J, Hernandez Prada JA, et al. Structure-based discovery of a novel angiotensin-converting enzyme 2 inhibitor. Hypertension. 2004;44(6):903–906. doi:10.1161/01.HYP.0000146120.29648.36
102. Lin JH, Perryman AL, Schames JR, McCammon JA. Computational drug design accommodating receptor flexibility: the relaxed complex scheme. J Am Chem Soc. 2002;124(20):5632–5633. doi:10.1021/ja0260162
103. Amaro RE, Baron R, McCammon JA. An improved relaxed complex scheme for receptor flexibility in computer-aided drug design. J Comput Aided Mol Des. 2008;22(9):693–705. doi:10.1007/s10822-007-9159-2
104. Amaro RE, Baudry J, Chodera J, et al. Ensemble docking in drug discovery. Biophys J. 2018;114(10):2271–2278. doi:10.1016/j.bpj.2018.02.038
105. Diez-Domingo J, Perez-Yarza EG, Melero JA, et al. Social, economic, and health impact of the respiratory syncytial virus: a systematic search. BMC Infect Dis. 2014;14:544. doi:10.1186/s12879-014-0544-x
106. Bohmwald K, Espinoza JA, Rey-Jurado E, et al. Human respiratory syncytial virus: infection and pathology. Semin Respir Crit Care Med. 2016;37(4):522–537. doi:10.1055/s-0036-1584799
107. Nair H, Nokes DJ, Gessner BD, et al. Global burden of acute lower respiratory infections due to respiratory syncytial virus in young children: a systematic review and meta-analysis. Lancet. 2010;375(9725):1545–1555. doi:10.1016/S0140-6736(10)60206-1
108. Shi T, McAllister DA, O’Brien KL, et al. Global, regional, and national disease burden estimates of acute lower respiratory infections due to respiratory syncytial virus in young children in 2015: a systematic review and modelling study. Lancet. 2017;390(10098):946–958. doi:10.1016/S0140-6736(17)30938-8
109. Kudinov AE, Karanicolas J, Golemis EA, Boumber Y. Musashi RNA-binding proteins as cancer drivers and novel therapeutic targets. Clin Cancer Res. 2017;23(9):2143–2153. doi:10.1158/1078-0432.CCR-16-2728
110. Zgarbová M, Otyepka M, Šponer J, et al. Refinement of the Cornell et al. Nucleic acids force field based on reference quantum chemical calculations of glycosidic torsion profiles. J Chem Theory Comput. 2011;7(9):2886–2902. doi:10.1021/ct200162x
111. Guillain F, Thusius D. Use of proflavine as an indicator in temperature-jump studies of the binding of a competitive inhibitor to trypsin. J Am Chem Soc. 1970;92(18):5534–5536. doi:10.1021/ja00721a051
112. Wu X, Knudsen B, Feller SM, et al. Structural basis for the specific interaction of lysine-containing proline-rich peptides with the N-terminal SH3 domain of c-Crk. Structure. 1995;3(2):215–226. doi:10.1016/S0969-2126(01)00151-4
113. Ahmad M, Helms V. How do proteins associate? A lesson from SH3 domain. Chem Cent J. 2009;3(S1):O22. doi:10.1186/1752-153X-3-S1-O22
114. Ball LJ, Kuhne R, Schneider-Mergener J, Oschkinat H. Recognition of proline-rich motifs by protein-protein-interaction domains. Angew Chem Int Ed Engl. 2005;44(19):2852–2869. doi:10.1002/anie.200400618
115. Xue Y, Yuwen T, Zhu F, Skrynnikov NR. Role of electrostatic interactions in binding of peptides and intrinsically disordered proteins to their folded targets. 1. NMR and MD characterization of the complex between the c-Crk N-SH3 domain and the peptide Sos. Biochemistry. 2014;53(41):6473–6495. doi:10.1021/bi500904f
116. Wang J, Alekseenko A, Kozakov D, Miao Y. Improved modeling of peptide-protein binding through global docking and accelerated molecular dynamics simulations. Front Mol Biosci. 2019;6:112. doi:10.3389/fmolb.2019.00112
117. Wang Y-T, Cheng T-L. Computational modeling of cyclic peptide inhibitor–MDM2/MDMX binding through global docking and Gaussian accelerated molecular dynamics simulations. J Biomol Struct Dyn. 2020;1–10. doi:10.1080/07391102.2020.1773317
118. Miao Y, Feixas F, Eun C, McCammon JA. Accelerated molecular dynamics simulations of protein folding. J Comput Chem. 2015;36(20):1536–1549. doi:10.1002/jcc.23964
 © 2022 The Author(s). This work is published and licensed by Dove Medical Press Limited. The
full terms of this license are available at https://www.dovepress.com/terms
and incorporate the Creative Commons Attribution
- Non Commercial (unported, 3.0) License.
By accessing the work you hereby accept the Terms. Non-commercial uses of the work are permitted
without any further permission from Dove Medical Press Limited, provided the work is properly
attributed. For permission for commercial use of this work, please see paragraphs 4.2 and 5 of our Terms.
© 2022 The Author(s). This work is published and licensed by Dove Medical Press Limited. The
full terms of this license are available at https://www.dovepress.com/terms
and incorporate the Creative Commons Attribution
- Non Commercial (unported, 3.0) License.
By accessing the work you hereby accept the Terms. Non-commercial uses of the work are permitted
without any further permission from Dove Medical Press Limited, provided the work is properly
attributed. For permission for commercial use of this work, please see paragraphs 4.2 and 5 of our Terms.