Back to Journals » Pharmacogenomics and Personalized Medicine » Volume 16
BICDL1 Predicts Poor Prognosis and is Correlated with Methylation and Immune Infiltration in Colorectal Cancer
Authors Luo H ![]() , Luo J, Ding N, Zhang T, He Y
, Luo J, Ding N, Zhang T, He Y
Received 25 August 2023
Accepted for publication 11 December 2023
Published 22 December 2023 Volume 2023:16 Pages 1109—1126
DOI https://doi.org/10.2147/PGPM.S424209
Checked for plagiarism Yes
Review by Single anonymous peer review
Peer reviewer comments 2
Editor who approved publication: Dr Martin H Bluth
Hongbiao Luo,1,2,* Ji Luo,3,* Ning Ding,1 Tao Zhang,1 Yongheng He1,4
1Graduate School, Hunan University of Chinese Medicine, Changsha, Hunan, 410208, People’s Republic of China; 2Department of Anorectal Surgery, Chenzhou NO. 1 People’s Hospital, Chenzhou, Hunan, 423000, People’s Republic of China; 3Hunan Key Laboratory of Chinese Medicine on Oncology, Affiliated Hospital of Hunan Academy of Chinese Medicine, Changsha, Hunan, 410006, People’s Republic of China; 4Department of Anorectal Surgery, Affiliated Hospital of Hunan Academy of Traditional Chinese Medicine, Changsha, Hunan, 410006, People’s Republic of China
*These authors contributed equally to this work
Correspondence: Yongheng He, Department of Anorectal Surgery, Affiliated Hospital of Hunan Academy of Traditional Chinese Medicine, 58 Lushan Road, Yuelu District, Changsha, Hunan, 410006, People’s Republic of China, Tel +86-13517401858, Email [email protected]
Background: Bicaudal-D (BICD) Family Like Cargo Adaptor 1 (BICDL1) is an essential component of the molecular mechanism during neuronal development. However, BICDL1 has not been reported in cancer. Using bioinformatics analysis, we systematically evaluated the potential role of BICDL1 in CRC.
Methods: Colorectal cancer (CRC) and normal tissue samples were retrieved from the Gene Expression Omnibus (GEO), Genotype-Tissue Expression (GTEx), and Cancer Genome Atlas (TCGA) databases. Kaplan–Meier (K-M) analysis, nomogram, COX analysis, and receiver operating characteristic (ROC) curves were used to evaluate the prognostic power. Correlation analysis was also conducted to explore the correlation between mRNA expression and the methylation level of BICDL1 using cBioPortal, and the correlation between immune infiltration and BICDL1. RT-qPCR and Western blot assays were performed to analyze BICDL1 expression level between human colorectal cancer cell lines and normal colonic epithelial cells.
Results: BICDL1 had a higher expression in CRC tissues than in normal tissues (p < 0.001) in TCGA and GES 74602 datasets. Kaplan-Meier survival analysis revealed that patients with high BICDL1 expression had lower overall survival (OS) (1.53, 95% confidence interval: 1.07– 2.17, p=0.019). The ROC curves demonstrated that BICDL1 has high specificity and efficiency in diagnosis (AUC=0.919, CI: 0.895– 0.943). The expression level of BICDL1 was significantly correlated with the infiltrating levels of Treg (R=0.146, p < 0.001), TFH (R=0.080, p=0.043), NK CD56bright cells (R=0.149, p < 0.001), aDC (R=0.095, p=0.016), and T helper cell infiltration (R=− 0.084, p=0.034). The correlation between BICDL1 expression and methylation levels was negative (R2=0.134, p < 0.001), and CRC patients had lower methylation levels than normal people (p=0.036). BICDL1 mRNA and its protein expression levels in CRC cell lines (SW620) was markedly increased compared with that of normal colonic epithelial cells (NCM460) (p < 0.001).
Conclusion: BICDL1 may be a potential biomarker for evaluating immune infiltration levels and prognosis of CRC.
Keywords: colorectal cancer, BICDL1, prognosis, biomarker, immune infiltration, methylation
Introduction
Colorectal cancer (CRC) is among the most prevalent gastrointestinal cancers worldwide. According to the statistics released by the International Agency for Research on Cancer in 2018, CRC ranks second in terms of cancer-related mortality and third in terms of morbidity worldwide.1 Owing to the rapid development of the social economy and increasing aging population in China, the incidence of CRC is increasing each year, ranking third in morbidity and fourth in mortality; thus, CRC is a serious threat to people’s health.2,3 Currently, the principal therapy for CRC is primarily based on radical surgical resection alone or in combination with adjuvant chemotherapy.4 However, hundreds of thousands of people die from CRC every year worldwide.2 The high mortality rate of CRC can be explained by its hidden onset and lack of specific symptoms.5 Thus, an urgent need exists to understand the mechanisms that promote cancer development and identify effective therapeutic targets for its treatment and prevention.
Bicaudal-D (BICD) Family Like Cargo Adaptor 1 (BICDL1) encodes proteins belonging to the BICD protein family. BICD was first identified in the Drosophila.6 BICD is an evolutionarily conserved motor adaptor protein that controls the relationship between various cellular cargo molecules and molecular motors.7 BICDL1 is predominantly expressed during early embryonic growth and regulates neurite outgrowth in neural and renal tissues.8 However, BICDL1 and its underlying mechanism in tumors have not been revealed.
Using data from The Cancer Genome Atlas (TCGA) database, the present study aimed to assess the clinical prognosis of BICDL1 mRNA expression levels in CRC patients. BICDL1 mRNA overexpression in patients with CRC and its relation to survival were evaluated to provide a deeper understanding of CRC pathology. In addition, Gene Ontology (GO), Kyoto Encyclopedia of Genes and Genomes (KEGG), and Gene Set Enrichment Analysis (GSEA) were conducted to obtain a deeper understanding of the biological function of BICDL1 in CRC development. To demonstrate the importance of BICDL1 in the immune microenvironment, we investigated the association of BICDL1 with immune cells using immune infiltration analysis. Finally, BICDL1 methylation levels were evaluated to provide a reference for identifying novel targets for clinical CRC therapy.
Materials and Methods
Data Acquisition
All clinical mRNA expression data were obtained from TCGA database using UCSC Xena (https://xenabrowser.net/datapages/). The corresponding normal tissue data were retrieved from Genotype-Tissue Expression (GTEx), a public resource that includes data from 53 normal tissues of nearly 1000 individuals. The RNA-seq data format was transformed to transcripts per million reads (TPM) for expression comparison between samples. The TPM format of the RNA-seq data from GTEx and TCGA was handled using the Toil RNA-seq pipeline.9 For the microarray dataset, GSE74602 was obtained from the published datasets available in the Gene Expression Omnibus (GEO) Database (https://www.ncbi.nlm.nih.gov/geo/). The initial files were downloaded to calculate BICDL1 mRNA expression levels. All gene expression data were log2 (TPM+1) transformed before further analysis. Human single nucleotide polymorphism (SNP) data were also downloaded from TCGA data portal. Mutated genes were identified from the downloaded CRC sample SNP data.
Identification of Differentially Expressed Genes (DEGs)
Patients with CRC were divided into high- and low-expression groups according to the BICDL1 median expression value of CRC samples from TCGA. Using the DESeq2 Package software in R, comparisons were conducted between the expression profiles (HTSeq-TPM) of the low- and high- BICDL1 mRNA expression groups to classify DEGs.10 For the DEGs, the threshold was determined based on genes with FDR<0.05 and |logFC|>1.
Gene Ontology (GO) and Kyoto Encyclopedia of Genes and Genomes (KEGG) Analysis
KEGG and GO pathway analyses were performed to describe the gene function annotations.11,12 Ontology is divided into three parts: (i) Biological processes, the processes performed by gene products or genes; (ii) Cellular components, the sites performing gene product activities; and (iii) molecular function (MF), the molecular activities of the gene products. GO analysis was performed to enrich the functions of the co-expressed DEGs. KEGG and GO analyses and visualizations were performed using the metafor package in R(clusterProfiler, ggplot2).13,14 Only genes with a p.adj<0.05 and qvalue<0.2 were regarded as significant.
Gene Set Enrichment Analysis (GSEA)
GSEA has recently emerged as a novel analytical approach for profiling gene expression.15 GSEA reveals general biological pathways by focusing on gene sets to explicate the gene expression data. GSEA was performed using the R package clusterProfiler.13 In this study, c2.cp.v7.2. symbols.gmt was retrieved from the MSigDB Collection of reference genes. A normalized enrichment score (|NES|) > 1, false discovery rate (FDR) < 0.25, and adapted p < 0.05 were considered to be significantly enriched.
Analysis of Immune Cell Infiltration and Its Relationship with BICDL1 Expression
The infiltration levels of 22 immune cells (activated mast cells, resting and activated natural killer (NK) cells, gamma-delta T cells, monocytes, M2 macrophages, M0 macrophages, M1 macrophages, resting dendritic cells, activated dendritic cells, resting mast cells, naïve CD4+ T cells, follicular helper T cells, activated memory CD4+ T cells, resting memory CD4+ T cells, CD8+ T cells, plasma cells, memory B cells, naïve B cells, regulatory T cells (Tregs), activated mast cells, eosinophils, and neutrophils) were quantified using Single-Sample GSEA(ssGSEA).16 The calculation of ssGSEA scores used GSVA package. ssGSEA scores were calculated using the GSVA package. The Laplace map is a visual method for immune infiltration analysis that enables the evaluation of the relationship between multiple immune cells and a single gene. An immune infiltration scatter plot was used to evaluate the relationship between individual genes and immune cell infiltration. Moreover, immune infiltration-grouping comparison was applied to explore the difference in immune cell infiltration between groups with low and high expression after a single gene was separated into low- and high-expression groups based on the median.
Analysis of BICDL1 Methylation
Methylation levels and copy number variation (CNV) data for BICDL1 were obtained using the cBioPortal web platform (https://www.cbioportal.org/). The relationship between BICDL1 expression and BICDL1 methylation level was determined. Differences in BICDL1 mRNA expression were analyzed in normal and cancerous colon tissues in TCGA using the UALCAN online tool (https://ualcan.path.uab.edu/).
Survival Analysis
Kaplan–Meier (K‒M) survival analysis is an approach for analyzing and extrapolating organisms’ or people’s survival time, mainly according to data obtained via trials or surveys, and investigating the association between survival time and the results with numerous affecting factors and the magnitude of their effects.17 Here, prognostic gene expression was targeted, and the genes were classified into 2 groups, low- and high-risk groups, to investigate the changes in prognostic gene expression in CRC prognosis. The analysis results were presented as survival curves.
Cell Lines and Culture
The CRC cell lines (HCT116, SW620, and RKO) and normal colonic epithelial cells (NCM460) were purchased from the Cell Bank of the Chinese Academy of Sciences (Shanghai, China) and their authenticity was verified via short tandem repeat sequence analysis. HCT116 and SW620 cell lines were cultured and maintained in Dulbecco’s modified Eagle’s medium (DMEM; Gibco, Carlsbad, CA, USA) containing 10% fetal bovine serum (Gibco), 1 U/mL penicillin G and 1 ug/mL streptomycin at 37 °C in a 5% CO2 humidified atmosphere. The RKO cell lines were cultured in MEM while the NCM460 cell line was cultured in 1640. The culture conditions were the same as those used for the HCT116 and SW620 cell lines.
Quantitative Polymerase Chain Reaction (q-PCR)
Cellular RNA was extracted using TRIzol reagent. cDNA was prepared via reverse transcription of extracted RNA. Real-time quantitative PCR (qPCR) was performed to detect BICDL1 mRNA expression. The experiments were repeated at least three times, with five subwells for each sample. The primer sequences for BICDL1 were forward: GAGCTGGAGAGTGATGTGAAGC; reverse: TTGGTTCTGTTCCGACAGTTC.
Western Blotting
NCM460, HCT116, SW620, and RKO cells were lysed in a cell lysis solution for approximately 30 min. The lysed cells were then centrifuged at 4 °C (6000 g, 15 min), and the supernatant was removed after centrifugation and stored at −80 °C for further experiments. The protein concentration was determined using a bicinchoninic acid (BCA, Thermo Fisher Scientific) kit. Proteins were separated using Tris-glycine SDS-PAGE (12%, 130 V). The proteins were then transferred onto polyvinylidene fluoride (PVDF) membranes (Millipore, MA) via semi-dry electroblotting. After washing with TBST, the membranes were incubated overnight with the BICDL1 primary antibody at 4 °C. After incubation with the primary antibody, the membranes were incubated with root peroxidase coupled with the secondary antibody (Zsbio, Beijing, China) for 1 h. The visualized protein bands of the target protein were detected using a chemiluminescent substrate ECL kit (Merck Millipore, MA).
Statistical Analyses
All statistical calculations and analyses of the results were carried out using R software (https://www.r-project.org/, version 4.1.2). Differential expression analyses of unpaired samples were conducted using the Wilcoxon rank-sum test. BICDL1 expression in paired samples met the normality test; therefore, a paired sample T-test was conducted. Spearman correlation analysis was performed to investigate the correlations. The Wilcoxon rank-sum test was conducted to compare immune cell infiltration between groups (low BICDL1 expression vs high BICDL1 expression). Receiver operating characteristic (ROC) curve analysis was performed using the pROC package in the R software. Survival curves were predicted using the Kaplan-Meier approach, and the Log rank test was performed to evaluate differences. Univariate analyses were performed using the Kruskal–Wallis test, Mann–Whitney U-test, and Chi-square test, as appropriate. Statistical significance was set at p < 0.05 (two-sided). Significance: *p<0.05, **p<0.01, ***p<0.001; NS: not significant p>0.05. R (v.3.8.0) software was used for the statistical analysis.
Results
Research Flow
The analysis process of this work is displayed in Figure 1.
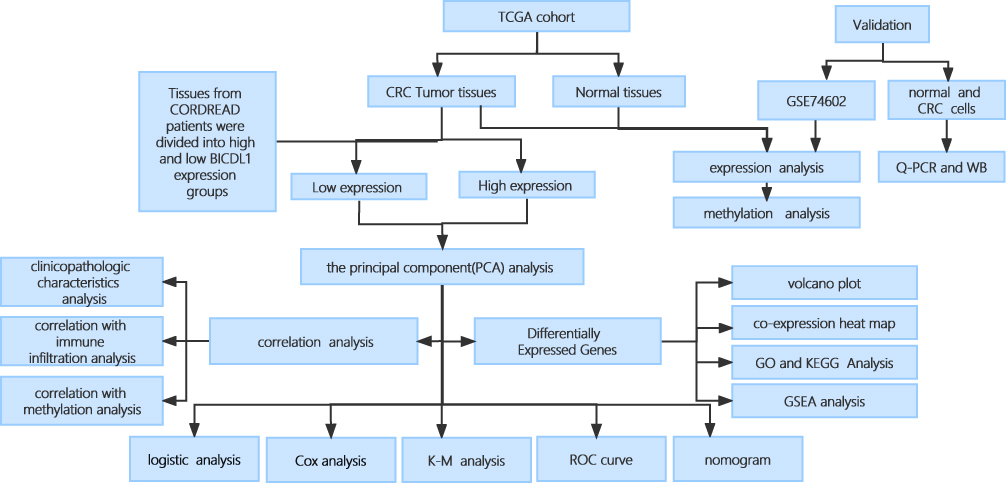 |
Figure 1 Flowchart. |
Pan-Cancer and BICDL1 mRNA Expression Analysis in CRC
To investigate BICDL1 mRNA expression in human tumors, we evaluated BICDL1 mRNA expression in pan-cancer TCGA datasets. The differential BICDL1 mRNA expression is shown in Figure 2A. BICDL1 mRNA expression in 19 cancer types in TCGA database was proposed to be higher than that in normal tissues. The 19 types of tumors included PRAD, READ, STAD, THCA, UCEC, KICH, KIRC, KIRP, LIHC, BRCA, CESC, CHOL, LUAD, LUSC, PCPG BLCA, COAD, ESCA, and GBM. We proceeded to evaluate the expression of BICDL1 in CRC. Compared to normal GTEX with TCGA and TCGA CRC specimens, BICDL1 was found to be significantly overexpressed in CRC samples (p < 0.001) (Figure 2B). Similarly, in CRC tissues, BICDL1 mRNA showed enhanced expression compared to that in normal tissues (p <0.001) (Figure 2D). Similarly, in GSE74602, BICDL1 expression was higher in CRC tissues than in normal tissues (Figure 2C).
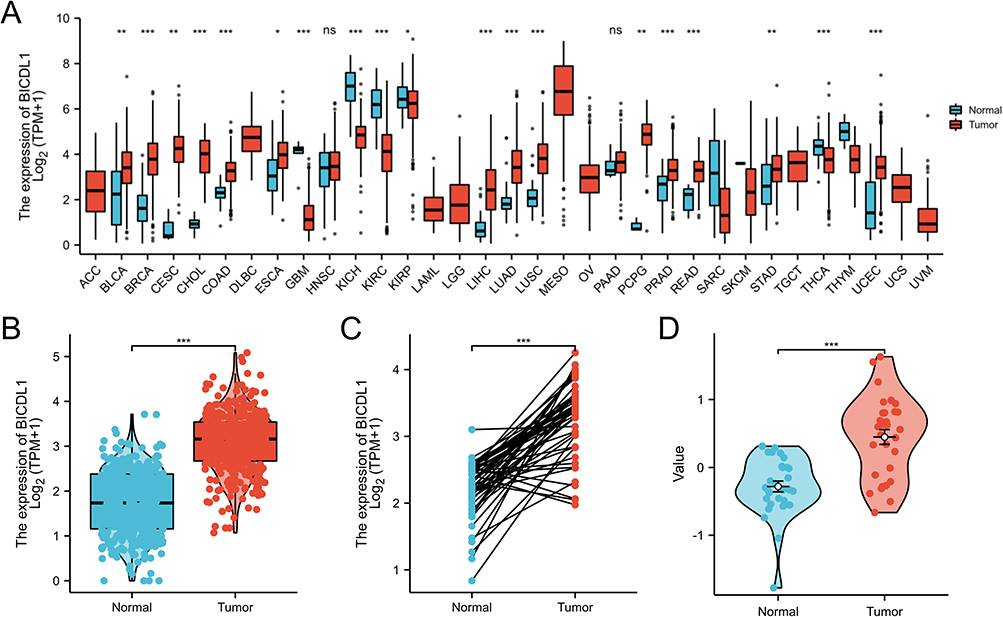 |
Figure 2 Differential expression map of BICDL1. (A) Differential expression of BICDL1 in tumor and normal tissues in TCGA pan-cancer data. (B) Expression of BICDL1 in GTEX combined with TCGA normal samples and TCGA colorectal cancer samples. (C) Expression of BICDL1 in CRC tissues and corresponding normal tissues in TCGA. (D) Expression of BICDL1 in GES74602. ns: p>0.05; *p<0.05; **p<0.01; ***p<0.001. |
Association Between BICDL1 Expression and Clinicopathologic Characteristics of CRC
To further explore the function of BICDL1 in CRC, we investigated the association between its expression and the clinicopathological features. Gene expression and the clinical results of 644 primary tumors were obtained from TCGA dataset (Table 1). The cohort of 644 patients included 343 men and 301 women, with a median age of 58 years. CRC patients were classified into BICDL1 low- and high-expression groups based on the median BICDL1 mRNA expression level. To explore the consistency between the low and high BICDL1 expression groups, we conducted principal component analysis (PCA), which showed consistent results (Figure 3A). Correlation analysis revealed that BICDL1 expression and M staging (p <0.001) were significantly correlated (Figure 3B), and BICDL1 mRNA expression was associated with CEA levels (Figure 3C), histological type (Figure 3D), primary therapy outcome (Figure 3E), and a history of colon polyps (Figure 3F). The correlation between BICDL1 expression and clinicopathological features, such as T classification (Figure 3G), N classification (Figure 3H), and clinical stage (Figure 3I), was determined. Thereafter, the correlation between BICDL1 expression and clinicopathological variables was determined using logistic regression analysis. The upregulation of BICDL1 in CRC was found to be significantly correlated with the T stage (p=0.011) and M stage (p=0.026) (Table 2). These findings indicate that increased BICDL1 expression is important for the malignant progression of CRC.
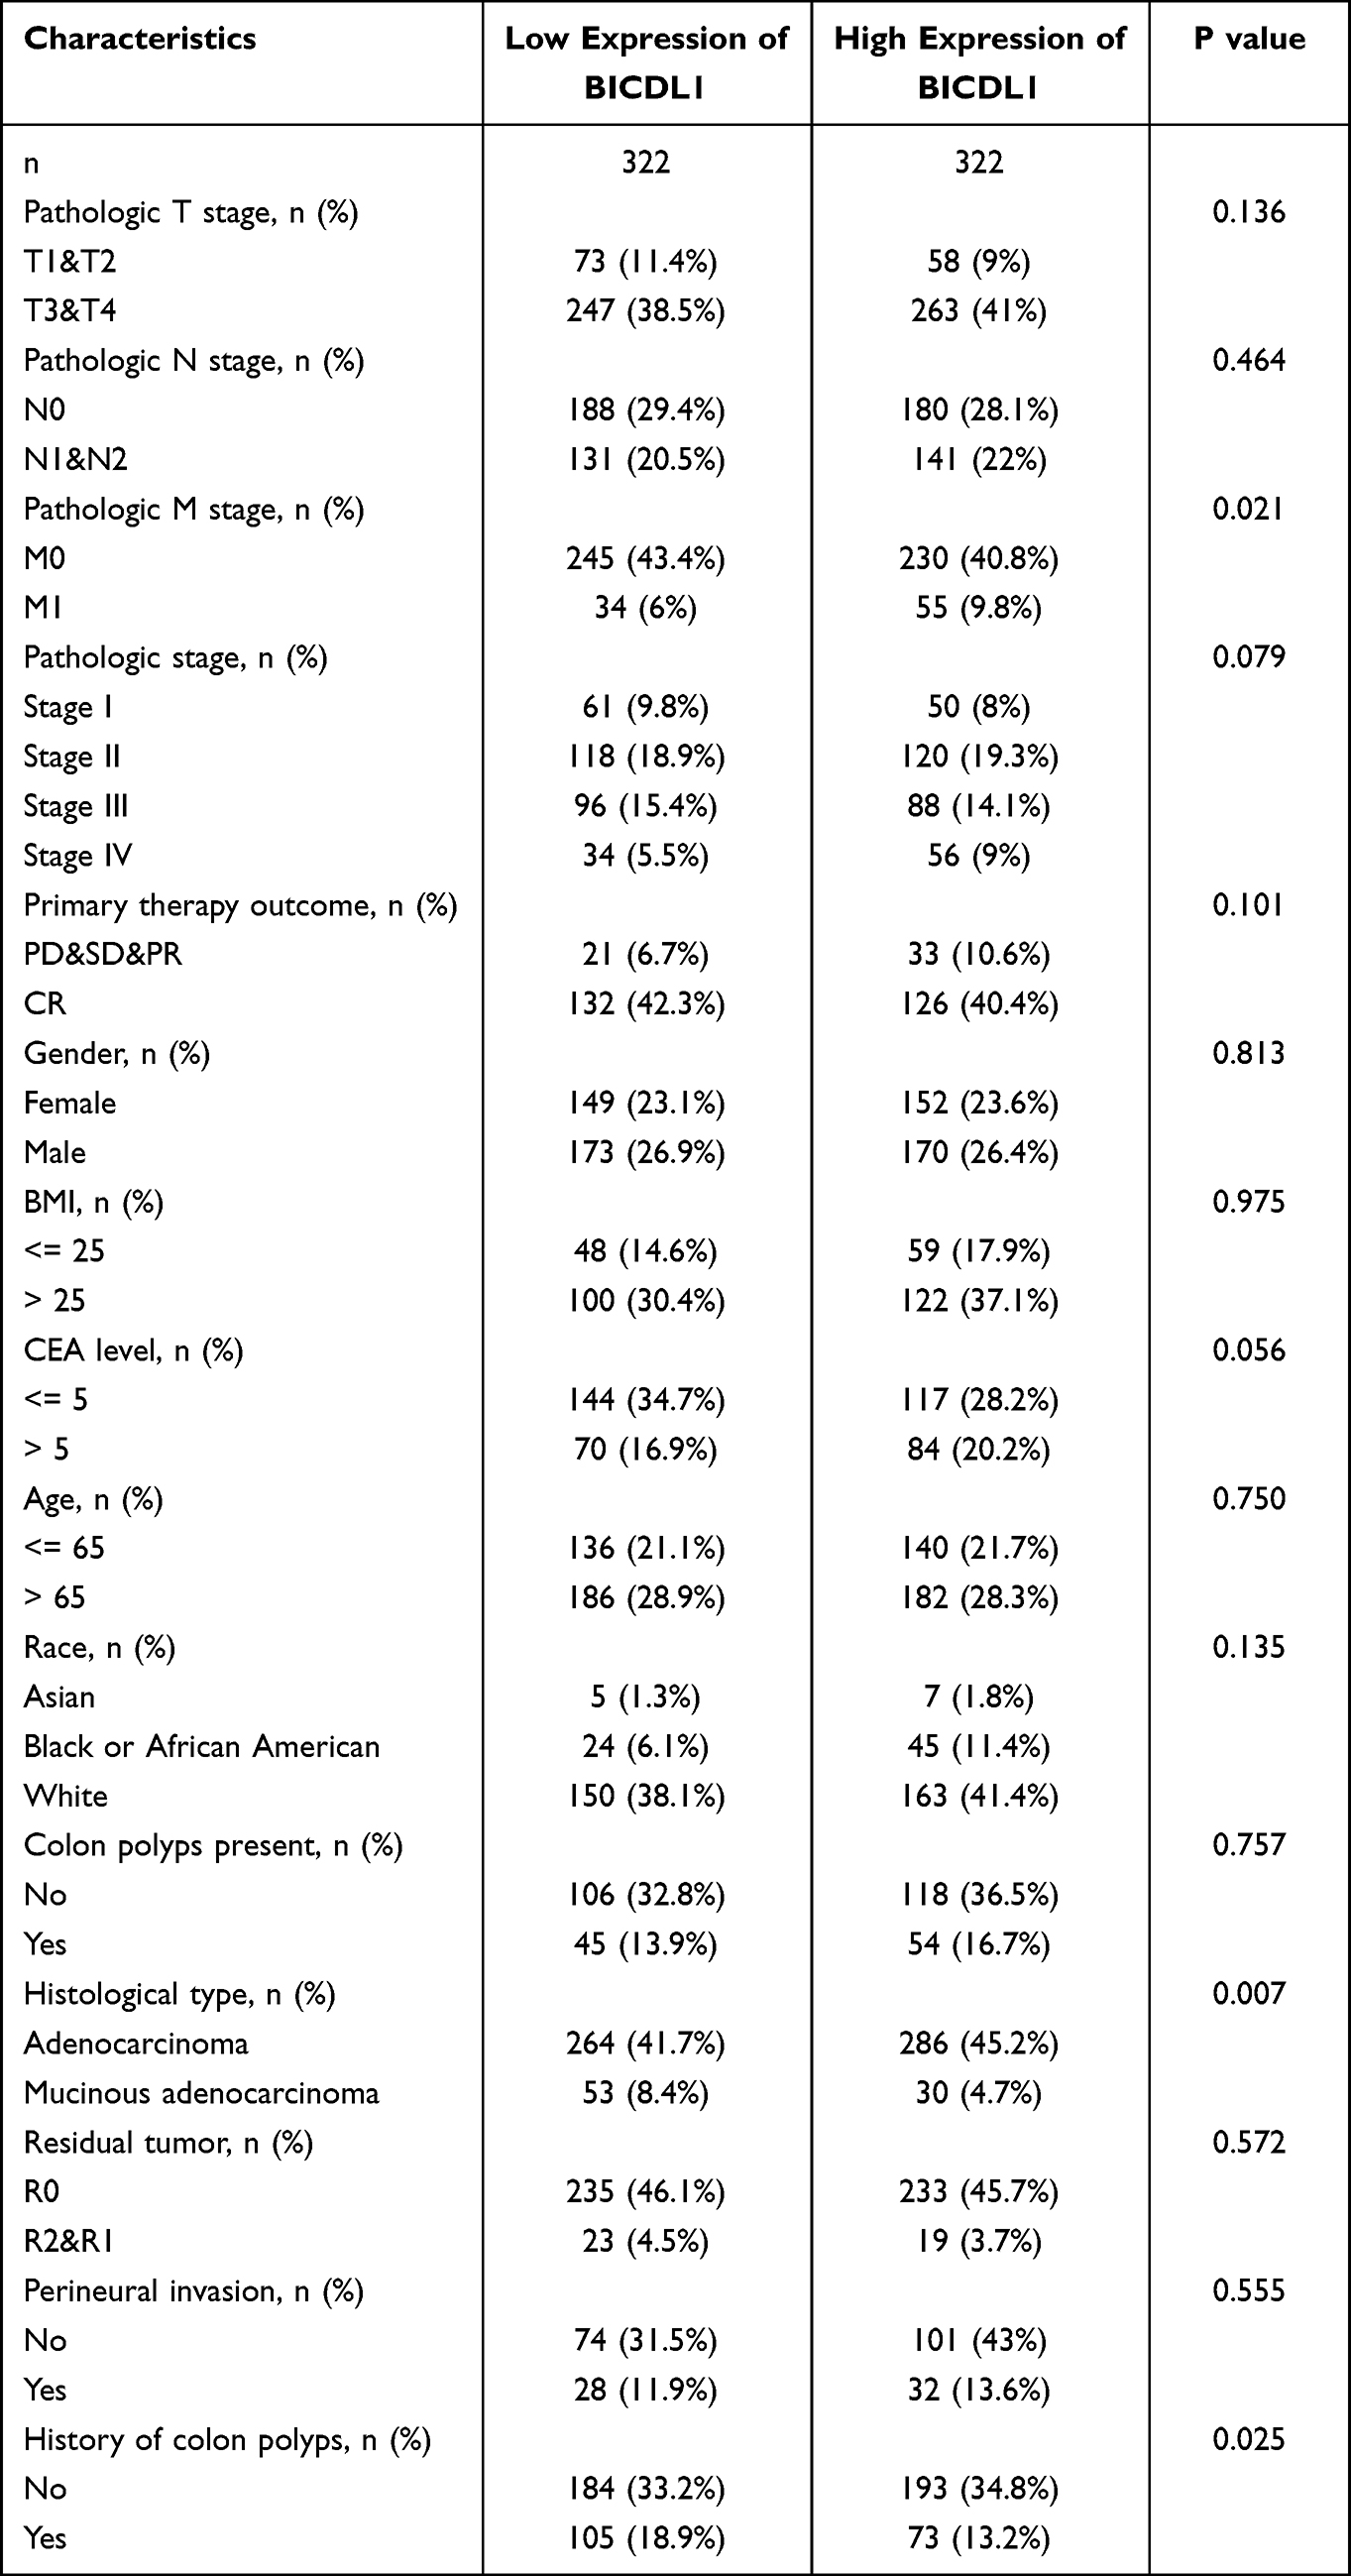 |
Table 1 Relationship Between BICDL1 mRNA Expression and Clinical Features of CRC Patients |
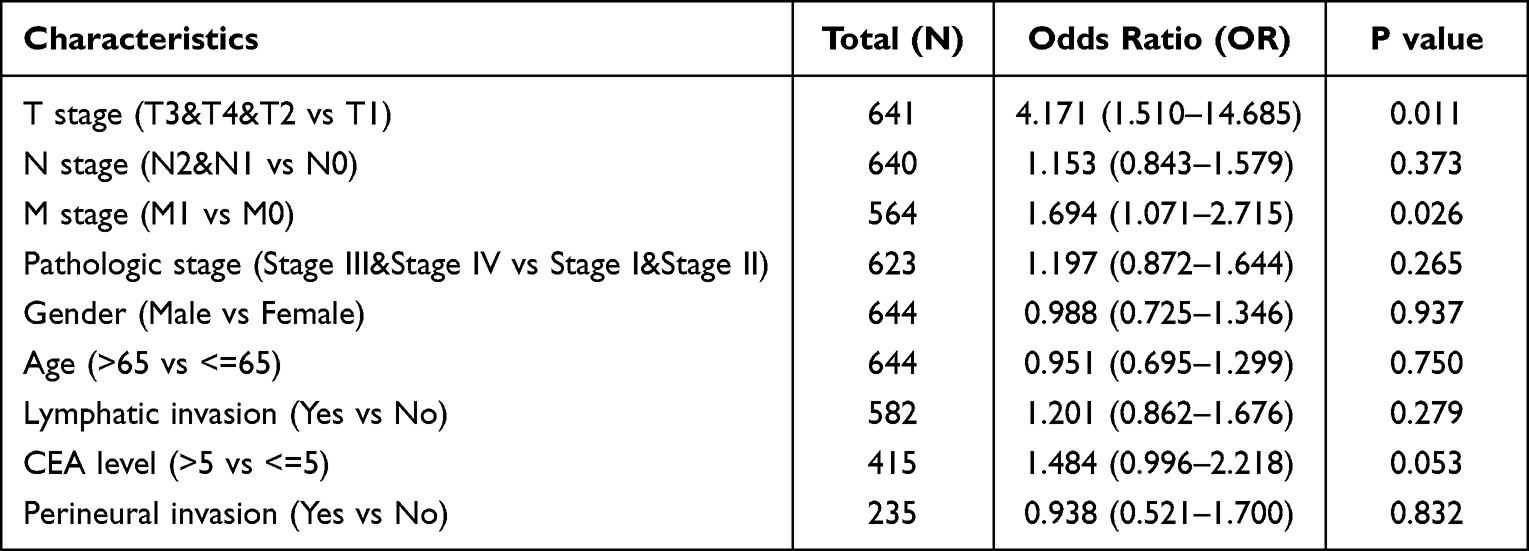 |
Table 2 Univariate Logistic Regression Analysis Between BICDL1 Expression and Clinicopathological Variables |
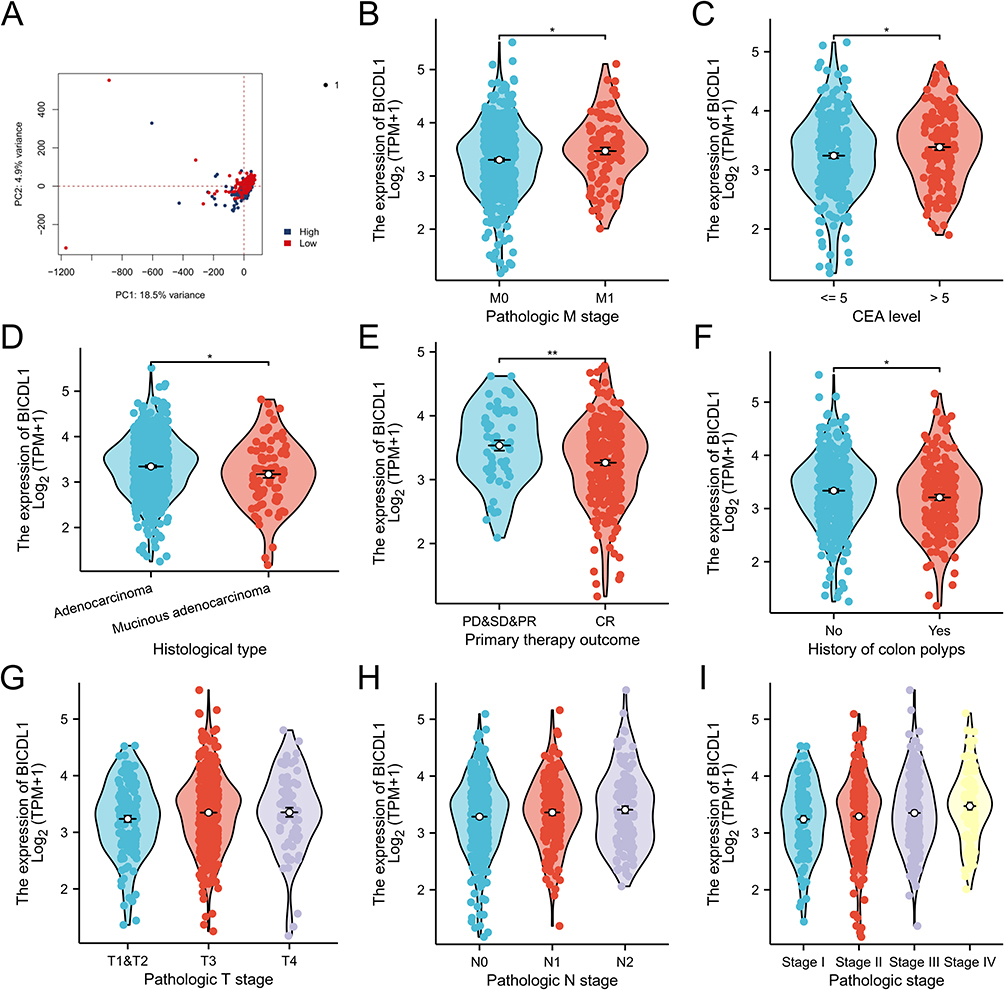 |
Figure 3 Correlations between the BICDL1 mRNA expression level and clinicopathological features. (A) PCA of CRC patients with different BICDL1 expression levels. (B) Association between BICDL1 expression and M classification. (C) Association between BICDL1 expression and CEA level. (D) Association between BICDL1 expression and histological type. (E) Association between BICDL1 expression and primary therapy outcome. (F) Association between BICDL1 expression and history of colon polyps. (G) Association between BICDL1 expression and T classification. (H) Association between BICDL1 expression and N classification. (I) Association between BICDL1 expression and clinical stages. *p< 0.05; **p<0.01. |
Clinical Value of BICDL1 in Prognosis
We proceeded to investigate the correlation between BICDL1 expression and survival in CRC patients. K-M analysis illustrated that patients with high BICDL1 expression had a lower overall survival (OS) in TCGA dataset than those with low BICDL1 expression (1.53, 95% confidence interval: 1.07–2.17, p=0.019, Figure 4A). The same result was noted in the PFS analysis (1.47, 95% confidence interval: 1.08–2.00, p=0.015, Figure 4B). Multivariate Cox and univariate analyses were used to assess independent prognostic factors affecting survival in patients with CRC. Univariate Cox analysis suggested the M and T stages. N stage, Age, CEA level, pathological stage, lymphatic invasion, and BICDL1 expression were significantly associated with the OS of patients with CRC (Table 3). Multivariate Cox analysis revealed that M stage was a prognostic factor independent of CRC OS (4.941, 95% confidence interval: 1.159–21.063, p =0.031). Age (4.188, 95% confidence interval: 1.290–13.598, p =0.017) was an independent prognostic factor for OS; however, BICDL1 was not an independent prognostic element for OS (1.924, 95% confidence interval: 0.528–7.015, p =0.322) (Table 3). The ROC curve demonstrated that the area below the ROC curve was 0.919, indicating the high diagnostic accuracy of BICDL1 in CRC (Figure 4C).
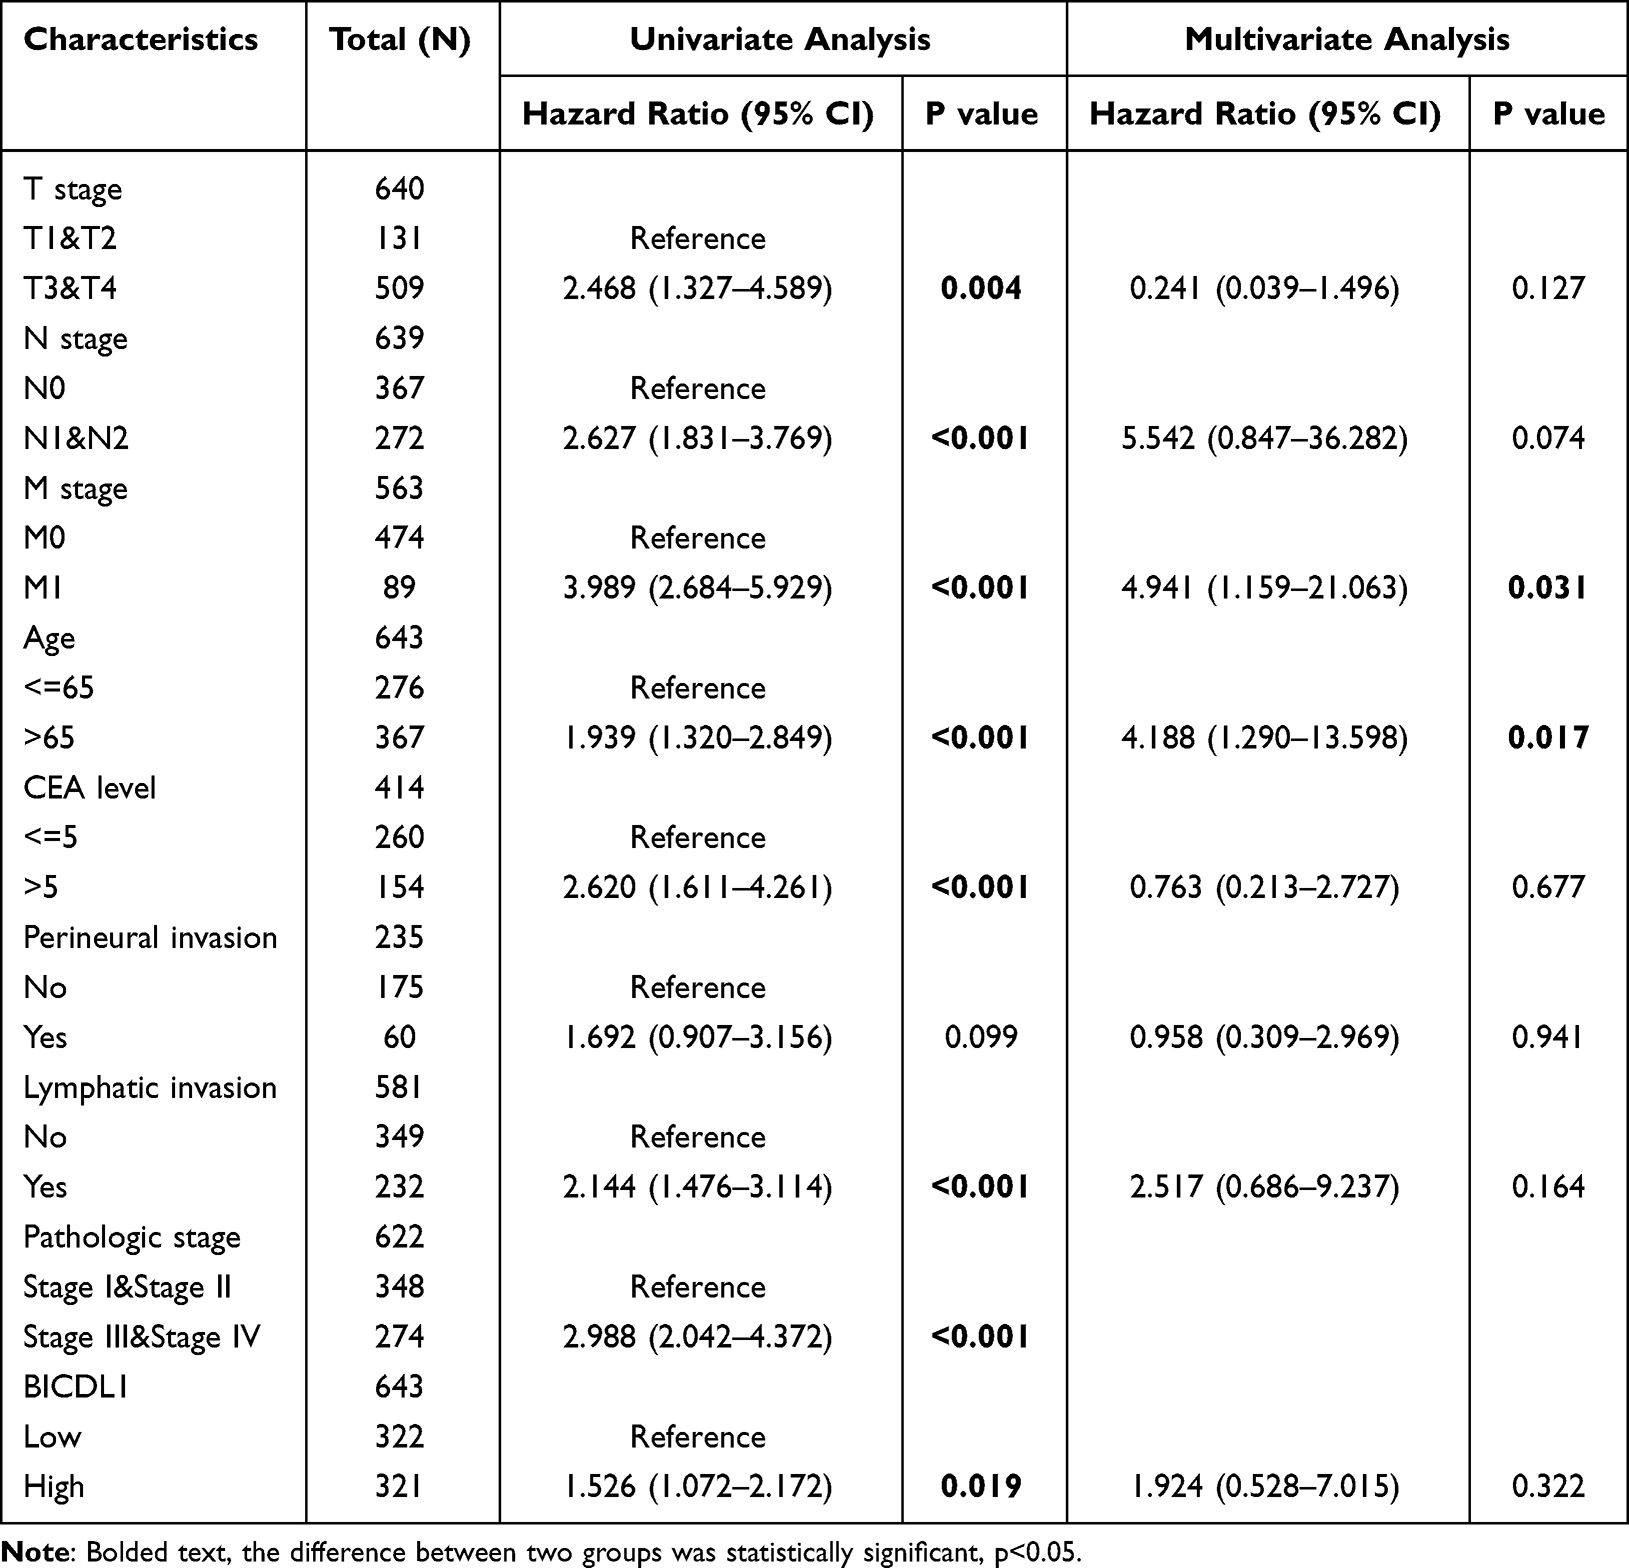 |
Table 3 Univariate and Multivariate Cox Analyses of BICDL1 Gene Expression |
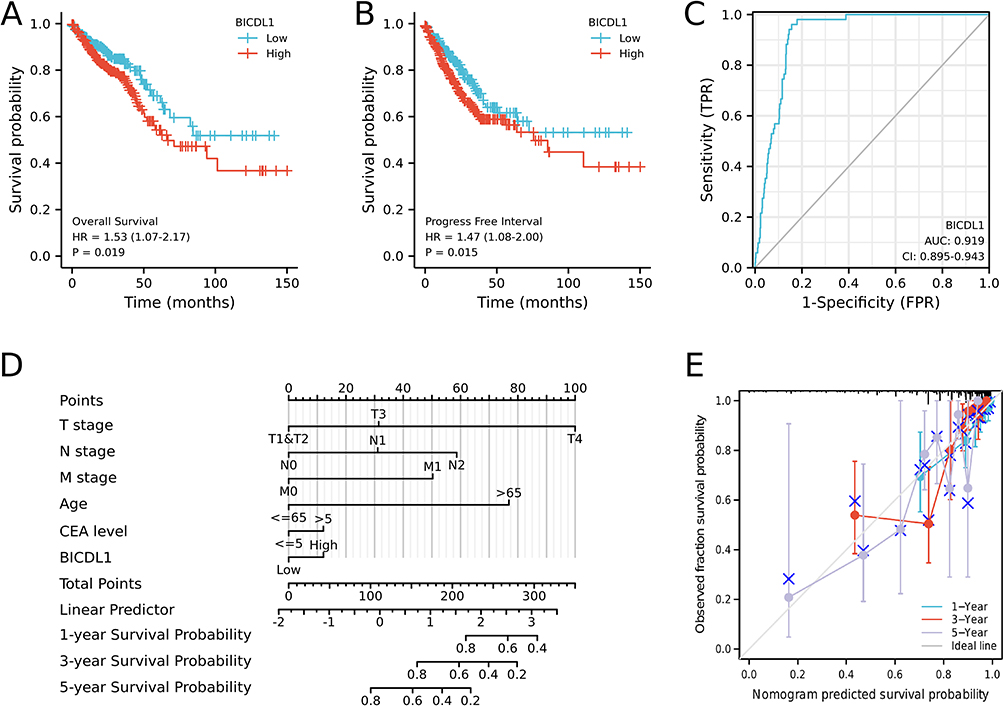 |
Figure 4 Survival analysis of BICDL1 in CRC. (A) Kaplan-Meier survival analysis illustrating that patients with high BICDL1 expression had a lower OS in TCGA dataset than patients with low BICDL1 expression. (B) Progress Free Interval curve of patients with high BICDL1 versus low BICDL1 expression. High BICDL1 predicts a poor prognosis. (C) The ROC curve analysis indicates the high diagnostic accuracy of BICDL1 in CRC. (D) Nomogram for predicting the probability of 1-, 3-, and 5-year OS for CRC patients. (E) Calibration plot of the nomogram for predicting the probability of OS at 1, 3, and 5 years. |
We constructed an OS prediction model using BICDL1 mRNA expression and resting clinicopathological features from TCGA data. Based on the Cox proportional hazards regression model, the M stage, N stage, T stage, age, CEA level, and BICDL1 expression were included in the OS nomogram (Figure 4D). A higher total number of points on the nomogram was associated with a worse prognosis. The C-index of the OS nomogram was 0.816 (Figure 4D). A calibration curve was also generated to calibrate the predicted model. The calibration curves of the nomogram confirmed that the predictive curves of 3-year and 5-year OS approached the ideal curve (Figure 4E).
DEG Analysis Co-Expression Networks
To explore the underlying mechanisms of BICDL1, we performed DEG analysis using samples with low- and high-BICDL1 expression. In TCGA, patients with CRC were divided into high and low BICDL1 expression groups. A total of 429 DEGs were identified via screening: 31 with high expression and 398 with low expression (Log2|FC|>1 and p.adj<0.05; Figure 5A and Box S1). The DEGs are displayed in a Heat Map (Figure S1) and volcano plots (Figure 5A). The top five upregulated DEGs were AQP5, XKR7, NMUR2, RIPPLY2, and KRT14 and the top five downregulated genes were H2BC3, IFNK, FBXO40, H4C3, and ANGPTL3.
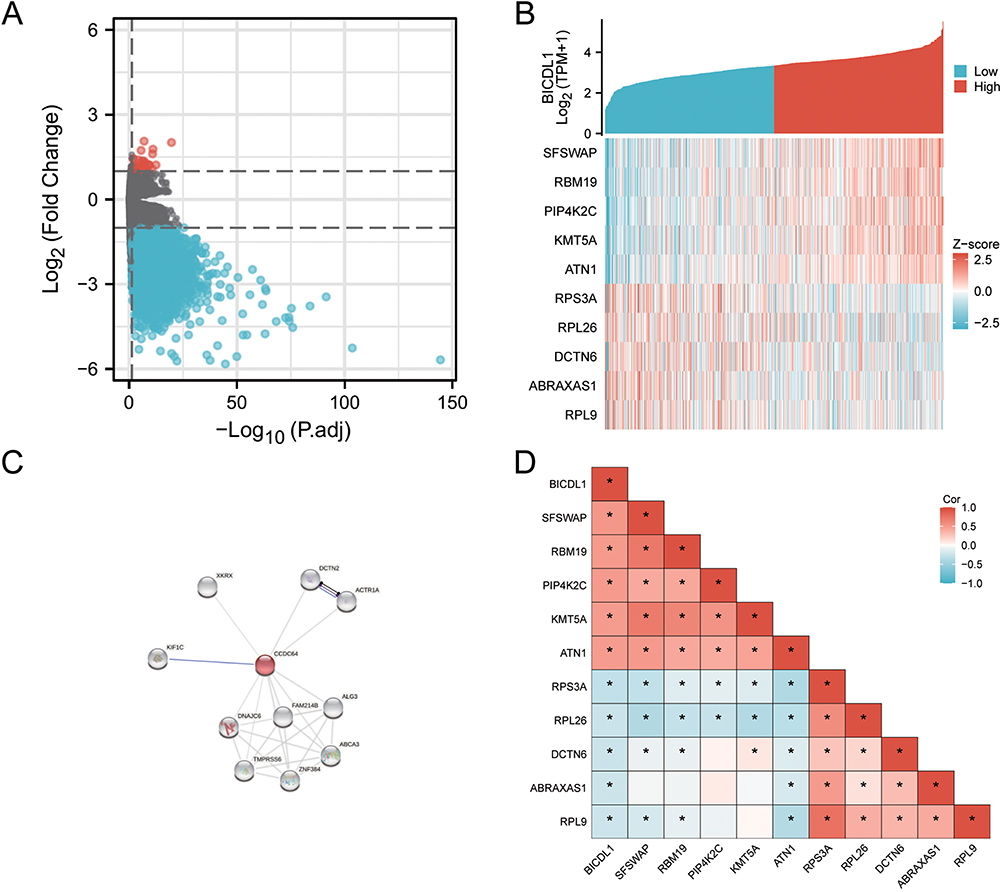 |
Figure 5 Differentially expressed gene map and co-expression networks of BICDL1 in TCGA database. (A) Volcano plot of differentially expressed genes (DEGs). The x-axis is the logarithm of -log10 after correction. The y-axis is log2(Fold Change). Log2|FC|>1 and p.adj<0.05 (B) Co-expression heat map of BICDL1. Red represents high expression, and Blue represents a low expression. (C) PPI analysis of BICDL1-associated proteins. Colored nodes: BICDL1 and first shell of interactors. White nodes: second shell of interactors (D) Correlation heat map of BICDL1. Red represents positive correlation, blue represents negative correlation. *, p< 0.05. |
We explored the biological role of BICDL1 in CRC. A protein-protein interaction analysis was conducted using STRING. The relevant proteins are shown in Figure 5C. To identify genes with a high correlation with BICDL1, batch correlation analysis of BICDL1 and all other genes was performed using TCGA. Using the criteria of Cor|>0.5 and value<0.05, 35 genes were screened out (Box S2). The top ten genes associated with BICDL1 were SFSWAP, RBM19, PIP4K2C, KMT5A, ATN1, RPS3A, RPL26, DCTN6, ABRAXAS1, and RPL9. Gene co-expression and correlation heat maps were constructed to map the top 10 genes associated with BICDL1 in CRC (Figure 5B and Figure 5D).
Functional Enrichment Analysis
KEGG and GO enrichment analyses were conducted to estimate the functions of DEGs in CRC patients. Under the condition of P.ADJ <0.1, 17 molecular functions (MF), 11 cell components (CC), 38 biological processes (BP), and 8 KEGG pathways were found (Table S1). The BPs mainly involved protein-DNA complex assembly, nucleosome organization, nucleosome assembly, negative regulation of megakaryocyte differentiation, signaling receptor activities, and acute inflammatory responses (Figure 6A). The MFs mainly involved receptor antagonist, serine-type endopeptidase, hormone, oligosaccharide binding, signaling receptor inhibitor, and oxygen carrier activities (Figure 6B). The CCs mainly involved nucleosomes, protein-DNA DNA-DNA complex, DNA packaging complexes, CENP-A-containing nucleosomes, blood microparticles, and nuclear chromosomes (Figure 6C). Among the KEGG pathways, neuroactive ligand-receptor interactions, neutrophil extracellular trap formation, systemic lupus erythematosus, alcoholism, Staphylococcus aureus infection, and viral carcinogenesis were enriched (Figure 6D).
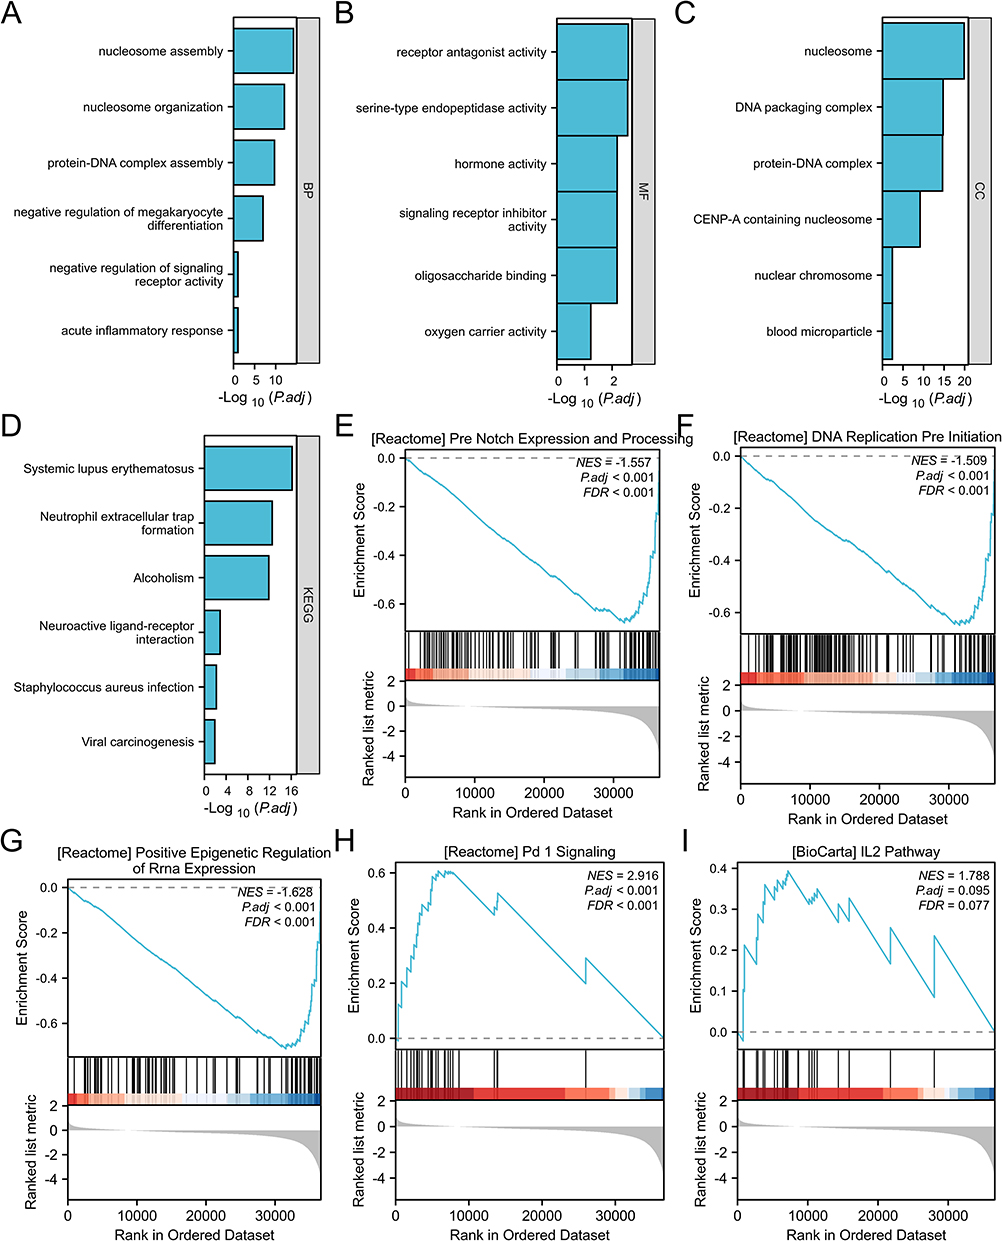 |
Figure 6 Functional enrichment analysis of BICDL1 in CRC. (A) Gene Ontology (GO) analysis of differentially expressed genes (DEGs) in the high- and low-BICL1 expression samples; six higher ranking GO terms for biological process (BP). (B) Six higher ranking GO terms for Molecular Function (MF). (C) Six higher ranking GO terms for cellular component (CC). (D) Six higher ranking KEGG terms. (E) Enrichment of genes in Notch expression and processing based on GSEA. (F) Enrichment of genes in DNA replication pre-initiation based on GSEA. (G) Enrichment of genes in epigenetic regulation based on GSEA. (H) Enrichment of genes in PD-1 signaling based on GSEA. (I) Enrichment of genes in the IL-2 pathway based on GSEA. |
GSEA was conducted to identify the major biological processes and key pathways associated with BICDL1 expression. GSEA based on RNA-Seq data revealed 166 significantly enriched biological processes and pathways (p <0.05, FDR (q-value) <0.25; Table S2). The most significantly enriched pathways were Notch expression and processing (Figure 6E), epigenetic regulation (Figure 6G), DNA replication (Figure 6F), PD-1 signaling (Figure 6H), IL-2 pathway (Figure 6I), CD40 pathway (Figure S2), and Wnt (Figure S3). These findings suggest the potential mechanisms by which BICDL1 may be involved in CRC progression and its association with immune-related pathways.
Relationship Between BICDL1 Expression and Immune Cell Infiltration
The relationship between BICDL1 expression and immune cell infiltration was quantified using ssGSEA, as shown in Figure 7A. BICDL1 expression was positively correlated with Treg (R=0.146, p <0.001, Figure 7B), TFH (R=0.080, p =0.043, Figure 7D), aDC (R=0.095, p =0.016, Figure 7E), and NK CD56bright cells (R=0.149, p <0.001, Figure 7F), and negatively correlated with T helper cell infiltration (R=−0.084, p =0.034, Figure 7G). Based on the median BICDL1 mRNA expression, we separated patients with CRC into low and high BICDL1 mRNA-expressing groups. The infiltration percentages of the 24 immune cell types were compared between the two groups, and the results are shown in Figure 7C. Principal immune cells, including NK CD56bright cells, NK cells, and Tregs, are influenced by BICDL1 expression. The proportions of NK cells, NK CD56bright cells, and Tregs were higher in the high expression group than in the low expression group (p=0.014, p<0.001, and p=0.001, respectively) (Figure 7C).
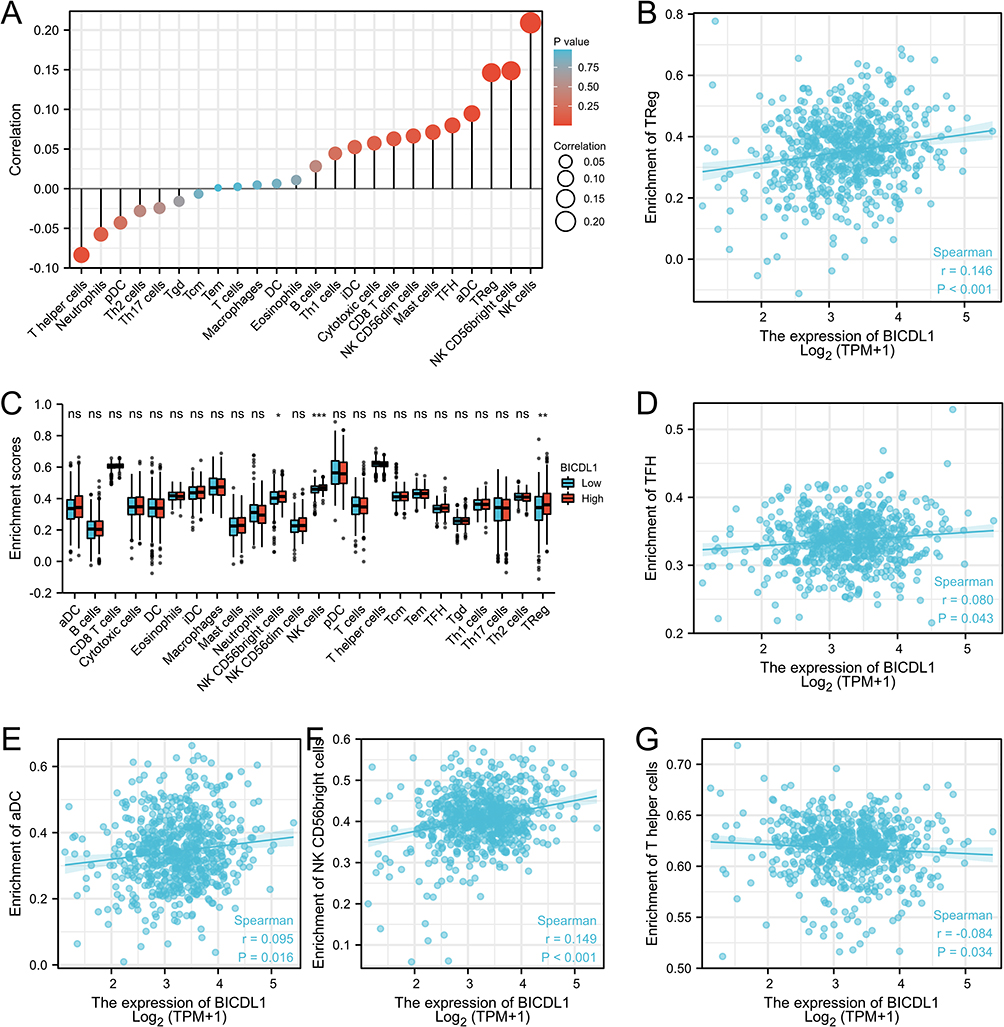 |
Figure 7 Relationship between BICDL1 expression and immune cell infiltration in CRC. (A) Correlation between immune cell infiltration and BICDL1 expression. (B) BICDL1 mRNA expression was positively correlated with Treg. (C) Infiltration proportion of the 24 immune cells was compared between the high and low BICDL1 mRNA-expressing groups. The levels of NK CD56bright cells, NK cells, and Treg were increased in the high expression group compared with low expression group. (D–G) BICDL1 mRNA expression was positively correlated with TFH (D), aDC (E) and NK CD56 bright cells (F), and negatively correlated with T helper cell infiltration (G). ns, p≥0.05; *p< 0.05; **p<0.01; ***p<0.001. |
Expression of BICDL1 in Various Types of CNV and Correlation with Methylation
The correlations among BICDL1 mRNA expression, CNV, and methylation levels in CRC were evaluated. Only one case of CNV amplification was observed in BICDL1. Patients with a CNV of BICDL1 had increased levels of BICDL1 expression in CRC (Figure 8A), and only seven patients had BICDL1 mutations (Figure 8B). This finding indicates that BICDL1 overexpression may not be primarily caused by CNV. We examined the correlation between BICDL1 expression and methylation levels using Spearman correlation analysis to determine how BICDL1 methylation is correlated with BICDL1 mRNA expression levels. The results revealed that BICDL1 methylation levels were negatively correlated with its expression levels (R2=0.134, p=6.52e14, Figure 8C). In addition, BICDL1 methylation was observed in the colon and normal cells. The promoter methylation levels of BICDL1 in TCGA-COAD cancer cells were lower than those in normal tissues (Figure 8D). An exon missense mutation analysis (Figure 8E) of BICDL1-related genes was performed according to TCGA data. The findings indicate that BICDL1 mutations may promote the progression of patients with advanced CRC.
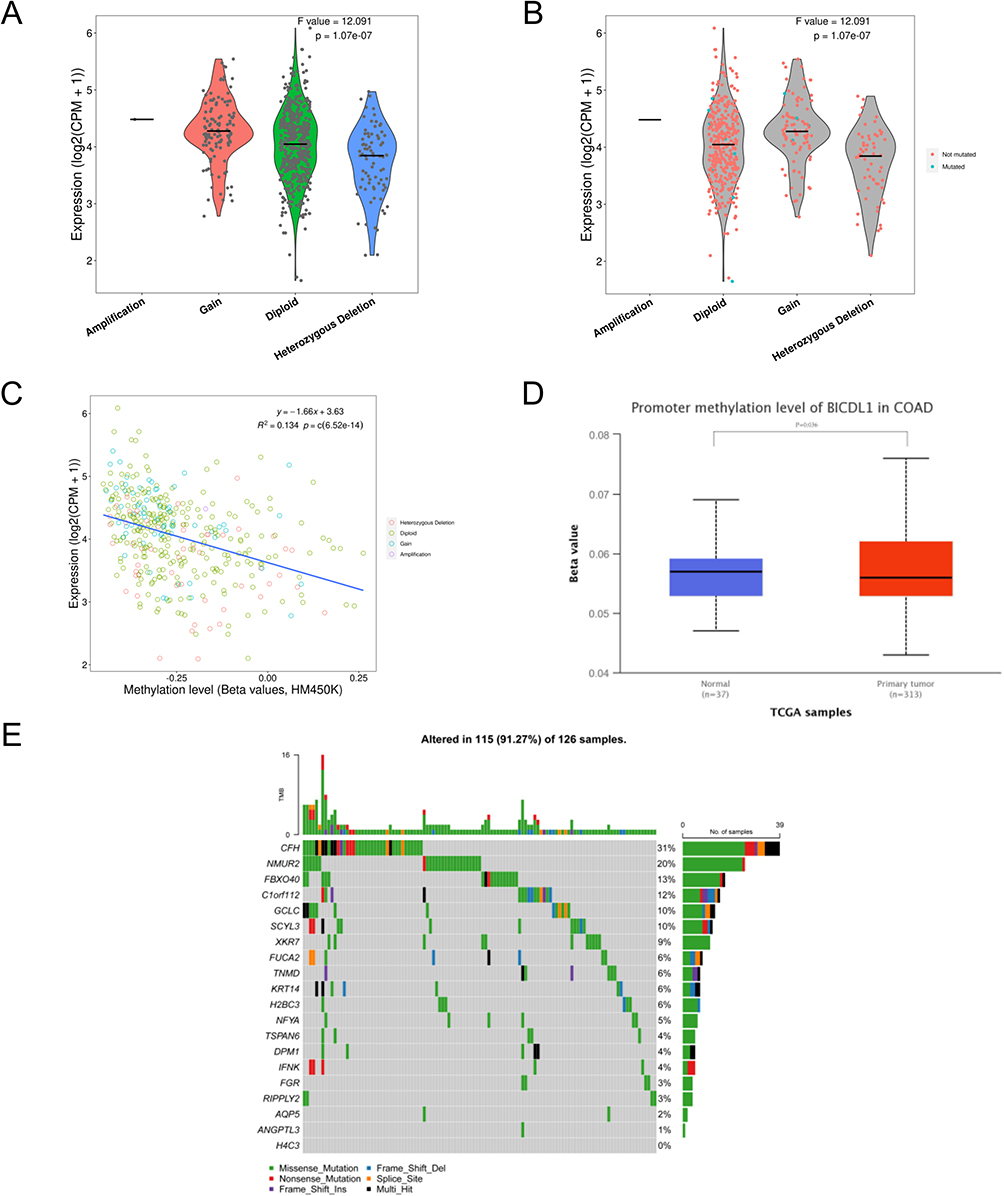 |
Figure 8 Expression of BICDL1 in various types of CNV and correlation with methylation. (A) Expression of BICDL1 in various types of copy number variation (CNV); (B) Mutations in BICDL1 during the regulation of cancer; (C) Correlation between BICDL1 methylation and its expression level; (D) Promoter methylation of BICDL1 in tumor tissues (n = 313) and normal tissues (n = 37) from TCGA-COAD data; (E) Mutations in BICDL1-related genes during the regulation of cancer. |
Validation of BICDL1 Expression Level
We measured the mRNA and protein expression levels of BICDL1. To detect BICDL1 expression levels in multiple human CRC cell lines (HCT116, SW620, and RKO) and normal colonic epithelial cells (NCM460), RT-qPCR and Western blotting were performed. In the validation assessment, the BICDL1 mRNA and protein expression levels in the CRC cell lines (SW620) were markedly increased compared to those in normal colonic epithelial cells (NCM460) (p <0.001; Figure 9A and B); however, no difference was found between HCT116, RKO, and NCM460 cells (Figure 9A and B).
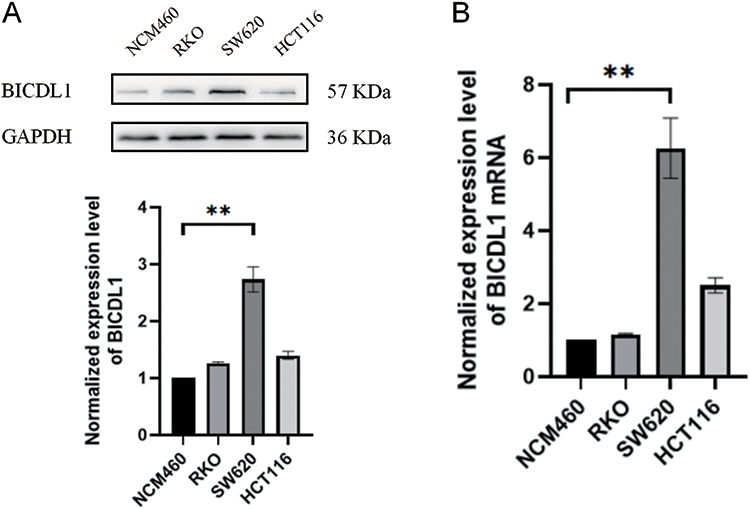 |
Figure 9 Determination of BICDL1 expression levels in normal colonic epithelial cell lines and CRC cell lines. (A) BICDL1 protein expression levels in normal colonic epithelial cell lines (MCM-460) and CRC cell lines (RKO, SW620, and HCT116). (B) BICDL1 mRNA expression levels in normal colonic epithelial cell lines (MCM-460) and CRC cell lines (RKO, SW620, and HCT116). **p<0.01. |
Discussion
CRC is the main cause of tumor mortality worldwide. Locally advanced CRC, which includes T4b CRC, is responsible for 5–22% of all cases.18 At present, the 5-year OS rate for early-stage CRC is approximately 90%, but only 10–15% for stage IV CRC.19 Considering the unsatisfactory OS rate of metastatic CRC, novel molecular targets and therapeutic approaches must be urgently identified. BICDL1 has only been identified in nephritis in prior studies. The present study revealed that variations in BICDL1 expression levels are associated with CRC prognosis. In this study, we assessed the clinical prognostic significance of BICDL1 mRNA expression in patients with CRC and explored the influence of BICDL1 on the CRC immune microenvironment to introduce new strategies for early diagnosis, treatment, and prognostic evaluation of CRC.
Our team downloaded the RNA-Seq dataset of all COADREAD patients from TCGA database, in addition to the corresponding clinicopathological parameters. The BICDL1 differential expression in normal and tumor cells was evaluated using all data from TCGA. BICDL1 expression in normal cells was significantly lower than that in cancer cells. BICDL1 was differentially expressed in CRC and enabled the distinction between benign and malignant tumors. ROC curves were generated according to BICDL1 expression in tumors and adjacent normal cells. The results proved that BICDL1 has high specificity and efficiency for diagnosis. Survival analysis demonstrated that patients with CRC with increased BICDL1 expression had a lower OS rate.
Similarly, the association of BICDL1 with the clinicopathological characteristics of patients confirmed the positive effect of BICDL1 in CRC, that is, CRC patients with low BICDL1 expression have lower CEA levels and less distant metastasis. COX regression analysis revealed that BICDL1 may be a prognostic biomarker for patients with CRC. We explored the relationship between BICDL1 expression and the immune microenvironment in CRC. These findings indicate that BICDL1 is involved in the infiltration of different immune cells. Additionally, BICDL1 expression levels were inversely correlated with Treg, TFH, NK CD56bright cells, and aDC immune infiltration levels, and inversely correlated with T helper cell infiltration. Overall, BICDL1 may serve as a novel biomarker for the diagnosis and prognosis of CRC.
The BICD protein family is a class of adaptors that can control the relationship between molecular carriers and various payloads. Max A Schlager et al suggested that BICDL1 regulated neurogenesis by targeting the Pericentrosomal of Rab6 secretory vesicles.8 Such finding indicates that BICDR-1 functions as a temporal regulator of trafficking during the early stages of neuronal differentiation. Schlager further demonstrated that BICDL1 increases minus end-directed vesicle motion and affects the distribution of Rab6 vesicle,20 suggesting that BICDL1 can regulate dynein-based motility velocity, thereby controlling carrier distribution. BICD1, a critical paralog of BICDL1, has been implicated in cancer prognosis. High BICD1 expression indicates poor prognosis of glioblastoma.21 Jiang found that BICD1 expression was significantly upregulated in hepatocellular carcinoma cells compared to adjacent non-neoplastic cells and overexpressed in hepatocellular carcinoma cells.22 The OS was considerably shorter in patients with high BICD1 expression than in those with low BICD1 expression. BICD1 knockout markedly hindered the proliferation, migration, and invasion of HCCLM3 cells. However, the role of BICDL1 in cancer has not been reported.
GO enrichment analysis and GSEA revealed that BICDL1 is associated with negative regulation of signaling receptor activity, DNA replication, the Notch pathway, the Wnt pathway, PD-1 signaling, and the IL-2 pathway. DNA replication stress leads to abnormal and aggressive growth in cancer, and subsequently genomic instability,23 which is an essential hallmark of tumors. Epithelial-mesenchymal transition (EMT) is a process by which epithelial cells obtain mesenchymal features. In cancer, EMT is linked to the occurrence and progression of tumors,24 and Wnt is a critical pathway for EMT regulation. The Wnt pathway is separated into two types: non-canonical (β-catenin independent) and canonical (β-catenin dependent).25 The canonical Wnt /β-catenin pathway is a hot molecular target in the field of cancer therapy.26,27 This pathway is associated with cell proliferation, differentiation, and apoptosis regulation and is highly associated with tumor initiation, invasion, metastasis, and chemoresistance. Wnt proteins are secreted glycoproteins that act in an autocrine or paracrine manner. When Wnt is induced, the β-catenin degradation activity is inhibited and β-catenin steadily accumulates in the cytoplasm and can enter the nucleus, bind to the TCF/LEF family of transcription factors, and initiate the transcription of target genes downstream, thereby driving the cell cycle or producing abnormal proteins and causing the cell to become cancerous. Interestingly, the aberrant activation of Wnt signaling mediates immune rejection and hinders antitumor immune activity mediated by T cells, leading to resistance to immunotherapy.28–30 Notch pathways are related to various biological processes, such as growth, differentiation, survival, and the functions of various immune cell populations. The Notch pathway plays an essential role in innate lymphoid cell immune response.31 To our knowledge, this is the first report of the relationship between BICDL1, the Wnt pathway, and Notch signaling, and its regulatory mechanism is yet to be clarified.
The formation of the tumor microenvironment (TME) directly mediates tumor metastasis and progression, and contributes to the risk of death in cancer patients.32 Immune cell infiltration is highly relevant to tumorigenesis and progression, and affects patient prognosis.33 Monoclonal antibodies targeting PD-1 and PD-L1 have become a focus of cancer research as targets for immunotherapy,34 but are only effective in a small percentage of cases. To date, no studies have demonstrated the relationship between BICDL1 and immune cell infiltration in CRC. Therefore, this study analyzed the correlation between BICDL1 expression and the infiltration of various immune cells into the CRC immune microenvironment. Our study revealed that BICDL1 expression correlated with the proportion of NK cells and Tregs.
Tregs are required to modulate the immune system and maintain tolerance to self-antigens, but are also frequently enriched in tumors that influence malignant progression. Tregs in CRC mediate immune escape and impede antitumor immune responses. High levels of Treg infiltration in patients are associated with poor prognosis.35 Several studies36,37 have reported that Tregs inhibit the immune response by competing for CD80 and CD86 activation signals via cytotoxic T lymphocyte-associated antigen-4 (CTLA-4), which has high expression on the cell surface, and high affinity receptor CD25 competes for IL-2 binding and promotes cytokines secretion, such as IL-35, TGF-β and IL-10. Our findings indicate that BICDL1 is correlated with Treg and IL2, and BICDL1 may regulate CRC progression by affecting Treg and IL2.
This study had several limitations. As only COAD data in TCGA database were employed, and some data were missing and insufficient, a certain degree of statistical result bias may exist. Therefore, future research on the BICDL1 gene will be conducted using cell line experiments and more CRC patients. In addition, we will further elucidate the association between BICDL1 and CRC pathogenesis.
Data Sharing Statement
The datasets [GENERATED/ANALYZED] for this study could be found in The Cancer Genome Atlas (TCGA), Genotype-Tissue Expression (GTEx), and Gene Expression Omnibus (GEO).
Ethical Approval
This study is based on open-source data, there are no ethical issues and other conflicts of interest. Thus, the study was exempted from the approval of local ethics committees (Ethics Committees of Chenzhou NO. 1 People’s Hospital).
Author Contributions
All authors made a significant contribution to the work reported, whether that is in the conception, study design, execution, acquisition of data, analysis and interpretation, or in all these areas; took part in drafting, revising or critically reviewing the article; gave final approval of the version to be published; have agreed on the journal to which the article has been submitted; and agree to be accountable for all aspects of the work.
Funding
The study was supported by National Nature Science Foundation of China (China, grand no: 82004312; 81774287; 81774163;82374462), Hunan Nature Science Foundation (Hunan, China, grand no: 2021JJ30421; 2021JJ40312; 2023JJ50376), Hunan Provincial Health Commission (Hunan, China, grand no: B202304018407), Hunan Innovative Scientific Programme (Hunan, China, grand no: 2021SK51006; Changsha Nature Science Foundation (Changsha, Hunan, China, grand no: Kq2014204), Science Foundation of Ministry of Education of Hunan (Hunan, China, grand no: 20B443), Science Foundation of Health Commission of Hunan (Hunan, China, grand no: 20201066; 20201248), Science Foundation of Hunan Administration of Traditional Chinese Medicine (Hunan, China, grand no: 2021248; D2022125) and Science Foundation of Hunan Academy of Chinese Medicine (Hunan, China, grand no: 201604). Technology research and development center project of chenzhou (Hunan, China, grand no: 2021-40). Research project of Chenzhou NO.1 People’s Hospital (chenzhou, Hunan, China, grand no: CZYY202206; JG2022-012; 2020A27; 2020XJ118).
Disclosure
The authors declare that the research was conducted in the absence of any commercial or financial relationships that could be construed as a potential conflict of interest.
References
1. Bray F, Ferlay J, Soerjomataram I, et al. Global cancer statistics 2018: GLOBOCAN estimates of incidence and mortality worldwide for 36 cancers in 185 countries. Ca a Cancer J Clinicians. 2018;68(6):394–424. doi:10.3322/caac.21492
2. Cao M, Li H, Sun D, et al. Cancer burden of major cancers in China: a need for sustainable actions. Cancer Commun. 2020;40(5):205–210. doi:10.1002/cac2.12025
3. Li N, Lu B, Luo C, et al. Incidence, mortality, survival, risk factor and screening of colorectal cancer: a comparison among China, Europe, and northern America. Cancer Letters. 2021;522:255–268. doi:10.1016/j.canlet.2021.09.034
4. Biller LH, Schrag D. Diagnosis and treatment of metastatic colorectal cancer: a review. JAMA. 2021;325(7):669–685. doi:10.1001/jama.2021.0106
5. Dekker E, Tanis PJ, Vleugels JLA, et al. Colorectal cancer. Lancet. 2019;394(10207):1467–1480. doi:10.1016/S0140-6736(19)32319-0
6. Terenzio M, Schiavo G. The more, the better: the BICD family gets bigger. EMBO J. 2010;29(10):1625–1626. doi:10.1038/emboj.2010.78
7. Vazquez-Pianzola P, Beuchle D, Saro G, et al. Female meiosis II and pronuclear fusion require the microtubule transport factor Bicaudal D. Development. 2022;149(13). doi:10.1242/dev.199944
8. Schlager MA, Kapitein LC, Grigoriev I, et al. Pericentrosomal targeting of Rab6 secretory vesicles by Bicaudal-D-related protein 1 (BICDR-1) regulates neuritogenesis. EMBO J. 2010;29(10):1637–1651. doi:10.1038/emboj.2010.51
9. Vivian J, Rao AA, Nothaft FA, et al. Toil enables reproducible, open source, big biomedical data analyses. Nat Biotechnol. 2017;35(4):314–316. doi:10.1038/nbt.3772
10. Love MI, Huber W, Anders S. Moderated estimation of fold change and dispersion for RNA-seq data with DESeq2. Genome Biol. 2014;15(12):550. doi:10.1186/s13059-014-0550-8
11. Gene Ontology Consortium. Gene ontology consortium: going forward. Nucleic Acids Res. 2015;43:D1049–1056.
12. Kanehisa M, Furumichi M, Sato Y, et al. KEGG for taxonomy-based analysis of pathways and genomes. Nucleic Acids Res. 2023;51(D1):D587–d592.
13. Wu T, Hu E, Xu S, et al. clusterProfiler 4.0: a universal enrichment tool for interpreting omics data. Innovation. 2021;2(3):100141. doi:10.1016/j.xinn.2021.100141
14. Gustavsson EK, Zhang D, Reynolds RH, et al. ggtranscript: an R package for the visualization and interpretation of transcript isoforms using ggplot2. Bioinformatics. 2022;38(15):3844–3846. doi:10.1093/bioinformatics/btac409
15. Subramanian A, Tamayo P, Mootha VK, et al. Gene set enrichment analysis: a knowledge-based approach for interpreting genome-wide expression profiles. Proc Natl Acad Sci USA. 2005;102(43):15545–15550. doi:10.1073/pnas.0506580102
16. Chen B, Khodadoust MS, Liu CL, et al. Profiling Tumor Infiltrating Immune Cells with CIBERSORT. Methods Mol Biol. 2018;1711:243–259.
17. In J, Lee DK. Survival analysis: part II - applied clinical data analysis. Korean J Anesthesiol. 2023;76(1):84–85. doi:10.4097/kja.19183.e1
18. Huang B, Feng Y, Mo SB, et al. Smaller tumor size is associated with poor survival in T4b colon cancer. World J Gastroenterol. 2016;22(29):6726–6735. doi:10.3748/wjg.v22.i29.6726
19. Atkin W, Wooldrage K, Parkin DM, et al. Long term effects of once-only flexible sigmoidoscopy screening after 17 years of follow-up: the UK Flexible Sigmoidoscopy Screening randomised controlled trial. Lancet. 2017;389(10076):1299–1311. doi:10.1016/S0140-6736(17)30396-3
20. Schlager MA, Serra-Marques A, Grigoriev I, et al. Bicaudal d family adaptor proteins control the velocity of Dynein-based movements. Cell Rep. 2014;8(5):1248–1256. doi:10.1016/j.celrep.2014.07.052
21. Huang SP, Chang YC, Low QH, et al. BICD1 expression, as a potential biomarker for prognosis and predicting response to therapy in patients with glioblastomas. Oncotarget. 2017;8(69):113766–113791. doi:10.18632/oncotarget.22667
22. Jiang Y, Yao B, Chen T, et al. BICD1 functions as a prognostic biomarker and promotes hepatocellular carcinoma progression. Pathol Res Pract. 2020;216(4):152858. doi:10.1016/j.prp.2020.152858
23. Kondratick CM, Washington MT, Spies M. Making Choices: DNA replication fork recovery mechanisms. Semin Cell Dev Biol. 2021;113:27–37. doi:10.1016/j.semcdb.2020.10.001
24. Pastushenko I, Blanpain C. EMT transition states during tumor progression and metastasis. Trends Cell Biol. 2019;29(3):212–226. doi:10.1016/j.tcb.2018.12.001
25. Zhan T, Rindtorff N, Boutros M. Wnt signaling in cancer. Oncogene. 2017;36(11):1461–1473. doi:10.1038/onc.2016.304
26. Yu F, Yu C, Li F, et al. Wnt/β-catenin signaling in cancers and targeted therapies. Signal Transduct Target. 2021;6(1):307. doi:10.1038/s41392-021-00701-5
27. Koni M, Pinnarò V, Brizzi MF. The Wnt signalling pathway: a tailored target in cancer. Int J Mol Sci. 2020;21(20):7697. doi:10.3390/ijms21207697
28. Haseeb M, Pirzada RH, Ain QU, et al. Wnt signaling in the regulation of immune cell and cancer therapeutics. Cells. 2019;8(11):1380. doi:10.3390/cells8111380
29. Li X, Xiang Y, Li F, et al. WNT/β-catenin signaling pathway regulating T Cell-Inflammation in the tumor microenvironment. Front Immunol. 2019;10:2293. doi:10.3389/fimmu.2019.02293
30. Zhou Y, Xu J, Luo H, et al. Wnt signaling pathway in cancer immunotherapy. Cancer Letters. 2022;525:84–96. doi:10.1016/j.canlet.2021.10.034
31. Golub R. The Notch signaling pathway involvement in innate lymphoid cell biology. Biomedical Journal. 2021;44(2):133–143. doi:10.1016/j.bj.2020.12.004
32. Quail DF, Joyce JA. Microenvironmental regulation of tumor progression and metastasis. Nat Med. 2013;19(11):1423–1437. doi:10.1038/nm.3394
33. Zhang H, Liu Z, Wen H, et al. Immunosuppressive TREM2(+) macrophages are associated with undesirable prognosis and responses to anti-PD-1 immunotherapy in non-small cell lung cancer. Cancer Immunol Immunother. 2022;71(10):2511–2522. doi:10.1007/s00262-022-03173-w
34. Tang Q, Chen Y, Li X, et al. The role of PD-1/PD-L1 and application of immune-checkpoint inhibitors in human cancers. Front Immunol. 2022;13:964442. doi:10.3389/fimmu.2022.964442
35. Yan B, Xiong J, Ye Q, et al. Correlation and prognostic implications of intratumor and tumor draining lymph node Foxp3(+) T regulatory cells in colorectal cancer. BMC gastroenterology. 2022;22(1):122. doi:10.1186/s12876-022-02205-0
36. Olguín JE, Medina-Andrade I, Rodríguez T, et al. Relevance of regulatory T cells during colorectal cancer development. Cancers. 2020;12(7):1888. doi:10.3390/cancers12071888
37. Salinas N, Olguín JE, Castellanos C, et al. T cell suppression in vitro during T oxoplasma gondii Infection is the Result of IL −2 competition between tregs and T cells leading to death of proliferating T cells. Scand J Immunol. 2014;79(1):1–11. doi:10.1111/sji.12120
 © 2023 The Author(s). This work is published and licensed by Dove Medical Press Limited. The
full terms of this license are available at https://www.dovepress.com/terms
and incorporate the Creative Commons Attribution
- Non Commercial (unported, 3.0) License.
By accessing the work you hereby accept the Terms. Non-commercial uses of the work are permitted
without any further permission from Dove Medical Press Limited, provided the work is properly
attributed. For permission for commercial use of this work, please see paragraphs 4.2 and 5 of our Terms.
© 2023 The Author(s). This work is published and licensed by Dove Medical Press Limited. The
full terms of this license are available at https://www.dovepress.com/terms
and incorporate the Creative Commons Attribution
- Non Commercial (unported, 3.0) License.
By accessing the work you hereby accept the Terms. Non-commercial uses of the work are permitted
without any further permission from Dove Medical Press Limited, provided the work is properly
attributed. For permission for commercial use of this work, please see paragraphs 4.2 and 5 of our Terms.
Recommended articles
Identification of KRBA1 as a Potential Prognostic Biomarker Associated with Immune Infiltration and m6A Modification in Hepatocellular Carcinoma
Liu Y, Fu B, Yu Z, Song G, Zeng H, Gong Y, Ding Y, Huang D
Journal of Hepatocellular Carcinoma 2022, 9:497-516
Published Date: 31 May 2022
Expression, Clinical Significance, Immune Infiltration, and Regulation Network of miR-3940-5p in Lung Adenocarcinoma Based on Bioinformatic Analysis and Experimental Validation
Lin Z, Huang W, Xie Z, Yi Y, Li Z
International Journal of General Medicine 2022, 15:6451-6464
Published Date: 6 August 2022
CSTF2 Acts as a Prognostic Marker Correlated with Immune Infiltration in Hepatocellular Carcinoma
Zhang W, Wan Y, Zhang Y, Liu Q, Zhu X
Cancer Management and Research 2022, 14:2691-2709
Published Date: 12 September 2022
CENPO is Associated with Immune Cell Infiltration and is a Potential Diagnostic and Prognostic Marker for Hepatocellular Carcinoma
He K, Xie M, Li J, He Y, Yin Y
International Journal of General Medicine 2022, 15:7493-7510
Published Date: 25 September 2022
Downregulation of ST6GAL1 Promotes Liver Inflammation and Predicts Adverse Prognosis in Hepatocellular Carcinoma
Liu R, Cao X, Liang Y, Li X, Jin Q, Li Y, Du H, Zao X, Ye Y
Journal of Inflammation Research 2022, 15:5801-5814
Published Date: 10 October 2022