Back to Journals » Diabetes, Metabolic Syndrome and Obesity » Volume 14
Berberine Ameliorates Hepatic Insulin Resistance by Regulating microRNA-146b/SIRT1 Pathway
Authors Sui M, Jiang X, Sun H, Liu C, Fan Y
Received 27 March 2021
Accepted for publication 22 May 2021
Published 4 June 2021 Volume 2021:14 Pages 2525—2537
DOI https://doi.org/10.2147/DMSO.S313068
Checked for plagiarism Yes
Review by Single anonymous peer review
Peer reviewer comments 2
Editor who approved publication: Prof. Dr. Juei-Tang Cheng
Miao Sui,1 Xiaofei Jiang,1 Hongping Sun,2 Chao Liu,2 Yaofu Fan2
1Department of Endocrinology, Xuzhou TCM Hospital Affiliated to Nanjing University of Chinese Medicine, Xuzhou, People’s Republic of China; 2Endocrine and Diabetes Center, Affiliated Hospital of Integrated Traditional Chinese and Western Medicine, Nanjing University of Chinese Medicine, Nanjing, People’s Republic of China
Correspondence: Yaofu Fan; Chao Liu
Endocrine and Diabetes Center, Jiangsu Province Hospital on Integration of Chinese and Western Medicine, Nanjing University of Traditional Chinese Medicine, No. 100 Shizi Street, Hongshan Road, Nanjing, Jiangsu, 210008, People’s Republic of China
Tel +86-25-8560 8733
Email [email protected]; [email protected]
Objective: Hepatic insulin resistance is a major initiating factor for type 2 diabetes mellitus. In previous study, Gegen Qinlian Decoction containing berberine could enhance hepatic insulin sensitivity by SIRT1-dependent deacetylation of FOXO1. However, it is not clear whether berberine also can improve hepatic insulin sensitivity by SIRT1/FOXO1 pathway. This study aimed to evaluate the efficacy of berberine for improving hepatic insulin resistance and the possible molecular mechanisms involved.
Methods: In vitro, HepG2 cells were induced with palmitic acid, and glycogen synthesis was examined. In vivo, a high-fat diet (HFD)-fed mouse model was established, and metabolic parameters were assessed. The expressions of miR-146b and sirtuin 1 (SIRT1) in liver were also examined. The relationship between miR-146b and SIRT1 was examined by the dual-luciferase reporter gene assay.
Results: Serum biochemical parameters, such as glucose and HOMA-IR index, were increased in HFD mice; miR-146b and SIRT1 were abnormally expressed in HFD mice and palmitic acid-treated HepG2 cells. Interestingly, berberine reduced body weight and caused a significant improvement in glucose tolerance and HOMA-IR index without altering food intake in mice. Overexpression of miR-146b abolished the protective effect of berberine on palmitic acid-induced impaired glycogen synthesis in HepG2 cells. Luciferase assay showed that miR-146b directly targeted SIRT1.
Conclusion: The present findings suggest that berberine could attenuate hepatic insulin resistance through the miR-146b/SIRT1 pathway, which may represent a potential therapeutic target for the prevention and treatment of metabolic diseases, particularly diabetes.
Keywords: berberine, hepatic insulin resistance, sirtuin 1, miR-146b
Introduction
Insulin resistance (IR) refers to reduced glucose uptake and utilization by liver, muscle, fat, other tissues and in response to insulin induction, and IR is considered to be the main initiating factor for type 2 diabetes mellitus (T2DM).1 The liver is a major organ for glucose uptake, and endogenous glucose production mainly comes from the liver.2 Thus, IR usually occurs first in the liver, followed by dysregulation of a variety of enzymes involved in glucose metabolism and finally increased blood glucose levels.3,4 The pathogenesis of liver IR is closely with the polyol pathway, accumulation of glycation end products, inflammation, oxidative stress and other factors.5–7
Berberine (BBR) is a plant quaternary ammonium salt from the group of isoquinoline alkaloid (Figure S1), which can be isolated from Coptis chinensis.8 It displays many pharmacological activities, such as analgesic, anti-inflammatory, anticancer, and myocardial protective effects.9 Some studies have shown that BBR could improve glycolipid metabolism and IR possibly by the regulation of insulin receptor, protein phosphatase, Mg2+/Mn2+-dependent 1B and uncoupling protein 1.10–12 In addition, human and animal data indicated that BBR could directly modulate gut microbial populations to improve weight.13,14 In our previous study, we have demonstrated that Gegen Qinlian Decoction containing berberine could enhance hepatic insulin sensitivity by SIRT1-dependent deacetylation of FOXO1.15 However, it is not clear whether BBR also can improve hepatic insulin sensitivity by SIRT1/FOXO1 pathway. MicroRNAs, as small non-coding RNAs, can regulate gene expression to either induce mRNA cleavage or repress protein translation.16 The miR-146b gene is highly conserved among most vertebrates and is an important regulator of the anti-inflammatory, globular adiponectin.17 The previous study demonstrated increased levels of miR-146b in liver from obese subjects with NAFLD.18 The microRNA-146b/SIRT1-FOXO1 cascade in regulating the adipogenesis has also been confirmed.19 But there have been few researches on miR-146b/SIRT1 in the liver.
Therefore, the aim of the present study was to investigate the effects of BBR on the liver. In this study, we investigated whether BBR treatment could improve hepatic glucose metabolism and hepatic insulin sensitive and investigated the potential mediators in the miR-146b/SIRT1 pathways.
Materials and Methods
Ethics Statement
All animal experimental procedures were performed in accordance with the National Institutes of Health Guidelines for Laboratory Animals (NIH Publications No. 8023, revised 1978) and approved by the Ethics Committee of Affiliated Hospital of Integrated Traditional Chinese and Western Medicine, Nanjing University of Chinese Medicine (Nanjing, China).
Animal Model
Forty-eight 12-week-old specific pathogen-free (SPF) male C57BL/6J mice weighing 18–20g was purchased from Shanghai Slac Laboratory Animal Co. Ltd. (Shanghai, China) and housed in the experimental animal center of Jiangsu Province Academy of Traditional Chinese Medicine. The animals were maintained on a 12-h light/dark cycle in a constant temperature (22±2°C) environment. The mice were divided into two groups, the normal fat diet (NFD) group (n=12) and high-fat diet (HFD) group (n=36). There were no significant differences in the body weight between these groups prior to the start of the experiment. Mice in the NFD group were fed with standard chow diet, and mice in the HFD group were fed with a diet containing 60% fat, 14.1% protein and 25.9% carbohydrate (Trophic, Nantong, China). After 12 weeks, mice in the HFD group were further randomly allocated into three groups: a HFD group that received continued feeding with the HFD, a HFD+BBR-5 group that was fed the HFD and given intraperitoneal injections of BBR at a dose of 5 mg/kg/day, and a HFD+BBR-10 group that was fed the HFD and given intraperitoneal injections of BBR at a dose of 10 mg/kg/day.20 The NFD and HFD groups received injections of an equivalent volume of sterile saline. The BBR treatment period lasted for 4 weeks. The body weight of the mice was monitored every week. Food was removed 2 h before measurement of body weight.
Histological Analysis of Hepatic Tissues
At the end of the experiment, mice were sacrificed, and liver tissues were harvested, fixed in 10% formaldehyde, and embedded in paraffin. Paraffin sections were subjected to hematoxylin and eosin (H&E) staining (Zeping, Beijing, China) for examination of the architecture of the tissues. Images were visualized with an Olympus microscope and captured with an Olympus digital camera (BX20, Beijing, China) using NIS Element SF 4.00.06 software (Beijing, China). For each group, liver samples from 3–5 mice were prepared, stained, and analyzed.
Measurement of Serum Biochemical Parameters
An intraperitoneal glucose tolerance test (IPGTT) and an intraperitoneal insulin tolerance test (IPITT) were performed at the 4th week of treatment. For the IPGTT, mice were fasted for 12 h before intraperitoneal injection of glucose (0.5 g/kg body weight). The IPITT was performed 3 days after the IPGTT, and mice were injected intraperitoneally with insulin at 0.5 U/kg body weight after a 4-h fast according to a protocol described previously.15 The fasting serum triglycerides (TG) level was analyzed using an enzyme-linked immunosorbent assay (ELISA) kit (Bio Sino, Beijing, China). The levels of plasma insulin were determined using an insulin ELISA kit (ALPCO, Salem, New Hampshire USA). IR was assessed by a homeostasis model assessment of insulin resistance index (HOMA-IR).21 Homeostasis model assessment of insulin resistance (HOMA-IR) index was calculated using the previously described formula.22 HOMA-IR = Insulin (ng/mL) × Glucose (mg/mL) × 25/405.
Cell Culture and Transfection
Cells of the human hepatocellular carcinoma line (HepG2) were purchased from the American Type Culture Collection (ATCC, Manassas, VA, USA). HepG2 cells were seeded in 6-well plates at a density of 3×10⁵ cells/well and treated with 10% fetal bovine serum High Glucose Dulbecco’s Modified Eagle Medium (GIBCO BRL, Grand Island, NY, USA). At 60% confluency, the cells were subjected to a 6-h starvation with serum-free Low Glucose Dulbecco’s Modified Eagle Medium and then treated with or without 0.25 mM palmitic acid (Sigma-Aldrich, St. Louis, MO, USA) or palmitic acid together with BBR (10 µM) for 24 h. To study the functions of miR-146b, HepG2 cells were transfected with miR-146b mimics using the riboFect™ CP transfection kit. A miR-146b inhibitor was purchased from RIBOBIO company (Guangzhou, China) and used according to the instructions provided by the manufacturer.
CCK8 Cell Viability Assay
HepG2 cells were cultured in 96-well plates at a density of 1000 cells/well. The medium was replaced by 100 µL of medium containing different drug concentrations (5, 10, 15, 20, 30 µM for BBR) with palmitic acid for 24 hours, 48 hours respectively. Then, 10µL of CCK8 was added and cultured for 2 hours. Cell survival was evaluated using CCK8 assay. Cell viability in response to BBR was measured by using Cell Counting Kit-8 (CCK-8; MCE, Monmouth Junction, NJ) according to manufacturer’s instructions.
Glycogen Synthesis in HepG2 Cells
Glycogen synthesis was detected using the Glycogen Assay Kit purchased from BioVision (K646-100, Milpitas CA, USA). 1×10⁶ cells were collected for each treatment group and boiled in 200 µL distilled water. After centrifugation, the supernatant was collected. For each sample, 25 µL of the supernatant was taken and added to a well of a 96-well plate. Then, 2 µL of the Hydrolysis Enzyme Mix was added to each well. After incubation for 30 min at room temperature, 50 µL of the reaction mixture was added to each well, followed by a 30-min incubation at room temperature in the dark. The absorbance (570 nm) in each well was measured by a plate reader. Final values were calculated by subtracting the background values obtained from the glucose-zero and glycogen-zero wells.
RNA Extraction and Quantitative Real-Time PCR
Total RNA from liver tissues and cells was extracted using Trizol (Ambion, Carlsbad, CA, USA).23 The quality of each RNA sample (including its concentration and purity) was checked using a Thermo NanoDrop 2000 spectrophotometer. cDNA was synthesized with the PrimeScript RT Reagent Kit (TaKaRa Bio Inc, Shiga, Japan). The primers used are listed in Table S1. RT was performed at 37°C for 15 min and 98°C for 5 min. The PCR protocol for mRNA consisted of 1 cycle of 95°C for 30 sec, 30 cycles of 95°C for 5 sec, 30 cycles of 55°C for 20 sec and 1 cycle of 95°C for 5 sec. All reactions were repeated in triplicate and gene expression was calculated after normalization to GAPDH. The specific stem-loop primers of miR-146b were obtained from Guangzhou RiboBio Co., Ltd. (Guangzhou, China). RT was performed at 42°C for 60 min and 70°C for 10 min. The PCR protocol for miR-146b consisted of 1 cycle of 95°C for 30 sec, 40 cycles of 95°C for 2 sec, 40 cycles of 60°C for 30 sec and 1 cycle of 70°C for 5 sec. All reactions were repeated in triplicate and the quantitative expression data were normalized against U6 RNA.
Western Blotting
The proteins in liver tissues and cultured HepG2 cells were collected, homogenized in radioimmunoprecipitation (RIPA) lysis buffer containing phenylmethylsulfonyl fluoride, and centrifuged at 13,000g for 30 min at 4°C for removal of cellular debris. The protein concentration was determined using a BCA protein assay commercial kit (Thermo, USA). Equal amounts of protein (25 µg) were loaded for sodium dodecyl sulfate (SDS)-polyacrylamide gel electrophoresis (PAGE). Protein samples were separated by electrophoresis and transferred onto a polyvinylidene difluoride (PVDF) membranes. Blots are blocked with 1% bovine serum albumin (BSA, Beyotime Biotechnology, Shanghai, China) or 5% non-fat milk for 1 h and incubated overnight at 4°C with primary antibodies: anti-SIRT1, anti-FOXO1, anti-Acetylated-Lysine and anti-b-actin. All antibodies were from Cell Signaling Technology (Danvers, MA, USA). After washing with the washing buffer, blots were incubated with the corresponding secondary antibody (1:2000, Fcnmacs, Nanjing, China) for 2 h. Photographs were taken, and optical densities of the bands were quantified with the Gel Doc2000 (Bio-Rad, Hercules, CA, USA).
Luciferase Assay
For luciferase reporter experiments, the 3´-UTR segments of SIRT1 predicted to interact with miR-146b were amplified by PCR and inserted into pGL3 vector immediately downstream from the stop codon of luciferase (Promega). HepG2 cells were cotransfected in 12-well plates with 0.4 mg of the firefly luciferase reporter vector and 0.08 mg of the control vector containing Renilla luciferase, pRL-TK (Promega), as well as with 100 nM miR-146b mimics, inhibitor or control miRNA. 48 h later, luminescence was detected using the Dual-Luciferase Reporter Assay System (Promega, USA) according to the protocol. Data were normalized to the Renilla luminescence and presented relative to control miRNA transfected group.24
Statistical Analysis
All data were expressed as the mean ± standard error of the mean (SEM). Results were compared using independent-samples t-tests between two groups and one-way analysis of variance (ANOVA) among more groups with Dunnett’s post-hoc test. p values <0.05 were considered statistically significant.
Results
HFD Increased Body Weight and HOMA-IR in Mice
To evaluate the changes in body weight and HOMA-IR, twelve-week-old male C57BL/6J mice were assigned to two groups wherein one group was fed with standard chow, denoted as “NFD group” (n=12) and the other fed with HFD, denoted as “HFD group” (n=36). The average body weight chosen was similar between the groups at the beginning of the experiment and the changes were recorded weekly. After 4 weeks, the body weight of the HFD group (22.16±0.63g) was higher than that of the NFD group (23.08±0.91g), but the difference was not statistically; After 6 weeks, it was a significant difference in body weight between the two groups (Figure 1A). HFD-induced group leaded to a marked elevation in the levels of glucose (Figure 1B) and insulin (Figure 1C) in the serum region compared to those of the control group. Similarly, the HOMA-IR index was quite high (~6-fold) as expected for the HFD group in comparison to the NFD group (Figure 1D).
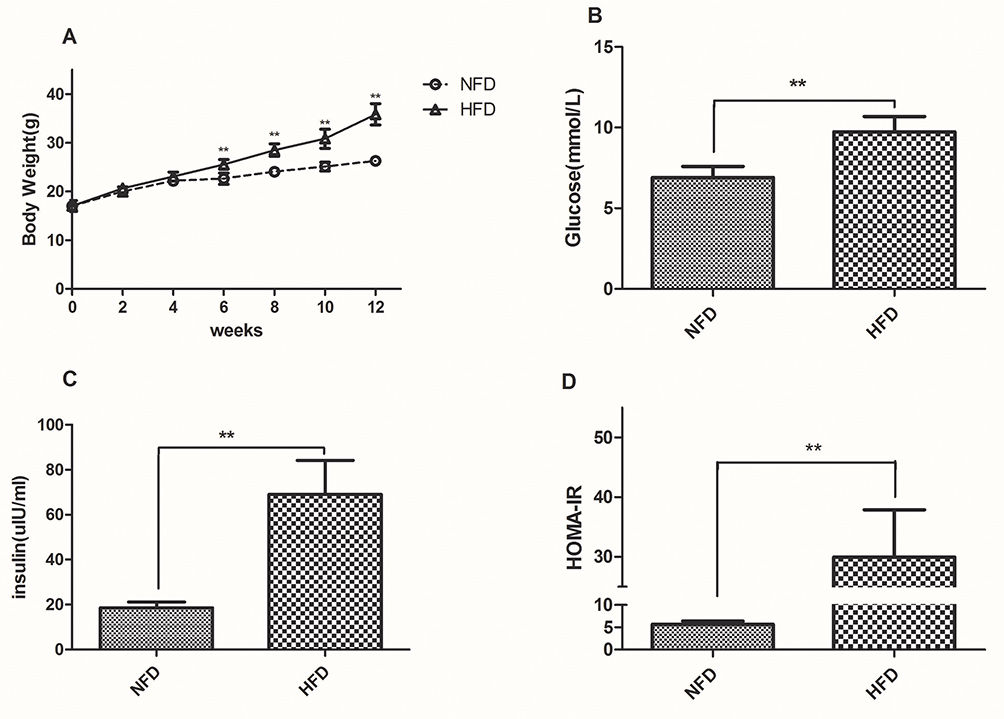 |
Figure 1 Changes in body weight, fasting glucose, insulin and HOMA-IR in the NFD and HFD groups. (A) Body weight was measured weekly during the experiment. (B–D) Fasting glucose, insulin and HOMA-IR was measured after 12 weeks. **p<0.01. |
BBR Ameliorated IR in HFD Mice
To understand the effect of BBR, the mice previously fed with the HFD for 12 weeks were subsequently assigned to three subgroups (n=12) and were treated with either saline, 5 mg/kg BBR, or 10 mg/kg BRR for an additional 4 weeks. Figure 2A shows that within HFD-fed mice, treatment with BBR at 5 mg/kg or 10 mg/kg could alter body weight compared with HFD mice, but these were not statistically significant. Food intake was higher in HFD group than NFD group. BBR treatment, both at low- and high-dose, did not significantly alter food intake in HFD group (Figure 2B). The mice high fat diet fed group leads to a marked elevation in the levels of fasting glucose (Figure 2C), fasting insulin (Figure 2F) and HOMA-IR (Figure 2I) in the serum region compared to those of the control group. Administration of BBR significantly reduces those above indicator expressions as compared to HFD group. The insulin levels rose obviously in HFD group. However, BBR treatment significantly attenuates the effect by increasing the insulin, compared with the HFD group. BBR caused a ~3-fold change in HOMA-IR in the HFD group which was statistically significant when compared to the untreated group. In addition, the IPGTT test and area under the curve (AUC) for the IPGTT (Figure 2D–H) show that the glucose tolerance level in the HFD group significantly reduced after BBR administration. Compared with the HFD group, the groups treated with BBR showed significant improvements in insulin sensitivity.
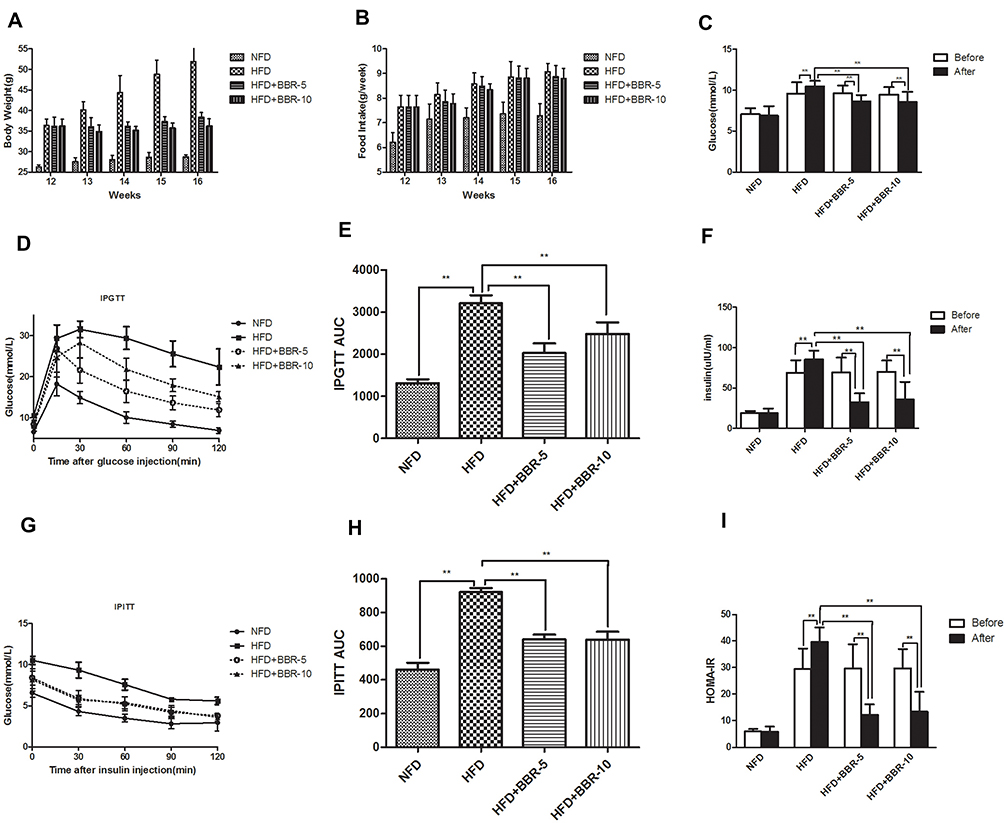 |
Figure 2 (A) Body weight was measured every week during the treatment period. (B) Food intake of mice among different groups. The expression of serum (C) glucose, (F) insulin concentration. Comparison of Insulin Sensitivity, IPGTT (D and E) and IPITT (G and H) among different groups. (I) HOMA-IR was calculated at the end of the experiment. **p<0.01. Data are expressed as the means±SEM of at least three independent experiments. |
Effects of BBR on Hepatic Tissue
Western blotting was used to detect the protein expression level in liver. Figure 3A and B showed that HFD+BBR fed group had ~1.25 fold increase in the protein levels of SIRT1 comparable to that of the NFD group. On the other hand, the level of SIRT1 expression was quite diminished in HFD group. The expression of acetylated (Ac)-FOXO1 was found to be very high in HFD-fed group in comparison to the other groups. The overall analysis shows that although the effect of BBR on the expression of either of the genes was significant but the effect at two different concentrations tested (5mg/Kg, 10mg/Kg) had no notable changes.
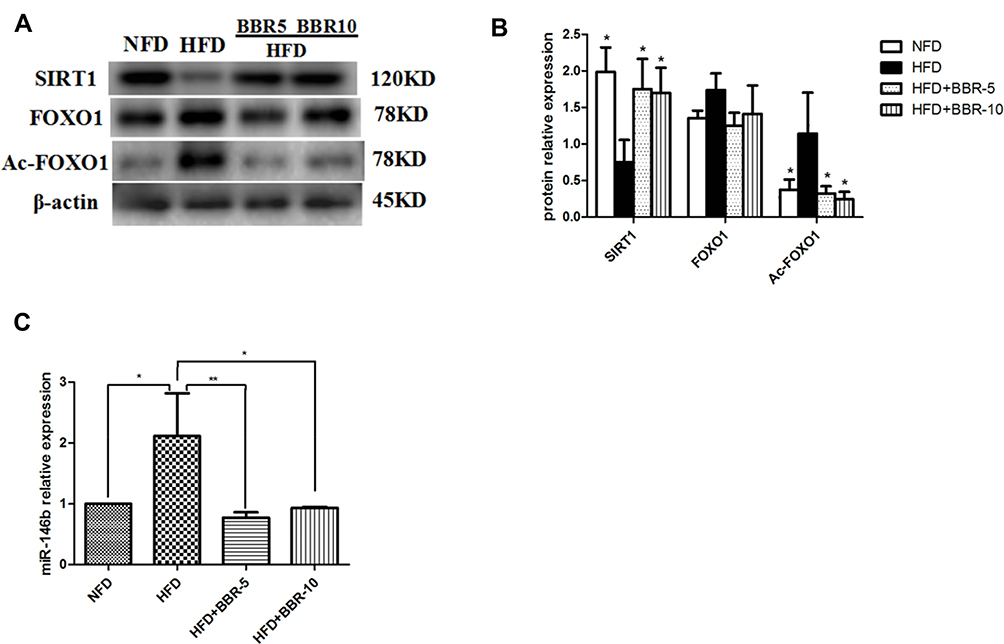 |
Figure 3 (A and B) Total proteins of liver tissues were extracted and subjected to Western blot analysis for the detection of SIRT1, FOXO1, Ac-FOXO1. Representative images are shown (left). For quantification, optical densities of the bands were determined. (C) miR-146b expression in different groups. *p<0.05; **p<0.01. Data are expressed as the means±SEM of at least three independent experiments. |
To determine the changes in miR-146b in the liver of all groups, we used real-time PCR to detect the expression level of miR-146b. As shown in Figure 3C, there was a remarkably increased level of miR-146b expression in the HFD group while a concomitant decrease under the influence of BBR, at the two different concentrations tested.
Histopathological examination of liver sections obtained from the mice from different groups show lipid accumulation in the liver seen as pale discoloration (Figure 4). The number of lipid vacuoles occupying the hepatocyte cytoplasm in HFD fed mice were very high compared to the NFD fed mice. The tissue sections taken after BBR treatment show considerable attenuation of the size of lipid vacuoles which is significant when compared to the HFD fed group.
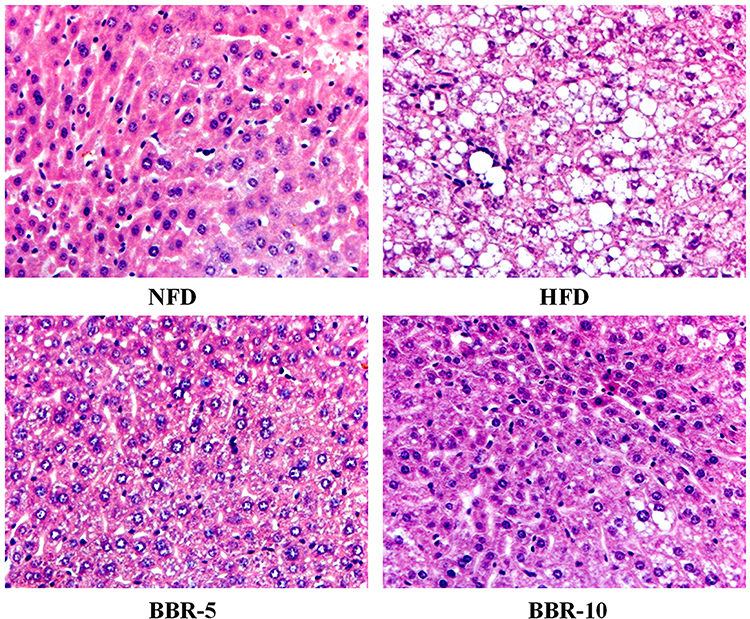 |
Figure 4 Effects of BBR on Hepatic pathological changes. Histological observation of the hematoxylineosin (H&E) sections (original magnification×400). Macrovesicular steatosis was observed in the livers of mice. |
Dose-Dependent Toxicity of BBR and Effect of BBR on Glycogen Synthesis in HepG2 Cells
Initially, we screened the dose curve of PA-induced cell injury of HepG2 cells. The IC50 of PA in HepG2 cells was about 307.8 μM (Figure S2). In the following experiments, we selected 250μM PA to produce the cellular injury model.
Palmitic acid-treated HepG2 cells were treated with different doses (5–30µM) of BBR for 24, 48 hours. After incubation for 24 hours, BBR showed a dose-dependent toxicity towards HepG2 cells with 50% cell death around 20µM (Figure 5). However, after 48 hours of incubation, BBR showed severe toxicity with 50% cell death around 10µM of BBR. Since the cell survival rate was ~90% with <10µM of BBR, so the intervention concentration was set between 5µM and 10 µM for 24 hours. Figure 6 shows that palmitic acid impaired glycogen production but this effect was overcome in combination with BBR. 5µM of BBR did not have drastic reversing effect, but 10µM of BBR was quite effective in reversing the impaired glycogen synthesis induced by palmitic acid (p<0.01). So, we set the intervention concentration of BBR as 10µM for subsequent experiments.
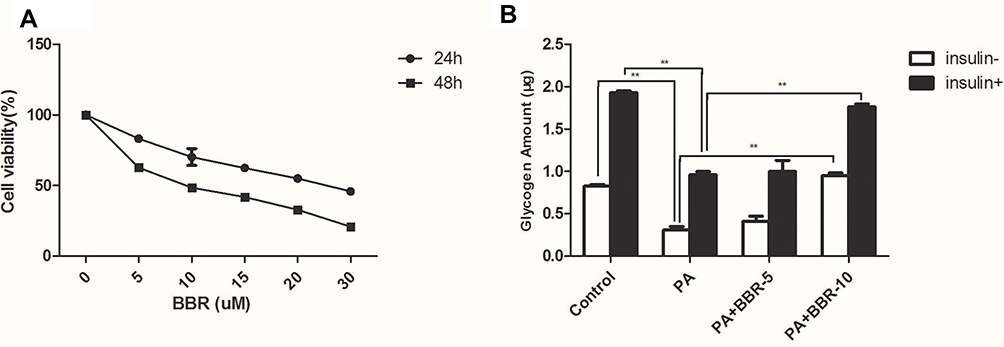 |
Figure 5 (A) Pretreatment with BBR (5, 10, 15, 20, 30µM) for different periods (24, 48 h) protects against PA-induced decrease of cell viability. (B) HepG2 cells were treated with medium, palmitic acid (PA) only, or palmitic acid+BBR (5 or 10 µM) with or without insulin (1×10⁻⁷M). Then glycogen synthesis was measured as indicated in the Materials and Methods. **p<0.01. |
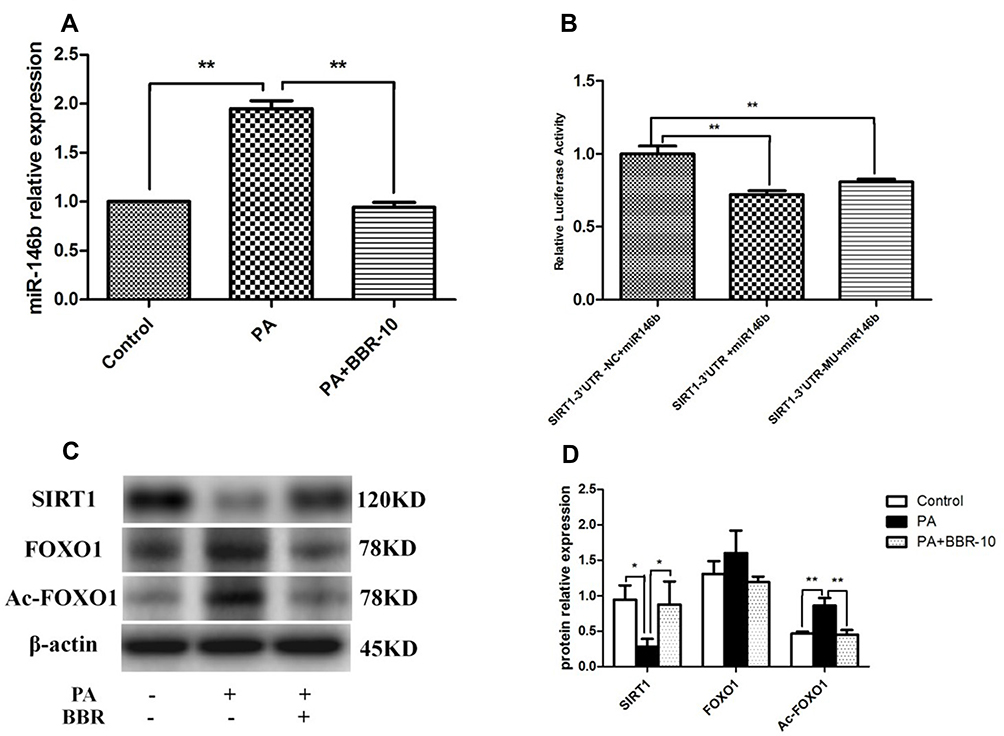 |
Figure 6 miR-146b targeted SIRT1 in HepG2 cells. (A) HepG2 cells were treated with medium, palmitic acid (PA) only, or palmitic acid + BBR (10 µM). Then the expressions of miR-146b were evaluated. (B) HepG2 cells were co-transfected with miR-146b mimics or control miRNA and the reporter plasmid containing 3´-UTR segment of SIRT1, as well as an endogenous control Renilla luciferase plasmid pRL-TK for 48 h, and then the relative luciferase activity in each group was analyzed. (C and D) The expression of SIRT1, FOXO1 and Ac-FOXO1 was detected by Western blot. *p<0.05; **p<0.01. |
BBR Improves Hepatic IR via miR-146b/SIRT1 Signaling Pathway
To examine the impact of BBR administration on miR-146b expression in the presence of PA, we performed RT-PCR of miRNA samples extracted from PA and PA+BBR treated cells. We observed that the expression of miR-146b was increased following palmitic acid treatment, and BBR (10 µM) significantly reduced the palmitic acid-induced expression of miR-146b in HepG2 cells (Figure 6A). To further explore the potential molecular mechanism underlying the anti-inflammation effect of miR-146b, the target genes of miR-146b were predicted using MicroRNA target prediction databases. It showed alignment between miR-146b and SIRT1 (Figures S3 and S4). To confirm that SIRT1 was regulated by miR-146b, 3´-UTR segments were respectively cloned into a reporter plasmid downstream from luciferase, and reporter assays were then performed. It was found that miR-146b mimics robustly reduced SIRT1 reporter gene expression (Figure 6B), the luciferase activities were only 0.6 (SIRT1), significantly lower than those in control group. The data suggested that miR-146b suppressed SIRT1 by direct binding to it 3´-UTR segments.
Following this, we examined the expression of SIRT1, FOXO1 and Ac-FOXO1 in palmitic acid-treated HepG2 cells. As shown by Western blot, the results revealed a significant decrease in SIRT1 expression and marked increase in Ac-FOXO1 expression, and these alterations were compromised through BBR treatment (Figure 6C and D). Taken together, BBR could increase miR-146b targets SIRT1 in HepG2 cells.
To further assess the role of miR-146b in regulating SRIT1 expression, HepG2 cells were transfected with miR-146b mimic for 24 h. This caused a significant increase in the expression of miR-146b (Figure 7A). We investigated the effect of miR-146b on glycogenesis in hepatocytes. miR-146b mimic could decrease glycogen synthesis, but no significant difference was found between them (Figure 7B). However, the expression of SIRT1 decreased in miR-146b overexpressing cells (Figure 7C). Consistent with the results above, treatment of miR-146b mimics HepG2 cells with palmitic acid down-regulated SIRT1 and up-regulated Ac-FOXO1 expression, and these changes were dramatically abolished by BBR treatment (Figure 7D–G). Notably, miR-146b mimic overexpression nearly abolished the aforementioned effect of BBR, suggesting that miR-146 regulates SIRT1 expression, and BBR could up-regulate SIRT1 via miR-146b.
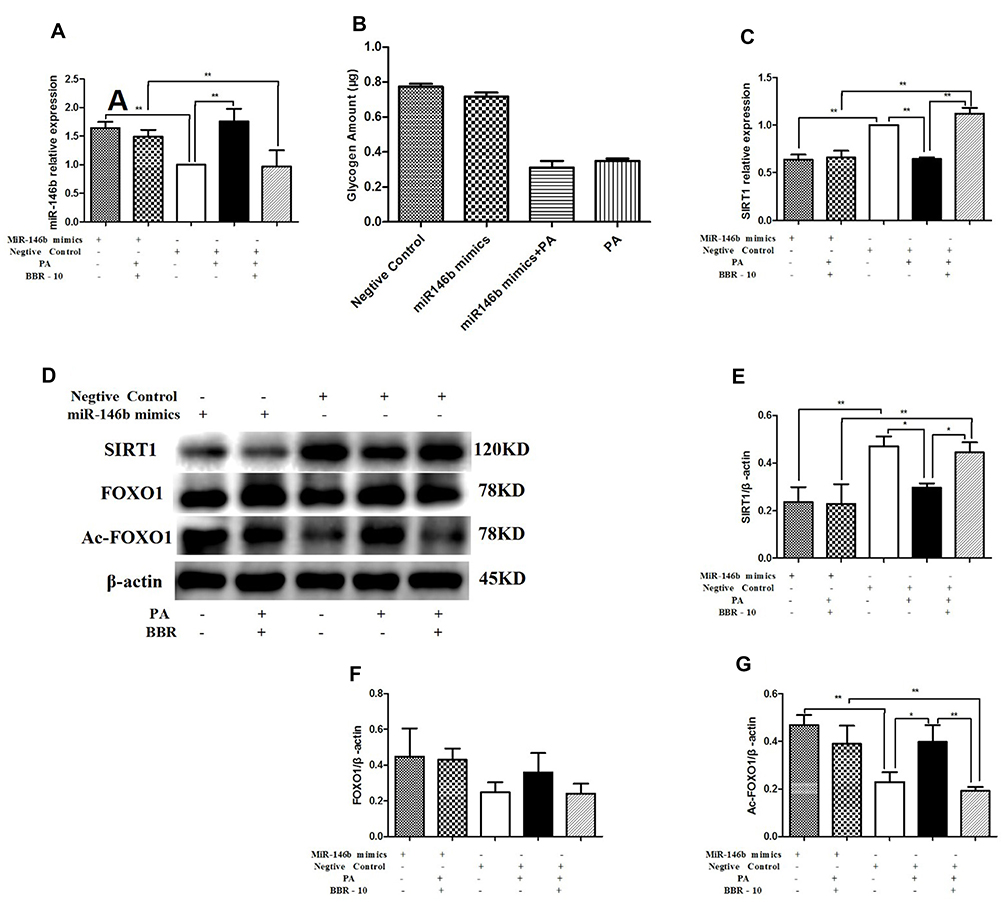 |
Figure 7 HepG2 cells were transfected with miR-146b mimic or a negative control. Then HepG2 cells were treated with medium, palmitic acid (PA) alone, or palmitic acid plus BBR at 10 µmol/L. (A) miR-146b expression was measured by quantitative RT-PCR. (B) Glycogen was measured after transfected with miR-146b mimic. (C) SIRT1 mRNA expression was measured. Whole cell lysates were subjected to Western blotting for the detection of SIRT1, FOXO1 and Ac-FOXO1. Representative images are shown. (D–G) For quantification, the optical densities of the bands were determined. β-actin was used as the loading control. Normalized protein expression levels were calculated. Data from three independent experiments were used for statistical analysis, and results are expressed as the mean±SEM. *p<0.05; **p<0.01. |
In contrast, HepG2 cells treated with miR-146b inhibitor showed significantly decreased expression of miR-146b compared to control cells (Figure 8A). Figure 8B shows that down-regulation of miR-146b reversed palmitic acid-induced suppression of glycogenesis. In addition, the mRNA and protein expression levels of SIRT1 significantly increased in HepG2 cells treated with miR-146b inhibitor, and the protein expression of Ac-FOXO1 was suppressed considerably (Figure 8C–G). These results suggest that treatment with miR-146b inhibitor up-regulated SIRT1 expression, consistent with the results obtained after BBR administration in palmitic acid-treated HepG2 cells.
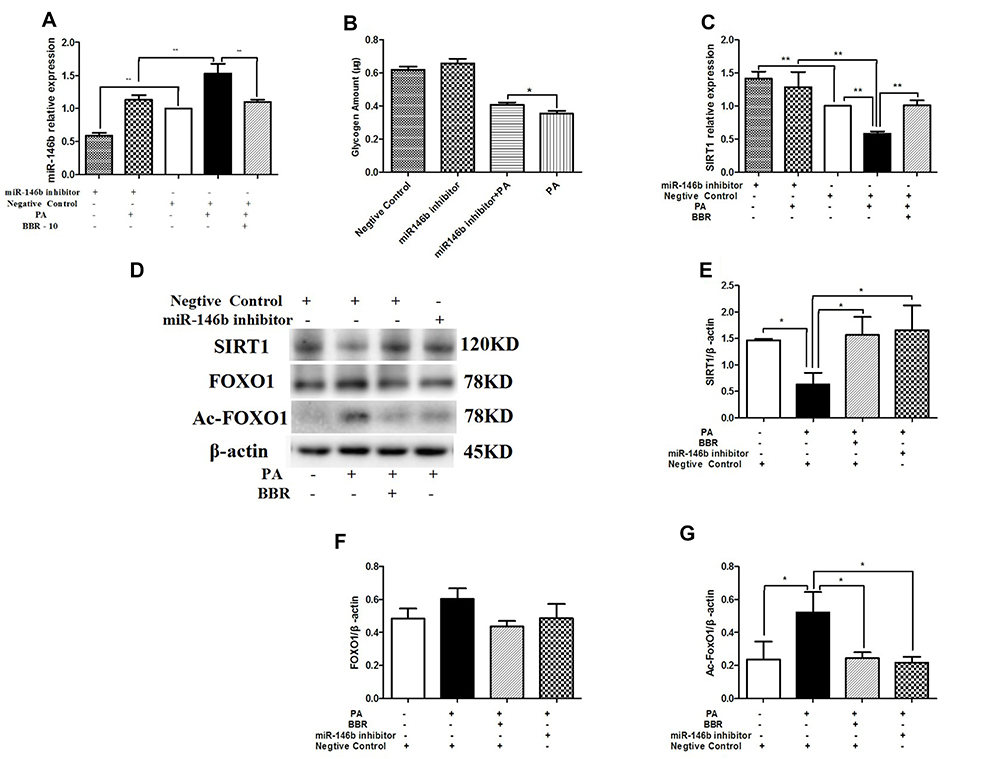 |
Figure 8 HepG2 cells were transfected with miR-146b inhibitor or negative control. Then the HepG2 cells were treated with medium, palmitic acid (PA) alone, or palmitic acid plus BBR at 10 µmol/L. (A) miR-146b expression was measured by qRT-PCR. (B) Glycogen was measured after transfected with miR-146b inhibitor. (C) SIRT1 mRNA expression was measured. Whole cell lysates were subjected to Western blotting for the detection of SIRT1, FOXO1, and Ac-FOXO1. Representative images are shown. (D–G) For quantification, the optical densities of the bands were determined. β-actin was used as the loading control. Normalized protein expression levels were calculated. Data from three independent experiments were used for statistical analysis, and the results are expressed as the mean±SEM. *p<0.05; **p<0.01. |
Discussion
This study investigated the effect of BBR on hepatic IR using a HFD-fed mouse model and palmitic acid-treated HepG2 cells. Our results showed that BBR effectively improved IR and increased the synthesis of liver glycogen, and BBR acted as a miR-146b inhibitor and increased SIRT1 expression by deacetylation of FOXO1 in order to ameliorate hepatic insulin sensitivity.
BBR exerts a variety of pharmacological activities to treat diabetes, such as improving oxidative stress and reducing IR. Consistent with these findings, we found that BBR treatment (5 mg/kg body weight/day in vivo) significantly reduced the AUC for the IPGTT and insulin as well as the HOMA-IR index in vivo. Previous studies have reported that BBR reduced body weight and improved HOMA-IR index without altering food intake in mice by increasing energy dissipation rather than by decreasing food intake;25,26 this was consistent with our study. HE staining showed that the hepatic fat infiltration was significantly improved in BBR-5 group. Glycogen is an important glycometabolism index and glycogen synthesis plays an important role in glucose homeostasis and glycometabolism.27 By acting as an insulin-sensitizing agent, this study also showed that BBR (10μM) significantly improved glycogen synthesis in HepG2 cells treated with palmitic acid. The results demonstrated that BBR can increase hepatic glycogen storage. All these results showed that BBR improved insulin-mediated glucose metabolism and enhanced insulin sensitivity in liver.
Many previous studies have shown that BBR can improve insulin resistance in liver, adipose tissues, and muscle cells by activating AMP-activated protein kinase in animal models of insulin resistance as well as in insulin-responsive cell lines.24,28,29 However, few studies reported that BBR exerts protective functions via SIRT1 signaling under some pathological conditions. SIRT1 is a NAD+-dependent deacetylase that matches the energy output to the energy requirement in the cell by sensing changes in intracellular NAD+. SIRT1 activation is beneficial within metabolic disorders such as obesity, T2DM, and cardiovascular disease.2,30 It plays important roles in liver metabolism. SIRT1 can regulate the activity of FOXO1 by deacetylating FOXO1 to alleviate oxidative stress.
More significantly, recent studies have found that BBR can improve glucose and lipid metabolism of diabetic mice by regulating SIRT1.31,32 In accordance with previous papers, here in, we demonstrate that HepG2 cells induced by palmitic acid to cause ROS and establish insulin resistance HepG2 cell models. The results showed that palmitic acid-treated HepG2 cells could reduce the synthesis of liver glycogen under the condition of insulin resistance, while the administration of BBR significantly reverses impaired hepatic glycogen synthesis by regulating SIRT1/FOXO1 pathway. It has been indicated that SIRT1 activation could protect effects against diabetic through regulating the insulin sensitivity.33,34 In the current experiment, we have also demonstrated that SIRT1 level is down-regulated in the liver tissue of HFD-fed mice and HepG2 cells treated with palmitic acid. Activating SIRT1 signaling with BBR improves insulin sensitivity in liver.
The expression of SIRT1 can be regulated by miRNAs.35 Accumulating researches have revealed that miRNAs are abnormally expressed in metabolic diseases.36 Downregulation of miR-34a increases the expression of SIRT1, which contributes to reduce adiposity in diet-induced obesity mice.37 MiR-212 negatively regulates autophagy by inhibiting SIRT1 expression and miR-106b is obviously decreased in diabetic mice and NIT-1 cells by targeting SIRT1 gene.20,38 Similarly, in this study, the level of miR-146b is obviously creased in liver of IR mice and HepG2 cells with palmitic acid induction. Furthermore, we find that miR-146b directly inhibits the expression of SIRT1 gene through dual luciferase reporter gene assay.
MiR-146b has been reported as a prognostic marker for non-small cell lung cancer and inhibited metastasis of glioma and breast cancer.39–41 MiR-146b can rescue hypoxia-induced apoptosis in cardiomyocytes and improve retinal inflammation in diabetes.42,43 SIRT1 is regulated by miR-146b, and inhibition of miR-146b can alleviate diet-induced obesity through SIRT1 regulation.19 In fact, studies showed that miR-146b positively regulated the differentiation of adipocytes by down-regulating SIRT1 expression in differentiated 3T3-L1 cells,18,28 few studies document expression of miR-146b in liver. Here, we found that SIRT1 expression was also altered upon treatment with a mimic or inhibitor of miR-146b in HepG2 cells. BBR was also shown to up-regulate SIRT1 by down-regulating miR-146b expression. To explore the possible mechanism of miR-146b on the ability of BBR to insulin sensitivity in liver, we investigated the miR-146b inhibitor-dependent effects on SIRT1 concentration and acetylate-FOXO1 activity in HepG2 cells induced by palmitic acid. Here, we investigated the potential role of miR-146b in hepatic insulin resistance. Our data showed that overexpression miR-146b could reduce glycogenesis and miR-146b inhibitor could enhance glycogenesis, although these results were not statistically significant. Interestingly, down-regulation of miR-146b reversed palmitic acid-induced suppression of glycogenesis synthesis (p<0.05). Therefore, we think that miR-146b plays an important role in hepatic glycogenesis.
As is known to all, BBR has various pharmacological activities and improves IR to reduce diabetes progression. In vivo experiment, the level of miR-146b in mice received an intraperitoneal injection BBR was significantly lower than that in high-fat group. We also found that BBR at the dose of 5 mg/kg body weight/day significantly inhibited the expression of miR-146b compared with BBR at the dose of 10 mg/kg body weight/day in HFD-fed mice. In order to further clarify how berberine reduced miR-146b levels, we inhibited and overexpressed miR-146b, respectively. After transfection of mir-146b mimics, BBR could only partially inhibit the overexpression of mir-146b induced by palmitic acid. To explore the possible mechanism of miR-146b on the ability of BBR to TR, we investigate the miR-146b mimic-dependent effects on SIRT1 and acetylate-FOXO1 activity in palmitic acid-treated HepG2 cells. Our results show that miR-146b significantly decreased SIRT1 levels and increased acetylate-FOXO1 activity in HepG2 cells, which blocking of the protective effects of BBR. These data suggest that berberine on liver metabolism through increased SIRT1 might be mediated by the inhibition of miR-146b.
Conclusion
In conclusion, our study is the first attempt to investigate BBR in improving hepatic IR through the miR-146b/SIRT1 pathway. Our in vivo and in vitro results showed that BBR significantly improved glycogen synthesis in liver in the condition of IR. The effect of BBR in down regulation of miR-146b increased SIRT1 expression and subsequent deacetylation of FOXO1 indicate that activation of miR-146b/SIRT1 signaling conferred protective effects against diabetes by improving hepatic IR. The improvement of liver IR is beneficial to delay diabetic progression, application of BBR could be an important option for the prevention and treatment of T2DM. As we all know, there are three critical enzymes involved in the miRNA processing. Combined with DGCR8, Drosha is able to cleavage pri-miRNA into pre-miRNA in the nucleus. Then the pre-miRNA is processed into the mature miRNA by Dicer in the cytoplasm. The limitation of this study is that proteins involved in miRNA biosynthesis such as Dicer have not been analyzed. Therefore, to construct Dicer knockout mouse model and Dicer gene knockout and inhibition model in HepG2 cells, and to verify the specific mechanism of berberine regulating miR146b in vivo and in vitro.
Funding
This work was supported by the National Natural Science Foundation of China (No. 81603585) and Science and technology research project of Xuzhou city (No. KC190401).
Disclosure
All the authors declared no competing interests.
References
1. Das P, Biswas S, Mukherjee S, Bandyopadhyay SK. Association of oxidative stress and obesity with insulin resistance in type 2 diabetes mellitus. Mymensingh Med J. 2016;25(1):148–152.
2. Li R, Xin T, Li D, Wang C, Zhu H, Zhou H. Therapeutic effect of sirtuin 3 on ameliorating nonalcoholic fatty liver disease: the role of the ERK-CREB pathway and Bnip3-mediated mitophagy. Redox Biol. 2018;18:229–243. doi:10.1016/j.redox.2018.07.011
3. Asai A, Chou PM, Bu HF, et al. Dissociation of hepatic insulin resistance from susceptibility of nonalcoholic fatty liver disease induced by a high-fat and high-carbohydrate diet in mice. Am J Physiol Gastrointest Liver Physiol. 2014;306(6):G496–G504. doi:10.1152/ajpgi.00291.2013
4. Finck BN, Hall AM. Does diacylglycerol accumulation in fatty liver disease cause hepatic insulin resistance? Biomed Res Int. 2015;2015:104132. doi:10.1155/2015/104132
5. Ballak DB, Stienstra R, Tack CJ, Dinarello CA, van Diepen JA. IL-1 family members in the pathogenesis and treatment of metabolic disease: focus on adipose tissue inflammation and insulin resistance. Cytokine. 2015;75(2):280–290. doi:10.1016/j.cyto.2015.05.005
6. Yabe D, Seino Y, Fukushima M, Seino S. β cell dysfunction versus insulin resistance in the pathogenesis of type 2 diabetes in East Asians. Curr Diab Rep. 2015;15(6):602. doi:10.1007/s11892-015-0602-9
7. Zhou H, Zhu P, Wang J, Toan S, Ren J. DNA-PKcs promotes alcohol-related liver disease by activating Drp1-related mitochondrial fission and repressing FUNDC1-required mitophagy. Signal Transduct Target Ther. 2019;4:56. doi:10.1038/s41392-019-0094-1
8. Pang B, Zhao LH, Zhou Q, et al. Application of berberine on treating type 2 diabetes mellitus. Int J Endocrinol. 2015;2015:905749. doi:10.1155/2015/905749
9. Wang Y, Liu J, Ma A, Chen Y. Cardioprotective effect of berberine against myocardial ischemia/reperfusion injury via attenuating mitochondrial dysfunction and apoptosis. Int J Clin Exp Med. 2015;8(8):14513–14519.
10. Geng FH, Li GH, Zhang X, et al. Berberine improves mesenteric artery insulin sensitivity through up-regulating insulin receptor-mediated signalling in diabetic rats. Br J Pharmacol. 2016;173(10):1569–1579. doi:10.1111/bph.13466
11. Wu YS, Li ZM, Chen YT, et al. Berberine improves inflammatory responses of diabetes mellitus in Zucker diabetic fatty rats and insulin-resistant HepG2 cells through the PPM1B pathway. J Immunol Res. 2020;2020:2141508. doi:10.1155/2020/2141508
12. Zhang ZG, Zhang HZ, Li B, et al. Berberine activates thermogenesis in white and brown adipose tissue. Nat Commun. 2014;5:5493. doi:10.1038/ncomms6493
13. Zhang Y, Gu Y, Ren H, et al. Gut microbiome-related effects of berberine and probiotics on type 2 diabetes (the PREMOTE study). Nat Commun. 2020;11(1):5015. doi:10.1038/s41467-020-18414-8
14. Zhang X, Zhao YF, Xu J, et al. Modulation of gut microbiota by berberine and metformin during the treatment of high-fat diet-induced obesity in rats. Sci Rep. 2015;5:14405. doi:10.1038/srep14405
15. Sui M, Chen G, Mao X, et al. Gegen qinlian decoction ameliorates hepatic insulin resistance by Silent Information Regulator1 (SIRT1)-dependent deacetylation of Forkhead Box O1 (FOXO1). Med Sci Monit. 2019;25:8544–8553. doi:10.12659/MSM.919498
16. Bartel DP. MicroRNAs: genomics, biogenesis, mechanism, and function. Cell. 2004;116(2):281–297. doi:10.1016/s0092-8674(04)00045-5
17. Hulsmans M, Van Dooren E, Mathieu C, Holvoet P, Mukhopadhyay P. Decrease of miR-146b-5p in monocytes during obesity is associated with loss of the anti-inflammatory but not insulin signaling action of adiponectin. PLoS One. 2012;7(2):e32794. doi:10.1371/journal.pone.0032794
18. Latorre J, Moreno-Navarrete JM, Mercader JM, et al. Decreased lipid metabolism but increased FA biosynthesis are coupled with changes in liver microRNAs in obese subjects with NAFLD. Int J Obes. 2017;41(4):620–630. doi:10.1038/ijo.2017.21
19. Ahn J, Lee H, Jung CH, Jeon TI, Ha TY. MicroRNA-146b promotes adipogenesis by suppressing the SIRT1-FOXO1 cascade. EMBO Mol Med. 2013;5(10):1602–1612. doi:10.1002/emmm.201302647
20. Chen DL, Yang KY. Berberine alleviates oxidative stress in islets of diabetic mice by inhibiting miR-106b expression and up-regulating SIRT1. J Cell Biochem. 2017;118(12):4349–4357. doi:10.1002/jcb.26089
21. Matthews DR, Hosker JP, Rudenski AS, Naylor BA, Treacher DF, Turner RC. Homeostasis model assessment: insulin resistance and beta-cell function from fasting plasma glucose and insulin concentrations in man. Diabetologia. 1985;28(7):412–419. doi:10.1007/BF00280883
22. Zhang DL, Yang N. MiR-3174 functions as an oncogene in rectal cancer by targeting PCBD2. Eur Rev Med Pharmacol Sci. 2019;23(6):2417–2426. doi:10.26355/eurrev_201903_17388
23. Tan Y, Mui D, Toan S, Zhu P, Li R, Zhou H. SERCA overexpression improves mitochondrial quality control and attenuates cardiac microvascular ischemia-reperfusion injury. Mol Ther Nucleic Acids. 2020;22:696–707. doi:10.1016/j.omtn.2020.09.013
24. Li S, Yue Y, Xu W, Xiong S, Ojcius DM. MicroRNA-146a represses mycobacteria-induced inflammatory response and facilitates bacterial replication via targeting IRAK-1 and TRAF-6. PLoS One. 2013;8(12):e81438. doi:10.1371/journal.pone.0081438
25. Lee YS, Kim WS, Kim KH, et al. Berberine, a natural plant product, activates AMP-activated protein kinase with beneficial metabolic effects in diabetic and insulin-resistant states. Diabetes. 2006;55(8):2256–2264. doi:10.2337/db06-0006
26. Guo T, Woo SL, Guo X, et al. Berberine ameliorates hepatic steatosis and suppresses liver and adipose tissue inflammation in mice with diet-induced obesity. Sci Rep. 2016;6:22612. doi:10.1038/srep2261
27. Agius L. Role of glycogen phosphorylase in liver glycogen metabolism. Mol Aspects Med. 2015;46:34–45. doi:10.1016/j.mam.2015.09.002
28. Zhao HL, Sui Y, Qiao CF, et al. Sustained antidiabetic effects of a berberine-containing Chinese herbal medicine through regulation of hepatic gene expression. Diabetes. 2012;61(4):933–943. doi:10.2337/db11-1164
29. Wang H, Liu D, Cao P, Lecker S, Hu Z. Atrogin-1 affects muscle protein synthesis and degradation when energy metabolism is impaired by the antidiabetes drug berberine. Diabetes. 2010;59(8):1879–1889. doi:10.2337/db10-0207
30. Ahn J, Lee H, Jung CH, Choi WH, Ha TY. Zerumbone ameliorates high-fat diet-induced adiposity by restoring AMPK-regulated lipogenesis and microRNA-146b/SIRT1-mediated adipogenesis. Oncotarget. 2017;8(23):36984–36995. doi:10.18632/oncotarget.16974
31. Gomes AP, Duarte FV, Nunes P, et al. Berberine protects against high fat diet-induced dysfunction in muscle mitochondria by inducing SIRT1-dependent mitochondrial biogenesis. Biochim Biophys Acta. 2012;1822(2):185–195. doi:10.1016/j.bbadis.2011.10.008
32. Lin Y, Sheng M, Weng Y, et al. Berberine protects against ischemia/reperfusion injury after orthotopic liver transplantation via activating Sirt1/FoxO3α induced autophagy. Biochem Biophys Res Commun. 2017;483(2):885–891. doi:10.1016/j.bbrc.2017.01.028
33. Koncsos G, Varga ZV, Baranyai T, et al. Diastolic dysfunction in prediabetic male rats: role of mitochondrial oxidative stress. Am J Physiol Heart Circ Physiol. 2016;311(4):H927–H943. doi:10.1152/ajpheart.00049.2016
34. Ding M, Lei J, Han H, et al. SIRT1 protects against myocardial ischemia–reperfusion injury via activating eNOS in diabetic rats. Cardiovasc Diabetol. 2015;14:143. doi:10.1186/s12933-015-0299-8
35. Choi SE, Kemper JK. Regulation of SIRT1 by microRNAs. Mol Cells. 2013;36(5):385–392. doi:10.1007/s10059-013-0297-1
36. Li R, Toan S, Zhou H. Role of mitochondrial quality control in the pathogenesis of nonalcoholic fatty liver disease. Aging. 2020;12(7):6467–6485. doi:10.18632/aging.102972
37. Fu T, Seok S, Choi S, et al. MicroRNA 34a inhibits beige and brown fat formation in obesity in part by suppressing adipocyte fibroblast growth factor 21 signaling and SIRT1 function. Mol Cell Biol. 2014;34(22):4130–4142. doi:10.1128/MCB.00596-14
38. Ramalinga M, Roy A, Srivastava A, et al. MicroRNA-212 negatively regulates starvation induced autophagy in prostate cancer cells by inhibiting SIRT1 and is a modulator of angiogenesis and cellular senescence. Oncotarget. 2015;6(33):34446–34457. doi:10.18632/oncotarget.5920
39. Raponi M, Dossey L, Jatkoe T, et al. MicroRNA classifiers for predicting prognosis of squamous cell lung cancer. Cancer Res. 2009;69(14):5776–5783. doi:10.1158/0008-5472.CAN-09-0587
40. Xia H, Qi Y, Ng SS, et al. microRNA-146b inhibits glioma cell migration and invasion by targeting MMPs. Brain Res. 2009;1269:158–165. doi:10.1016/j.brainres.2009.02.037
41. Bhaumik D, Scott GK, Schokrpur S, Patil CK, Campisi J, Benz CC. Expression of microRNA-146 suppresses NF-κB activity with reduction of metastatic potential in breast cancer cells. Oncogene. 2008;27(42):5643–5647. doi:10.1038/onc.2008.171
42. Li JW, He SY, Feng ZZ, et al. MicroRNA-146b inhibition augments hypoxia-induced cardiomyocyte apoptosis. Mol Med Rep. 2015;12(5):6903–6910. doi:10.3892/mmr.2015.4333
43. Fulzele S, El-Sherbini A, Ahmad S, et al. MicroRNA-146b-3p regulates retinal inflammation by suppressing adenosine deaminase-2 in diabetes. Biomed Res Int. 2015;2015:846501. doi:10.1155/2015/846501
 © 2021 The Author(s). This work is published and licensed by Dove Medical Press Limited. The
full terms of this license are available at https://www.dovepress.com/terms
and incorporate the Creative Commons Attribution
- Non Commercial (unported, 3.0) License.
By accessing the work you hereby accept the Terms. Non-commercial uses of the work are permitted
without any further permission from Dove Medical Press Limited, provided the work is properly
attributed. For permission for commercial use of this work, please see paragraphs 4.2 and 5 of our Terms.
© 2021 The Author(s). This work is published and licensed by Dove Medical Press Limited. The
full terms of this license are available at https://www.dovepress.com/terms
and incorporate the Creative Commons Attribution
- Non Commercial (unported, 3.0) License.
By accessing the work you hereby accept the Terms. Non-commercial uses of the work are permitted
without any further permission from Dove Medical Press Limited, provided the work is properly
attributed. For permission for commercial use of this work, please see paragraphs 4.2 and 5 of our Terms.