Back to Journals » International Journal of Nanomedicine » Volume 19
Bare-Metal Stent Tracking with Magnetic Particle Imaging
Authors Wegner F ![]() , Friedrich T
, Friedrich T ![]() , Wattenberg M, Ackers J, Sieren MM
, Wattenberg M, Ackers J, Sieren MM ![]() , Kloeckner R
, Kloeckner R ![]() , Barkhausen J
, Barkhausen J ![]() , Buzug TM, Graeser M
, Buzug TM, Graeser M ![]() , von Gladiss A
, von Gladiss A ![]()
Received 14 November 2023
Accepted for publication 12 February 2024
Published 5 March 2024 Volume 2024:19 Pages 2137—2148
DOI https://doi.org/10.2147/IJN.S447823
Checked for plagiarism Yes
Review by Single anonymous peer review
Peer reviewer comments 2
Editor who approved publication: Dr Kamakhya Prakash Misra
Franz Wegner,1 Thomas Friedrich,2 Maximilian Wattenberg,2 Justin Ackers,2 Malte Maria Sieren,1,3 Roman Kloeckner,1 Joerg Barkhausen,3 Thorsten M Buzug,2,4 Matthias Graeser,2,4 Anselm von Gladiss5
1Institute for Interventional Radiology, University of Luebeck, Luebeck, Germany; 2Fraunhofer Research Institution for Individualized and Cell-Based Medical Engineering IMTE, Luebeck, Germany; 3Department of Radiology and Nuclear Medicine, University of Luebeck, Luebeck, Germany; 4Institute of Medical Engineering, University of Lubeck, Luebeck, Germany; 5Institute for Computer Science, University of Koblenz, Koblenz, Germany
Correspondence: Franz Wegner, University of Luebeck, Institute for Interventional Radiology, Ratzeburger Allee 160, Luebeck, 23538, Germany, Tel +4945150072388, Fax +4945150017004, Email [email protected]
Purpose: Magnetic particle imaging (MPI) is an emerging medical imaging modality that is on the verge of clinical use. In recent years, cardiovascular applications have shown huge potential like, e.g., intraprocedural imaging guidance of stent placement through MPI. Due to the lack of signal generation, nano-modifications have been necessary to visualize commercial medical instruments until now. In this work, it is investigated if commercial interventional devices can be tracked with MPI without any nano-modification.
Material and Methods: Potential MPI signal generation of nine endovascular metal stents was tested in a commercial MPI scanner. Two of the stents revealed sufficient MPI signal. Because one of the two stents showed relevant heating, the imaging experiments were carried out with a single stent model (Boston Scientific/Wallstent-Uni Endoprothesis, diameter: 16 mm, length: 60 mm). The nitinol stent and its delivery system were investigated in seven different scenarios. Therefore, the samples were placed at 49 defined spatial positions by a robot in a meandering pattern during MPI scans. Image reconstruction was performed, and the mean absolute errors (MAE) between the signals’ centers of mass (COM) and ground truth positions were calculated. The stent material was investigated by magnetic particle spectroscopy (MPS) and vibrating sample magnetometry (VSM). To detect metallic components within the delivery system, nondestructive testing via computed tomography was performed.
Results: The tracking of the stent and its delivery system was possible without any nano-modification. The MAE of the COM were 1.49 mm for the stent mounted on the delivery system, 3.70 mm for the expanded stent and 1.46 mm for the delivery system without the stent. The results of the MPS and VSM measurements indicate that besides material properties eddy currents seem to be responsible for signal generation.
Conclusion: It is possible to image medical instruments with dedicated designs without modifications by means of MPI. This enables a variety of applications without compromising the mechanical and biocompatible properties of the instruments.
Keywords: magnetic particle imaging, instrument tracking, interventional instruments, stent, medical imaging
Introduction
Magnetic particle imaging (MPI) is a tracer-based three-dimensional imaging modality.1 Its intended principle is the visualization of the spatial distribution of superparamagnetic iron-oxide nanoparticles (SPION) due to their non-linear magnetization. The method holds a preclinical status, but first human scale MPI systems have become available.2–4 Thus, clinical pilot studies seem to be imminent.
MPI offers a wide range of potential preclinical and clinical applications. A very promising medical use case of MPI is the guidance of endovascular interventions. Multiple proof-of-concept studies illustrated, e.g., the potential of radiation-free stent implantation, balloon angioplasty and artifact-free stent lumen quantification.5–7 Especially, the high temporal resolution which allows for real-time imaging8 renders MPI very advantageous to overcome the harmful characteristic of X-ray-based periprocedural imaging.
Because of its tracer-based principle, most medical instruments are invisible in MPI, as they do not generate sufficient MPI signal.7,9,10 To overcome this limitation, endovascular devices like stents, catheters and guidewires have been modified with dedicated marking technologies to make them visible in MPI.5,11–13 SPION-coatings as well as polymer-integrated nanoparticles have been introduced as visualization techniques. However, both approaches change the mechanical properties of the devices and require sophisticated production steps. A previous study was able to observe MPI signal generation caused by guidewires without any nanoparticle modification.9 Furthermore, the possibility to steer and monitor small magnetic devices, e.g., bare needles with MPI, was elaborated.14 However, it remains unclear if MPI can track medical devices without nano-modifications.
The visualization of a stent and its associated application system are of utmost clinical importance in both therapeutic interventions and diagnostic scenarios. In this study, bare-metal stents with large diameters were tested regarding potential MPI signal-generation. To gain knowledge regarding the underlying electromagnetic effects, a signal generating metallic stent was tested in different morphological scenarios. Based on the observed MPI signal, accurate tracking of the endovascular stent and its delivery system without further modification was realized. Thus, dedicated instrument designs allow for precise instrument tracking by MPI without the need of nano-modification.
Materials and Methods
Stents
First, nine metallic commercially available endovascular stents and stent grafts were tested regarding potential MPI signal generation (Table 1). The evaluated stents were made from stainless steel, cobalt-chromium, or nitinol. The lengths were between 25 mm and 100 mm. The stents were selected based on a previous study which showed insufficient signal generation of stents with diameters up to 10 mm.7 To prove this assumption for larger diameters we tested stents with diameters of 10 to 31 mm in this work. The stents were implanted in polyvinyl-chloride tubes according to their corresponding stent diameter before testing.
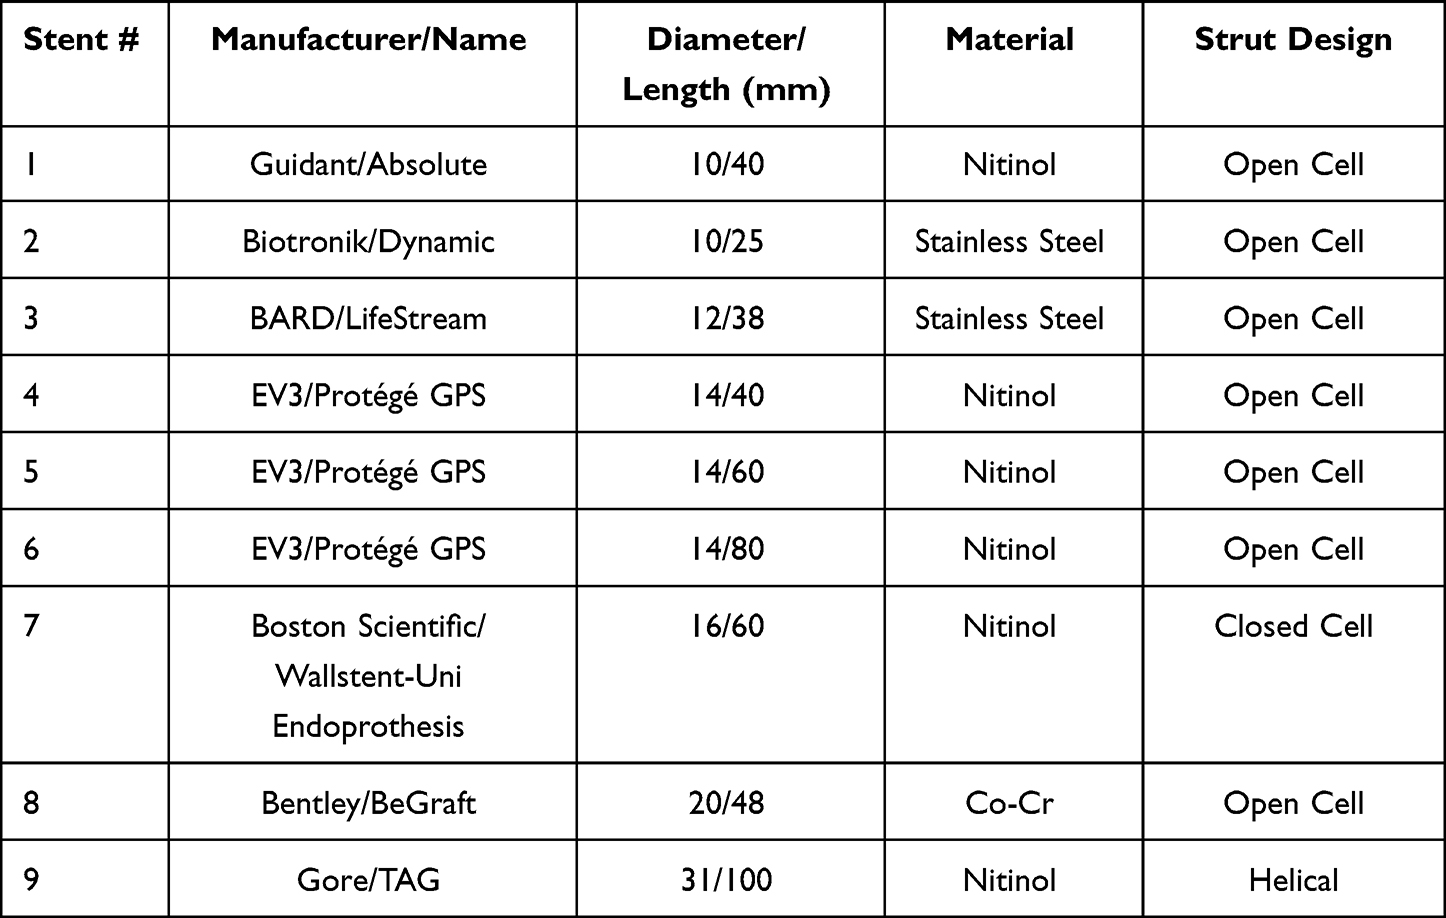 |
Table 1 Details of the Investigated Stents |
Second, according to the MPI signal results (see Results section) all further experiments were carried out with the Boston Scientific Wallstent Uni Endoprosthesis (16 mm × 60 mm) and its delivery system (Figure 1).
 |
Figure 1 Images of the seven different measurement scenarios of the stent and its delivery system. Scenarios 1 and 5 are represented by the same photography since the delivery system looks identical from the outside before and after stent implantation as the stent is covered by the blue part of the delivery system before deployment. |
Therefore, different scenarios were set up: 1) the crimped stent in its factory state, loaded on a delivery system, 2) the stent expanded and manually crimped to 5 mm, 3) fully expanded to 16 mm, 4) fully expanded and cut-open. To determine if the delivery system contributes to the received signal, 5) the entire delivery system has been measured without the stent and 6) the outer blue and 7) the inner white part of the delivery system were analyzed separately. The reduction of the stent diameter from 16 mm to 5 mm was performed to reduce the cross-sectional area and therefore reduce eddy currents induced.15,16 The longitudinal cutting was intended to interrupt the tangential conductor loop and thus blocking most eddy currents.15 The separated stent sides were fixed by silicone with 1 mm distance (Figure 1, arrows).
Magnetic Particle Imaging
First, the nine stents were fully expanded (scenario 3 in the previous section) and have been measured individually in a preclinical MPI system (MPI 25/20FF, Bruker BioSpin, Ettlingen, Germany) using the following measurement parameters: selection field gradient strengths of 1.25 T/m in x- and y-direction and 2.5 T/m in z-direction; drive field strengths of 12 mT in each direction. The drive field frequencies were 24.510 kHz, 26.042 kHz, and 25.252 kHz in x-, y-, and z-direction, respectively. The received signal has been averaged 1.000 times resulting in a measurement time of about 22 seconds per stent. For this and all the following experiments, a background signal has been subtracted. The noise floor of the MPI system has been determined by the mean signal and standard deviation of multiple empty measurements and was used for calculating the signal-to-noise-ratio (SNR) of the stents’ measured signals (Figure 2).
Then, the stent #7 (Wallstent Uni Endoprosthesis, Boston Scientific, Marlborough, USA) has been selected for imaging experiments as it featured the highest number of measured frequency components above an SNR-threshold of 5 (Rose’s criterion17), see Figure 2, and did not show drastic heating in a corresponding experiment.18 For imaging, the stent and its delivery system were situated in the seven different scenarios described in the previous section and displayed in Figure 1.
Each of the scenarios has been investigated as follows: the sample i.e. the stent with or without the delivery system was mounted on a robot aligned along the scanners’ z-axis and moved to the center of the MPI system. A system matrix featuring 29 × 29 measurement positions has been acquired in a field of view (FOV) of 56 × 56 mm² in the zero-plane of z-direction. The selection field gradient strength was 0.5 T/m in x-and y-direction and 1.0 T/m in z-direction resulting in a drive field FOV of 48x48x24 mm³ using the same drive field parameters as above. The size of the drive field FOV was selected for capturing almost the whole stent at the central position of the FOV. Then, the sample has been measured again at 49 pre-defined spatial positions within the FOV, which are the ground truth positions displayed in Figures 3 and 4.
The measurement signals of the 49 spatial positions were reconstructed to images using the corresponding system matrix and a regularized Kaczmarz algorithm. Only frequency components between 60 kHz and 800 kHz have been used for reconstruction. Additional reconstruction parameters are displayed in Table 2. For reconstructing images for scenarios 6 and 7 (outer blue and inner white part of the delivery system), the system matrix of scenario 5 (entire delivery system) has been used. After reconstruction, the centers of mass have been calculated for each frame in each scenario discarding low intensity values (see thresholds indicated in Table 2). Last, the mean absolute error (MAE) of the centers of mass has been determined for each scenario.
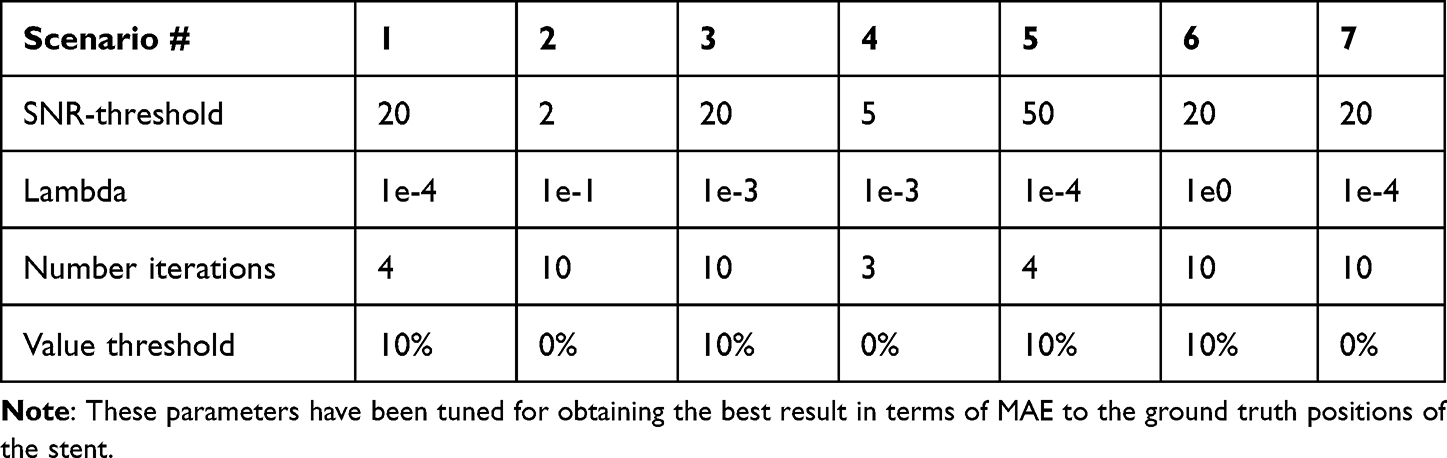 |
Table 2 Parameters Used for Reconstructing the 49 Frames of Each Scenario and for Calculating the Centers of Mass |
Magnetic Particle Spectroscopy
To investigate the source of the MPI signal of the Boston Scientific Wallstent-Uni Endoprosthesis (stent #7), magnetic particle spectroscopy (MPS) measurements were conducted on parts of the stent. The one-dimensional MPS measurements were performed in a self-constructed spectrometer19 using a sinusoidal excitation field with 20 mT amplitude at a frequency of 25 kHz. To improve the SNR of the measurements, around 0.4 seconds of data was acquired and averaged. For each measurement, a background measurement was taken to subtract the static background signal.
The tested samples were 1) a single strut segment cut to a length of approximately 4 mm, 2) four strut segments of the same length and 3) one complete strut extracted from the stent without the use of ferromagnetic tools to avoid contamination from cutting the strut. The individual struts were oriented to be roughly aligned with the excitation field. The complete strut was bent multiple times to fit into the sample tube of the MPS. To compare the measurements to the dynamic background remaining after background subtraction, an empty control measurement was conducted as well. The Figures 5 and 6 have been generated as followed: The raw data of the measurements have been processed with a Python script. Then, the processed data has been plotted using the TikZ-package and pgfplots-package of LaTex.
Vibrating Sample Magnetometry
In addition to the measurements of the dynamic magnetization curve using the MPS, the static B-H-curve of the stent material was measured using a vibrating sample magnetometer (VSM) (Lakeshore 8607 VSM, Westerville, USA). The sample was a single 4 mm stent strut fragment, which was prepared without the use of ferromagnetic tools to prevent contamination. The field was swept from 1 T to −1 T and back to 1 T in steps of 2 mT, while the magnetic moment was averaged for 0.5 seconds at each point. From the linear part above 200 mT, the strength of the paramagnetic background was extracted and used to correct the measurement.
Nondestructive Testing via Computed Tomography
To analyze the internal structure of the stent delivery system as potential signal source, the outer blue part was scanned with an FF35 CT-System (Comet Yxlon GmbH, Hamburg, Germany). The tip of the delivery catheter was scanned with a tube voltage of 145 kV and tube current of 80 mA. The set magnification of 24 combined with a detector binning of one and a pixel pitch of 150 µm resulted in a tomogram resolution of 6.1 µm. The tomogram was reconstructed with an FDK filtered back projection approach and a jitter alignment of the projection images. Jitter alignment ensures high image quality by calculating the actual rotation center point from comparison of opposing projection images. The reconstruction was performed using CERA (Siemens Healthineers AG, Erlangen, Germany).
Results
Magnetic Particle Imaging
The visualization of the calculated SNR in Figure 2 shows that each of the stents has frequency components with an SNR-value >5 (Rose’s criterion).
 |
Figure 2 Calculated SNR of the frequency components measured over the receive coil in x-direction of the MPI scanner for stents featuring an open-cell strut design (top) and a closed-cell and helical strut design (bottom). The number of frequency components above an SNR threshold of 5 are given for each tested stent after the colon. Based on these findings, stent #7 has been selected for the imaging experiments. |
However, the stents featuring an open-cell strut design showed only strayed relevant frequency components and, therefore, have not been considered further. Stents #7 and #9 having a closed-cell and helical strut design, respectively, revealed a higher number of frequency components that hit Rose’s criterion. As stent #9 showed drastic heating during exposition to the magnetic drive field in a previous experiment,18 it has not been considered for the imaging experiments. Instead, stent #7 showed a significant amount of frequency components, while the heating was much less pronounced. This observation correlates well with the smaller stent diameter of 16 mm instead of 31 mm.
Figure 3 shows the calculated centers of mass of the reconstructed images for each scenario. Additionally, the ground truth position of the measured sample, which is the position of the robot, is indicated. The MAE for each scenario is specified.
 |
Figure 3 Calculated centers of mass (COM, solid lines) and ground truth coordinates (coordinates) for each measurement frame (49 spatial positions) for each measurement scenario. Positions in x- and y-direction are encoded in blue and red, respectively. The MAE is lowest for scenarios 1 and 5. Tracking is not possible for scenarios 2 and 7. |
From visual impression and according to the MAE, the positions of the crimped stent (scenario 1) and the delivery system (scenario 5) can be determined with an accuracy below the spatial resolution of the reconstructed images, which is 2 mm in both x- and y-direction and corresponds to the system matrix spacing. The fully expanded stent (scenarios 3 and 4) can be tracked with an accuracy of about 4 mm, which corresponds to two pixels in the reconstructed images. When imaging the outer blue part of the delivery system (scenario 6), the MAE increases to 6.78 mm. In Figure 3, the trends of the calculated and ground-truth centers of mass correspond. For scenario 2, which is the 5 mm expanded stent, a vague trend of the calculated centers of mass can still be identified. However, the MAE increases to more than 10 mm. The MAE rises even to more than 13 mm when imaging the inner white part of the delivery system (scenario 7). Here, a trend of the calculated centers of mass cannot be identified.
A selection of reconstructed images is visualized in Figure 4. Five images are shown for the four scenarios: 1) stent crimped on the delivery system, 3) stent expanded to 16 mm, 5) entire delivery system without the stent and 6) only the outer blue part of delivery system. Both ground truth positions (red circle) and the calculated centers of mass (green circle) and their distances are indicated. The crimped stent in the delivery system (top row) and the whole delivery system (third row) are represented as single dots in the reconstructed images. Its calculated positions correspond well to the ground truth positions. After expansion to 16 mm (second row), the stent cannot be identified in the reconstructed images, as only large areas with an unclear contour are reconstructed. However, the calculated centers of mass show little distance to the ground truth positions especially near the center of the FOV, which corresponds to the calculated MAE of 3.70 mm (see Figure 3). When imaging the outer blue part of the delivery system (Figure 4 bottom row), its real position cannot be identified correctly. Nevertheless, the calculated centers of mass show the same trend as the ground truth positions.
 |
Figure 4 Selection of reconstructed images of four scenarios (sorted in rows). The calculated centers of mass and ground truth positions are indicated with green and red circles, respectively. The Euclidean distance between the positions is given in the title. The stent position is depicted clearly when being crimped on a catheter (top row). The MAE of 1.49 mm is lower than the spatial resolution of the image, which is 2 mm in both directions. The MAE is higher for the expanded stent (to 16 mm, second row), MAE = 3.70 mm, and the stent is not depicted well in the reconstructed images. As the expanded stent covers a large area of the FOV, an artefact-like reconstruction is plausible. The positions of the whole delivery system (outer blue and inner white part, third row) are depicted with an MAE = 1.46 mm. When imaging only the outer blue part of the delivery system (bottom row), the MAE increases to MAE = 6.78 mm and the reconstructed images do not represent the delivery system well. However, based on the calculated centers of mass (see Figure 3), a rough estimate of the delivery system’s position would still be possible. Note that the reconstruction parameters have been tuned to get the best result in terms of MAE between the ground truth position of the sample and the center of mass of the reconstructed images, which might decrease the image quality. |
Magnetic Particle Spectroscopy
The results of the MPS measurements are shown in Figure 5. The complete strut and strut segments showed detectable non-linear magnetization effects resulting in a detectable signal up to the seventh harmonic of the excitation frequency. With a single strut, the total amount of material was smaller, but the measurement still revealed a detectable change in magnetization.
 |
Figure 5 MPS measurements of a single stent strut and strut fragments. |
Vibrating Sample Magnetometry
A first analysis of the obtained magnetization curve shows a paramagnetic behavior (Figure 6). To find out, if there are underlying non-linear contributions of lower magnitude in the dataset, a linear function has been fitted to the region, where the absolute values of the flux density were above 200 mT. Consequently, the slope of the linear fit, which corresponds to a susceptibility of 4.6 10−6, has then been subtracted from the original data, which revealed a very faint ferromagnetism in the range of magnetic flux densities between –200 mT and 200 mT with a saturation moment value of roughly 5 nAm² and some hysteresis barely resolvable in the noise of the data (Figure 6).
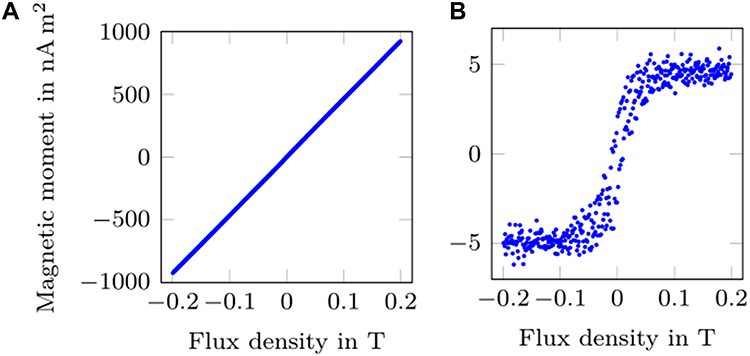 |
Figure 6 (A) Left: Magnetic moment of a stent strut as a function of the flux density of a static external magnetic field, obtained with a VSM. (B) Right: The linear paramagnetic background has been subtracted to magnify the non-linear contributions. |
Nondestructive Testing via Computed Tomography
Figure 7 shows a 3D rendering and CT slices throughout the delivery system with thin metal-wires (bright dots). The images reveal the inner metallic supporting structure of the delivery system. Overall, the metal structure consists of multiple clockwise and counter-clockwise oriented helical metal-wire-threads, which intertwine periodically. Thereby, each of the wire-threads consists of two individual wires, which are parallelly arranged. Additionally, the top of the stent is enclosed by a metal ring, which functions as an X-ray marker.
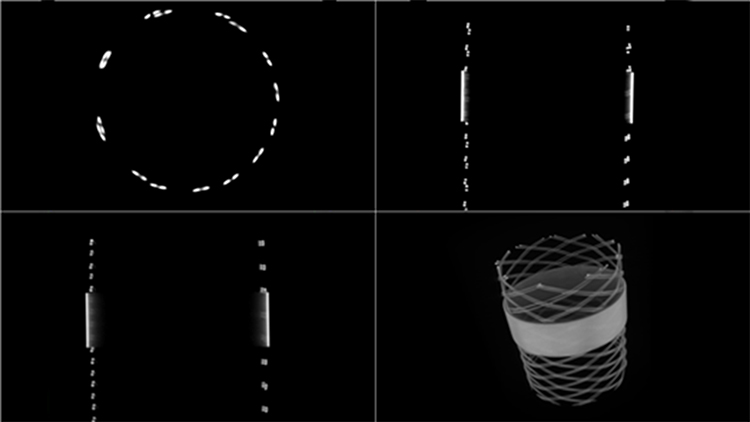 |
Figure 7 Orthogonal slices and 3D rendering (bottom right) of CT images throughout the outer blue part of the stent delivery system, revealing an internal metallic stent-like structure. |
Discussion
In this work, we show the possibility to track a stent and its delivery system without nano-modification in MPI. The MPI measurements shown in Figure 2 indicate that stents may generate sufficient signal for tracking with an MPI scanner. Regarding a potential clinical application, three scenarios are of high interest: First, a crimped stent is guided to the region of interest within a patient using a delivery system (scenario 1). Then, the stent is expanded and implanted (scenario 3). Last, the delivery system is removed from the patient (scenario 5). The results visualized in Figures 3 and 4 show that these three scenarios can be guided using MPI. Both the insertion and removal of the delivery system can be tracked with an MAE of less than 1.5 mm, which in this measurement scenario corresponds to a deviation smaller than the pixel spacing. The expanded stent can be located later with an MAE of 3.7 mm, which corresponds to a deviation of less than two pixels.
In the clinical routine, the placement of endovascular stents is realized by X-ray guided fluoroscopy and digital subtraction angiography (DSA). These established techniques cause substantial radiation exposures for patients and the medical staff. In the last years, multiple proof-of-concept studies illustrated the huge potential of MPI for cardiovascular imaging and the monitoring of endovascular interventions.6,8,10 A possible clinical application is to monitor stent implantation and balloon angioplasty in real-time with MPI.5,20 In this context, stents were understood to be invisible in MPI as they did not generate sufficient MPI signal in previous studies.7,9 The study design of the previous work differed mainly regarding the diameter of the investigated stents. The different types of stent designs are represented in both works. In the previous study, the Boston Scientific Carotid Wallstent (7 mm diameter, 30 mm length) did not show sufficient MPI signal. However, in this work, MPI signal was measured using the Boston Scientific Wallstent Uni Endoprosthesis (16 mm diameter, 60 mm length), featuring a similar strut design. This supports the assumption, that the diameter is an important parameter regarding the generation of eddy currents and MPI signal. Haegele et al investigated unmodified catheters and guidewires and could show that some of the tested guidewires generated relevant MPI signal. As no image reconstruction was realized, it remains unclear if the signals were sufficient for instrument localization or imaging, respectively. Since most of the interventional instruments do not generate MPI signal, the investigated application scenarios required dedicated marking technologies. In this regard, varnish-based techniques have been introduced. Therefore, the instruments are coated with nanoparticle-containing varnishes.5,11,12,20 This approach leads to sufficient imaging properties but changes the mechanical and biocompatible characteristics of the instruments. Thus, the use of commercially available medical products with MPI signal generating characteristics is very promising regarding the clinical application of MPI. Since no modifications are made to the medical products, there is no need for extensive re-licensing. For non-metallic devices sophisticated technologies are further needed. A recently introduced technique describes the incorporation of nanoparticles in the polymer of a balloon catheter.13
The possibility to track interventional instruments in MPI without nano-modification offers a variety of application scenarios with unaffected device properties. Especially, the implantation of endovascular stents and its guidance without radiation is very promising. Furthermore, the catheterization of complex vasculatures during endovascular procedures, which is often associated with high radiation exposure, could be realized by the introduced tracking technique. To discriminate different signal generating objects, multicolor MPI can be used.21 Thus, the differentiation between, e.g., a stent, the delivery system and the intraluminal nanoparticles can be realized by the means of color encoding based on unique spectral properties of the instruments.22 The observed mean absolute errors of the tracking experiments (delivery system: less than 1.5 mm) seem to be sufficient for accurate instrument navigation and are comparable to previous studies. In a recently published work, a microrobot was steered and monitored with MPI, achieving a tracking accuracy of 0.68 mm.23 However, in this work, the error increases with distance to the center of the FOV, which may be due to artefacts caused by an increasing part of the stent/delivery system outside the FOV.7,24 Thus, with regard to scenarios where the presented error is not sufficient (e.g., in the brain), applying focus fields might improve the tracking accuracy by dynamically setting the center of the FOV to the position of the stent and delivery system, respectively.
The experiments in this work provide an indication of which mechanisms can cause the MPI signal generation of medical instruments. Both stents, which showed a high amount of frequency components, revealed detectable heating in a previous study.18 Eddy currents seem to be mainly responsible for the detected temperature increase during MPI scans.15 These eddy currents will also induce signals in the receive coils of an MPI system, however the non-linear mechanism necessary for the generation of the observed higher harmonics remains unclear. One possibility would be the non-linear conducting behavior of some metal oxide layers. In previous studies, the decrease of the diameter and interrupted conductor loops caused a decrease of heating.15,16,25 To reduce eddy currents as potential signal source, we chose to set up two scenarios: First, we reduced the cross-sectional area by crimping the stent from its expanded size of 16 mm to 5 mm. Second, the stent was cut longitudinally to interrupt the tangential conductor loop. Both scenarios caused a reduction of the stents’ signal generation and thus trackability. The effect of the interrupted conductor loop was inferior to the reduction of the cross section. Nevertheless, the stent crimped on its delivery system and the delivery system itself also caused relevant MPI signal, which allowed for sufficient tracking. This can be partially explained by a stent-like structure in the delivery system (Figure 7), which guarantees the stability of the device. In addition to the generation of eddy currents, the MPS and VSM measurements indicate that the properties of the used stent material also cause at least a small amount of MPI signal. With fragments of a strut or even a whole single strut, the total amount of material was significantly smaller than with a whole stent, but the MPS measurement revealed a small change in magnetization, which was, however, barely above the detection limit of the spectrometer. With the faint MPS-signal in mind, the much stronger recorded MPI-signal of the whole stent cannot be explained by the amount of ferromagnetism in the material alone. Therefore, our best hypothesis based on the observations is, that the stent topology and its electrodynamic effects are significant, for both imaging and heating, which correlates with the findings of our previous studies.15,18,25 The VSM measurements reveal, that in addition to the paramagnetic component, the used nitinol has slight ferromagnetic characteristics. Although these values are above the detection limit of MPI (going as low as 30 fAm²26) in terms of magnetic moment, it is assumed that the dynamic signal is lower as the material may not follow the fast excitation of the MPIs drive field. The resulting dynamic signal by the material seems to be around the detection limit of MPI. Thus, the detectable MPI signal generated by the stent may be related to a combination of the eddy current effects caused by the stent design and the material properties of the stent. This assumption is supported by the MPS and VSM measurements (see Figures 5 and 6). To obtain evidence, this assumption should be proven in a systematic design study.
For reconstructing the MPI images, multiple reconstruction parameters must be chosen, which is usually done iteratively aiming for the best visual reconstruction result. In this work, the reconstruction parameters have been tuned aiming for the lowest MAE between the calculated centers of mass of the reconstructed images and the ground truth positions. Thus, the image quality of the reconstructed images (see Figure 4) could have been higher with other reconstruction parameters, but the MAE might have been increased then. In a clinical scenario, this optimization of the reconstruction parameters would not be possible during reconstruction. However, reconstruction parameters can be determined for one system matrix and, therefore, would be known before the clinical measurement. Introducing recent work27 or using neural networks for image reconstruction28 may overcome this limitation.
The presented work was realized in an in vitro experimental setup. Consequently, the transferability to an in vivo situation should be proven in systematic animal studies (e.g., rabbits) in the future. Furthermore, the instrument tracking described in this paper is based on a single stent model and its delivery system. Thus, the influence of geometrical parameters like diameter and length cannot be derived from the findings of this study. In contrast to the results of this work, in a previous study a representative number of commercially available stents did not show significant MPI signal generation. Thus, the unique characteristics of the signal generating stents are of highest interest. The MPI signal sources can be anticipated by the results of this work but are not understood in every detail. In this context, a simulation study and systematic design investigations should further improve the understanding of the underlying interactions and allow for general design approaches which guarantee MPI trackability of instruments.
Conclusion
Instrument visualization by MPI is possible without the addition of nanoparticles in the case of signal generating instrument designs. Especially, for application scenarios, which prohibit nanoparticle modification of instruments, this stent tracking approach is very promising.
Acknowledgments
The authors thank Sabine Wende (Boston Scientific) for stent provision.
Funding
This work was supported in part by the Clinician Scientist Program of the University of Luebeck under Grant CS10-2021.
Disclosure
Prof. Dr. Roman Kloeckner reports personal fees from Astra Zeneca, Boston Scientific, Bristol-Myers Squibb, BTG, EISAI, Guerbet, Ipsen, MSD Sharp & Dohme, Roche, Siemens, and SIRTEX outside the submitted work. The authors report no other conflicts of interest in this work.
References
1. Gleich B, Weizenecker J. Tomographic imaging using the nonlinear response of magnetic particles. Nature. 2005;435(7046):1214–1217. doi:10.1038/nature03808
2. Vogel P, Rückert MA, Greiner C, et al. iMPI: portable human-sized magnetic particle imaging scanner for real-time endovascular interventions. Sci Rep. 2023;13(1):10472. doi:10.1038/s41598-023-37351-2
3. Graeser M, Thieben F, Szwargulski P, et al. Human-sized magnetic particle imaging for brain applications. Nat Commun. 2019;10(1). doi:10.1038/s41467-019-09704-x
4. Rahmer J, Stehning C, Gleich B. Spatially selective remote magnetic actuation of identical helical micromachines. Sci Rob. 2017;2(3):eaal2845. doi:10.1126/scirobotics.aal2845
5. Herz S, Vogel P, Kampf T, et al. Magnetic Particle Imaging-Guided Stenting. J Endovasc Ther. 2019;26(4):512–519. doi:10.1177/1526602819851202
6. Haegele J, Rahmer J, Gleich B, et al. Magnetic particle imaging: visualization of instruments for cardiovascular intervention. Radiology. 2012;265(3):933–938. doi:10.1148/radiol.12120424
7. Wegner F, von Gladiss A, Haegele J, et al. Magnetic particle imaging: in vitro signal analysis and lumen quantification of 21 endovascular stents. Int J Nanomed. 2021;16:213–221. doi:10.2147/IJN.S284694
8. Weizenecker J, Gleich B, Rahmer J, Dahnke H, Borgert J. Three-dimensional real-time in vivo magnetic particle imaging. Phys Med Biol. 2009;54(5):L1–L10. doi:10.1088/0031-9155/54/5/L01
9. Haegele J, Biederer S, Wojtczyk H, et al. Toward cardiovascular interventions guided by magnetic particle imaging: first instrument characterization. Magn Reson Med. 2013;69(6):1761–1767. doi:10.1002/mrm.24421
10. Wegner F, Friedrich T, von Gladiss A, et al. Magnetic particle imaging: artifact-free metallic stent lumen imaging in a phantom study. Cardiovasc Intervent Radiol. 2020;43(2):331–338. doi:10.1007/s00270-019-02347-x
11. Haegele J, Panagiotopoulos N, Cremers S, et al. Magnetic particle imaging: a resovist based marking technology for guide wires and catheters for vascular interventions. IEEE Trans Med Imaging. 2016;35(10):2312–2318. doi:10.1109/TMI.2016.2559538
12. Wegner F, Lüdtke-Buzug K, Cremers S, et al. Bimodal interventional instrument markers for magnetic particle imaging and magnetic resonance imaging-a proof-of-concept study. Nanomaterials. 2022;12(10):1758. doi:10.3390/nano12101758
13. Ahlborg M, Friedrich T, Gottsche T, et al. First dedicated balloon catheter for magnetic particle imaging. IEEE Trans Med Imaging. 2022;41(11):3301–3308. doi:10.1109/TMI.2022.3183948
14. Nothnagel N, Rahmer J, Gleich B, Halkola A, Buzug TM, Borgert J. Steering of magnetic devices with a magnetic particle imaging system. IEEE Trans Biomed Eng. 2016;63(11):2286–2293. doi:10.1109/TBME.2016.2524070
15. Grzyska U, Friedrich T, Sieren MM, et al. Heating of an aortic stent for coarctation treatment during magnetic particle imaging and magnetic resonance imaging-a comparative in vitro study. Cardiovasc Intervent Radiol. 2021;44(7):1109–1115. doi:10.1007/s00270-021-02795-4
16. Floren MG, Günther RW, Schmitz-Rode T. Noninvasive inductive stent heating: alternative approach to prevent instent restenosis? Invest Radiol. 2004;39(5):264–270. doi:10.1097/01.rli.0000117881.42422.72
17. Burgess AE. The Rose model, revisited. J Opt Soc Am A. 1999;16(3):633. doi:10.1364/JOSAA.16.000633
18. Wegner F, von Gladiss A, Wei H, et al. Heating of large endovascular stents and stent grafts in magnetic particle imaging-influence of measurement parameters and isocenter distance. Cardiovasc Intervent Radiol. 2023;46(3):392–399. doi:10.1007/s00270-022-03324-7
19. Biederer S, Knopp T, Sattel TF, et al. Magnetization response spectroscopy of superparamagnetic nanoparticles for magnetic particle imaging. J Phys D Appl Phys. 2009;42(20):205007. doi:10.1088/0022-3727/42/20/205007
20. Salamon J, Hofmann M, Jung C, et al. Magnetic particle/magnetic resonance imaging: in-vitro MPI-guided real time catheter tracking and 4D angioplasty using a road map and blood pool tracer approach. PLoS One. 2016;11(6):e0156899. doi:10.1371/journal.pone.0156899
21. Rahmer J, Halkola A, Gleich B, Schmale I, Borgert J. First experimental evidence of the feasibility of multi-color magnetic particle imaging. Phys Med Biol. 2015;60(5):1775–1791. doi:10.1088/0031-9155/60/5/1775
22. Haegele J, Vaalma S, Panagiotopoulos N, et al. Multi-color magnetic particle imaging for cardiovascular interventions. Phys Med Biol. 2016;61(16):N415–N426. doi:10.1088/0031-9155/61/16/N415
23. Bakenecker AC, von Gladiss A, Schwenke H, et al. Navigation of a magnetic micro-robot through a cerebral aneurysm phantom with magnetic particle imaging. Sci Rep. 2021;11(1):14082. doi:10.1038/s41598-021-93323-4
24. Vaalma S, Rahmer J, Panagiotopoulos N, et al. Magnetic Particle Imaging (MPI): experimental quantification of vascular stenosis using stationary stenosis phantoms. PLoS One. 2017;12(1):e0168902. doi:10.1371/journal.pone.0168902
25. Wegner F, Friedrich T, Panagiotopoulos N, et al. First heating measurements of endovascular stents in magnetic particle imaging. Phys Med Biol. 2018;63(4):045005. doi:10.1088/1361-6560/aaa79c
26. Graeser M, Ludewig P, Szwargulski P, et al. Design of a head coil for high resolution mouse brain perfusion imaging using magnetic particle imaging. Phys Med Biol. 2020;65(23):235007. doi:10.1088/1361-6560/abc09e
27. Scheffler K, Boberg M, Knopp T. Hands-free Reconstruction for MPI. Int J Mag Part Imag. 2023;9(Supp1):1. doi:10.18416/IJMPI.2023.2303025
28. Von Gladiss A, Kramer I, Theisen N, et al. Data augmentation for training a neural network for image reconstruction in MPI. Int J Mag Part Imag. 2022;8(1):1. doi:10.18416/IJMPI.2022.2203058
 © 2024 The Author(s). This work is published and licensed by Dove Medical Press Limited. The
full terms of this license are available at https://www.dovepress.com/terms
and incorporate the Creative Commons Attribution
- Non Commercial (unported, 3.0) License.
By accessing the work you hereby accept the Terms. Non-commercial uses of the work are permitted
without any further permission from Dove Medical Press Limited, provided the work is properly
attributed. For permission for commercial use of this work, please see paragraphs 4.2 and 5 of our Terms.
© 2024 The Author(s). This work is published and licensed by Dove Medical Press Limited. The
full terms of this license are available at https://www.dovepress.com/terms
and incorporate the Creative Commons Attribution
- Non Commercial (unported, 3.0) License.
By accessing the work you hereby accept the Terms. Non-commercial uses of the work are permitted
without any further permission from Dove Medical Press Limited, provided the work is properly
attributed. For permission for commercial use of this work, please see paragraphs 4.2 and 5 of our Terms.