Back to Journals » Clinical Epidemiology » Volume 13
Avoiding Time-Related Biases: A Feasibility Study on Antidiabetic Drugs and Pancreatic Cancer Applying the Parametric g-Formula to a Large German Healthcare Database
Authors Börnhorst C ![]() , Reinders T
, Reinders T ![]() , Rathmann W, Bongaerts B
, Rathmann W, Bongaerts B ![]() , Haug U, Didelez V, Kollhorst B
, Haug U, Didelez V, Kollhorst B ![]()
Received 7 July 2021
Accepted for publication 12 October 2021
Published 28 October 2021 Volume 2021:13 Pages 1027—1038
DOI https://doi.org/10.2147/CLEP.S328342
Checked for plagiarism Yes
Review by Single anonymous peer review
Peer reviewer comments 3
Editor who approved publication: Professor Lars Pedersen
Claudia Börnhorst,1 Tammo Reinders,1 Wolfgang Rathmann,2 Brenda Bongaerts,2 Ulrike Haug,1 Vanessa Didelez,1 Bianca Kollhorst1
1Leibniz Institute for Prevention Research and Epidemiology – BIPS, Department of Biometry and Data Management, Bremen, Germany; 2Institute for Biometrics and Epidemiology, German Diabetes Center, Leibniz Center for Diabetes Research at Heinrich Heine University, Düsseldorf, Germany
Correspondence: Bianca Kollhorst
Leibniz Institute for Prevention Research and Epidemiology – BIPS, Department of Biometry and Data Management, Achterstr. 30, Bremen, 28359, Germany
Tel +49 421 21856980
Email [email protected]
Purpose: Investigating intended or unintended effects of sustained drug use is of high clinical relevance but remains methodologically challenging. This feasibility study aims to evaluate the usefulness of the parametric g-formula within a target trial for application to an extensive healthcare database in order to address various sources of time-related biases and time-dependent confounding.
Patients and Methods: Based on the German Pharmacoepidemiological Research Database (GePaRD), we estimated the pancreatic cancer incidence comparing two hypothetical treatment strategies for type 2 diabetes mellitus (T2DM), i.e., (A) sustained metformin monotherapy vs (B) combination therapy with DPP-4 inhibitors after one year metformin monotherapy. We included 77,330 persons with T2DM who started metformin therapy at baseline between 2005 and 2011. Key aspects for avoiding time-related biases and time-dependent confounding were the emulation of a target trial over a 7-year follow-up period and application of the parametric g-formula.
Results: Over the 7-year follow-up period, 652 out of the 77,330 study subjects had a diagnosis of pancreatic cancer. Assuming no unobserved confounding, we found evidence that the metformin/DPP-4i combination therapy increased the risk of pancreatic cancer compared to a sustained metformin monotherapy (risk ratio: 1.47; 95% bootstrap CI: 1.07– 1.94). The risk ratio decreased in sensitivity analyses addressing protopathic bias.
Conclusion: While protopathic bias could not fully be ruled out, and computational challenges necessitated compromises in the analysis, the g-formula and target trial emulation proved useful: Self-inflicted biases were avoided, observed time-varying confounding was adjusted for, and the estimated risks have a clear causal interpretation.
Keywords: target trial emulation, electronic health data, parametric g-formula, time-related bias, time-dependent confounding, type-2 diabetes mellitus
Introduction
Large healthcare databases are frequently used to investigate comparative effects of drug use. However, such real-world pharmacoepidemiological studies carry the risk of specific biases due to deviation from basic principles of study design. Potential sources of time-related biases include protopathic, latency time, immortal time, time-lag, prevalent user and depletion of susceptibles biases as well as confounding by indication.1,2 Suissa & Dell’Aniello2 compellingly demonstrated the consequences of time-related biases in observational studies and showed that the apparent effectiveness of certain drugs often disappears with proper design and analysis of the data. Hernán & Robins3,4 proposed the “target trial emulation” with observational data as a general principle to reduce the risk of bias and improve interpretation by specifying an ideal, randomized trial (the target trial).
Time-dependent confounding poses a particular challenge to pharmacoepidemiological studies. Standard regression adjustment gives biased results in the presence of time-varying confounding if the confounders are themselves affected by the exposure,5 e.g., if a change in medication is due to a (lack of) improvement to earlier medication. Several alternative methods, the so-called g-methods, have been proposed to solve this problem under certain structural assumptions.5 The g-formula allows us to estimate clinically meaningful risks of long-term treatment strategies and is more stable and efficient than inverse probability weighting (IPW) of marginal structural models albeit at the price of more modelling assumptions and computational effort.6 In situations where treatment switching and non-adherence are common, the g-formula enables the estimation of the per-protocol effect, i.e., of an idealised intervention where all patients perfectly adhered to their strategy without loss-to-follow up. G-methods have rarely been applied in pharmacoepidemiology which may be due to typically insufficient information on time-varying confounders but also due a lack of understanding and awareness of tools needed to implement the rather complex algorithms.
Here, we present the first application to a large German healthcare database of a target trial emulation in combination with the parametric g-formula. We will explicitly address (time-related) biases, feasibility and difficulties of the approach. For illustration, we will compare the risk of pancreatic cancer incidence in persons with type-2 diabetes mellitus (T2DM) under two hypothetical treatment strategies for T2DM.
Research Question for Illustration of Methods
In meta-analyses metformin, a first-line oral glucose-lowering drug, was found to be associated with a reduced risk for cancer incidence in observational studies but not in RCTs.7–9 Recently, methodological deficits in observational studies based e.g., on administrative databases became apparent especially due to time-related biases.1,10,11 Today the evidence is strong that metformin does neither cause nor prevent cancer.10
Studies regarding novel incretin-based drugs such as dipeptidyl peptidase 4 inhibitors (DPP-4i) are still inconclusive concerning a potential causal effect on pancreatic cancer.12–15 In a meta-analysis of placebo-controlled randomized clinical trials16 and in an updated meta-analysis17 DPP-4i were not found to be associated with pancreatic cancer. In contrast, a recent study based on medical treatment/ health screening records of 33,208 patients with newly diagnosed T2DM found DPP-4i to be associated with pancreatic cancer one year after the initial prescription.18 No increasing trend with duration of exposure could be detected. Thus, the association might be explained by “reverse causality” as diabetes can be an early symptom of undiagnosed pancreatic cancer. Similarly, Boniol et al19 reported an association between DPP-4i and pancreatic cancer which was found to decrease as early as from month 3 to 12 after initial prescription. Yet, it is unclear whether DPP-4i cause an increase in pancreatic cancer incidence in persons with T2DM or whether observed associations are mainly a consequence of certain biases. As the follow-up period of available studies is mostly shorter than two years, studies with longer follow-up are much needed to clarify the issue.
Our research question is therefore to assess the effect of DPP-4 inhibitors versus metformin monotherapy on pancreatic cancer over seven years of follow-up. Specifically, we will compare
(A) a sustained metformin monotherapy over the entire follow-up period (first-line treatment) vs
(B) one year metformin monotherapy followed by combination therapy of metformin with DPP-4i (second-line treatment), in persons with T2DM applying the parametric g-formula to the GePaRD database. The treatment strategies were chosen according to German guidelines for treatment of T2DM20 which recommend to start with metformin monotherapy (after trying non-pharmaceutical interventions) and to add a second-line treatment in case the glycaemic control is still poor after trying metformin for 3–6 months. This was adapted to one year metformin monotherapy as we analysed the data on a yearly basis.
Patients and Methods
The GePaRD Database
GePaRD is based on claims data from four statutory health insurance providers in Germany and currently includes information on more than 25 million persons who have been insured with one of the participating providers since 2004 or later.21 Per data year, there is information on approximately 20% of the general population and all geographical regions of Germany are represented. For each person, the database contains demographic information, information on inpatient and outpatient diagnoses and services, and on drug dispensations (see Supplementary Material 1 for details).
In the current study, a person was considered to have diabetes if there was at least one in- or outpatient diagnosis code of T2DM (ICD-10 GM E11) or unspecified diabetes (ICD-10 GM E14).
Exposure Classification
As explicit information on the prescribed dose is not included in GePaRD, the duration of supply was estimated for each dispensation of a glucose-lowering drug based on the number of dispensed defined daily doses (DDDs), multiplied by 1.2 to account for possible lower doses in elderly populations.
Metformin and DPP-4i exposure were classified based on the proportion of days covered (PDC) in each year and considered as time-dependent variables. The person was assumed to be treated if a) the PDC was > 0.5, or b) the PDC was > 0.25 (but ≤ 0.5) for a certain year and in addition > 0.5 for the preceding and succeeding year. If a subject fulfilled this definition in one year for metformin as well as for DDP-4i, the subject was classified as exposed to DPP-4i combination therapy.
Outcome Definition
For the definition of pancreatic cancer we considered inpatient diagnoses (ICD-10 GM C25), which are considered to have a high validity. Patients with no inpatient but outpatient diagnosis codes of pancreatic cancer were only classified as pancreatic cancer cases if additional criteria were fulfilled such as coding of diagnostic examinations and death within 6–9 months after diagnosis to avoid misclassification. This algorithm was developed based on case reviewing and subject knowledge.
Covariates
As baseline covariates we included age, sex, T2DM duration (days), educational level (0 = no information/no graduation, 1 = secondary school certificate, 2 = higher education entrance qualification), an indicator for smoking/alcohol/drug abuse (1 if any of the three has been coded) and a comorbidity score (sum of dichotomized variables for treated hypertension, coronary heart disease, congestive heart failure, lipid-lowering agents, chronic obstructive pulmonary disease, asthma, dementia, hemiplegia, antidepressants use, antipsychotics use).
The following time-varying factors were included as binary variables: use of other oral glucose-lowering medications or insulin, poor glycaemic control, microvascular complications, diagnosed obesity, cancer (other than pancreatic or skin cancer), acute myocardial infarction or stroke (yes, if at least one of the two has been diagnosed), liver disease/severe liver disease/chronic kidney disease/ end-stage renal disease (yes if any of the four has been diagnosed). Further, the number of hospitalizations (per year) and the number of visits to a diabetologist (per year; only in sensitivity analysis) were considered as continuous variables. A summary table listing all covariates is given in Supplementary Material 2. Covariates were selected based on availability and subject matter considerations of their role as potential (time-dependent) confounders. There were no missing data in GePaRD except for the educational level where missing values were categorized as “no information/no graduation”.
GePaRD Ethics and Approvals Statement
The data accessed complies with relevant data protection and privacy regulations. All involved health insurance providers as well as the responsible authorities approved the use of GePaRD data for this study. According to the Ethics Committee of the University of Bremen studies based on GePaRD are exempt from institutional review board review.
Target Trial Emulation
Table 1 summarizes the protocol of our target trial (left column) and its emulation based on GePaRD (right column).
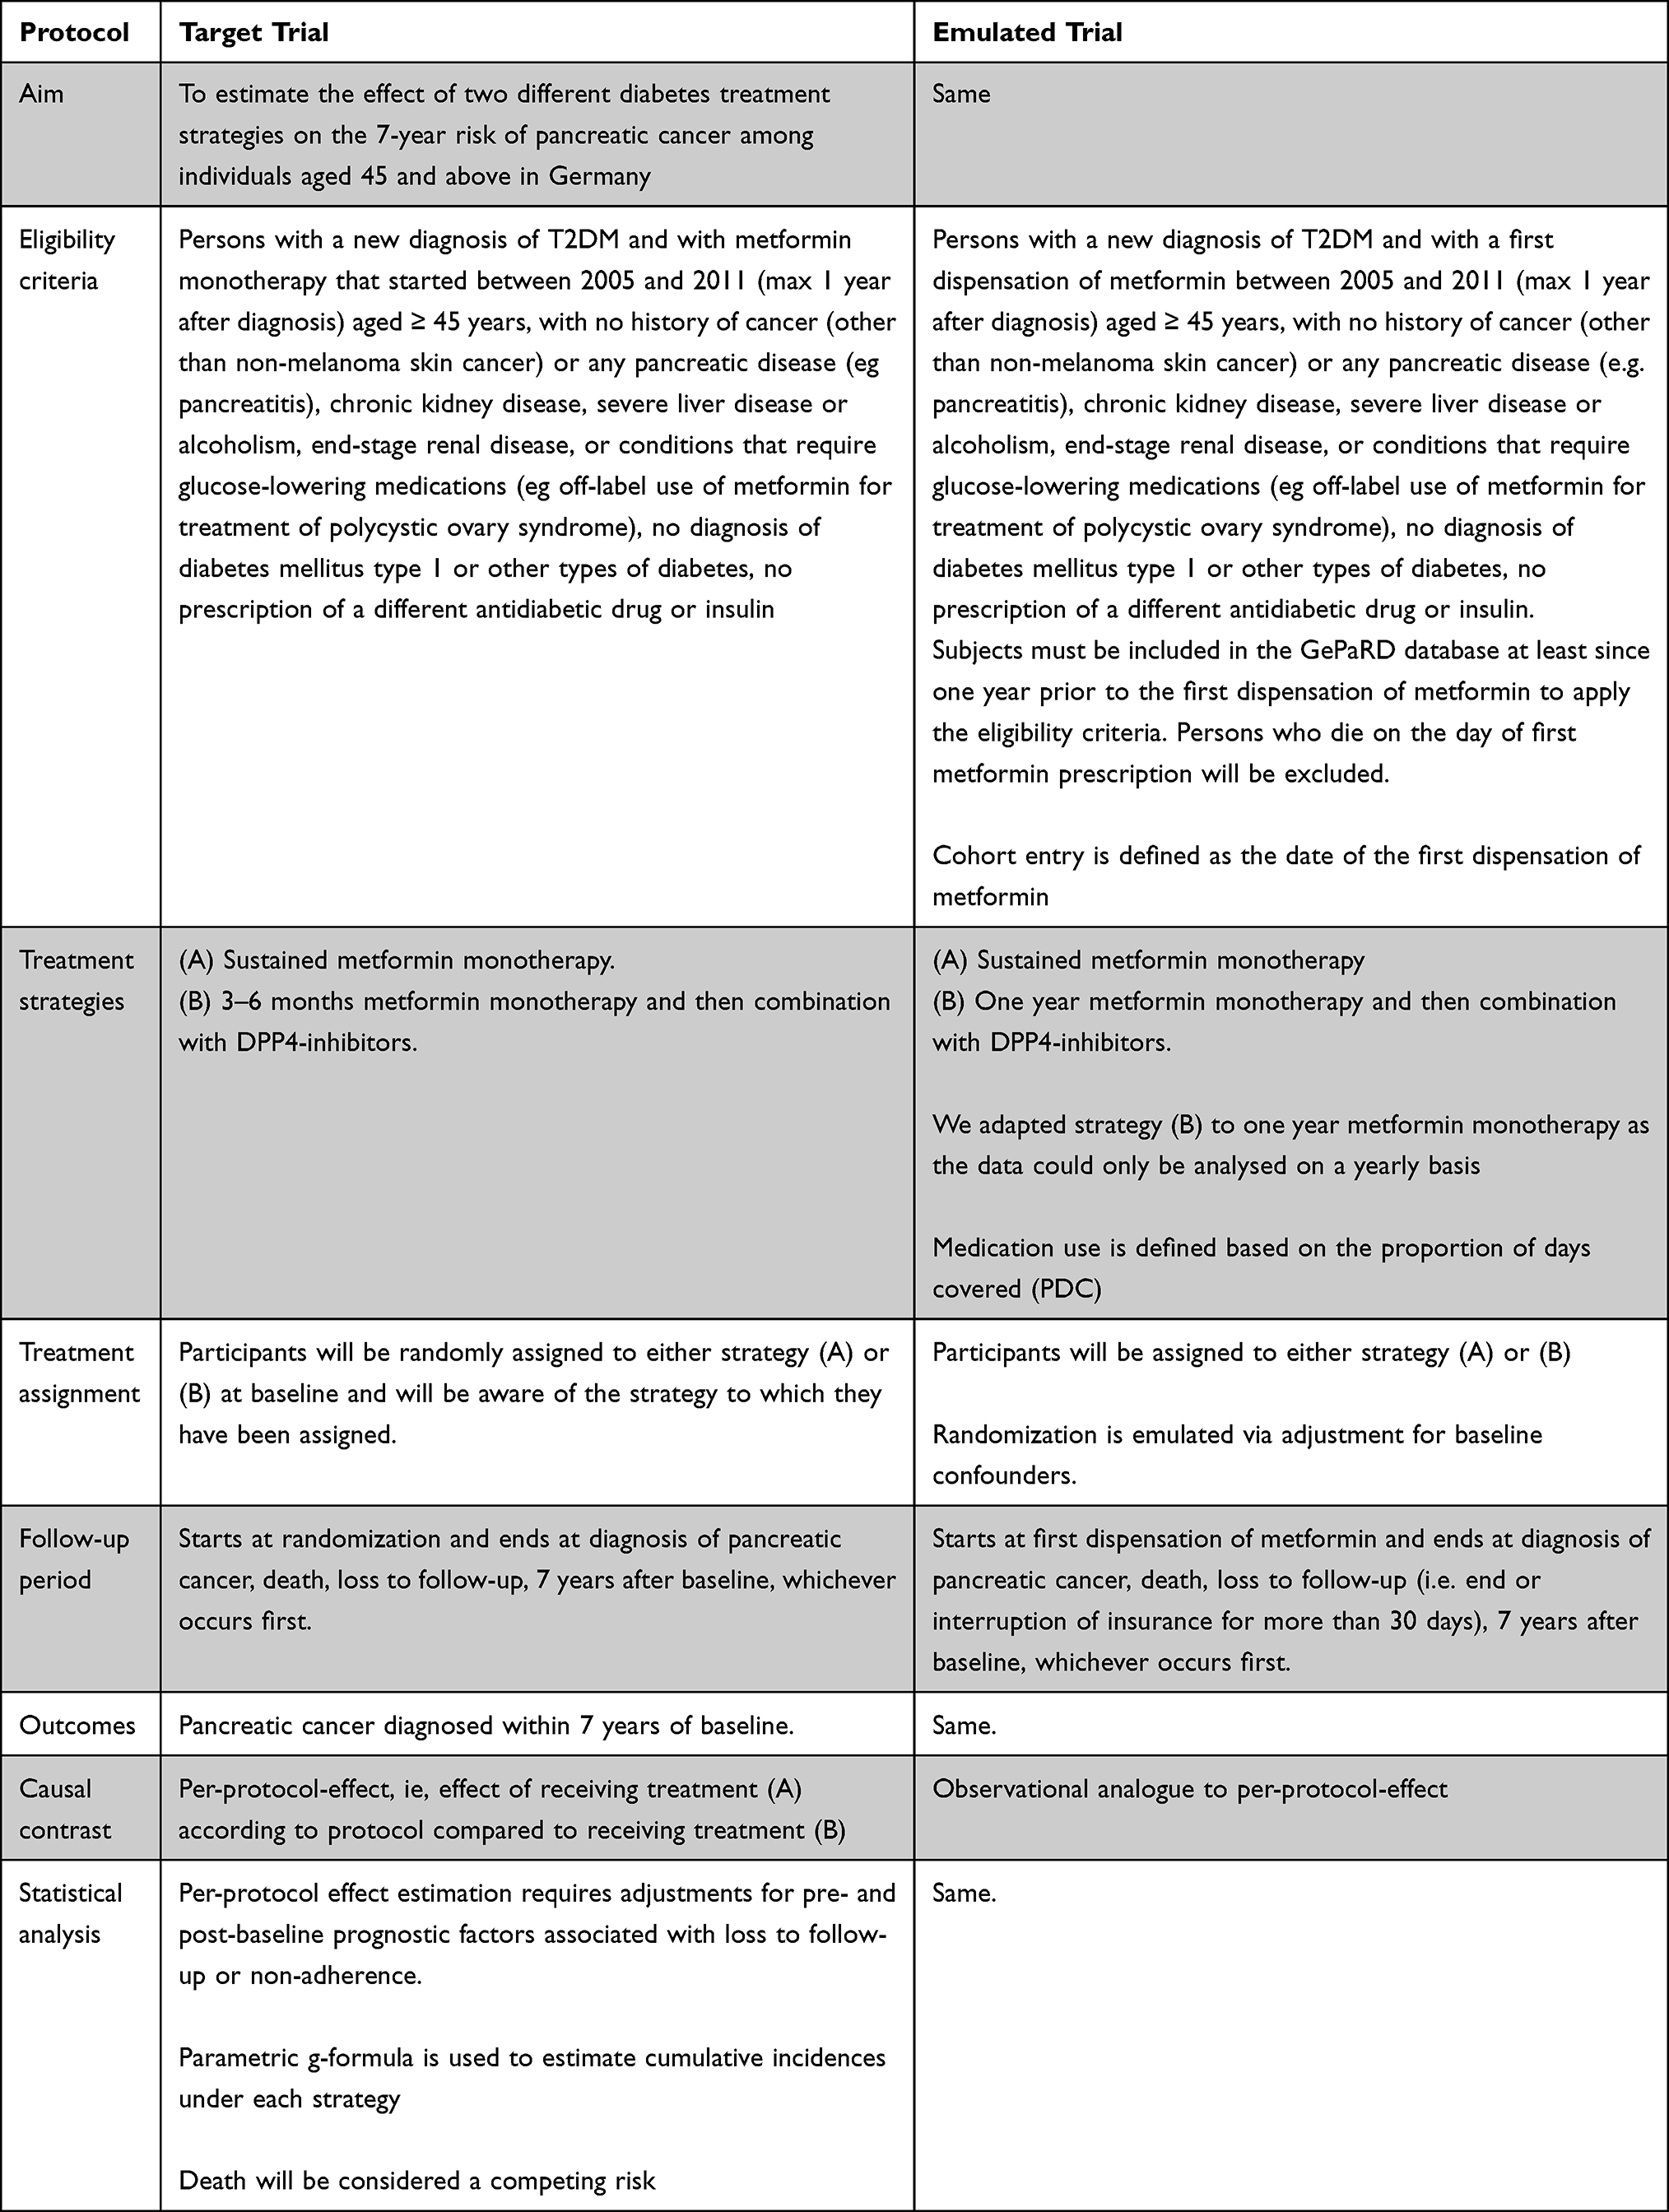 |
Table 1 Description of the Target Trial and Its Emulation Based on the GePaRD Data |
The following eligibility criteria were applied in the emulated trial: The sample was restricted to persons aged ≥ 45 years with a first dispensation of metformin between 2005 and 2011 and with a first diagnosis of T2DM within one year prior to the first metformin dispensation (to check this, study subjects must have been continuously insured in a participating statutory health insurance for (at least) one year prior to the first metformin dispensation). Persons were excluded if they had a history of cancer or any pancreatic disease, chronic kidney disease, severe liver disease or alcoholism, end-stage renal disease, or conditions that require glucose-lowering medications, diagnosis of type 1 diabetes mellitus or other types of diabetes, or a dispensation of a different glucose-lowering drug or insulin in the pre-baseline period.
Cohort entry (time zero) was defined as the date of the first metformin dispensation and study subjects were followed until end or interruption of insurance (lost to follow-up), occurrence of pancreatic cancer, end of 7-year follow-up, or death, whichever occurred first. Independent censoring is plausible here. The time scale was discrete with one unit corresponding to 365 days.
The causal contrast of interest was the observational analogue of the per-protocol-effect of following strategy A versus B. Note that the strategies A and B are identical for the first year because it would be highly untypical to start immediately with DPP-4i upon T2DM diagnosis. We included the first year in both strategies in order to include patients at similar T2DM stages and hence to avoid time-lag bias (see Supplementary Material 3).
Randomization of treatment assignment was emulated via adjustment for baseline confounding factors. Subsequently, non-adherence may occur when persons with T2DM start with additional DPP-4i earlier or later or stop taking DPP-4i after having started. As this may be influenced by factors that are themselves affected by earlier treatment, the parametric g-formula (see Section 4) was used to adjust for such time-varying confounding (analysis plan).3 Death was considered as a competing risk, i.e., we assessed the total effect on pancreatic cancer.22
Design and Analysis Steps to Avoid Time-Related Biases
Supplementary Material 3 introduces different time-related and other biases and outlines how to avoid potential self-inflicted biases and how to check for unavoidable biases based on our data example. Confounding by indication, protopathic and detection bias (and time-dependent confounding; see Section 4 and Supplementary Material 4) pose specific challenges to our research question as outlined in the following:
Confounding by indication occurs when the risk of an adverse event is related to the indication for drug use but not the use of the drug itself. HbA1c is a measure of poor glycaemic control that is typically used to monitor treatment response in T2DM. Poor glycaemic control is known to be associated with pancreatic cancer23–25 such that not accounting for it may lead to confounding by indication. Poor glycaemic control may itself be an early symptom of (undetected) pancreatic cancer.24,26 In such cases, glucose-lowering drugs may be prescribed and the resulting non-causal association is called protopathic bias (also referred to as reverse causation or unmeasured confounding by undiagnosed disease).27 The issue is closely connected with a latency time as there needs to be a period of time between onset and diagnosis of disease for protopathic bias to be possible. Note that due to the long follow-up time of seven years in our study, the latency time per se should not affect our results unless latent pancreatic cancer is related to unobserved confounding factors. A related yet different source of bias is that the probability of detecting pancreatic cancer may be higher for those starting DPP-4i due to increased surveillance or testing of HbA1c levels in that group (detection bias).
To mitigate confounding by indication, protopathic and detection bias, we included diagnosed poor glycaemic control as a time-varying proxy for HbA1c as well as the number of hospitalizations and the number of visits at a diabetologist (only in a sensitivity analysis) as proxy for increased surveillance in our analyses. In addition, we estimated the risk as a function of time. In the absence of bias and assuming a minimum of one year latency time (keeping in mind that there is no direct evidence to support this assumption), it is expected that the cumulative incidence curves coincide for at least two years after baseline (the strategies and hence the risks are identical in the first year; the cumulative risks can thus only diverge after two years from baseline). Earlier discrepancies may indicate protopathic, detection bias, unmeasured confounding or other problems. As protopathic bias cannot be eliminated by the g-formula per se,28 this was further addressed in sensitivity analyses based on reasonable assumptions about the latency time.
The Parametric g-Formula
Time-varying confounding is another pertinent problem (see Supplementary Material 4 for a brief introduction to the problem). In our application e.g., poor glycaemic control may be an important time-varying confounder that predicts future treatment decisions and outcomes and is themselves affected by past treatment decisions (see Figure 1 for a visualization of the assumed causal relations among variables under the assumption of no unmeasured confounding). The parametric g-formula is a generalization of standardization to such time-varying settings.5,29
 |
Figure 1 DAG depicting the assumed causal relations among covariates, treatment and pancreatic cancer over time. |
Given the assumptions of consistency, positivity, sequential exchangeability and correctly specified models summarized in Supplementary Material 5, the parametric g-formula models the joint density of the observed data in order to generate potential outcomes under different hypothetical interventions, ie, under different exposure scenarios. The g-formula can be used to estimate the risk that would have been observed had all study subjects adhered to a given treatment strategy and none had been lost to follow-up. Causal effects are then defined as contrasts of these risks (or more generally, the interventional distributions)30 for different strategies.
In our example we aimed to answer the following question: “What would happen to the 7-year risk of developing pancreatic cancer, if, possibly contrary to fact, persons with T2DM were treated with a sustained metformin monotherapy (treatment strategy A) compared to a combination of DPP-4i and metformin after one year metformin monotherapy (treatment strategy B)?”. We used the g-formula to estimate the cumulative incidences under these two strategies.
The estimation algorithm proceeds in three steps: 1) fitting models for the conditional distributions of the outcome and time-varying covariates given previous treatment and covariate history to the observed data; 2) Monte Carlo Simulation of the distribution of the outcomes and time-varying covariates under each treatment strategy; 3) estimation of the counterfactual risks under the two treatment strategies. This procedure is detailed in Supplementary Material 6 as well as in the literature.31,32 The algorithm can further be used to simulate a population under the “current-treatment-practice” strategy, the so-called natural course.6
Implementation of the Parametric g-Formula in GePaRD
For application of the above to GePaRD, the analytical dataset was arranged with one record per person per year (i.e., 365 days). The dataset contained the treatment for the respective year, baseline and time-varying covariates as well as indicator variables for death, cancer diagnosis as well as loss-to-follow-up. For modelling the outcome, the pancreatic cancer incidence, a pooled logistic regression was fitted to estimate the conditional discrete-time hazard at each time t. Also, a logistic model to estimate the conditional discrete-time hazard of the competing event (death) at each time t was fitted. Supplementary Material 2 lists the functional form and type of model chosen for the covariates when being used as predictor/ response variable, respectively; Supplementary Material 7 details the implementation and discusses the plausibility of the identifying assumptions. The sample size for the Monte-Carlo simulations was set to the actual sample size of 77,330. To obtain confidence intervals 100 bootstrap samples were used. The time-varying covariates were arranged in an arbitrary ordering when estimating their joint distribution by a factorization based on the conditional distributions.
We conducted several sensitivity analyses to assess the impact of a) using a 2-year instead of 1-year pre-baseline period to apply the exclusion criteria, b) the ordering of the covariates in the above modelling, c) using different sample sizes for the Monte Carlo approximations, d) the choice of time unit (365 days vs quarters/91 days), e) censoring death instead of considering it as competing event, f) adjusting for further covariates, and g) the choice of the cut-point for exposure classification.
As protopathic bias is partly due to unobservable factors, it cannot be assessed or excluded with certainty. To obtain a rough idea whether this might affect our results, we conducted additional analyses where we h) excluded study subjects intensifying/switching their medication within the two quarters/ the year prior to pancreatic cancer diagnosis (as higher doses or a switch may indicate detection or protopathic bias; see De Bruijn et al),33 i) implemented a latency time of 2 years from baseline (persons with pancreatic cancer diagnoses within the first and second years after baseline are excluded to get an indication on protopathic bias).
A comparison analysis based on a conventional method such as a simple proportional hazards model was not feasible because there were only 33 outcome events in the group with metformin/DPP-4i combination therapy.34
Analyses were conducted with SAS 9.4 (SAS Institute, Cary, NC, USA) using the GFORMULA SAS macro available at https://causalab.sph.harvard.edu/software/.
Results
The selection process leading to our analysis dataset including 77,330 persons with T2DM is depicted in Supplementary Material 8. The distribution of baseline covariates is summarized in Table 2. The mean age at cohort entry was 62 years (SD: 9.8 years) with 53.4% of the study subjects being male. The median duration of T2DM before cohort entry was 46 days; the most common comorbidities were treated hypertension (51.0%), obesity (33.9%) and coronary heart disease (11.4%). The observed distributions of the time-varying exposures and covariates over the 7-year period are shown in Supplementary Material 9. Eligibility ensured that all study subjects had a dispensation of metformin at baseline, did not take other antidiabetic medications and were free of certain diseases such as cancer. At the end of follow-up, 32.2% of the study subjects followed a metformin monotherapy and 12.8% the combination therapy of metformin and DPP-4i (but no other glucose-lowering drugs) in the observed data. With regard to the comorbidities, microvascular complications (5.8% at baseline/ 49.8% at the end of follow-up), obesity (33.9%/56.0%) and liver disease (11.4%/ 24.3%) showed the strongest increase over the 7-year follow-up period.
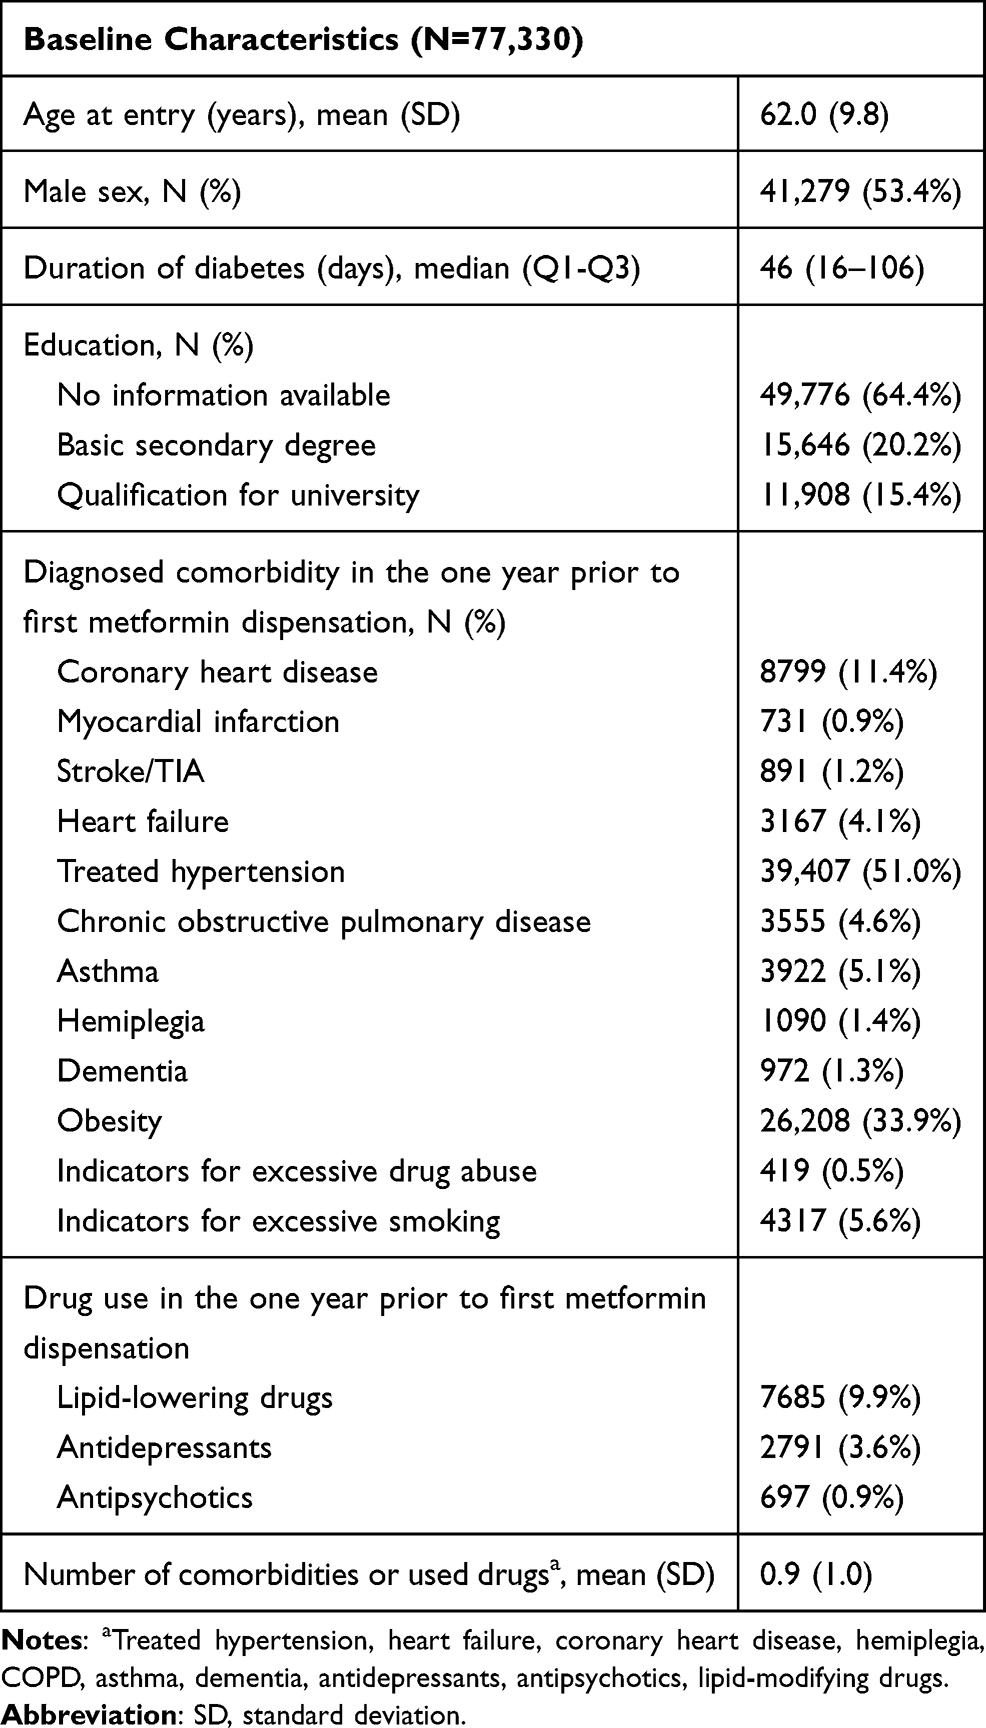 |
Table 2 Baseline Demographic and Clinical Characteristics of the Study Cohort of 77,330 Subjects with Type 2 Diabetic; Numbers and Percentages for Categorical Variables, Mean/Median and Standard Deviation/ 1st and 3rd Quartile for Continuous Variables |
During the 7-year follow-up, there were 652 diagnoses of pancreatic cancer, 7,136 deaths and 6,726 censoring events (see Table 3). The majority of pancreatic cancer cases was diagnosed in year 1 and 2 after baseline (see Supplementary Material 9). The observed 7-year risk for pancreatic cancer was 0.86%. Under the natural course, the parametric g-formula closely replicated the risk (0.85%) and the mean covariates (see Supplementary Material 10).
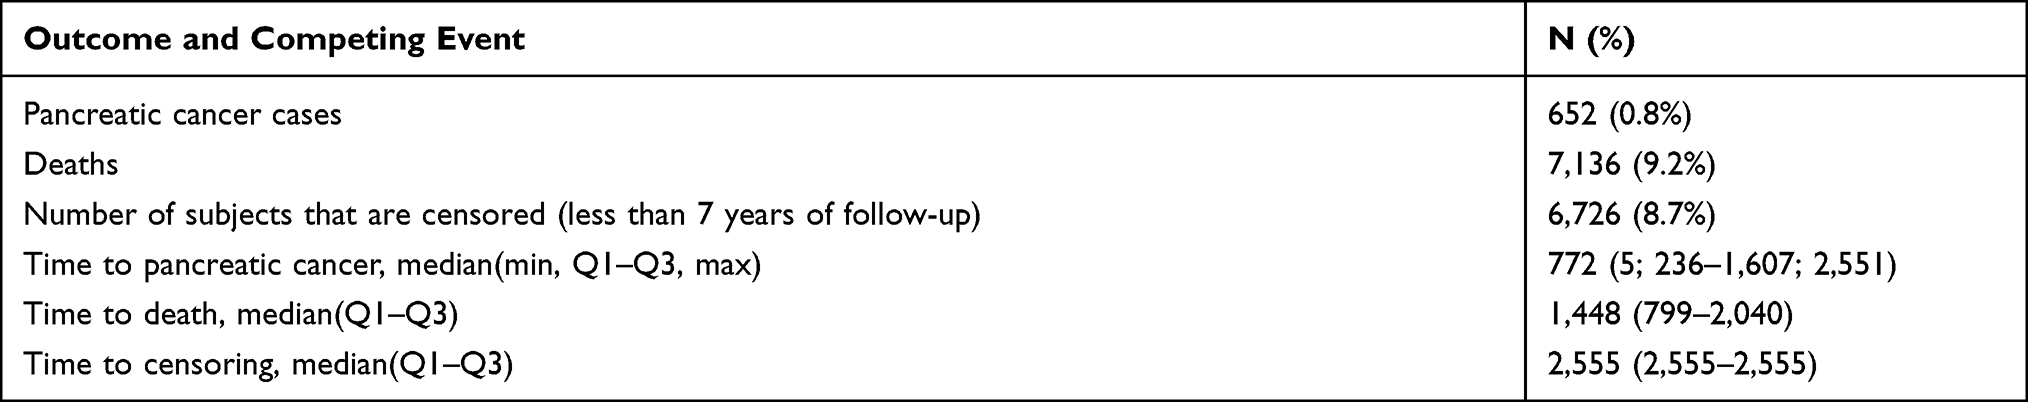 |
Table 3 Observed Pancreatic Cancer Cases, Deaths and Median Times to Pancreatic Cancer, Death and Censoring During the 7-Year Follow-Up Period |
Table 4 shows the 7-year risks under treatment strategies A (metformin monotherapy) and B (combination therapy with DPP-4i) for the main model and for the sensitivity analyses addressing protopathic assuming a certain latency time. The main analysis estimated the 7-year risk to develop pancreatic cancer as 0.86% under strategy A and as 1.26% under strategy B; the risk ratio (RR) was 1.47 [1.07–1.94; 95% bootstrap CI]. The cumulative incidence curves in Figure 2 start to diverge slightly between strategies A and B in the second year. Note that the risk of the competing event (death) is almost the same under both strategies, albeit lower than under the “current-treatment-practice” (see Supplementary Material 3).
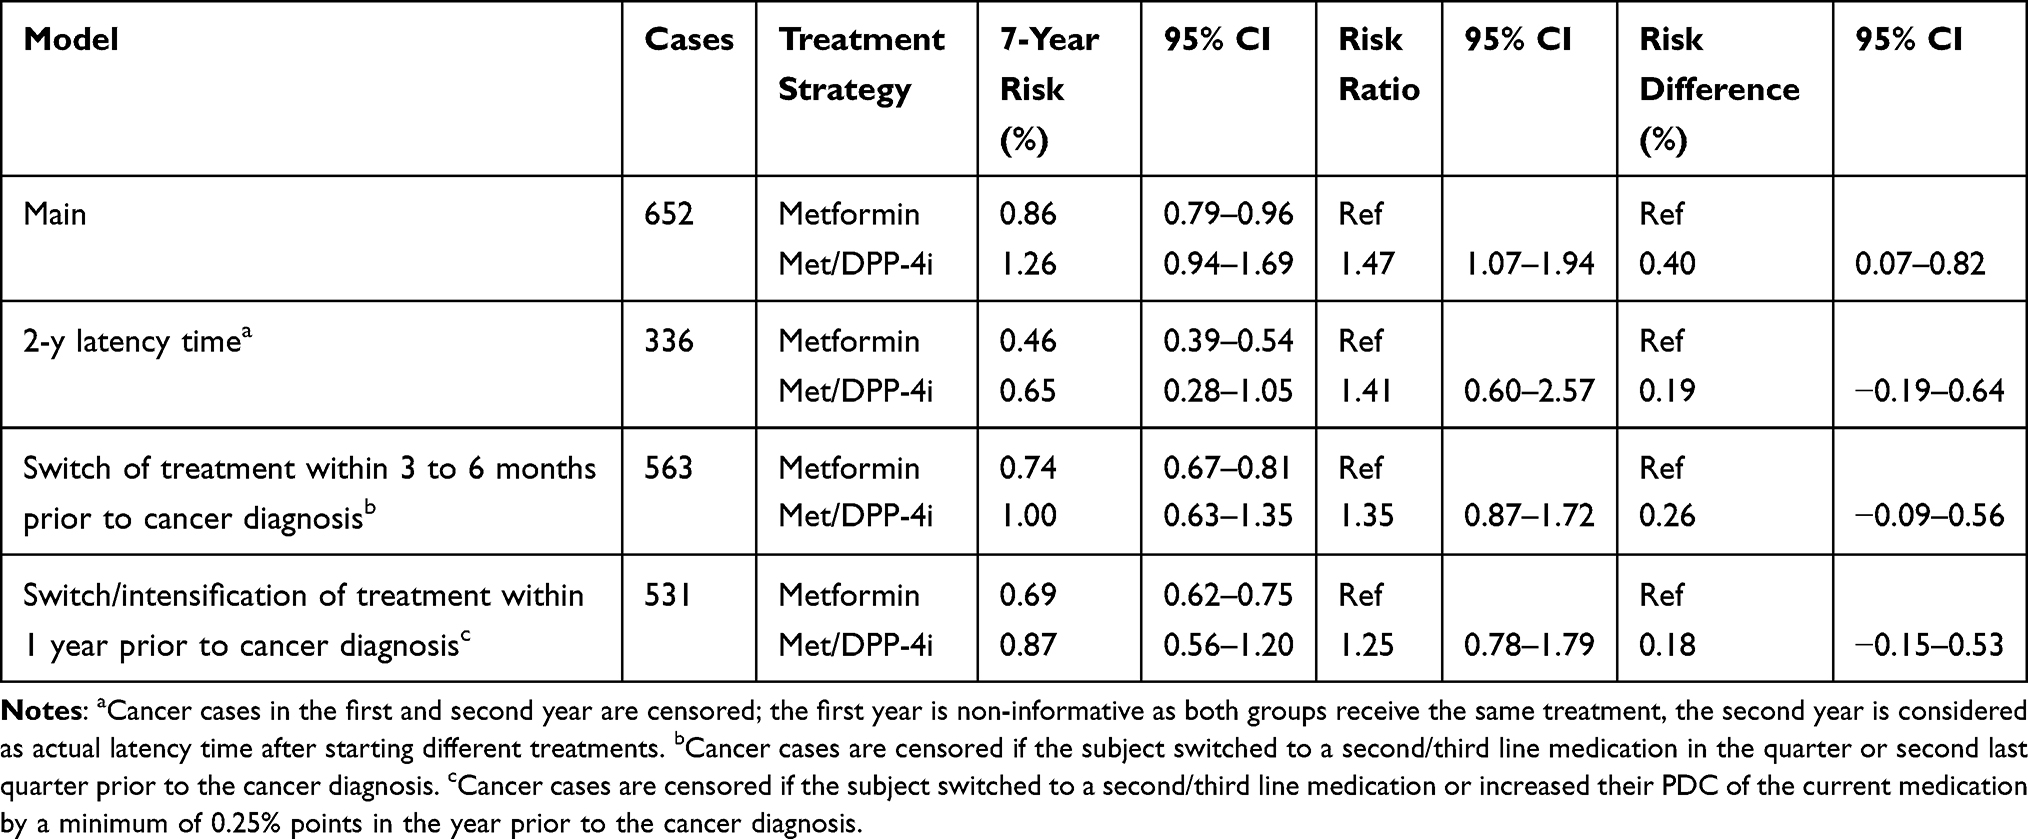 |
Table 4 Risks of Developing Pancreatic Cancer Under a Sustained Metformin Monotherapy and Under a Combination Therapy with DPP-4-Inhibitors in Our Main Model, When Introducing a Latency Time of Two Years and When Censoring Cases That Intensified Their Medication in the Year Prior to Pancreatic Cancer Diagnosis; GePaRD Data 2005–2018 |
 |
Figure 2 Risk plot depicting the estimated cumulative incidences of pancreatic cancer and death (competing event) over the 7-year follow-up period under Strategy A (metformin monotherapy; green), Strategy B (combination therapy of metformin and DPP-4i; red), under the natural course (no intervention; blue) as well as the observed risk of pancreatic cancer (yellow). |
Sensitivity Analyses
Assuming a minimal latency time of one year, relevant risk differences would be expected only approximately two years after baseline. Our sensitivity analyses yielded the following results (see Table 4):
- When implementing a latency time of two years after baseline (316 cases being excluded), the RR became somewhat smaller (1.41 [0.60–2.57]) with wider CI possibly due to the exclusion of cases.
- When excluding persons that changed to or added a second/third line treatment in the quarter or second last quarter prior to the pancreatic cancer diagnosis (89 cases being excluded), the RR decreased to 1.35 [0.87–1.72].
- When excluding persons with T2DM who increased their PDC by a minimum of 0.25% points for either DPP-4i or other glucose-lowering medications or added a second/third line treatment in the year prior to the pancreatic cancer diagnosis (121 cases being excluded), the RR decreased to 1.25 [0.78–1.79].
The results of further sensitivity analyses are summarized in Supplementary Materials 11 and 12.
Discussion
Our study illustrates the target trial principle and use of the g-formula to compare the cancer risks of different treatment strategies in persons with T2DM based on a large health claims database, but it also highlights difficulties. Our main analysis showed a clear increase in risk of pancreatic cancer for treatment strategy B vs treatment strategy A. The effect became weaker in sensitivity analyses addressing protopathic bias. As excluding certain cancer cases relies on strong assumptions about the minimum latency time it could introduce further biases if these are incorrect; the results must thus be interpreted with caution.
Previous RCTs assessing the short-term risks of DPP-4i on pancreatic cancer did not reveal an association15 in contrast to observational studies based on claims data that point to an increased short-term risk.7,18,19 While the latter short-term risks may be inflated due to protopathic bias, our study estimated a risk increase over a long follow-up period of 7-years. In the main analysis, the RR was 1.26 after 2 years (with the first year being non-informative, i.e., the RR = 1) and increased to a RR of 1.47 at the end of follow-up. Importantly, the risk thus still increased, if only moderately, beyond the first two years of follow-up. Moreover, as one would typically expect a dose–response relationship in case of adverse drug effects, ie, effects potentially increasing over time, this finding gives some support to the presence of an effect.
The chosen example was challenging due to the complex interplay of poor glycaemic control, T2DM and pancreatic cancer. Persons with T2DM can generally be considered at high-risk of developing cancer including pancreatic cancer.35 But it is also known that pancreatic cancer can cause poor glycaemic control/T2DM making it difficult to separate out the potential impact of glucose-lowering medications in these relations.36,37
The definition and derivation of variables based on claims data is also an important issue to discuss. Only treated, typically extreme cases of certain confounders reflecting lifestyle variables like obesity, smoking or alcohol abuse or poor glycaemic control are available (coded) in the database making underreporting likely. Further, information on the disappearance of such conditions is not available implying that changes over time cannot be adequately captured based on GePaRD. Also, exposure misclassification cannot completely be ruled out, but was addressed in the sensitivity analyses.
The parametric g-formula has previously been applied to compare the effectiveness of clinical interventions38,39 as well as lifestyle interventions40–43 based on observational data. Applications using administrative healthcare data are still scarce.31,44 The few available demonstrated the potential of healthcare databases for comparison of (dynamic) treatment strategies at least in settings with frequent outcomes (blood pressure targets, death) and showed the g-formula to be a promising tool to emulate ideal trials that are not practically feasible for cost, time or ethical reasons. However, the validity of the results strongly depends on the assumption that the considered covariates are sufficient to control for (time-dependent) confounding.5
Also, in the present investigation, unmeasured confounding cannot be fully excluded. As outlined earlier, it would have been desirable to adjust for HbA1c or other early symptoms of an undetected cancer to reduce the potential for protopathic bias and confounding by indication. However, based on the GePaRD data we could only use diagnosed poor glycaemic control as a rough proxy. A more extensive and thorough quantitative bias analysis45 which should also include the explicit modelling of minimal latency time as in Danaei et al27 will be addressed in future work.
The validity of the results further depends on correct model specification. We conducted several sensitivity analyses, and our results were robust towards changes in model specification (see Supplementary Materials 6, 11 and 12). However, we encountered some practical issues with the implementation of the g-formula algorithm so that models could not be chosen as flexibly as desired: Convergence problems occurred when including a high numbers of covariates, especially those with low prevalence (e.g., chronic pancreatitis). Therefore, we combined certain variables into a score such as comorbidities or smoking/alcohol/drug abuse. When using years instead of quarters as the time intervals, the model converged more easily even with additional covariates. Because poor glycaemic control as an important time-varying confounder could not be included in the 91-days model, again due to convergence problems and poor agreement between observed means of certain time-varying covariates with those predicted by the model, the 365-day model was used as main model. However, this choice is accompanied by a loss of information and reduced level of detail. It is to be expected that convergence problems are less common when addressing outcomes with a higher incidence like in previous studies.31,44
IPW would have been an alternative approach to account for time-varying confounding5 but is less stable in case of near violations of the positivity assumption as in our data (see Supplementary Material 6). Further restrictions of the study population could help to reduce this problem but would lead to a different causal contrast.
Conclusions
Using the example of antidiabetic drugs and pancreatic cancer, our study illustrated how to specify, emulate and analyse a target trial to compare different treatment strategies based on a large health claims database. Although the study was carefully designed to avoid self-inflicted biases, and the g-formula correctly adjusted for observed time-dependent confounding, we could not rule out various forms of unobserved residual confounding, especially protopathic bias. Further issues pertained specifically to the complexities of implementing the g-formula, necessitating some compromises in the analysis. We do not expect these problems to be fundamentally different with other approaches. Looking ahead, our study underlines the importance of formal methods for quantitative bias analyses that can deal with challenging time-dependent settings and exploit any available prior knowledge or outside information.
Data Sharing Statement
As we are not the owners of the data we are not legally entitled to grant access to the data of the German Pharmacoepidemiological Research Database. In accordance with German data protection regulations, access to the data is granted only to employees of the Leibniz Institute for Prevention Research and Epidemiology – BIPS on the BIPS premises and in the context of approved research projects. Third parties may only access the data in cooperation with BIPS and after signing an agreement for guest researchers at BIPS. Analyses were conducted using the GFORMULA SAS macro available at https://causalab.sph.harvard.edu/software/.
Acknowledgments
The authors would like to thank all statutory health insurance providers which provided data for this study, namely AOK Bremen/Bremerhaven, DAK-Gesundheit, Die Techniker (TK), and hkk Krankenkasse.
Funding
The study was funded by the Deutsche Forschungsgemeinschaft (DFG, German Research Foundation) – PI 345/12-1. The results reported herein correspond to specific aims of the grant.
Disclosure
Dr. Bianca Kollhorst, Tammo Reinders, Dr. Wolfgang Rathmann and Dr. Brenda Bongaerts report grants from Deutsche Forschungsgemeinschaft (DFG), during the conduct of the study. The authors declare no competing interests for this work.
References
1. Suissa S, Azoulay L. Metformin and the risk of cancer: time-related biases in observational studies. Diabetes Care. 2012;35(12):2665–2673. doi:10.2337/dc12-0788
2. Suissa S, Dell’Aniello S. Time-related biases in pharmacoepidemiology. Pharmacoepidemiol Drug Saf. 2020;29(9):1101–1110. doi:10.1002/pds.5083
3. Hernán MA, Hernández-Díaz S, Robins JM. Randomized trials analyzed as observational studies. Ann Intern Med. 2013;159(8):560–562.
4. Hernan MA, Robins JM. Using big data to emulate a target trial when a randomized trial is not available. Am J Epidemiol. 2016;183(8):758–764. doi:10.1093/aje/kwv254
5. Daniel RM, Cousens SN, De Stavola BL, Kenward MG, Sterne JA. Methods for dealing with time-dependent confounding. Stat Med. 2013;32(9):1584–1618. doi:10.1002/sim.5686
6. Young JG, Cain LE, Robins JM, O’Reilly EJ, Hernan MA. Comparative effectiveness of dynamic treatment regimes: an application of the parametric g-formula. Stat Biosci. 2011;3(1):119–143. doi:10.1007/s12561-011-9040-7
7. Thakkar B, Aronis KN, Vamvini MT, Shields K, Mantzoros CS. Metformin and sulfonylureas in relation to cancer risk in type II diabetes patients: a meta-analysis using primary data of published studies. Metabolism. 2013;62(7):922–934. doi:10.1016/j.metabol.2013.01.014
8. Decensi A, Puntoni M, Goodwin P, et al. Metformin and cancer risk in diabetic patients: a systematic review and meta-analysis. Cancer Prev Res (Phila). 2010;3(11):1451–1461. doi:10.1158/1940-6207.CAPR-10-0157
9. Franciosi M, Lucisano G, Lapice E, Strippoli GF, Pellegrini F, Nicolucci A. Metformin therapy and risk of cancer in patients with type 2 diabetes: systematic review. PLoS One. 2013;8(8):e71583. doi:10.1371/journal.pone.0071583
10. Suissa S, Azoulay L. Metformin and cancer: mounting evidence against an association. Diabetes Care. 2014;37(7):1786–1788. doi:10.2337/dc14-0500
11. Yang XL, Ma RC, So WY, Kong AP, Xu G, Chan JC. Addressing different biases in analysing drug use on cancer risk in diabetes in non-clinical trial settings–what, why and how? Diabetes Obes Metab. 2012;14(7):579–585. doi:10.1111/j.1463-1326.2011.01551.x
12. Egan AG, Blind E, Dunder K, et al. Pancreatic safety of incretin-based drugs–FDA and EMA assessment. N Engl J Med. 2014;370(9):794–797. doi:10.1056/NEJMp1314078
13. Tseng CH, Lee KY, Tseng FH. An updated review on cancer risk associated with incretin mimetics and enhancers. J Environ Sci Health C Environ Carcinog Ecotoxicol Rev. 2015;33(1):67–124. doi:10.1080/10590501.2015.1003496
14. Stoian AP, Sachinidis A, Stoica RA, Nikolic D, Patti AM, Rizvi AA. The efficacy and safety of dipeptidyl peptidase-4 inhibitors compared to other oral glucose-lowering medications in the treatment of type 2 diabetes. Metabolism. 2020;109:154295. doi:10.1016/j.metabol.2020.154295
15. Dankner R, Roth J. More recent, better designed studies have weakened links between antidiabetes medications and cancer risk. Diabet Med. 2020;37(2):194–202. doi:10.1111/dme.14179
16. Rehman MB, Tudrej BV, Soustre J, et al. Efficacy and safety of DPP-4 inhibitors in patients with type 2 diabetes: meta-analysis of placebo-controlled randomized clinical trials. Diabetes Metab. 2017;43(1):48–58. doi:10.1016/j.diabet.2016.09.005
17. Dicembrini I, Montereggi C, Nreu B, Mannucci E, Monami M. Pancreatitis and pancreatic cancer in patients treated with Dipeptidyl Peptidase-4 inhibitors: an extensive and updated meta-analysis of randomized controlled trials. Diabetes Res Clin Pract. 2020;159:107981. doi:10.1016/j.diabres.2019.107981
18. Lee M, Sun J, Han M, et al. Nationwide trends in pancreatitis and pancreatic cancer risk among patients with newly diagnosed type 2 diabetes receiving dipeptidyl peptidase 4 inhibitors. Diabetes Care. 2019;42(11):2057–2064. doi:10.2337/dc18-2195
19. Boniol M, Franchi M, Bota M, et al. Incretin-based therapies and the short-term risk of pancreatic cancer: results from two retrospective cohort studies. Diabetes Care. 2018;41(2):286–292. doi:10.2337/dc17-0280
20. Pfeiffer AFH, Klein HH. Therapie des diabetes mellitus type 2. Dtsch Arztebl Int. 2014;111(5):69–82.
21. Pigeot I, Ahrens W. Establishment of a pharmacoepidemiological database in Germany: methodological potential, scientific value and practical limitations. Pharmacoepidemiol Drug Saf. 2008;17(3):215–223. doi:10.1002/pds.1545
22. Young JG, Stensrud MJ, Tchetgen Tchetgen EJ, Hernán MA. A causal framework for classical statistical estimands in failure-time settings with competing events. Stat Med. 2020;39(8):1199–1236. doi:10.1002/sim.8471
23. Sharma A, Smyrk TC, Levy MJ, Topazian MA, Chari ST. Fasting blood glucose levels provide estimate of duration and progression of pancreatic cancer before diagnosis. Gastroenterology. 2018;155(2):490–500.e492. doi:10.1053/j.gastro.2018.04.025
24. Sato K, Hikita H, Myojin Y, et al. Hyperglycemia enhances pancreatic cancer progression accompanied by elevations in phosphorylated STAT3 and MYC levels. PLoS One. 2020;15(7):e0235573. doi:10.1371/journal.pone.0235573
25. Stolzenberg-Solomon RZ, Graubard BI, Chari S, et al. Insulin, glucose, insulin resistance, and pancreatic cancer in male smokers. JAMA. 2005;294(22):2872–2878. doi:10.1001/jama.294.22.2872
26. Sadr-Azodi O, Gudbjornsdottir S, Ljung R. Pattern of increasing HbA1c levels in patients with diabetes mellitus before clinical detection of pancreatic cancer - a population-based nationwide case-control study. Acta Oncol. 2015;54(7):986–992. doi:10.3109/0284186X.2015.1006402
27. Danaei G, Robins JM, Young JG, Hu FB, Manson JE, Hernán MA. Weight loss and coronary heart disease: sensitivity analysis for unmeasured confounding by undiagnosed disease. Epidemiology. 2016;27(2):302–310.
28. Robins JM. Causal models for estimating the effects of weight gain on mortality. Int J Obes (Lond). 2008;32(Suppl 3):S15–S41. doi:10.1038/ijo.2008.83
29. Naimi AI, Cole SR, Kennedy EH. An introduction to g methods. Int J Epidemiol. 2017;46(2):756–762.
30. Dawid AP, Didelez V. Identifying the consequences of dynamic treatment strategies: a decision-theoretic overview. Stat Surv. 2010;4(none):184–231, 148. doi:10.1214/10-SS081
31. Zhang Y, Young JG, Thamer M, Hernan MA. Comparing the effectiveness of dynamic treatment strategies using electronic health records: an application of the parametric g-formula to anemia management strategies. Health Serv Res. 2018;53(3):1900–1918. doi:10.1111/1475-6773.12718
32. Keil AP, Edwards JK, Richardson DB, Naimi AI, Cole SR. The parametric g-formula for time-to-event data: intuition and a worked example. Epidemiology. 2014;25(6):889–897. doi:10.1097/EDE.0000000000000160
33. De Bruijn KMJ, Ruiter R, de Keyser CE, Hofman A, Stricker BH, van Eijck CHJ. Detection bias may be the main cause of increased cancer incidence among diabetics: results from the Rotterdam study. Eur J Cancer. 2014;50(14):2449–2455. doi:10.1016/j.ejca.2014.06.019
34. Peduzzi P, Concato J, Feinstein AR, Holford TR. Importance of events per independent variable in proportional hazards regression analysis. II. Accuracy and precision of regression estimates. J Clin Epidemiol. 1995;48(12):1503–1510. doi:10.1016/0895-4356(95)00048-8
35. Everhart J, Wright D. Diabetes mellitus as a risk factor for pancreatic cancer. A meta-analysis. JAMA. 1995;273(20):1605–1609. doi:10.1001/jama.1995.03520440059037
36. Forsmark CE. Incretins, diabetes, pancreatitis and pancreatic cancer: what the GI specialist needs to know. Pancreatology. 2016;16(1):10–13. doi:10.1016/j.pan.2015.11.009
37. Andersen DK, Korc M, Petersen GM, et al. Diabetes, pancreatogenic diabetes, and pancreatic cancer. Diabetes. 2017;66(5):1103–1110. doi:10.2337/db16-1477
38. Lodi S, Phillips A, Logan R, et al. Comparative effectiveness of immediate antiretroviral therapy versus CD4-based initiation in HIV-positive individuals in high-income countries: observational cohort study. Lancet HIV. 2015;2(8):e335–e343. doi:10.1016/S2352-3018(15)00108-3
39. Karaboyas A, Morgenstern H, Fleischer NL, Schaubel DE, Robinson BM. Replicating randomized trial results with observational data using the parametric g-formula: an application to intravenous iron treatment in hemodialysis patients. Clin Epidemiol. 2020;12:1249–1260. doi:10.2147/CLEP.S283321
40. Taubman SL, Robins JM, Mittleman MA, Hernan MA. Intervening on risk factors for coronary heart disease: an application of the parametric g-formula. Int J Epidemiol. 2009;38(6):1599–1611. doi:10.1093/ije/dyp192
41. Lajous M, Willett WC, Robins J, et al. Changes in fish consumption in midlife and the risk of coronary heart disease in men and women. Am J Epidemiol. 2013;178(3):382–391. doi:10.1093/aje/kws478
42. Garcia-Aymerich J, Varraso R, Danaei G, Camargo CA, Hernán MA. Incidence of adult-onset asthma after hypothetical interventions on body mass index and physical activity: an application of the parametric g-formula. Am J Epidemiol. 2014;179(1):20–26. doi:10.1093/aje/kwt229
43. Jain P, Danaei G, Robins JM, Manson JE, Hernán MA. Smoking cessation and long-term weight gain in the Framingham Heart Study: an application of the parametric g-formula for a continuous outcome. Eur J Epidemiol. 2016;31(12):1223–1229. doi:10.1007/s10654-016-0200-4
44. Johnson KW, Glicksberg BS, Hodos RA, Shameer K, Dudley JT. Causal inference on electronic health records to assess blood pressure treatment targets: an application of the parametric g formula. Pac Symp Biocomput. 2018;23:180–191.
45. Lash TL, Fox MP, MacLehose RF, Maldonado G, McCandless LC, Greenland S. Good practices for quantitative bias analysis. Int J Epidemiol. 2014;43(6):1969–1985. doi:10.1093/ije/dyu149
 © 2021 The Author(s). This work is published and licensed by Dove Medical Press Limited. The
full terms of this license are available at https://www.dovepress.com/terms
and incorporate the Creative Commons Attribution
- Non Commercial (unported, 3.0) License.
By accessing the work you hereby accept the Terms. Non-commercial uses of the work are permitted
without any further permission from Dove Medical Press Limited, provided the work is properly
attributed. For permission for commercial use of this work, please see paragraphs 4.2 and 5 of our Terms.
© 2021 The Author(s). This work is published and licensed by Dove Medical Press Limited. The
full terms of this license are available at https://www.dovepress.com/terms
and incorporate the Creative Commons Attribution
- Non Commercial (unported, 3.0) License.
By accessing the work you hereby accept the Terms. Non-commercial uses of the work are permitted
without any further permission from Dove Medical Press Limited, provided the work is properly
attributed. For permission for commercial use of this work, please see paragraphs 4.2 and 5 of our Terms.