Back to Journals » International Journal of General Medicine » Volume 15
Autophagy-Dependent Ferroptosis-Related Signature is Closely Associated with the Prognosis and Tumor Immune Escape of Patients with Glioma
Authors Sun W ![]() , Yan J
, Yan J ![]() , Ma H, Wu J, Zhang Y
, Ma H, Wu J, Zhang Y ![]()
Received 11 October 2021
Accepted for publication 21 December 2021
Published 6 January 2022 Volume 2022:15 Pages 253—270
DOI https://doi.org/10.2147/IJGM.S343046
Checked for plagiarism Yes
Review by Single anonymous peer review
Peer reviewer comments 3
Editor who approved publication: Dr Scott Fraser
Wenjie Sun, Junqiang Yan, Hongxia Ma, Jiannan Wu, Yongjiang Zhang
Laboratory of Molecular Neurobiology, The First Affiliated Hospital, Henan University of Science and Technology, Luoyang, People’s Republic of China
Correspondence: Junqiang Yan
Laboratory of Molecular Neurobiology, The First Affiliated Hospital, Henan University of Science and Technology, Luoyang, People’s Republic of China
Tel +86 15637737620
Email [email protected]
Background: Ferroptosis is an autophagy-dependent form of cell death, sometimes called “ferritinophagy”. Its related pathway has been proven to regulate the programmed death of glioma stem cells. Mining autophagy-dependent ferroptosis-related gene (AD-FRG) signature could facilitate the discovery of mechanisms and therapeutic targets showing drug resistance to chemotherapeutic drugs.
Methods: We exhaustively searched HADB, MSigDB and FerrDb datasets and obtained 25 genes confirmed to exist in autophagy and ferroptosis death pathways. Glioma gene expression and clinicopathological data were collected from TCGA and CGGA datasets.
Results: Lasso regression and Cox regression analysis were carried out to construct a nine AD-FRGs signature (SIRT1, MTDH, HSPB1, CISD2, HMOX1, ATG7, MTOR, PRKAA2 and EIF2AK4). ROC curve showed that nine genes signature could effectively predict 1- (AUC = 0.869), 3- (AUC = 0.922) and 5-year (AUC = 0.870) survival rates. Immunohistochemical images confirmed the protein expression level of the gene model. The prognostic nomogram of risk score, age, WHO grade, isocitrate dehydrogenase (IDH) wild-type condition, 1p/19q co-deletion state was built. The calibration curve demonstrated that the prediction of the nomogram is highly consistent with the actual results. Moreover, tumor microenvironment analysis showed that the high-risk group was associated with high immune infiltration status and high tumor purity. Correlation analysis showed that the expression of SIRT1, CISD2 and HSPB1 might be related to macrophage infiltration and immunotolerance in glioma tissues.
Conclusion: Based on autophagy-dependent ferroptosis-related genes, we established gene signature and nomogram that maybe effectively predict the overall survival rate of glioma and correlate with the immunosuppressive tumor microenvironment (TME).
Keywords: glioma, ferroptosis, autophagy, immune infiltration, tumor microenvironment
Introduction
Autophagy is a conserved intracellular catabolism process that delivers cytoplasmic components to lysosomes of degradation.1 The role of autophagy is controversial, contextual in cancers.2 Autophagy is a conserved protein degradation process that fuels cell metabolism and energy pathways to maintain cell homeostasis. However, in oncology, autophagy has been described as a mechanism of cells developing resistance to chemotherapy, targeted therapy, or immunotherapy.3,4 Ferroptosis is not only a chemical element that regulates enzyme activity but also oxidizes a variety of substrates and causes biological damage.5 Ferroptosis-mediated oxidative stress is the central mechanism of Ferroptosis death.6,7 Ferroptosis, the newly detected form of cells death, depends on ferroptosis accumulation within cells and lipid peroxidation.8 In addition to inducing tissue damage and protective effects in neurodegenerative diseases, ferroptosis activation also indicates a tremendous anticancer activity.9 Studies have discovered that autophagia plays a pivotal role in ferroptosis induction.10 Although increased autophagy promotes ferroptosis accumulation and subsequent lipid peroxidation through selective degradation of anti-ferroptosis death regulators such as NCOA4 [nuclear receptor coactivator 4], GPX4 [glutathione peroxidase 4] and ARNTL/BMAL1 [aryl hydrocarbon receptor nuclear transport protein, etc],11,12 the underlying molecular mechanisms remain largely unknown.
There is a complicated feedback system between ferroptosis and autophagy. Increasing studies focus on the crosstalk between ferroptosis and autophagy, and show that ferroptosis depends on autophagy13,14. Evidence supported that excessive activation of autophagy cells can promote ferroptosis cell death through ferroptosis activating factor15. However, overexpression of autophagy inducers also leads to resistance to cancer treatment.16 Autophagy and ferroptosis play a critical role in cell fate, and a comprehensive analysis of shared genes between them could help understand feedback mechanism.16,17 Thus, we sought to identify critical genes that cause crosstalk through mining ferroptosis genes in autophagy pathways.
It has been shown that autophagy-dependent ferroptosis was a new form of apoptosis that is dependent on iron-mediated excess lipid peroxidation.15,18 Studies have reported that SIRT3/AMPK/mTOR/GPx4 and COPZ1/NCOA4/FTH1-related pathways modulate autophagy-dependent ferroptosis cancer cell death.19,20 The studies confirmed that the increase of SIRT3 expression could stimulate AMPK mTOR to release iron from ferritin, which leads to free iron accumulation and lipid peroxidation, thereby promoting autophagy activation. The decrease of SIRT3 can inhibit ferroptosis through regulating the GPx4 level.19 NCOA4 is an autophagy receptor. Under iron deficiency, ferritin is degraded in lysosomes and releases iron to maintain intracellular iron level. The increase of free iron level can mediate the autophagic degradation of ferritin, that is, the iron storage complex of cytosol.11,21 When cells respond to oxidative stress, autophagy is activated, and level of NCOA4 or ATG7 feedback increases, and activates ferritinophagy.22,23 Traumatic iron death is detected in several human diseases, such as neurodegenerative diseases, diabetes mellitus, infectious diseases, and cancer.24,25 Imbalance between autophagy and iron death signal allows cancer cells to escape the programmed cell death program resulting in chemoradiotherapy resistance and seriously affecting patients’ prognosis.26 The search of AD-FRGs associated with prognosis facilitates the discovery of novel therapeutic targets to overcome drug resistance in cancer.
As a fatal brain tumor showing rapid proliferation and antitumor therapy characteristics,27 glioma is often classified into lower-grade gliomas (LGGs; WHO grade II–III) and glioblastoma (GBM; WHO grade IV).28,29 Among them, glioma that belongs to WHO grade IV, which is extremely aggressive, highly lethal, extremely malignant, with a high recurrence rate and a very poor prognosis, is individually named glioblastoma multiforme (GBM), which accounts for up to 56% of all gliomas and approximately 80% of all primary intracranial malignancies.30,31 Glioma cells not only show an uninhibited tumor growth pattern but also have an aggregation effect on cells at various levels of differentiation, thus forming a “tumor microenvironment”, and thus presenting the characteristics of tumor heterogeneity, which increases the resistance of glioma cells to chemotherapy and radiotherapy.32,33 Therefore, there is a need to better understand the mechanisms of glioma occurrence and development at the genetic and molecular levels, which in turn will provide new theoretical basis and methods for the diagnosis and treatment of glioma.
More and more studies have shown that prognostic markers help improve the survival rate of patients with glioma, and predict tumor progression earlier, so as to intervene in advance. For example, Tan et al34 identified six immune-related gene models that evaluate the prognosis of glioma, and Zhang et al35 reported that seven gene features could be used as prognostic factors of glioma patients. Although some prognostic gene signatures have been reported, none of them have been used in clinic. This indicates that more genetic signature studies are needed as candidate signatures. In this work, we identified a nine AD-FRGs signature strongly associated with prognostic risk of glioma. Previous studies have confirmed the existence of these genes in autophagy-dependent ferroptosis-related pathways. The prognostic nomogram model indicated that the biomarker had the excellent prognostic ability.
Materials and Methods
Obtaining Glioma Datasets
The TCGA RNA-seq database containing 697 glioma cases from the UCSC Xena browser was taken as a training cohort. We collected gene expression matrix from normal brain tissues from the Genome Tissue Expression (GTEx) dataset (n = 475). Normalized gene expression was measured by FPKM and further performed with log2-based transformation. Similarly, RNA sequence data and related clinicopathological information (such as gender, age, and grade, subtype, IDH condition, 1p/19q state, and survival information) were downloaded from the CGGA database (http://www.cgga.org.cn/). CGGA cohort (mRNAseq_693, mRNAseq_325) was used as a validation cohort. After that, batch effect of data merged from different batches were eliminated using SVA package. Only cases with both gene expression profile and clinicopathological data were enrolled for subsequent study, otherwise removed.
Human Autophagy-Dependent Ferroptosis-Related Genes
Autophagy-related genes were obtained from the Human Autophagy Database (HADb, http://www.autophagy.lu/index.html) and the Molecular Signatures Database (MSigDB, http://software.broadinstitute.org/gsea/msigdb), respectively. After eliminating overlapping genes, we included a total of 531 autophagy-related genes used for analysis. In addition, we also collected 259 ferroptosis-related genes from the FerrDb dataset (http://www.zhounan.org/ferrdb/), and distinguished differentially expressed genes (DEGs) between tumors (TCGA dataset) and adjacent nontumorous tissues (GTEx dataset). The false discovery rate (FDR) <0.05 was considered a significant difference. Then, the Venn diagram was used to display the DEGs, which also involved both autophagy and ferroptosis pathways.
Construction and Validation of an AD-FRG Signature
We used univariate Cox analysis to screen AD-FRGs with prognostic significance, and a forest plot to visualize the results. The LASSO-penalized Cox regression analysis was employed to establish a predictive model to reduce the overfitting risk via the “glmnet” R package. The risk score of each patient was calculated according to the risk score formula, and training cohort patients were further divided into low- or high-risk groups based on median risk scores. The survival difference between the two groups was shown by the Kaplan–Meier curve and compared by Log rank test using the “survival” and “survminer” R package. Time-dependent ROC curve and AUC were applied to evaluate the performance of the gene signature and clinical factors in predicting 1-, 3- and 5-year survival chances.
Verification of Gene Signature Expression and Mutation
Immunohistochemical images were retrieved from the Human Protein Atlas (HPA) database (http://www.proteinatlas.org) for comparison of protein expression levels associated with gene signatures. Mutation levels of gene signatures were obtained from the cBioPortal website.
Development and Assessment of a Predictive Nomogram
Univariate and multivariate Cox regression analyses were first carried out for the construction of a nomogram. We used a forest plot to display P-value, HR, and 95% CI of each variable via the “forestplot” R package. The independent prognostic factors filtered by the above steps were used to construct a nomogram using the “rms” and “survival” R-package. Next, we evaluated whether the predicted survival result was close to the actual output in the calibration curve. Nomogram‐predicted survival and the autual survival rate were indicated on the X- and Y-axes, respectively, and the 45° lines showed the optimal predictions.
Gene Set Enrichment Analysis and Tumor Immune Microenvironment Analysis
We used GSEA software for enrichment analysis of biological function pathways to analyze gene function of signature. The enrichment results of the high-risk group were above the X-axis, and the results of the low-risk group were below the X-axis.36 Pathway with a nominal p-value less than 0.05 and FDR<0.1 was selected.
To study the role of AD-FRG signature in immune system response, we used ssGSEA, CIBERSORT method and ESTIMATE algorithm to compare the proportion of immune components and tumor purity in high- and low-risk glioma samples. SsGSEA was performed using the “GSEAbase” R package to quantify the enrichment activities of 16 immune cells and 13 immune functions.37 The proportion of 22 human hematopoietic cell phenotypes in the immune microenvironment was further analyzed using CIBERSORT algorithm.38 In addition, to assess the degree of immune infiltration and tumor purity, we performed the ESTIMATE algorithm to calculate the matrix, immunity, and estimated scores.39
Correlation Analysis Between AD-FRG Signature and Immune Cells
To further investigate the relationship between AD-FRG signature and immune cells associated with glioma, we calculated the correlation coefficient between gene expression and relative proportion of immune cells. The data were visualized using “corrplot” package in R studio. R > 0.2 was defined as relevant. Finally, co-expression analysis of gene expression and immune cell content was performed. A p < 0.001 indicated a significant correlation using Pearson correlation coefficient.
Statistical Analysis
All statistical analyses and charting were performed in R v. 3.6.2. Lasso-Cox regression analysis was used to construct a prognosis prediction model based on AD-FRGs. Nomograms and calibration curves were drawn in the “rms” R package. Pearson correlation coefficient and Spearman correlation coefficient were calculated to test the correlation between variables. P < 0.05 was considered as statistically significant.
Results
AD-FRGs Identification
The research was conducted following the flowchart is carried out (Figure 1). We collected and integrated 55,175 RNA expression profiles of 697 glioma patients from the TCGA dataset and identified a total of 199 autophagy-related and 303 ferroptosis death-related genes as differentially expressed gene in tumor tissues compared with normal tissues. Twenty-five AD-FRGs, the ferroptosis death function genes in autophagy pathways, were identified from the intersection of the identified DEGs (Figure 2A).
 |
Figure 1 The study flow diagram. In this study, the AD-FRG signature was screened based on TCGA-GBM/LGG dataset. Then, a prognostic nomogram was established in the training and validation cohorts to predict the survival time, respectively. Finally, CIBERSORT and ESTIMATE algorithms are instigated further to explore the underlying mechanism of immune-related prognostic signature. |
 |
Figure 2 Identification of the candidate genes. (A) Venn diagram to identify autophagy-dependent ferroptosis-related DEGs between TCGA dataset and GTEx dataset. (B and C) GO and KEGG enrichment analysis of the 23 prognosis-related DEGs. (D) Forest plots showing nine-gene signature expression. (E) Kaplan–Meier survival analyses in training cohort. (F) ROC analysis in training cohort. (G) Kaplan–Meier survival analyses in verification cohort. (H) ROC analysis in verification cohort. *P<0.05, ***P<0.0001. |
Functional enrichment analysis revealed that the most relevant signaling pathways were “autophagy-animal”, “longevity regulatory pathway”, and “FOXO signaling pathway” (Figure 2B). Meanwhile, the most enriched terms of Gene Ontology were “regulation of autophagy”, “positive regulation of autophagy”, “macroautophagy”, “regulation of macroautophagy,” and “cellular response to chemical stress” (Figure 2C).
Establishment and Validation of AD-FRGs Prognostic Model
Overall, 666-glioma cases from the TCGA dataset were included after the survival analysis as a training set, and 23 prognostically relevant AD-FRGs were identified (Table 1). We used LASSO regression to remove CO-expressed genes to avoid overfitting signature (Figure S1A and B). The PPI network downloaded from the STRING database indicated the interactions among the nine AD-FRGs (Figure S1C). Finally, multivariate Cox regression analysis was employed to identify nine AD-FRGs (SIRT1, MTDH, HSPB1, CISD2, HMOX1, ATG7, MTOR, PRKAA2, EIF2AK4) to construct gene signature. Specifically, six AD-FRGs were of HR > 1 and three AD-FRGs were of HR < 1 (Figure 2D).
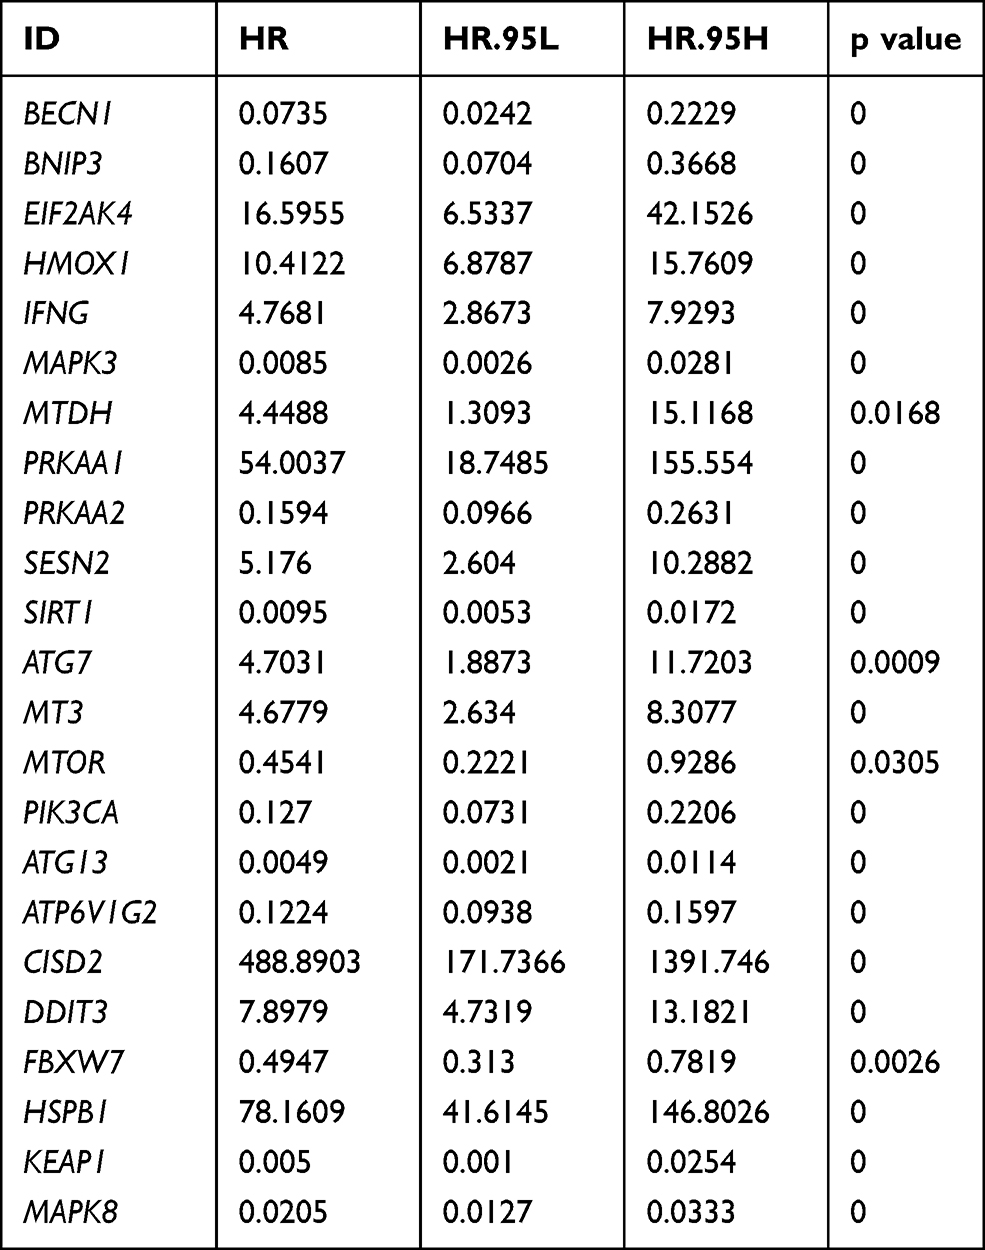 |
Table 1 Twenty-three Prognosis-Related Genes Based on Autophagy-Dependent Ferroptosis-Related Genes |
The risk score formula for each patient is as follows: Risk Score= (0.993×EIF2AK4 Expression) + (0.525×HMOX1 Expression) + (2.846×MTDH Expression) + (−0.515×PRKAA2 Expression) + (−2.905×SIRT1 Expression) + (−1.682×ATG7 Expression) + (1.175×MTOR Expression) + (3.361×CISD2 Expression) + (2.315×HSPB1 Expression).
Cases were assigned to high-risk (n = 333) and low-risk (n = 333) groups according to the median value of the risk score (0.681) (Figure S1D and E). Kaplan–Meier survival analysis showed that the OS of the high-risk group was significantly lower than that of the low-risk group (Figure 2E; P < 0.001). The AUC values at 1, 3, and 5 years were 0.870, 0.922, and 0.869, respectively, highlighting that the AD-FRG signature had a strong prediction ability (Figure 2F).
Validation of AD-FRG Signature in External Datasets
To further validate the reliability of the AD-FRGs prognostic signature model, we divided 657 patients from the CGGA cohort into high-risk (n = 328) and low-risk (n = 329) groups using the corresponding median risk as the cutoff (Figure S1F and G). The survival time of the high-risk population was significantly lower than that of the low-risk population (Figure 2G), showing that AD-FRG signatures had high prognostic prediction ability (Figure 2H).
Expression and Mutation of Nine Model Genes
In TCGA GBM/LGG cohort, compared with adjacent non-tumor brain tissues, MTDH, HSPB1, CISD2, HMOX1 and mTOR were high-expressed in glioma, while the expression of SIRT1, ATG7, PRKAA2 and EIF2AK4 were low-expressed. To confirm these nine gene expressions in clinical practice, we further validated the expression of proteins encoded by nine genes signature using clinical samples from HPA. Figure 3 shows immunohistochemical images of nine genes signature in glioma and the normal cerebral cortex. The mutation status of nine gene signatures was identified in the cBioPortal database, indicating that MTOR, EIF2AK4, HMOX1, and MTDH have significant mutations. The mutations of ATG7, SIRT1, EIF2AK4, HMOX1, MTDH and MTOR are shown in Figure 4.
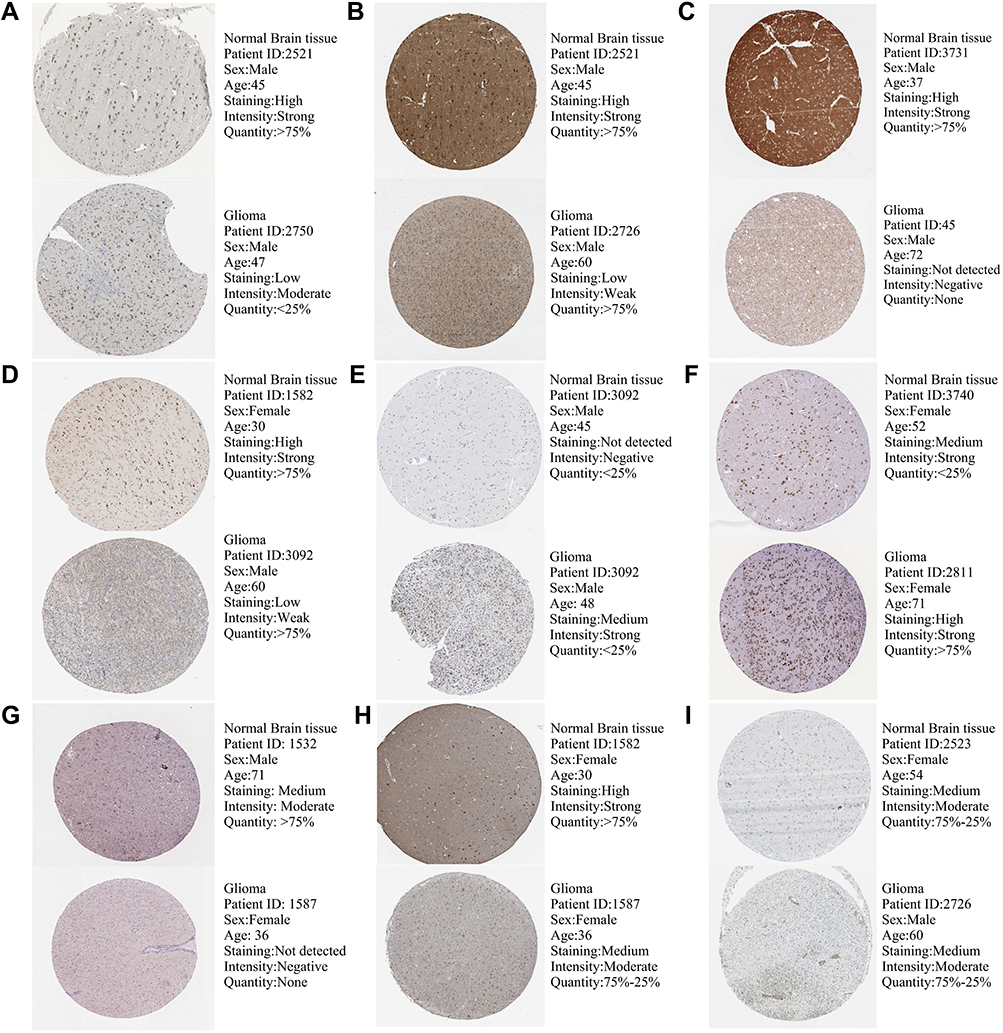 |
Figure 3 Protein expression levels of gene signatures in human tissues, SIRT1 (A), ATG7 (B), PRKAA2 (C), EIF2AK4 (D), HMOX1 (E), MTDH (F), MTOR (G), CISD2 (H), and HSPB1 (I). |
 |
Figure 4 Mutation characteristics of model genes (A), ATG7 (B), SIRT1 (C), PRKAA2 (D), EIF2AK4 (E), HMOX1 (F), MTDH (G), MTOR (H), and HSPB1 (I). *There is currently information about targeted drugs associated with this mutation. |
Independent OS Prediction by the AD-FRG Signature
To further confirm whether the risk score of generated AD-FRG signature was an independent predictor of patients with glioma, we performed univariate and multivariate Cox regression analysis to evaluate the ability of risk score and other clinical parameters to predict OS. Univariate and multivariate Cox analysis has shown that age, WHO grade, IDH condition and 1p/19q state and risk score were independent risk factors for OS (Figure 5; P < 0.05).
 |
Figure 5 Independent predictive power of the risk score and individual clinicopathological covariates. Univariate (A and C) and multivariate (B and D) analyses grounding the nine-gene signature and clinical covariates in TCGA training (A and B) and CGGA validation (C and D) cohorts. |
To make the results easier to interpret, subgroup analysis was carried out according to WHO grade, age, gender, IDH condition, 1p/19q co-deletion state, and treatment or non-treatment. For glioma patients, the risk scores of the age > 50 subgroup, WHO stage IV subgroup, IDH wild-type subgroup and 1p19q non-codel subgroup were much higher than the relative group (Figure S2; P < 0.001). Finally, we analyzed the relativity between individual genes and clinicopathological features. The outcome indicated that EIF2AK4, HMOX1, SIRT1, CISD2 and HSPB1 could effectively distinguish clinical grades (Figure S3).
Constructing Prediction Nomogram
To develop a clinical strategy for predicting OS in glioma patients, we integrated the AD-FRG signature and multiple clinical factors to build a nomogram to evaluate the OS at 1, 3, 5 and 10 years. A nomogram was constructed based on the independent predictors of the CGGA cohort (age, WHO grade, IDH1 wild-type and 1p/19q codeletion) (Figure 6A). The calibration curve verifies the accuracy of the nomogram (Figure 6B). The AUC value was 0.830, which was higher than that of clinical predictors alone (Figure 6C).
 |
Figure 6 Construction of a nomogram. Construction of the nomogram based on prognostic markers in the validation (A) cohorts. Calibration plot assessed the predicted power of OS in the validation (B) cohorts. ROC analysis verified the prognostic effects of risk score and clinical covariates in the validation (C) cohorts. |
The AD-FRGs Signature Was Related to Immune Cell Infiltration
Through GSEA analysis, the molecular biological functions of prognostic models were mainly found to be related to some carcinogenic pathways, such as cell cycle, ECM–receptor interaction and ERBB signaling pathway (Figure 7A and B). In addition, AD-FRGs signature was associated with multiple immune disease-related pathways, for instance, autoimmune thyroid disease, intestinal immune network for IgA production, Leishmania infection and systemic lupus erythematosus (Figure 7A and B).
 |
Figure 7 Gene Set Enrichment Analysis (GSEA) and tumor immune microenvironment analysis. (A and B) Enriched gene sets annotated by the C7 collection between the high- and low-risk groups in the TCGA cohort. The ssGSEA was used to estimate the 16 immune cell scores (C) and 13 immune-related functions (D) in the TCGA cohort. The 22 immune-related terms were used to assess immune cells in the tumor microenvironment (E). Stromal (F), immune (G) and ESTIMATE (H) scores between high- and low-risk groups was estimated by the ESTIMATE algorithm. *P<0.05, **P<0.01, ***P<0.0001. |
To further examine the relation between AD-FRGs signature and immune microenvironment, we quantified infiltration scores of immune cells and immune-related functions with ssGSEA. Notably, the low-risk group was related to a higher immune score of the tumor immune microenvironment (Figure 7C and D). In addition, the above differences were also confirmed in the CGGA cohort (Figure S4).
Subsequently, 22 immune cells in glioma tissue between high-risk and low-risk groups were studied by the CIBERSORT algorithm (the data were visualized by violin map). We found high-risk groups showed significantly higher levels of T cells CD8, T cells CD4 memory resetting, T cells CD4 memory activated, T cells gamma delta, macrophages M0, macrophage M1, mass cells resting, mass cells activated, eosinophils and neutrophils, and lower levels of macrophage M2 (Figure 7E; P < 0.001). Kaplan–Meier survival analysis of immune cells showed that macrophage M0, macrophage M1, neutrophils, eosinophils, mast cells activated, monocytes, T cells CD4 memory activated, T cells CD4 memory resting, and T cells gamma delta had good ability to predict OS (Figure 8; P < 0.001).
 |
Figure 8 Immune microenvironment and prognosis. K-M survival analysis indicated that macrophases M0 (A), macrophage M1 (B), neutrophils (C), eosinophils (D), mast cells activated (E), monocytes (F), T cells CD4 memory activated (G), T cells CD4 memory resting (H), and T cells gamma delta (I) were significantly correlated with survival duration. |
After processing by the ESTIMATE algorithm, higher estimated scores were discovered in the high-risk group. Similarly, the proportion of immune and stromal cells was related to the high-risk group (Figure 7F-H).
In addition, the correlation analysis between tumor clinical grade and immune cell infiltration showed that a higher proportion of macrophage M0, macrophage M1 and T cells CD4 memory resting was related to higher tumor stage, while a lower proportion of mast cells activated was associated with higher tumor stage (Figure S5).
Co-Expression Analysis of AD-FRGs Signature and Immune Cell Signature
Finally, to further investigate the correlation between AD-FRG and immunocyte signatures (Figure 9A), we calculated the correlation coefficients between them. SIRT1 was negatively correlated with the immune scores of T cells CD4 memory resting (R = −0.33, P < 0.001), macrophage M0 (R = −0.35, P < 0.001), macrophage M1 (R = −0.42, P < 0.001) and neutrophils (R = −0.32, P < 0.001), but positively correlated with the mast cells activated. CISD2 was positively correlated with the immune scores of macrophage M0 (R = −0.43, P < 0.001), macrophage M1 (R = −0.3, P < 0.001) and neutrophils (R = 0.38, P < 0.001), but negatively correlated with the risk score. HMOX1 was significantly correlated with macrophage M0 (R = 0.34, P < 0.001) and neutrophils (R = 0.35, P < 0.001). HSPB1 was significantly correlated with T cells CD4 memory resting (R = 0.3, P < 0.001) and macrophage M0 (R = 0.32, P < 0.001) (Figure 9B-M).
 |
Figure 9 Correlation between AD-FRG signature and immune cells. (A) Co-expression model of immunocyte components and AD-FRG signature. The proportion of T cells CD4 memory resting (B), macrophage M0 (C), macrophage M1 (D) and neutrophils (E) were apparently negatively correlated with the expression level of SIRT1, mast cells activated was just the opposite (F). The proportion of macrophage M0 (G), macrophage M1 (H) and Neutrophils (I) were positively related to the expression level of CISD2. The proportion of macrophage M0 (J) and neutrophils (K) were significantly positively correlated with HMOX1 expression. The proportion of T cells CD4 memory resting (L) and macrophage M0 (M) was positively correlated with the HSPB1 expression. |
AD-FRGs Were Associated with Chemotherapy and Immunotherapy Responses
The relationship between drug sensitivity of glioma cell lines and relative expression levels of AD-FRGs was explored using the GDSC database. We further analyzed the correlation between the expression of AD-FRGs and the IC50 of multiple chemotherapeutic agents (Figure 10A). Glioma with high expression of AD-FRGs had higher drug resistance to temozolomide (TMZ), methotrexate, vincristine, and vinorelbine. The potential sensitivity of the two groups to immune checkpoint (CD274, CTLA4, LAG3, and PDCD1) inhibitors was also analyzed. Pods plots showed the relationship between the risk score and four immune checkpoint targets (Figure 10B). The expression of immune checkpoints in high-risk patients increased significantly.
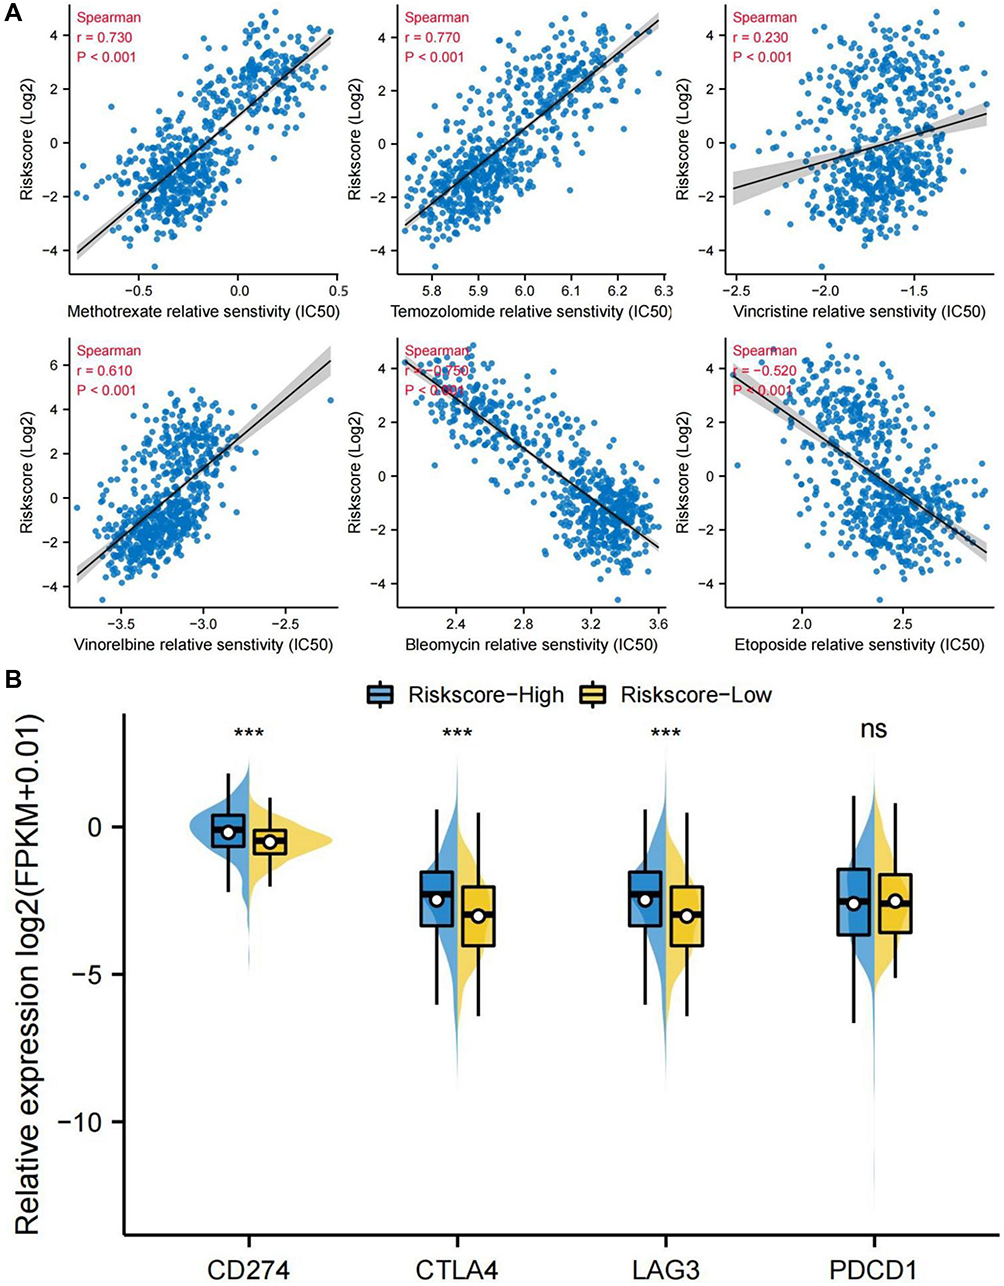 |
Figure 10 Prediction of response to chemotherapy and immunotherapy. (A) IC50 values of six cytotoxic chemotherapeutic drugs (temozolomide, methotrexate, vincristine, vinorelbine, bleomycin, and etoposide) selected by the pRRophetic algorithm in TCGA cohort, Spearman correlation coefficient was calculated to test the correlation between variables. (B) The expression of immune checkpoints (CD274, CTLA4, LAG3, and PDCD1) in both groups in TCGA cohort. ***P<0.0001. |
Discussion
Due to the aggressiveness and recurrence of brain glioma, the current treatment effect is far from satisfactory.40 Genes of the autophagy-dependent ferroptosis-related pathway have been increasingly discovered in glioma tissues, but none has integrated these genes to establish a gene prognosis model. Studies have described ferritinophagy as a form of autophagy-dependent programmed cell death.41 The link between autophagy and ferroptosis may imply a complex interplay between metabolic dysfunction and oxidative stress.13,42 Therefore, it may be helpful to build a ferritinophagy-related RNA signature to predict the glioma patients’ survival and improve therapeutic approaches.
We were the first to screen ferroptosis genes in autophagy pathway. The current analysis and validation demonstrate that the prognosis model constructed by nine autophagy-dependent ferritinophagy-related genes (EIF2AK4, HMOX1, MTDH, PRKAA2, SIRT1, ATG7, MTOR, CISD2, and HSPB1) can effectively predict the survival time. Previous studies have confirmed the critical role of these genes in the autophagy-dependent iron death pathway. Our study confirmed that the knockdown of these genes is more conducive to prognosis of glioma, except EIF2AK4.
Our results showed that the down-regulation of the three genes (ATG7, SIRT1, PRKAA2) played a protective role in glioma. Autophagy-related protein 7(Atg7) can trigger regulatory cell death (RCD) in glioma and often serve as a target for inducing autophagic-dependent death.43 Studies have shown that SIRT1 inhibition can inhibit tumor growth.44 PRKAA2 is also known as AMP-activated protein kinase (AMPK) again. Inhibition of AMPK has been found to reduce the activity of GBM tumor cells.45
Next, of the six risk genes, only general control nonderepressible 2 (GCN2; EIF2AK4) was downregulated. EIF2AK4 is an environmental sensor, activated EIF2AK4 up-regulates ATF4 to induce the expression of Sestrin2, which is vital for tumor cell survival under oxidative stress.46 However, there is no study reporting the effect of activating EIF2AK4 on the treatment of gliomas.
In addition, five risk genes (HMOX1, MTDH, MTOR, CISD2 and HSPB1) were up-regulated compared with in other tumors. In many reports, mechanistic target of rapamycin (mTOR) signaling pathway is closely related to tumor growth, metabolism, apoptosis and autophagy. MTOR inhibitors have been widely used in tumor therapy in recent years. It has been demonstrated that the deficiency of SIRT3 is resistant to autophagy-dependent ferritinophagy through restraining the AMPK/mTOR pathway and elevating GPX4 expression levels.19 Inhibition of PI3K/Akt/mTOR (mechanistic target of rapamycin) pathway can be used as a therapeutic target for GBM.47 MTOR-related pathways are complex, and their roles in autophagy and ferroptosis in glioma are widely studied. Upregulation of CDGSH iron sulfur domain 2 (CISD2) can inhibit beclin-1-mediated autophagy and promote glioma proliferation.48 Previous studies indicated that CISD2 overexpression maintains the efficacy of sulfasalazine by regulating iron death.49 However, no studies have confirmed whether CISD2 can overcome drug resistance in glioma. Elevated expression levels of heat shock protein beta-1 (HSPB1) could activate SIRT2-mediated G6PD and promote glioma cell proliferation,50 butHSPB1 can inhibit TfR1 recovery and reduce intracellular free iron concentration.51,52 When HSPB1 is inhibited, iron ions accumulate and activate elastin-induced ferroptosis,53 providing a research direction for the development of new anticancer drugs. Metadherin (MTDH) is highly expressed in gliomas, which can induce epithelial-mesenchymal transition (EMT)-like changes,54 and MTDH is considered as a promising biomarker and therapeutic target for gliomas. However, the specific role of MTDH in glioma pathogenesis remains unclear. Heme oxygenase 1 (HMOX1) is high-expressed in the hypoxic region of GBM and triggers mitophagy cell death of glioma cells.54,55 On the other hand, silencing HMOX1 can suppress the invasion of GBM,56,57 but the mechanism remains to be further studied.
We found significant immune infiltration in tumor tissues of high-risk patients. Noticeably, high-risk patients had higher tumor purity and immune score, indicating that despite a high permeability of immune cells, immune cells are mainly concentrated around the stroma and fail to penetrate tumor tissue to clear tumor cells.58,59 In other words, AD-FRGs may be closely related to the immune escape of glioma. It should be mentioned that the degree of infiltration of tumor-associated macrophages (TAM), such as macrophage M0 and macrophage M1, is particularly significant in patients in the high-risk group.60 In recent years, TAM has been considered as a critical factor of tumor immune escape and can cause immunosuppression. Our study showed that macrophage M0 and macrophage M1 were significantly correlated with a shorter survival of high-risk patients and can effectively distinguish between different tumor stages. In addition, we found that, as a protective gene, SIRT1 was associated with reduced macrophage M0 and macrophage M1. High levels of SIRT1 may affect the prognosis by inhibiting immune infiltration, but the specific mechanism needs to be confirmed by further research. The high expression of HMOX1, CISD2, and HSPb1 were related to increased proportion of macrophage M0 and macrophage M1, which is indicative of a poor prognosis.
We found significant immune infiltration in tumor tissues of high-risk patients. Moreover, high-risk patients had higher tumor purity and immune score. It has been found that despite the high permeability of immune cells, the immune cells are mainly concentrated around the stroma and unable to penetrate tumor tissue to clear the tumor cells.58,59 In other words, AD-FRGs may be closely related to the immune escape of glioma. Interestingly, the degree of infiltration of tumor-associated macrophages (TAM), such as macrophages M0 and M1, is particularly significant in patients in the high-risk group.60 In recent years, TAM has been considered as a critical factor of tumor immune escape and can cause immunosuppression. Our study showed that macrophage M0 and macrophage M1 were significantly correlated with shorter survival of high-risk patients and could effectively distinguish different tumor stages. In addition, we found that down-regulation of SIRT1 was associated with reducing macrophage M0 and macrophage M1. The high expression of HMOX1, CISD2, and HSPb1 were related to increased proportion of macrophage M0 and macrophage M1, which is associated with a poor prognosis.
CD4+ T cells play crucial roles for host defense and immune-mediated disease by their ability to differentiate into specialized subpopulations, such as Th1 cells, Th2 cells, Th17 cells and regulatory T cells.61 Among them, Th1 cells are strongly associated with good clinical outcome for almost all cancer types.62 Regulatory T cells, characterized by the CD4+ CD25+ FOXP3+ phenotype, are believed to dampen T-cell immunity and to be the main obstacle tempering immunotherapy.63 In the present study, we found that all CD4+ T cells could be an adverse predictor for patients with glioma. A possible explanation for the detrimental effect of CD4+ T cells on patient prognoses is that protumoral T cell subpopulations (regulatory T cells) might be more prevalent than those with antitumoral phenotypes (eg, Th1 cells) in glioma tissues. Testing this hypothesis may be the subject of further investigations.
We first screened autophagy-dependent ferroptosis-related genes and established a prognostic prediction model with a nine-genes signature. Our prognostic model exhibited good predictive performance and effectively discriminated high-risk patients with glioma. However, our study has certain limitations. Firstly, we failed to obtain certain important clinicopathological information from the TCGA database. Moreover, the practicality and stability of the nomogram have not been further validated in clinical studies. Lastly, the mechanism by which AD-FRGs affect the immune microenvironment needs further investigation.
Conclusion
In conclusion, we developed an AD-FRG signature, which maybe help us understand the role of AD-FRG in glioma and facilitate decision-making in clinical practice. In addition, we explored the relationship between AD-FRG and immune infiltration, SIRT1, CISD2 and HSPB1 might be related to macrophage infiltration and immunotolerance in glioma tissues, providing a new target for immunotherapy.
Data Sharing Statement
The datasets generated and analyzed during the current study are available in the TCGA (http://cancergenome.nih.gov/abouttcga), CGGA (http://www.cgga.org.cn/), HPA (https://www.proteinatlas.org/) and cBioPortal (http://www.cbioportal.org) databases.
Ethics Statement
The studies involving human participants were reviewed and approved by the Institutional Review Board of the First Affiliated Hospital of Henan University of Science and Technology in Henan Province (Luoyang, China).
Acknowledgments
The study was supported by the National Natural Science Foundation of Henan Province (182300410333), Project of Henan Province Science and Technology (212102310216), Key projects of medical Henan Province science and technology (SBGJ202002099) and Medical science and technology research in Henan Province (LHGJ20190560).
Disclosure
The authors declare no conflict of interest.
References
1. Singh SS, Vats S, Chia AY, et al. Dual role of autophagy in hallmarks of cancer. Oncogene. 2018;37(9):1142–1158. doi:10.1038/s41388-017-0046-6
2. Dower CM, Wills CA, Frisch SM, Wang HG. Mechanisms and context underlying the role of autophagy in cancer metastasis. Autophagy. 2018;14(7):1110–1128. doi:10.1080/15548627.2018.1450020
3. Joshi S, Kumar S, Ponnusamy MP, Batra SK. Hypoxia-induced oxidative stress promotes MUC4 degradation via autophagy to enhance pancreatic cancer cells survival. Oncogene. 2016;35(45):5882–5892. doi:10.1038/onc.2016.119
4. Gammoh N, Fraser J, Puente C, et al. Suppression of autophagy impedes glioblastoma development and induces senescence. Autophagy. 2016;12(9):1431–1439. doi:10.1080/15548627.2016.1190053
5. Torti SV, Torti FM. Iron and cancer: more ore to be mined. Nat Rev Cancer. 2013;13(5):342–355. doi:10.1038/nrc3495
6. Xie Y, Hou W, Song X, et al. Ferroptosis: process and function. Cell Death Differ. 2016;23(3):369–379. doi:10.1038/cdd.2015.158
7. Stockwell BR, Friedmann Angeli JP, Bayir H, et al. Ferroptosis: a regulated cell death nexus linking metabolism, redox biology, and disease. Cell. 2017;171(2):273–285. doi:10.1016/j.cell.2017.09.021
8. Bai Y, Meng L, Han L, et al. Lipid storage and lipophagy regulates ferroptosis. Biochem Biophys Res Commun. 2019;508(4):997–1003. doi:10.1016/j.bbrc.2018.12.039
9. Tang R, Xu J, Zhang B, et al. Ferroptosis, necroptosis, and pyroptosis in anticancer immunity. J Hematol Oncol. 2020;13(1):110. doi:10.1186/s13045-020-00946-7
10. Liu J, Guo ZN, Yan XL, et al. Crosstalk between autophagy and ferroptosis and its putative role in ischemic stroke. Front Cell Neurosci. 2020;14:577403. doi:10.3389/fncel.2020.577403
11. Gao M, Monian P, Pan Q, Zhang W, Xiang J, Jiang X. Ferroptosis is an autophagic cell death process. Cell Res. 2016;26(9):1021–1032. doi:10.1038/cr.2016.95
12. Song X, Zhu S, Chen P, et al. AMPK-mediated BECN1 phosphorylation promotes ferroptosis by directly blocking system X(c)(-) activity. Current Biol. 2018;28(15):2388–2399.e2385. doi:10.1016/j.cub.2018.05.094
13. Kang R, Tang D. Autophagy and ferroptosis - what’s the connection? Curr Pathobiol Rep. 2017;5(2):153–159. doi:10.1007/s40139-017-0139-5
14. Wu Z, Geng Y, Lu X, et al. Chaperone-mediated autophagy is involved in the execution of ferroptosis. Proc Natl Acad Sci USA. 2019;116(8):2996–3005. doi:10.1073/pnas.1819728116
15. Hou W, Xie Y, Song X, et al. Autophagy promotes ferroptosis by degradation of ferritin. Autophagy. 2016;12(8):1425–1428. doi:10.1080/15548627.2016.1187366
16. Tang D, Kang R, Berghe TV, Vandenabeele P, Kroemer G. The molecular machinery of regulated cell death. Cell Res. 2019;29(5):347–364. doi:10.1038/s41422-019-0164-5
17. Zhou B, Liu J, Kang R, Klionsky DJ, Kroemer G, Tang D. Ferroptosis is a type of autophagy-dependent cell death. Semin Cancer Biol. 2020;66:89–100. doi:10.1016/j.semcancer.2019.03.002
18. Yang M, Chen P, Liu J, et al. Clockophagy is a novel selective autophagy process favoring ferroptosis. Sci Advan. 2019;5(7):eaaw2238. doi:10.1126/sciadv.aaw2238
19. Han D, Jiang L, Gu X, et al. SIRT3 deficiency is resistant to autophagy-dependent ferroptosis by inhibiting the AMPK/mTOR pathway and promoting GPX4 levels. J Cell Physiol. 2020;235(11):8839–8851. doi:10.1002/jcp.29727
20. Zhang Y, Kong Y, Ma Y, et al. Loss of COPZ1 induces NCOA4 mediated autophagy and ferroptosis in glioblastoma cell lines. Oncogene. 2021;40(8):1425–1439. doi:10.1038/s41388-020-01622-3
21. Zielke S, Meyer N, Mari M, et al. Loperamide, pimozide, and STF-62247 trigger autophagy-dependent cell death in glioblastoma cells. Cell Death Dis. 2018;9(10):994. doi:10.1038/s41419-018-1003-1
22. Mancias JD, Pontano Vaites L, Nissim S, et al. Ferritinophagy via NCOA4 is required for erythropoiesis and is regulated by iron dependent HERC2-mediated proteolysis. eLife. 2015;4:365.
23. Santana-Codina N, Mancias JD. The role of NCOA4-Mediated Ferritinophagy In Health And Disease. Pharmaceuticals (Basel, Switzerland). 2018;11:4.
24. Weiland A, Wang Y, Wu W, et al. Ferroptosis and its role in diverse brain diseases. Mol Neurobiol. 2019;56(7):4880–4893. doi:10.1007/s12035-018-1403-3
25. Liu J, Kuang F, Kroemer G, Klionsky DJ, Kang R, Tang D. Autophagy-dependent ferroptosis: machinery and regulation. Cell Chem Biol. 2020;27(4):420–435. doi:10.1016/j.chembiol.2020.02.005
26. Mou Y, Wu J, Zhang Y, Abdihamid O, Duan C, Li B. Low expression of ferritinophagy-related NCOA4 gene in relation to unfavorable outcome and defective immune cells infiltration in clear cell renal carcinoma. BMC Cancer. 2021;21(1):18. doi:10.1186/s12885-020-07726-z
27. Yin CL, Lv SQ, Chen XY, Guo H. The role of glioma stem cells in glioma tumorigenesis. Front Biosci. 2014;19:818–824. doi:10.2741/4249
28. Ceccarelli M, Barthel F, Malta T, et al. Molecular profiling reveals biologically discrete subsets and pathways of progression in diffuse glioma. Cell. 2016;164(3):550–563. doi:10.1016/j.cell.2015.12.028
29. Alves ALV, Gomes INF, Carloni AC, et al. Role of glioblastoma stem cells in cancer therapeutic resistance: a perspective on antineoplastic agents from natural sources and chemical derivatives. Stem Cell Res Ther. 2021;12(1):206.
30. Broekman ML, Maas SLN, Abels ER, Mempel TR, Krichevsky AM, Breakefield XO. Multidimensional communication in the microenvirons of glioblastoma. Nat Rev Neurol. 2018;14(8):482–495. doi:10.1038/s41582-018-0025-8
31. Preusser M, de Ribaupierre S, Wöhrer A, et al. Current concepts and management of glioblastoma. Ann Neurol. 2011;70(1):9–21. doi:10.1002/ana.22425
32. Gourlay J, Morokoff AP, Luwor RB, Zhu HJ, Kaye AH, Stylli SS. The emergent role of exosomes in glioma. J Clin Neurosci. 2017;35:13–23. doi:10.1016/j.jocn.2016.09.021
33. Rolle K. miRNA multiplayers in glioma. From bench to bedside. Acta Biochimica Polonica. 2015;62(3):353–365. doi:10.18388/abp.2015_1072
34. Tan YQ, Li YT, Yan TF, et al. Six immune associated genes construct prognostic model evaluate low-grade glioma. Front Immunol. 2020;11:606164. doi:10.3389/fimmu.2020.606164
35. Zhang GH, Zhong QY, Gou XX, et al. Seven genes for the prognostic prediction in patients with glioma. Clin Transl Oncol. 2019;21(10):1327–1335. doi:10.1007/s12094-019-02057-3
36. Subramanian A, Tamayo P, Mootha VK, et al. Gene set enrichment analysis: a knowledge-based approach for interpreting genome-wide expression profiles. Proc Natl Acad Sci USA. 2005;102(43):15545–15550. doi:10.1073/pnas.0506580102
37. Barbie DA, Tamayo P, Boehm JS, et al. Systematic RNA interference reveals that oncogenic KRAS-driven cancers require TBK1. Nature. 2009;462(7269):108–112. doi:10.1038/nature08460
38. Newman AM, Liu CL, Green MR, et al. Robust enumeration of cell subsets from tissue expression profiles. Nat Methods. 2015;12(5):453–457. doi:10.1038/nmeth.3337
39. Yoshihara K, Shahmoradgoli M, Martínez E, et al. Inferring tumour purity and stromal and immune cell admixture from expression data. Nat Commun. 2013;4:2612. doi:10.1038/ncomms3612
40. Davis ME. Glioblastoma: overview of disease and treatment. Clin J Oncol Nurs. 2016;20(5 Suppl):S2–8. doi:10.1188/16.CJON.S1.2-8
41. Tang M, Chen Z, Wu D, Chen L. Ferritinophagy/ferroptosis: iron-related newcomers in human diseases. J Cell Physiol. 2018;233(12):9179–9190. doi:10.1002/jcp.26954
42. Pierzynowska K, Rintz E, Gaffke L, Węgrzyn G. Ferroptosis and its modulation by autophagy in light of the pathogenesis of lysosomal storage diseases. Cells. 2021;10(2). doi:10.3390/cells10020365
43. Meyer N, Henkel L, Linder B, et al. Autophagy activation, lipotoxicity and lysosomal membrane permeabilization synergize to promote pimozide- and loperamide-induced glioma cell death. Autophagy. 2021;17(11):3424–3443. doi:10.1080/15548627.2021.1874208
44. Qu Y, Zhang J, Wu S, Li B, Liu S, Cheng J. SIRT1 promotes proliferation and inhibits apoptosis of human malignant glioma cell lines. Neurosci Lett. 2012;525(2):168–172. doi:10.1016/j.neulet.2012.07.025
45. Chhipa RR, Fan Q, Anderson J, et al. AMP kinase promotes glioblastoma bioenergetics and tumour growth. Nat Cell Biol. 2018;20(7):823–835. doi:10.1038/s41556-018-0126-z
46. Hu G, Yu Y, Tang YJ, Wu C, Long F, Karner CM. The amino acid sensor Eif2ak4/GCN2 Is required for proliferation of osteoblast progenitors in mice. J Bone Mineral Res. 2020;35(10):2004–2014. doi:10.1002/jbmr.4091
47. Li X, Wu C, Chen N, et al. PI3K/Akt/mTOR signaling pathway and targeted therapy for glioblastoma. Oncotarget. 2016;7(22):33440–33450. doi:10.18632/oncotarget.7961
48. Sun AG, Meng FG, Wang MG. CISD2 promotes the proliferation of glioma cells via suppressing beclin‑1‑mediated autophagy and is targeted by microRNA‑449a. Mol Med Rep. 2017;16(6):7939–7948. doi:10.3892/mmr.2017.7642
49. Kim EH, Shin D, Lee J, Jung AR, Roh JL. CISD2 inhibition overcomes resistance to sulfasalazine-induced ferroptotic cell death in head and neck cancer. Cancer Lett. 2018;432:180–190.
50. Ye H, Huang H, Cao F, Chen M, Zheng X, Zhan R. HSPB1 enhances SIRT2-mediated G6PD activation and promotes glioma cell proliferation. PLoS One. 2016;11(10):e0164285. doi:10.1371/journal.pone.0164285
51. Latunde-Dada GO. Ferroptosis: role of lipid peroxidation, iron and ferritinophagy. Biochimica Et Biophysica Acta General Subjects. 2017;1861(8):1893–1900. doi:10.1016/j.bbagen.2017.05.019
52. Arrigo AP, Virot S, Chaufour S, Firdaus W, Kretz-Remy C, Diaz-Latoud C. Hsp27 consolidates intracellular redox homeostasis by upholding glutathione in its reduced form and by decreasing iron intracellular levels. Antioxid Redox Signal. 2005;7(3–4):414–422. doi:10.1089/ars.2005.7.414
53. Chen H, Zheng C, Zhang Y, Chang YZ, Qian ZM, Shen X. Heat shock protein 27 downregulates the transferrin receptor 1-mediated iron uptake. Int J Biochem Cell Biol. 2006;38(8):1402–1416. doi:10.1016/j.biocel.2006.02.006
54. Tong L, Chu M, Yan B, et al. MTDH promotes glioma invasion through regulating miR-130b-ceRNAs. Oncotarget. 2017;8(11):17738–17749. doi:10.18632/oncotarget.14717
55. Meyer N, Zielke S, Michaelis JB, et al. AT 101 induces early mitochondrial dysfunction and HMOX1 (heme oxygenase 1) to trigger mitophagic cell death in glioma cells. Autophagy. 2018;14(10):1693–1709. doi:10.1080/15548627.2018.1476812
56. Sun X, Ou Z, Xie M, et al. HSPB1 as a novel regulator of ferroptotic cancer cell death. Oncogene. 2015;34(45):5617–5625. doi:10.1038/onc.2015.32
57. Ghosh D, Ulasov IV, Chen L, et al. TGFβ-responsive HMOX1 expression is associated with stemness and invasion in glioblastoma multiforme. Stem Cells. 2016;34(9):2276–2289. doi:10.1002/stem.2411
58. Turley SJ, Cremasco V, Astarita JL. Immunological hallmarks of stromal cells in the tumour microenvironment. Nat Rev Immunol. 2015;15(11):669–682. doi:10.1038/nri3902
59. Gajewski TF, Woo SR, Zha Y, et al. Cancer immunotherapy strategies based on overcoming barriers within the tumor microenvironment. Curr Opin Immunol. 2013;25(2):268–276. doi:10.1016/j.coi.2013.02.009
60. Nakamura K, Smyth MJ. Myeloid immunosuppression and immune checkpoints in the tumor microenvironment. Cell Mol Immunol. 2020;17(1):1–12. doi:10.1038/s41423-019-0306-1
61. Bates GJ, Fox SB, Han C, et al. Quantification of regulatory T cells enables the identification of high-risk breast cancer patients and those at risk of late relapse. J Clin Oncol. 2006;24(34):5373–5380. doi:10.1200/JCO.2006.05.9584
62. Fridman WH, Pagès F, Sautès-Fridman C, Galon J. The immune contexture in human tumours: impact on clinical outcome. Nat Rev Cancer. 2012;12(4):298–306. doi:10.1038/nrc3245
63. Curiel TJ. Tregs and rethinking cancer immunotherapy. J Clin Invest. 2007;117(5):1167–1174. doi:10.1172/JCI31202
 © 2022 The Author(s). This work is published and licensed by Dove Medical Press Limited. The
full terms of this license are available at https://www.dovepress.com/terms
and incorporate the Creative Commons Attribution
- Non Commercial (unported, 3.0) License.
By accessing the work you hereby accept the Terms. Non-commercial uses of the work are permitted
without any further permission from Dove Medical Press Limited, provided the work is properly
attributed. For permission for commercial use of this work, please see paragraphs 4.2 and 5 of our Terms.
© 2022 The Author(s). This work is published and licensed by Dove Medical Press Limited. The
full terms of this license are available at https://www.dovepress.com/terms
and incorporate the Creative Commons Attribution
- Non Commercial (unported, 3.0) License.
By accessing the work you hereby accept the Terms. Non-commercial uses of the work are permitted
without any further permission from Dove Medical Press Limited, provided the work is properly
attributed. For permission for commercial use of this work, please see paragraphs 4.2 and 5 of our Terms.