Back to Journals » Clinical Ophthalmology » Volume 17
Automation of Macular Degeneration Classification in the AREDS Dataset, Using a Novel Neural Network Design
Authors Xie L ![]() , Vaghefi E
, Vaghefi E ![]() , Yang S
, Yang S ![]() , Han D, Marshall J, Squirrell D
, Han D, Marshall J, Squirrell D
Received 16 November 2022
Accepted for publication 12 January 2023
Published 2 February 2023 Volume 2023:17 Pages 455—469
DOI https://doi.org/10.2147/OPTH.S396537
Checked for plagiarism Yes
Review by Single anonymous peer review
Peer reviewer comments 3
Editor who approved publication: Dr Scott Fraser
Li Xie,1 Ehsan Vaghefi,1,2 Song Yang,1 David Han,1,2 John Marshall,3 David Squirrell1,4
1Toku Eyes Limited, Auckland, New Zealand; 2School of Optometry and Vision Science, The University of Auckland, Auckland, New Zealand; 3Institute of Ophthalmology, UCL, London, UK; 4Department of Ophthalmology, Auckland District Health Board, Auckland, New Zealand
Correspondence: Ehsan Vaghefi, Tel +6493737599, Email [email protected]
Purpose: To create an ensemble of Convolutional Neural Networks (CNNs), capable of detecting and stratifying the risk of progressive age-related macular degeneration (AMD) from retinal photographs.
Design: Retrospective cohort study.
Methods: Three individual CNNs are trained to accurately detect 1) advanced AMD, 2) drusen size and 3) the presence or otherwise of pigmentary abnormalities, from macular centered retinal images were developed. The CNNs were then arranged in a “cascading” architecture to calculate the Age-related Eye Disease Study (AREDS) Simplified 5-level risk Severity score (Risk Score 0 – Risk Score 4), for test images. The process was repeated creating a simplified binary “low risk” (Scores 0– 2) and “high risk” (Risk Score 3– 4) classification.
Participants: There were a total of 188,006 images, of which 118,254 images were deemed gradable, representing 4591 patients, from the AREDS1 dataset. The gradable images were split into 50%/25%/25% ratios for training, validation and test purposes.
Main Outcome Measures: The ability of the ensemble of CNNs using retinal images to predict an individual’s risk of experiencing progression of their AMD based on the AREDS 5-step Simplified Severity Scale.
Results: When assessed against the 5-step Simplified Severity Scale, the results generated by the ensemble of CNN’s achieved an accuracy of 80.43% (quadratic kappa 0.870). When assessed against a simplified binary (Low Risk/High Risk) classification, an accuracy of 98.08%, sensitivity of ≥ 85% and specificity of ≥ 99% was achieved.
Conclusion: We have created an ensemble of neural networks, trained on the AREDS 1 dataset, that is able to accurately calculate an individual’s score on the AREDS 5-step Simplified Severity Scale for AMD. If the results presented were replicated, then this ensemble of CNNs could be used as a screening tool that has the potential to significantly improve health outcomes by identifying asymptomatic individuals who would benefit from AREDS2 macular supplements.
Keywords: AREDS, Simplified Severity Scale, AMD, neural networks
Plain Language Summary
In this paper, we have improved upon previous work, creating an ensemble of neural networks to accurately automating the calculation of AREDS Simplified Severity Scale for AMD, using fundus images.
Introduction
Age-related macular degeneration (AMD) is responsible for approximately 9% of global blindness and is the leading cause of visual loss in developed countries. Worldwide, it is estimated that nearly 200 million are living with AMD and it is expected that this number will increase substantially over the next two decades as a result of changing population demographics.1,2 AMD is a progressive, stepwise disease and is classified, based on clinical examination or color fundus photography, into early, intermediate, and late stages. The hallmarks of intermediate disease are the presence of large drusen or pigmentary abnormalities at the macula. There are two forms of late AMD: 1) neovascular AMD and 2) atrophic AMD, with geographic atrophy (GA).3–5 The Age-Related Eye Disease Study (AREDS), sponsored by the National Eye Institute (National Institutes of Health), was a randomized clinical trial to assess the efficacy of oral supplementation with antioxidant vitamins and minerals on the clinical course of AMD and age-related cataract.6 Longitudinal analysis of this study cohort led to the development of the patient-based AREDS Simplified Severity Scale for AMD. It combines risk factors from both eyes to generate an overall score for the individual, based on the presence of one or more large drusen (diameter >125 mm) or pigmentary abnormalities at the macula of each eye.6,7 The 5-step Simplified Severity Scale can be used by clinicians to predict an individual’s 5-year risk of developing late AMD and thus determine which patient would benefit from anti-oxidant supplements to reduce the risk of them developing neovascular AMD.6 The rising disease prevalence will place a significant burden on existing eye care services, and as a result there is increasing interest in the use of automated diagnostics and tele-ophthalmology services to identify at-risk individuals and facilitate both the early diagnosis of sight-threatening disease and instigation of early intervention strategies to reduce the risk of disease progression.8–10
To date, a small number of groups have reported the outcome of neural networks to automate the process of both detecting and classifying AMD in retinal images, with varying levels of success.11–17 However, only one group has attempted to automate the AREDS Simplified Severity Scale using retinal images.18,19 This approach is of interest because if this scale could be generated automatically from retinal images it would enable the development of tools that could enable mass screening for AMD in primary care, without recourse to specialist review. The one existing model which used low-quality images and an architecture that utilized three individual disease classifier CNNs which independently fed data into the Simplified 5-step severity scale achieved an accuracy of just 0.671; kappa 0.55819 In the current paper, we hypothesized that it should be possible to build CNNs that would more accurately detect those elements critical to the AREDS 5-step Simplified Severity Scale, namely advanced AMD (aAMD), drusen size and retinal pigmentary abnormalities, if higher quality images were used. We also investigated the effect of image size, network architecture and hyperspace optimization on the overall performance of the neural network. The accuracy of the resulting optimized neural network to predict the final 5-step severity scale score generated was then assessed against the ground truth using traditional metrics, ROC analysis, sensitivity and specificity.
Methods
Dataset
The AREDS 1 (ie, initiated in 2010 and 2014) dataset was obtained from the National Eye Institute (https://www.ncbi.nlm.nih.gov/projects/gap/cgi-bin/study.cgi?study_id¼phs000001.v3.p1). The University of Auckland UNISERVICES and University of Auckland Contract Management team approved the process of data acquisition and use protocol. In total, 188,006 images from the AREDS1 datasets were initially obtained. These images were then passed through our previously published quality assessment (QA) neural network.20 In brief, this QA neural network was trained on 100,000 fundus images which were labelled as gradable vs non-gradable. In our previous publications, it was demonstrated that the QA neural network has >99% accuracy.20–22 Using our QA neural network, the original 188,006 images were reduced to 118,254 images that were deemed gradable, representing 4591 patients (Figure 1). The overall demographics of this dataset were as follows: age 55.3–81.3 (overall mean 69.4), 2027 males, age 55.3–81.2 (male age mean 69.6), 2564 females, age 55.3–81.3 (female age mean 69.2). Overall, 398 patients of the cohort used in this study developed advanced AMD during the AREDS.
 |
Figure 1 Flowchart, demonstrating the initial data acquisition, image quality assessment, labelling process and training set creation. |
These images were then labelled if they were clinical signs of advanced AMD (aAMD), drusen or pigmentary abnormalities present. All images in the AREDS 1 dataset have been read by the AREDS reading center and a disease label issued according to the predefined protocol23 https://www.ncbi.nlm.nih.gov/projects/gap/cgi-bin/GetListOfAllObjects.cgi?study_id=phs000001.v3.p1andobject_type=variable. We used the predetermined clinical labels allocated to each of the F2 images to populate the various disease states used in this study. These labels were not mutually exclusive (ie, one image could have several labels). The dataset was then split into training\validation\testing as described below, where the testing set included 1148 patients, 41,849 images representing 7965 recorded visits (Tables 1–3).
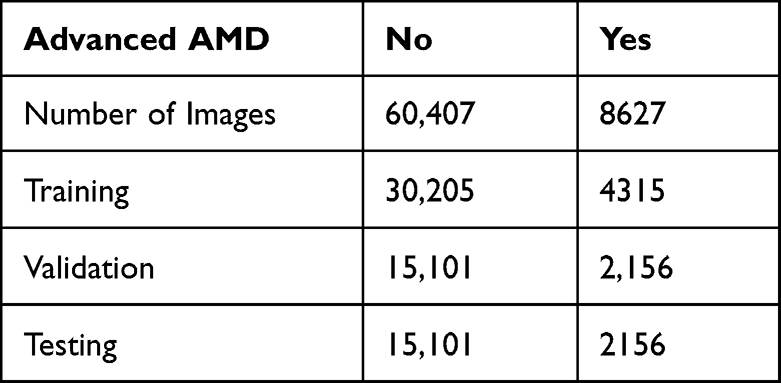 |
Table 1 The Spread of Abnormalities in the Dataset Used in This Study, and Training, Validation and Test Dataset Splits for Each Neural Network Category |
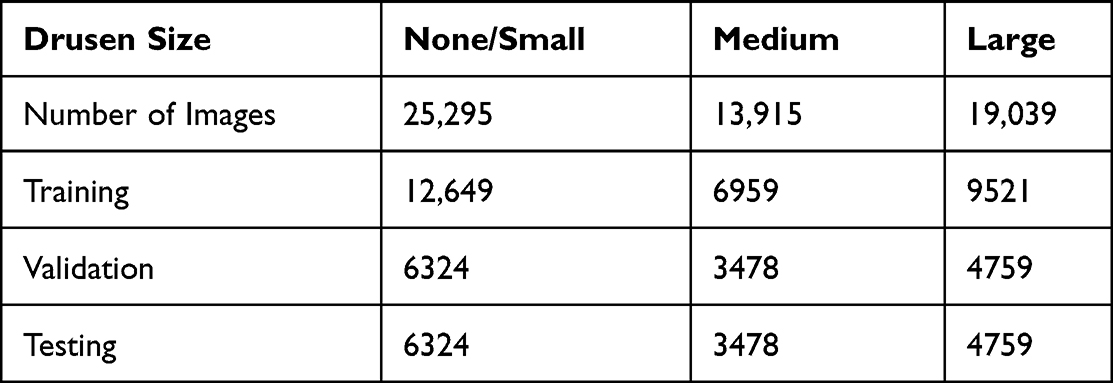 |
Table 2 The Drusen Categories in the Dataset Used in This Study, and Training, Validation and Test Dataset Splits for Each Neural Network Category |
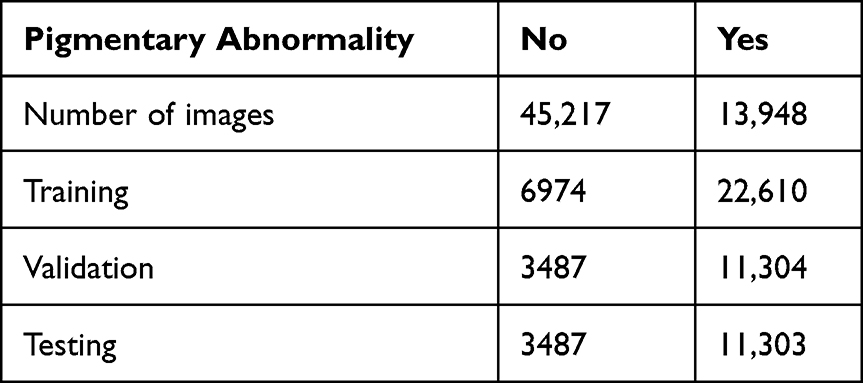 |
Table 3 The Pigmentary Abnormalities in the Dataset Used in This Study, and Training, Validation and Test Dataset Splits for Each Neural Network Category |
Image Preprocessing
The AREDS 1 dataset has JPG, DNG and TIFF formats available for all of the images. All the JPG images were pre-processed before feeding into the neural network training. First, the blank backgrounds on both sides of the fundus were cropped so that the fundus on each image fitted into a rectangular box. Then, the cropped images were resized into a standard 800*800 resolution. Finally, the cropped and resized images were further processed by applying the Gaussian blur algorithm (alpha=4, beta=−4, gamma=128 and scale ratio=10) in order to reduce the image noise and enhance the lesion patterns24 (Supplementary Figure 1).
Training Details
In this study, the following two sets of hyperparameters were utilized for training neural networks. A mini-batch size of 16 and neural network input image size 800*800*3, and a mini-batch size of 32 and neural network input image size 600*600*3. As the aim of this study was to use a classification neural network to automatically diagnose macular degeneration, the sparse categorical cross-entropy algorithm was applied to calculate training loss. The Adam optimization algorithm was utilized to conduct a loss function gradient descent at a learning rate of 0.001. A global average pooling layer was added to the EfficientNetB0 neural network followed by a 0.3 dropout rate. Finally, a fully connected SoftMax dense layer was added corresponding to the task classes. A NVIDIA QUADRO RTX 8000 with 48 GB of high-speed GDDR6 memory was utilized for training. EfficientNetB0 deep learning neural network architecture was used for optimizing the hardware efficiency. Gaussian blur was used for image feature enhancement, as explained above. Class weights were applied to cope with class imbalance.
Neural Network Architecture
We tested a number of neural network designs (including InceptionRestNetV2, EfficientNet B0-B4, ResNet, etc) and chose the EfficientNetB0 architecture for optimizing the hardware efficiency.25 This architecture was further modified to have input size images as either 600*600 or 800*800 pixel size. The dataset (Figure 1) was then split into 50%/25%/25% ratios for training, validation and test purposes. It was ensured that the patient-level data were used only for training, validation or testing, to ensure that there could be no patient-level data leakage between training, validation or testing subgroups. A series of data augmentation process were applied to the images during the neural network training, including but not limited to 5% width and height shift range, 20% shear transform range, 360 degrees rotation range, 10% zoom in and out range, horizontal and vertical flip and most importantly, to address image lightness issues, a 0–1.5 brightness scaling range. We also investigated various high-level neural networks designs, whereby different networks were trained, each focused on a different single aspect or their combinations of the Simplified Severity Scale risk elements. These neural networks were then interconnected in different combinations to yield the best results as defined by overall accuracy, sensitivity and specificity compared to Peng et al.19
Overall Model Architecture
Those images deemed to be of good quality were used to train three individual disease state neural networks: 1) an Advanced AMD classifier, 2) a Drusen size classifier and 3) a pigmentary abnormalities classifier (see below for details). An important component of the current study was to determine the optimal arrangement of these three component classifiers that would most accurately reproduce the 5-step Simplified Severity Scale, so in addition to building a model that utilized the three component classifiers reading any given image simultaneously, we also created a number of models that utilized more complex interconnecting component classifiers. The best outcome was achieved using a “cascading” neural network hierarchy, where individual neural networks, each focused on one component of the AREDS clinical variable labels, feed data into each other. The architecture of cascading CNNs is shown in Figure 2. In the first pass, the image was interrogated by the Advanced AMD classifier and if the image was identified as having features of aAMD; either geographic atrophy or neovascularization, no further analysis was performed. If aAMD was not detected the image was then passed through to the Drusen Size and Pigmentary Abnormality classifiers. We further identified that the drusen size network had difficulty differentiating between none/small and medium drusen (see results). With reference to the AREDS 5-step Simplified Severity Scale (AREDS 18)6 the finding of medium drusen is only relevant if large drusen are not detected in either eye. To determine drusen size, all images were therefore first passed through a binary CNN which classified images as either “non-large v large drusen”. Images were only then passed to a second binary “none\small v medium drusen” classifier if no large drusen were detected. The results generated by the three disease classifiers were then used to calculate an individual’s score on the 5-step severity scale as illustrated in Supplementary Figure 2.
 |
Figure 2 The “cascading” architecture, where the patient-level image set is split into left and right eye images. These images then progress through an aAMD detection neural network and if negative, through the Drusen Size and Pigmentary Abnormality detection neural networks. The Simplified Severity Score is then calculated depending on the image-level results, which is then aggregated back to the patient-level. |
Labeling Nomenclature Used to Train the Individual Disease Classifier CNNs
The Advanced AMD neural network was designed to analyze the F2 (macular centred) images producing a binary (yes: aAMD present/no aAMD not present) outcome. The aAMD neural network was trained using the following pre-assigned AREDS variables:
- (SSR/HEMORRHAGIC RD FIELD 2 Left/Right Eye) LESSRF2 & RESSRF2 labels were used where grade 0 was used to label negative and grade 2 was used to label positive.
- (HARD EXUDATE FIELD 2 Left/Right Eye) LEHDEXF2 & REHDEXF2, labels were used where grade 0 was used to label negative and grade 2 was used to label positive.
- (SUBRETINAL/SUBRPE HEMORRHAGE FIELD 2 Left/Right EYE) LESUBHF2 & RESUBHF2 labels were used where grade 0 was used to label negative and grade 2 was used to label positive.
- (SUBRETINAL FIBROSIS FIELD 2 Left/Right EYE), LESUBFF2 & RESUBFF2 labels were used where grade 0 was used to label negative and grade 2 was used to label positive.
- (GEOGRAPHIC ATROPHY CENTER POINT Left/Right EYE) For Advanced AMD (Geographic Atrophy), LEGEOACT & REGEOACT labels were used where grade 0 was used to label negative and grade 2 was used to label positive.
- (GEOGRAPHIC ATROPHY AREA C/SUB Left/Right) EYE LEGEOACS & REGEOACS labels were used where grade 0 was used to label negative and grades 2–4 were used to label positive.
- (GEOGRAPHIC ATROPHY W/I GRID Left/Right EYE) LEGEOAWI & REGEOAWI labels were used where grade 0 was used to label negative and grades 2–7 were used to label positive.
The “Drusen Size” neural network was designed to analyse the F2 (macular centred) images producing a 3-class outcome: none\small drusen, medium drusen and large drusen >125 present. If two or more images belong to the same eye from the same patient visit, the eye-level prediction was aggregated by the maximum method described above. The Drusen Size neural network was trained using the following pre-assigned AREDS variables:
- (MAXIMUM DRUSEN SIZE W/I GRID Left Eye/Right EYE) LEDRSZWI & REDRSZWI, where grades 0 and 2 were used to identify none/small drusen; grade 3 was used to identify medium drusen; grades 4 and 5 were used to identify large drusen.
- (DRUSENOID PED FIELD 2 Left/Right EYE) LEDRUSF2 & REDRUSF2, where variable grade 2 was used to identify large drusen.
The Pigmentary Abnormality (PA) neural network was designed to analyze the F2 (macular centered) images producing a binary (yes: PA present/no PA not present). The PA neural network was trained using the following pre-assigned AREDS Clinical variables:
- (INCREASED PIGMENT AREA W/I GRID Left/Right EYE) LEINCPWI & REINCPWI, where variable grade 0 was used to label negative; variable grades 2–6 were used to label positive.
- (RPE DEPIGMENTATION AREA W/I GRID Left/Right EYE) LERPEDWI & RERPEDWI, where variable grade 0 was used to label negative, while variable grades 2–7 were used to label positive.
Assessing the Individual Neural Networks and Overall Model Performance
The image level results for the component neural networks aAMD, Drusen size and Pigmentary abnormalities are presented as t-distributed stochastic neighbor embedding (t-SNE) plots. To facilitate an assessment of the overall model to accurately predict an individual score on the 5-step Simplified Severity Scale we first had to calculate the score issued to each patient whose images were used in this study. Based on the data provided by AREDS each eye of every patient can be issued with disease labels based on the presence or otherwise of advanced AMD, drusen size or pigmentary abnormalities. Having identified these labels, the score issued by the 5-step Simplified Severity Score was calculated for each patient at every visit. These scores served as the ground truth against which the overall model was assessed. As the AREDS dataset comprises multiple images per eye, the worst outcome per image was used to generate the eye level results. For example, if any image was predicted positive for aAMD, the eye was labelled positive for aAMD. The eye-level results were then aggregated to produce the patient-level data and the AREDS 5-step Simplified Severity Score.
The patient-level outputs from the component neural networks, and the overall performance of the neural network to predict an individual’s AREDS 5-step Simplified Severity Score was assessed using the traditional metrics accuracy, specificity, sensitivity, Cohen’s kappa statistic, and receiver operating characteristic curve analysis (with reference to the Reading Center grades issued by AREDS as the gold standard) as appropriate. The kappa values <0 indicate no agreement, and 0–0.20 indicate slight, 0.21–0.40 fair, 0.41–0.60 moderate, 0.61–0.80 as substantial, and 0.81–1 almost perfect agreement.26 Unweighted kappa was used to assess binary classification neural networks, and the quadratic weighted kappa was used to assess multi-class classification neural networks.
Results
Our iterative design and optimization process revealed that a “cascading neural network”, comprising a series of EfficientNet B0 neural networks (Figure 2), combined with an optimized hyperparameter set, yielded the most accurate results. The performance of the sequential cascading neural network model that we finally settled on was superior to the simultaneous 3-class neural network model utilised by Peng et al19 (AUC 0.993 v 0.988 both architectures tested with images 800*800). Having settled on the appropriate architecture for the overall model and in order to assess the impact image size had on the models’ overall performance, the results generated from a 600*600 image input size and an 800*800 image size are reported.
Image-Level Performance of the Individual Component Neural Networks
The t-distributed stochastic neighbor embedding (t-SNE) algorithm is a dimensionality reduction algorithm that converts high-dimensional data into low-dimensional data. It is commonly used to visualize high-dimensional data in two-dimensional plots. As mentioned earlier, after feeding a fundus input image into the deep learning neural network, the neural network outputs a multi-dimensional vector for final classification. In this experiment, all the fundus images in the testing set were converted into 1280-dimensional feature vectors. These 1280-dimensional feature vectors were then reduced into 2-dimension (Figures 3). Each dot in the t-SNE plot represents a fundus image. Depending on the on the ground-truth labels, these dots are plotted in a different color and as a result the figures thus generated are a good visualization of the trained neural network’s performance. The figures presented represent the results generated by using images 800*800.
 |
Figure 3 Scatter plot illustrating the performance of the Drusen Size neural network. |
In the Drusen Size neural network, there are three classes: none/small drusen, medium-sized drusen and large drusen. It is observed that there is clear boundary distinguishing none/small drusen (blue dots) from large drusen (green dots) (Figure 3). This shows that the trained neural network is comfortably able to distinguish between none/small drusen and large drusen. However, the boundaries between none/small drusen and medium drusen and large drusen and medium-sized drusen (red dots) are less distinct. As the result, it is expected that there will be false negatives and positives in identifying medium-sized drusen. Furthermore, as large drusen (green dots) overlap more with medium-sized drusen than none/small drusen it indicates that the trained neural networks are better able to distinguish between medium-sized and large drusen than none/small drusen and medium-sized drusen.
For both Pigmentary Abnormality and Advanced AMD neural networks, the clustering of both classes is reasonably well separated indicating that the trained neural networks can distinguish comfortably between the relevant classes (Figures 4 and 5). This finding agrees with the results from the confusion matrix Tables 4–9.
 |
Table 4 Patient-Level Performance of the Advanced AMD Neural Networks for the 600*600 Image Size |
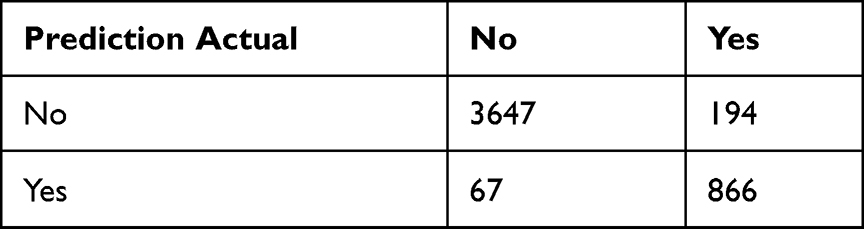 |
Table 5 Patient-Level Performance of the Advanced AMD Neural Networks for the 800*800 Image Size |
 |
Table 6 Patient-Level Performance of the Drusen Size Neural Networks for the 600*600 Image Size |
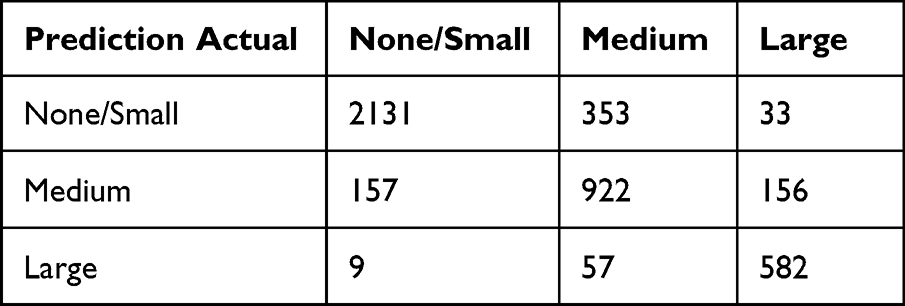 |
Table 7 Patient-Level Performance of the Drusen Size Neural Networks for the 800*800 Image Size |
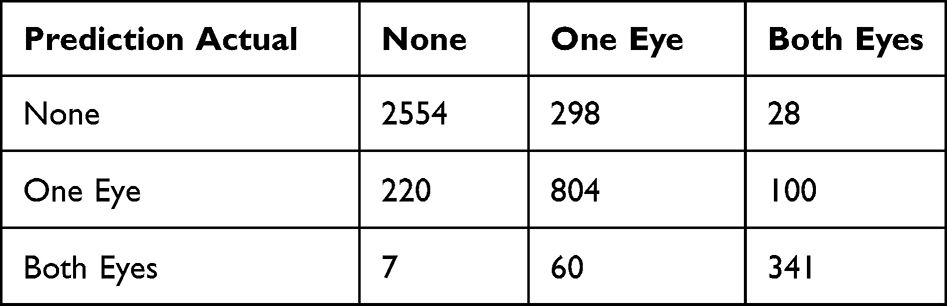 |
Table 8 Patient-Level Performance of the Pigmentary Abnormality Neural Networks for the 600*600 Image Size |
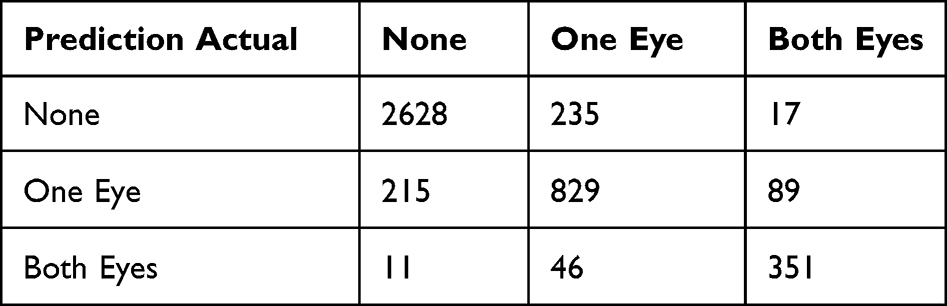 |
Table 9 Patient-Level Performance of the Pigmentary Abnormality Neural Networks for the 800*800 Image Size |
 |
Figure 4 Scatter plot illustrating the performance of the Pigmentary Abnormality neural network. |
 |
Figure 5 Scatter plot illustrating the performance of the Advanced AMD neural network. |
Patient-Level Performance of the Individual Component Neural Networks
“Advanced AMD” Neural Network Results
At the patient level, the Advanced AMD neural network yielded 93.74% accuracy – 92.39% sensitivity- 94.07% specificity – 0.813 kappa (95% CI: 0.792–0.833) and 94.53% accuracy – 92.82% sensitivity – 94.95% specificity – 0.835 kappa (95% CI: 0.815–0.854) for 600*600 and 800*800 image input size, respectively (Tables 5 and 6). At the patient level, the neural network achieved an AUC of 0.973 when 600*600 images were used. A modest improvement to 0.975 was achieved when 800*800 images were used (Figure 6).
 |
Figure 6 Area under the receiver operating curve for the advanced AMD neural network. |
“Drusen Size” Neural Network Results
At the patient level, the Drusen Size neural network yielded 81.59% accuracy – 0.810 quadratic weighted kappa (95% CI: 0.793–0.827) and 82.6% accuracy – 0.820 quadratic weighted kappa (95% CI: 0.803–0.837) for the 600*600 and 800*800 input image sizes, respectively (Tables 7 and 8).
“Pigmentary Abnormality” Neural Network Results
At the patient level, the Pigmentary Abnormality neural network yielded 83.84% accuracy –0.793 quadratic weighted kappa (95% CI: 0.771–0.815) – and 86.33% accuracy – 0.823 quadratic weighted kappa (95% CI: 0.803–0.844), for the 600*600 and 800*800 input image sizes, respectively (Tables 9 and 10).
 |
Table 10 Patient-Level 5-Class Risk Score Prediction vs Calculated, for Image Input Size of 600*600 |
Patient-Level Simplified Severity Scale Results
The AREDS Simplified Severity Scale has five risk score levels (0–4), each of which is associated with a calculated risk of the individual’s macular degeneration progression. This score is based on the presence and size of any drusen and whether there are characteristic pigmentary abnormalities in the fundus images. The extent to which these features are present determines both the eye-level and patient-level risk score. Here, we have used the outcome of our Drusen Size and Pigmentary Abnormality neural networks from each image, which were then aggregated to patient-level, to calculate the equivalent Simplified Severity risk score as the basis for the assessment of the accuracy of our platform. Using the 600*600 images, the 5-class accuracy level was found to be 78.49% (Table 11). Quadratic weighted kappa value 0.854 (95% CI: 0.842–0.865). Using the 800*800 images, the 5-class accuracy level was found to be 80.43% (Table 11). The quadratic weighted kappa value was 0.870 (95% CI: 0.861–0.880). The overall neural networks achieved an AUC of 0.991 and 0.993 using image sizes of 600*600 and 800*800, respectively (Figure 7).
 |
Table 11 Patient-Level 5-Class Risk Score Prediction vs Calculated, for Image Input Size of 800*800 |
 |
Figure 7 Area under the receiver operating curve for the patient-level performance of the cascading neural network in predicting the 5-Step Simplified Severity Score using 600*600 and 800*800 images. |
To assess the utility of our neural network as a community screening tool, the Simplified Severity risk score was further contracted to a binary, 2-class classification: of low risk (Simplified Severity risk scores 0–2) and high risk (Simplified Severity risk score 3–4). Using this very simplified reclassification, the Cascading neural network achieved an accuracy of 98.03% and a sensitivity of 85.44% and a specificity of 98.66% and a negative predictive value of 99.27% when automating the production of the AREDS simplified scale from retinal images sized 600*600; kappa value 0.795 (95% CI 0.760–0.829) (Table 12). If images of 800*800 were used the respective figures were 98.08%, 86.09%, 98.66% and 99.32% (Table 12). The kappa value was 0.796 (95% CI 0.761–0.831) (Table 13).
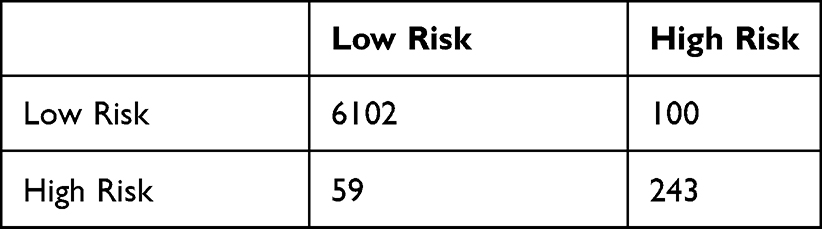 |
Table 12 Patient-Level Binary Risk Score Prediction vs Calculated, for Image Input Size of 600*600 |
 |
Table 13 Patient-Level Binary Risk Score Prediction vs Calculated, for Image Input Size of 800*800 |
Discussion
The AREDS 5-step Simplified Severity Scale was developed to provide clinically useful risk categories for the development of advanced AMD in persons with earlier stages of AMD.6 It results in a scoring system that assigns 1 point for the presence of one or more large (≥125 µm) drusen, 1 point for the presence of any retinal pigment abnormalities in an eye, and 1 point for bilateral medium drusen if there are no large drusen in either eye. Risk factors are summed across both eyes, forming a 5-step scale (steps 0–4) for which the 5-year risk of developing advanced AMD in at least 1 eye is derived. The 5-step Simplified Severity Scale has since been validated by comparing the projected risk against real-world data derived from the Blue Mountains Eye Study with a high degree of concordance between the predicted and expected 5- and 10-year incident rates of late AMD being reported.27 We used a novel CNN approach to automate the classification of the images in the AREDS dataset with a view to identifying the three principal components of the Simplified Severity score: advanced AMD, large drusen and pigmentary abnormalities with the aim of then being able to automate the risk of an individual’s disease progressing using the AREDS 5-step Simplified Severity Scale Scores. At the patient level, our classifier achieved a 5-class accuracy of 78.49% and 80.43%, and a quadratic kappa of 0.854 and 0.870 for the 600*600 images and 800*800 images, respectively. If the 5-class-AREDS Simplified scale is further reduced to a binary low risk/high risk outcome, the accuracy of our combined neural networks was 98% with a sensitivity of ≥85% and a specificity ≥99% for both the 600*600 and the 800*800 images. The improvement in neural network performance with image size is in keeping with published data. Whilst increasing image size leads to significant efficacy gains between 200*200 and 500*500 pixels sizes, these gains quickly plateau when larger sized images (800*800 to 2000*2000) are used.28,29
A limited number of other groups have used the AREDS dataset to build neural networks designed to automate grading of the clinical features of AMD. Of these, Peng et al19 is the only other group who choose to train an algorithm to automatically reproduce the AREDS Simplified Severity Scale scores for each participant in the testing dataset by training different neural networks to automate the grading of Advanced AMD, Drusen Size and Pigmentary Abnormality classifiers from retinal photographs. The accuracy of DeepSeeNet’s individual neural networks (ie, Advanced AMD, Drusen and Pigmentary classifiers) were 96%, 74% and 89%, respectively. Whilst these figures appear similar to those reported in the current study, methodological differences mean that direct comparison at the level of the component neural networks is problematic. Firstly, Peng et al19 used lower resolution images (228*228). However, as many of the subtle lesions of pigmentary abnormalities and small/medium drusen may be missed in lower quality images, we elected to use images of higher resolution (600*600 and 800*800). As a result the images used to train and test the CNNs produced in the current manuscript and those presented by Peng et al19 are different. Secondly, the architecture of the CNN developed by Peng et al19 differs significantly to that implemented in the current study. Peng et al19 utilized a 3-class deep learning model which simultaneously classified images into one 3 types of drusen: none/small drusen, medium drusen and large drusen before combining the results to generate the 5-step simplified score. Both DeepSeeNet and the model we developed had difficulty differentiating between none/small and medium drusen. From a clinical perspective, and with reference to the 5-step Simplified Severity Scale, the finding of medium drusen is only relevant if large drusen are not detected in either eye. We therefore built a model which utilized a novel sequential “cascading” architecture. The finding that the performance of the sequential cascading model was superior to the simultaneous 3-class deep learning model utilised by Peng et al19 when both architectures were tested using images 800*800 (AUC 0.993 v 0.988) (Figure 7) vindicates our approach. Consequently, a more appropriate comparison of the performance of DeepSeeNet and the current study would be to compare the overall outcome of their best performing neural network at predicting the patient-level AREDS 5-step Simplified Severity Scale scores against those produced by our neural network. In this analysis Fine-tuned DeepSeeNet, achieved an accuracy of 0.671; kappa 0.558,19 while the accuracy of our best performing neural network was 0.804; kappa 0.679 (Table 10). The improved performance of our neural network could in part be explained by the fact that higher resolution images were used in the training and validation processes of our neural networks (600*600 and 800*800 vs 224*224 used by DeepSeeNet). However, as image resolution itself is only modestly related to the neural network’s performance, it is likely that other factors such the novel cascading neural network design, and the highly optimized hyperspace parameter set would also contribute to the superior performance of our neural network. It is noteworthy that both classifiers described here performed significantly better than the retinal specialists who achieved an accuracy of just 0.60.19
Two other groups have used the AREDS datasets to build automated algorithms designed to grade disease from retinal images. Grassmann et al used the AREDS dataset to build an automated algorithm designed to classify retinal images into 1 of the 13 classes.16 Using images of 512*512 resolution and an image preprocessing step designed to normalize the color balance and local illumination of each fundus image, six pre-assembled neural networks, each with differing architectures, were tested. Finally, using the predicted class probabilities of these six neural networks, a random forest ensemble was trained. The neural networks achieved overall an average balanced accuracy over all classes, of between 0.703 and 0.742. The random forest ensemble achieved 0.747. Burlina et al similarly used the AREDS dataset to build an algorithm designed to evaluate the severity of AMD from fundus photographs using the AREDS detailed 9-step severity scale. They achieved an overall accuracy for the 5-year risk of just 59.1% with further analysis revealing that the algorithm had difficulty distinguishing patients with no AMD from early AMD and early AMD from intermediate AMD. When the 9-step detailed classification was simplified to a 4-step classification, the accuracy improved to 75.7%.30 The authors concluded that although algorithms to classify AMD from fundal images hold promise, they should be restricted to a smaller number of clinically important classes, ones relevant to detecting individuals who would benefit from intervention or community screening for high-risk individuals. While there is a plethora of other studies that have trained neural networks to detect macular degeneration, many used small datasets, or lack a transparent ground truth and thus are very unlikely to generalise.31
Our approach was to design a novel algorithm with a restricted number of classes that could accurately replicate the AREDS 5-step Simplified Severity Scale with the aim of developing a tool that would facilitate automated mass community screening of older asymptomatic individuals to determine who would benefit from AREDS2 supplements. The major limitation of our neural network is that all the neural networks were trained solely on high-quality images derived from the AREDS 1 datasets. The images within the AREDS 1 dataset have some unique quality characteristics, including but not limited to image blur, lens and central macular projection artifacts. While our neural network achieved satisfactory performance in the internal test set, it is conceivable that the neural networks may fail to generalize if presented with a different set of images. Finally, the AREDS 1 dataset is not representative of all ethnicities and socioeconomic groups, and this will contribute to the bias of any neural network generated as a result. The networks created in this study should therefore be re-trained (using transfer learning) with data derived from other more inclusive datasets and then robustly tested in a prospective clinical trial using “real-world” non-AREDS retinal images, to be assured of the generalizability of the CNN we have developed.
Conclusion
We have created individual neural networks, trained on macular centered images from the AREDS 1 dataset, that are capable of accurately grading discrete clinical features of AMD from macular centered fundal images. When arranged in a cascading ensemble, the grades issued by these individual networks allowed us to accurately calculate the AREDS 5-step Simplified Severity Scale score for AMD for any given individual. If the results presented were replicated, then the ensemble of neural networks we have developed could be used as a screening tool that has the potential to significantly improve health outcomes by identifying asymptomatic individuals who would benefit from AREDS2 macular supplements.
Disclosure
Dr David Squirrell is a Co-founder and Medical Director of Toku Eyes. Ehsan Vaghefi is a Co-founder CEO of Toku Eyes. Li Xie, Song Yang and David Han are affiliated with Toku Eyes. The authors report no other conflicts of interest in this work.
References
1. Klein R, Klein BE, Linton KL. Prevalence of age-related maculopathy: the Beaver Dam Eye Study. Ophthalmology. 1992;99(6):933–943. doi:10.1016/S0161-6420(92)31871-8
2. Klein R, Cruickshanks KJ, Nash SD, et al. The prevalence of age-related macular degeneration and associated risk factors. Arch Ophthalmol. 2010;128(6):750–758. doi:10.1001/archophthalmol.2010.92
3. Klein ML, Ferris III FL, Armstrong J, et al. Retinal precursors and the development of geographic atrophy in age-related macular degeneration. Ophthalmology. 2008;115(6):1026–1031. doi:10.1016/j.ophtha.2007.08.030
4. Wang JJ, Rochtchina E, Lee AJ, et al. Ten-year incidence and progression of age-related maculopathy: the blue Mountains Eye Study. Ophthalmology. 2007;114(1):92–98. doi:10.1016/j.ophtha.2006.07.017
5. Klein R, Klein BE, Knudtson MD, Meuer SM, Swift M, Gangnon RE. Fifteen-year cumulative incidence of age-related macular degeneration: the Beaver Dam Eye Study. Ophthalmology. 2007;114(2):253–262. doi:10.1016/j.ophtha.2006.10.040
6. Ferris FL, Davis MD, Clemons TE, et al. A simplified severity scale for age-related macular degeneration: AREDS Report No. 18. Arch Ophthalmol. 2005;123(11):1570–1574.
7. Chew EY. Age-related macular degeneration: nutrition, genes and deep learning-the LXXVI Edward Jackson memorial lecture. Am J Ophthalmol. 2020;217:335–347. doi:10.1016/j.ajo.2020.05.042
8. Abràmoff MD, Lou Y, Erginay A, et al. Improved automated detection of diabetic retinopathy on a publicly available dataset through integration of deep learning. Invest Ophthalmol Vis Sci. 2016;57(13):5200–5206. doi:10.1167/iovs.16-19964
9. Asaoka R, Murata H, Iwase A, Araie M. Detecting preperimetric glaucoma with standard automated perimetry using a deep learning classifier. Ophthalmology. 2016;123(9):1974–1980. doi:10.1016/j.ophtha.2016.05.029
10. Gao X, Lin S, Wong TY. Automatic feature learning to grade nuclear cataracts based on deep learning. IEEE Trans Biomed Eng. 2015;62(11):2693–2701. doi:10.1109/TBME.2015.2444389
11. Thee EF, Meester-Smoor MA, Luttikhuizen DT, et al. Performance of classification systems for age-related macular degeneration in the Rotterdam study. Transl Vis Sci Technol. 2020;9(2):26. doi:10.1167/tvst.9.2.26
12. van Grinsven MJ, Lechanteur YT, van de Ven JP, et al. Automatic drusen quantification and risk assessment of age-related macular degeneration on color fundus images. Invest Ophthalmol Vis Sci. 2013;54(4):3019–3027. doi:10.1167/iovs.12-11449
13. Chen Q, Leng T, Zheng L, et al. Automated drusen segmentation and quantification in SD-OCT images. Med Image Anal. 2013;17(8):1058–1072. doi:10.1016/j.media.2013.06.003
14. Sivagnanavel V, Smith R, Lau G, Chan J, Donaldson C, Chong N. An interinstitutional comparative study and validation of computer aided drusen quantification. Br J Ophthalmol. 2005;89(5):554–557. doi:10.1136/bjo.2004.046813
15. Schmitz-Valckenberg S, Brinkmann CK, Alten F, et al. Semiautomated image processing method for identification and quantification of geographic atrophy in age-related macular degeneration. Invest Ophthalmol Vis Sci. 2011;52(10):7640–7646. doi:10.1167/iovs.11-7457
16. Grassmann F, Mengelkamp J, Brandl C, et al. A deep learning algorithm for prediction of age-related eye disease study severity scale for age-related macular degeneration from color fundus photography. Ophthalmology. 2018;125(9):1410–1420. doi:10.1016/j.ophtha.2018.02.037
17. Ajana S, Cougnard-Grégoire A, Colijn JM, et al. Predicting progression to advanced age-related macular degeneration from clinical, genetic, and lifestyle factors using machine learning. Ophthalmology. 2021;128(4):587–597. doi:10.1016/j.ophtha.2020.08.031
18. Peng Y, Keenan TD, Chen Q, et al. Predicting risk of late age-related macular degeneration using deep learning. NPJ Digital Med. 2020;3(1):1–10. doi:10.1038/s41746-020-00317-z
19. Peng Y, Dharssi S, Chen Q, et al. DeepSeeNet: a deep learning model for automated classification of patient-based age-related macular degeneration severity from color fundus photographs. Ophthalmology. 2019;126(4):565–575. doi:10.1016/j.ophtha.2018.11.015
20. Xie L, Yang S, Squirrell D, Vaghefi E. Towards implementation of AI in New Zealand national diabetic screening program: cloud-based, robust, and bespoke. PLoS One. 2020;15(4):e0225015. doi:10.1371/journal.pone.0225015
21. Vaghefi E, Yang S, Hill S, Humphrey G, Walker N, Squirrell D. Detection of smoking status from retinal images; a Convolutional Neural Network study. Sci Rep. 2019;9(1):1–9. doi:10.1038/s41598-019-43670-0
22. Vaghefi E, Yang S, Xie L, Han D, Squirrell D. A multi-center prospective evaluation of THEIA to detect diabetic retinopathy (DR) and diabetic macular edema (DME) in the New Zealand screening program; 2021.
23. Group A-REDSR. The age-related eye disease study (AREDS): design implications AREDS report no. 1. Control Clin Trials. 1999;20(6):573. doi:10.1016/S0197-2456(99)00031-8
24. Graham B. Kaggle Diabetic Retinopathy Detection Competition Report. University of Warwick; 2015.
25. Tan M, Le Q. Efficientnet: rethinking model scaling for convolutional neural networks. PMLR. 2019;2019:6105–6114.
26. Landis J, Koch G. The measurement of observer agreement for categorical data. Biometrics 33, 159–174 (1977). Sci Rep. 2021;11:10459. doi:10.1038/s41598-021-90065-1
27. Liew G, Joachim N, Mitchell P, Burlutsky G, Wang JJ. Validating the AREDS simplified severity scale of age-related macular degeneration with 5-and 10-year incident data in a population-based sample. Ophthalmology. 2016;123(9):1874–1878. doi:10.1016/j.ophtha.2016.05.043
28. Sahlsten J, Jaskari J, Kivinen J, et al. Deep learning fundus image analysis for diabetic retinopathy and macular edema grading. Sci Rep. 2019;9(1):1–11. doi:10.1038/s41598-019-47181-w
29. Phan S, Satoh S, Yoda Y, Kashiwagi K, Oshika T. Evaluation of deep convolutional neural networks for glaucoma detection. Jpn J Ophthalmol. 2019;63(3):276–283. doi:10.1007/s10384-019-00659-6
30. Burlina PM, Joshi N, Pacheco KD, Freund DE, Kong J, Bressler NM. Use of deep learning for detailed severity characterization and estimation of 5-year risk among patients with age-related macular degeneration. JAMA Ophthalmol. 2018;136(12):1359–1366. doi:10.1001/jamaophthalmol.2018.4118
31. Cheung R, Chun J, Sheidow T, Motolko M, Malvankar-Mehta MS. Diagnostic accuracy of current machine learning classifiers for age-related macular degeneration: a systematic review and meta-analysis. Eye. 2021;2021:1–11.
 © 2023 The Author(s). This work is published and licensed by Dove Medical Press Limited. The
full terms of this license are available at https://www.dovepress.com/terms
and incorporate the Creative Commons Attribution
- Non Commercial (unported, 3.0) License.
By accessing the work you hereby accept the Terms. Non-commercial uses of the work are permitted
without any further permission from Dove Medical Press Limited, provided the work is properly
attributed. For permission for commercial use of this work, please see paragraphs 4.2 and 5 of our Terms.
© 2023 The Author(s). This work is published and licensed by Dove Medical Press Limited. The
full terms of this license are available at https://www.dovepress.com/terms
and incorporate the Creative Commons Attribution
- Non Commercial (unported, 3.0) License.
By accessing the work you hereby accept the Terms. Non-commercial uses of the work are permitted
without any further permission from Dove Medical Press Limited, provided the work is properly
attributed. For permission for commercial use of this work, please see paragraphs 4.2 and 5 of our Terms.