Back to Journals » Neuropsychiatric Disease and Treatment » Volume 14
Automatic epilepsy detection using fractal dimensions segmentation and GP–SVM classification
Authors Jirka J, Prauzek M ![]() , Krejcar O
, Krejcar O ![]() , Kuca K
, Kuca K ![]()
Received 10 March 2018
Accepted for publication 6 July 2018
Published 21 September 2018 Volume 2018:14 Pages 2439—2449
DOI https://doi.org/10.2147/NDT.S167841
Checked for plagiarism Yes
Review by Single anonymous peer review
Peer reviewer comments 2
Editor who approved publication: Dr Roger Pinder
Jakub Jirka,1 Michal Prauzek,1 Ondrej Krejcar,2 Kamil Kuca2,3
1Department of Cybernetics and Biomedical Engineering, Faculty of Electrical Engineering and Computer Science, VSB – Technical University of Ostrava, Ostrava Poruba, Czech Republic; 2Center for Basic and Applied Research, Faculty of Informatics and Management, University of Hradec Kralove, Hradec Kralove, Czech Republic; 3Biomedical Research Center, University Hospital Hradec Kralove, Hradec Kralove, Czech Republic
Objective: The most important part of signal processing for classification is feature extraction as a mapping from original input electroencephalographic (EEG) data space to new features space with the biggest class separability value. Features are not only the most important, but also the most difficult task from the classification process as they define input data and classification quality. An ideal set of features would make the classification problem trivial. This article presents novel methods of feature extraction processing and automatic epilepsy seizure classification combining machine learning methods with genetic evolution algorithms.
Methods: Classification is performed on EEG data that represent electric brain activity. At first, the signal is preprocessed with digital filtration and adaptive segmentation using fractal dimensions as the only segmentation measure. In the next step, a novel method using genetic programming (GP) combined with support vector machine (SVM) confusion matrix as fitness function weight is used to extract feature vectors compressed into lower dimension space and classify the final result into ictal or interictal epochs.
Results: The final application of GP–SVM method improves the discriminatory performance of a classifier by reducing feature dimensionality at the same time. Members of the GP tree structure represent the features themselves and their number is automatically decided by the compression function introduced in this paper. This novel method improves the overall performance of the SVM classification by dramatically reducing the size of input feature vector.
Conclusion: According to results, the accuracy of this algorithm is very high and comparable, or even superior to other automatic detection algorithms. In combination with the great efficiency, this algorithm can be used in real-time epilepsy detection applications. From the results of the algorithm’s classification, we can observe high sensitivity, specificity results, except for the Generalized Tonic Clonic Seizure (GTCS). As the next step, the optimization of the compression stage and final SVM evaluation stage is in place. More data need to be obtained on GTCS to improve the overall classification score for GTCS.
Keywords: genetic programming, adaptive segmentation, SVM, fractal dimensions, EEG
Introduction
Epilepsy is a form of neurological disorder manifested by seizures, which are not linked to direct causes such as head injury or drug abuse. Epilepsy seizure is caused by a sudden electrical discharge in the brain, which may be a result of exogenous stimuli in case of reflex seizures or endogenous stimuli caused by chemical imbalance. About 1%–2% of the world population suffers from epilepsy.1 Also, 25%–30% of this group cannot be treated surgically or by drugs.2 These people suffer from so-called “refractory epilepsy”, and devices and methods for automatic epilepsy detection are of great importance to them and for their quality of life.3 The most severe consequence of the epilepsy disease is sudden unexpected death in epilepsy.3
Electroencephalography (EEG) signal processing for final ictal, interictal activity is divided into the following steps:
- Low pass signal filtration
- Adaptive segmentation based on fractal dimension
- Feature extraction and compression based on genetic programming (GP)–support vector machine (SVM) algorithm
- Final stage SVM classification.
The most important part of signal processing for classification is feature extraction. Feature extraction is mapping from original input EEG data space to new features space with the biggest class separability value. Separation problem cannot be properly solved unless provided with proper features and their relationship consideration. Scientists also came to agreement that features are not only most important but also a most difficult task from the classification process. An ideal set of features would make the classification problem trivial.
In this paper, we introduce a novel method for EEG signal classification based on the methods of GP in combination with SVM confusion matrix, as the GP fitness function weighs for the tree structure individual quality, which represents the feature itself. Number of features is determined automatically by the novel function for the best feature selection. This part of an algorithm covers feature extraction and compression with the best feature selection in one stage. Reduced feature vector dimensionality also improves the performance of final SVM classification. This novel method is tested and proven to be more successful and effective for automatic epilepsy detection than most of the currently presented methods.
Approximately 1/100 of people suffer from a seizure attack once in their lifetime. The occurrence of an epileptic seizure is unpredictable and its cause is understood very little. The EEG signal which is used to present and test this novel algorithm is a signal obtained from the number of (usually 128, 34, 32, 19, 14) electrodes placed on a scalp. This signal contains the sum of electric activity produced by millions of neurons. This signal contains not only a lot of valuable information but also great amount of noise and useless information. Detection of ictal activity is very important in diagnosis and therapy.4
Visual analysis of the long-term EEG recording by the neurologist is very time consuming, and development of an automatic epilepsy detection algorithm had been analyzed in a number of studies.
Materials and methods
Automated epilepsy detection
Since the beginning of automated epilepsy detection, this field had developed in two main directions:
- Interictal spike detection or epilepsy spike detection and
- Epileptic seizure analysis.
This paper presents method from the group of automated spike detection based on methods of GP combined with SVM confusion matrix.
GP
GP method was developed for finding the approximate or exact problem solution by Koza.5 GP method is based on an individual evolution in the population tree, where every individual represents certain solution to the problem. GP method looks for the best solution using Darwin’s evolution theory, where the original line of individuals (generation) is changed and selected by means of mutation, crossover, and natural selection.
Methods of GP were already used to improve k-nearest neighbors classification method performance, where a decision tree was declared for every feature, which was the function of the feature itself.6 Methods based on GP were also used in image processing to classify specific images.7 Another application found its place in the new feature vector extraction that improved the overall performance of the kNN classification method.8 GP-based methods were also used in optimal feature vector search that improved the classification algorithm efficiency.9
The method introduced in this article creates new synthetic set of features instead of searching for the best feature set as in the abovementioned articles.
Problem definition
The method introduced here is being developed as a part of the complex system for environmental reflex seizure stimuli localization using a series of sensor fusion and complex analysis methods. This complex system is a part of the dissertation thesis “Biometrical data processing and analysis – exogenous epilepsy seizure source localization and classification”.10,11 Main motivation of this thesis and its part described in this paper is to improve the quality of life of people suffering from seizures and initiate development in areas of automatic exogenous stimuli detection and localization which had been overlooked by both scientists and doctors, and current research state in this field is far beyond its current possibilities.
There is a clear link between environmental stimulants and reflex seizures as described by researchers, but there is also an expressed unsatisfactory state of current research in this area.12,13 The developed algorithm criteria were efficient in terms of low computational cost and high classification accuracy. All the above-described issues were important to improve the current research state in the area of automatic seizure detection in environmental stimuli localization application.
Current automatic seizure detection approaches are trading computational cost for high accuracy.14 Highly accurate methods come with high computational cost, and highly efficient methods used, for instance, in Brain Computer Interface come with results of lower accuracy.15 This study uses linear machine learning method, SVM, in combination with GP to introduce an efficient method with high classification accuracy in automatic epilepsy detection.
Details of specific signal preprocessing, basic feature set extraction, and implementation of this newly purposed GP–SVM algorithm are described in the “Automatic EEG signal segmentation using fractal dimension measure” and “Automatic epilepsy classification GP–SVM method” sections. Tests on sample of specifically selected 42 test subjects and final evaluation of this algorithm are described in the “Testing” and “Results and discussion” sections, respectively. The final conclusion and future work are described in the “Conclusion” and “Future work” sections, respectively.
Automatic EEG signal segmentation using fractal dimension measure
Before the EEG signal can be analyzed, it needs to be separated into time fragments called epochs. Because this algorithm is analyzing and searching for epileptic (ictal) activity, it is effective to use such measure for adaptive segmentation algorithm, which performs the best in separating ictal and interictal signal.
State of the art
The frequency and amplitude of EEG signal are highly variable. This is given by the nature of the biological signal source itself. The final EEG signal contains, besides useful information, lots of biological noise (electrocardiography [ECG], electromyography, electrooculography) and artificial environmental noise (electromagnetic disturbances). For further processing, it is necessary to separate the signal into time segments called epochs. There are two types of segmentations: constant with the constant time fragment length and adaptive with variable time fragment length changing according to the nature of the signal. Constant segmentation is not described any further as results of this old technique are not satisfactory.
Adaptive segmentation looks for transient states in the signal. Signal transition in the case of epileptic EEG data is transition from interictal to ictal state.
Adaptive segmentation algorithm was first presented in 1986 by Silin and Skrylev using two sliding Fast Fourier transform (FFT) windows. The algorithm was based on difference in the sliding window values. New segment is detected if the difference crosses a certain threshold. This basic method was not very effective, thanks to the non-stationary nature of the EEG signal. This algorithm was later on updated by Varri who used differences in signal amplitude summations in two sliding windows.15 This algorithm became the basic algorithm for all other adaptive segmentations. There is a whole series of adaptive segmentation algorithms, namely, linear prediction method, autocorrelation method, FFT, fuzzy c-means, and fractal dimensions. Linear prediction and autocorrelation methods do not support multichannel segmentation that is required. FFT and two-window method is not suitable for highly non-stationary epileptic signal, and fuzzy c-means method has a high computational cost. Adaptive segmentation based on fractal dimensions uses only this feature to separate the signal into segments and its calculation is fast and effective.
Fractal dimension is a statistical index of signal complexity given by signal detail change to size change.16 In EEG signal processing, the fractal dimension feature expresses signal’s non-stationary value.
Signal’s fractal dimension is calculated using Katz’s algorithm. When the fractal dimension value thus EEG signal complexity crosses a certain threshold (0.4) calculated from series of heuristically performed experiments the new signal segment is detected.17
The fractal dimension is calculated using Equation 1, where  L … is the total length of the curve calculated as an Euclidian distance between samples and d … is the curve diameter defined as the maximum distance of the first sample with any other signal sample
|
|

The adaptive segmentation value is then calculated according to Varri using the following equation:15
|
|

The illustrative result of adaptive segmentation algorithm on data recorded from a patient with Jeavons syndrome is presented in Figure 1. The epilepsy segment is correctly detected just before the fifth second of the signal. The segment for further calculations has a 5-second overlap from the previous signal.
 | Figure 1 Result of automatic segmentation using fractal dimension on occipital area electrode signal from a patient with Jeavons syndrome. |
Automatic epilepsy classification GP–SVM method
Automatic feature extraction and compression
This paper presents automatic feature extraction and compression by creating new synthetic features of smaller dimensionality. Initial set of basic feature vectors is created by discrete wavelet transformation (DWT). The classification process using GP–SVM techniques (see Figure 2) can be summed up in the following steps:
 | Figure 2 Schematic flow chart for set extraction and further processing (compression, classification using GP+SVM). |
- Basic feature set extraction using DWT.
- Synthetic feature set creation compressing original feature set and optimizing basic feature set.
- Final classification using new feature set and SVM method.
Basic feature set
The first step described in the “Automatic feature extraction and compression” section is the basic feature set extraction using DWT. This transformation is used due to the fact that the EEG signal has a non-stationary character. Discrete form of wavelet transform uses quadrature mirrored set of finite impulse response filters where the low-pass filter’s output represents input signal approximation and high-pass filter’s output represents input signal detail components.
Every decomposed signal using DWT represents specific time frequency spectrum. A set of six features is extracted for every such decomposed information. These features are selected from area of time, statistical analysis, and information theory to extract the most important characteristics of the EEG signal. These features are as follows:
- Signal average value, which is represented by the signal’s amplitude average value (Equation 3).

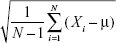
(3) - SD, which is the square root of the signal variance, where μ represents the mean value of a signal (Equation 4).
(4) - Signal energy represents the average value of the signal energy (Equation 5).

(5) - Signal curve length is also used in the fractal dimension-based segmentation and defines the length of the signal curve given by the sum of the horizontal line segments and is given by Equation 6.

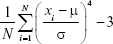
(6) - Signal curve skewness is used as a quantification indicator for signal asymmetry distribution and is given by Equation 7, where μ and σ are the mean value and deviation of a signal, respectively.
(7)
(8)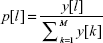
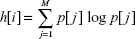
(9)
Synthetic feature extraction and compression
The second stage of the presented algorithm is using combined methods of GP and machine learning SVM method.
Every individual in a genetic tree represents a new set of features, which is created by nonlinear transformation of the previous individual. These new features are put into SVM classifier that expresses the features of individual quality via its error function ξ, which is a part of the confusion matrix expressing the quality of classification using 10-fold cross-validation testing.18
In standard GP-based methods, one individual in a genetic tree expresses one result and in the end of the tree evolution, only one feature vector (result) is obtained. In this paper, we present a method that includes the F function in every genetic population tree which expresses the new feature vector. The F function has only one argument and one output which is a copy of the function input. The output value of function F is taken as one of the final synthetic feature vectors. Number of feature vectors and, thus, the compression level is defined by the number of F functions.
An example of such an F function is given in Figure 3. This population tree is fed with an input of ten values x1 ... x10 and given two F functions (nodes) that form the new feature expressed as a combination of the population descendants. This algorithm uses the result of the F functions and not the result of the whole population tree evolution. The best descendant is given by the best basic arithmetic operation combination which is found by the maximum fitness value or minimum SVM error function value given by confusion matrix. Two new feature vectors will be created as shown in the picture: the first feature vector will be expressed as multiplication of input basic features x5x9 and the second feature vector will be expressed as summation of x3+x8.
 | Figure 3 Population tree of suggested algorithm with two F functions (nodes) that make up new flagged vectors that are expressed by the offspring. |
SVM confusion matrix and GP fitness function
Most important part of the algorithm is the population member fitness evaluation. The value of this function is given by the misclassification value of the SVM classifier given by the confusion matrix obtained by the 10-fold cross-validation. The process of the fitness function evaluation and best descendant search is shown in the block scheme in Figure 4.
 | Figure 4 GP–SVM block scheme. |
Classification process can be summed up into the following steps:
- Training input data are randomly separated into two groups: training (40%) and validation data (60%).
- Evaluation of the population tree, best member selection, and new features extraction.
- Trained SVM classifier classifies the validation data. Important value in this step is the value of the misclassified labels given by the confusion matrix. ξi = Nv − Ns, where Nv represents the total number of validation samples and Ns gives the number of correctly classified samples.
- Steps 1–4 are repeated for every population member in search for the ones with the maximum fitness function value (minimum ξi value).
Data
The final conclusion and performance comparison table was obtained by testing the algorithm on 42 subjects in clinical and home environment setup.
EEG data were collected using devices from Alien Technik and Emotiv Epoc headset.
The work was approved by the Ethics Committee of Hospital Ostrava-Poruba. For our purposes, anonymized neurology data were obtained from the hospital, therefore, informed consent was waived by the ethics committee. Dataset was collected from 42 patients (27 male, 15 female) in 27 months (Feb 2012–June 2014). The patients were aged 4–62 years (mean: 23.83, SD: 17.43, median: 21.5). The study group included 21 children under age 18. Thirty-two patients were referred from the hospital neurological clinic, eight from Trigon association, and two were referred from the GP. Thirty-six patients (85% of the group) were previously suffering from tonic–clonic episodes, of which 10 (24% of the group) were unwitnessed and not medically assessed and 26 patients (62% of the group) were medically diagnosed or EEG recordings were labeled to contain tonic–clonic seizure.
Clinical diagnosis
This section and Table 1 describe the clinical diagnosis of partial, generalized, and unclassified epilepsy types of patients. These data are based solely on the neurologist’s evaluation provided either by the patient himself or by the neurologist upon patient’s agreement. A total of 12 patients (29%) were classified with generalized epilepsy, 23 (54%) with partial epilepsy, and 7 patients (17%) were unclassified.
 | Table 1 Clinically diagnosed epilepsy types of patients |
Testing
This section presents the results of the classification algorithm described in previous sections. Data were obtained in children from the neurological department of university Hospital Ostrava-Poruba and clients of Trigon association that provides support for people with social disabilities.
The patient whose results are shown in this section was diagnosed with photosensitive epilepsy, more specifically Jeavons syndrome.19 Data from this patient were fully classified and described by the neurologist. EEG signal record was fully labeled by the neurologist as well. These data contained absence seizure, eyelid myoclonic seizures, tonic–clonic seizures, and myoclonic seizure.
Extraction of the basic feature vector
The basic features set is created by input signal decomposition using four-level DWT. Daubechies wavelet is used as the mother wavelet. Number of levels and type of mother wavelet were determined to be the best possible to discover most details and separate the EEG signal most appropriately according to its spectral composition.19 Wavelet filter bank frequency bands are specified for the sampling frequency of 128 Hz in Table 2.
 | Table 2 Frequency bands for four-level DWT decomposition |
Figure 5 shows the four-level wavelet decomposed signals for seizure-free signal. Figure 6 shows the EEG signal decomposition with myoclonic seizure.
 | Figure 5 Four-level DWT decomposition for interictal EEG. |
 | Figure 6 Four-level DWT decomposition for ictal EEG. |
Basic set of six features is calculated for every decomposed frequency sub-band according to features described in the “Basic feature set” section. Table 3 describes the input feature vector mapping with respect to decomposed sub-band and calculated feature.
 | Table 3 Basic set feature vector mapping |
Feature vector combination
Figure 7 shows results of SVM training phase defining hyperplane separating classified and non-classified samples using exponential radial basis function as defined in 10. Training samples of the population tree descendants combining the input features x9+x10 are clearly distinguishable from the population member genetically combining the input features x17+x18, and thus, these two members are suitable for the new features.
 | Figure 7 Training stage of population tree samples separation. Population tree descendants combining the input features x9+x10 are clearly distinguishable from the population member genetically combining the input features x17+x18. |
These two members were found using fitness function value obtained from the confusion matrix, which is the output of the SVM classifier expressing classification quality.
An example of such confusion matrix can be observed in Figure 8. Elements of this matrix are used to express the quality of the classifier output. Diagonal elements represent the number of points correctly classified (predicted label = target true label) and off-diagonal elements express mislabeled samples. The higher the diagonal values mean, the better is the result of the classifier.
 | Figure 8 Confusion matrix for dataset shown in Figure 7. |
Results and discussion
Algorithm described in the “Automatic epilepsy classification GP–SVM method” section was tested on the dataset obtained from 42 subjects with 1–3 tests on each subject measured primarily over the night. Origin of the dataset is closely described in the “Data” section.
Algorithm results were evaluated using the following:
- 10-fold cross validation technique X10.
- Statistical success rate evaluation of sensitivity XE (classification success<0; 1>), specificity XS (measure of the test ability to express the correct results – test quality), positive predictive value (PPV) – correctly detected events from all detected events, and negative predictive value (NPV) – falsely detected events from all detected events.
10-fold cross validation technique can be summarized into the following steps:
- Break data into ten sets of size n/10.
- Train on nine datasets and test on one.
- Repeat ten times and take the mean accuracy.
Table 4 summarizes the results of tests on a total of 77 EEG signal recordings using GP–SVM automatic epilepsy classification algorithm. Results are separated into groups defined by ictal and interictal class and seizure type labeled by the neurologist.
 | Table 4 Classification accuracy |
Basic feature set efficiency comparison with compressed feature set
The following test results display increased performance in epilepsy classification using basic feature set and compressed feature set with compression level 5 for a photosensitive patient. Table 5 displays the compressed basic vectors for occipital electrode O1. Table 6 presents results of the test comparing the performance results with PPV and NPV. A total of 356 events were recorded in the testing session.
 | Table 5 Compressed feature vector with compression level 5 |
 | Table 6 Compressed and basic feature vectors-based classification performance comparison |
Conclusion
This paper presents a novel method for automatic epilepsy detection using a combination of GP and SVM as a GP fitness function value and second stage stacking style classification for final ictal/interictal class. This novel method improves the overall performance of the SVM classification by dramatically reducing the size of input feature vector. According to the results, the accuracy of this algorithm is very high and comparable, and even superior to other automatic detection algorithms.14 In combination with the great efficiency, this algorithm can be used in real-time epilepsy detection applications. Test results of the algorithm can be seen in the “Results and discussion” section.
The results of the algorithm’s classification are of high sensitivity and specificity, except for the Generalized Tonic Clonic Seizure (GTCS). This bad performance might be the result of the small number of testing subjects with this specific seizure and also strong artifacts (moving, EMG) interfering with the original EEG signal. This had caused low PPV and X10 for this type of seizure.
Future work
This algorithm is currently being deployed and implemented on mobile device for real-time multimodal epilepsy detection using EEG emotive headset with a combination of acoustic, visual, and mechanic (accelerometer) modalities that support epilepsy detection. As the next step, the optimization of the compression stage and the final SVM evaluation stage is in place. More data need to be obtained on GTCS to improve the overall classification score for GTCS.
All the results and calculations described in this article had been performed using python and scikit libraries. Currently, this algorithm is being implemented on android phone device in Java to provide fully mobile support for the mobile non-clinical environment automatic epilepsy detection system.
Acknowledgments
This work was supported in part by the Center for Applied Cybernetics 3, Technology Agency of Czech Republic under project TE01020197, the Grant Agency of Excellence, University of Hradec Kralove, Faculty of Informatics and Management, and the University Hospital Hradec Kralove – Long-term Development Plan. This work was also supported by the European Regional Development Fund in the Research Centre of Advanced Mechatronic Systems project, project number CZ.02.1.01/0.0/0.0/16_019/0000867.
Disclosure
The authors report no conflicts of interest in this work.
References
Kandel ER, Schwartz JH, Jessell TM. Principles of Neural Science. New York: McGraw-Hill, Health Professions Division; 2000. | ||
Chapman D, Panelli R, Hanna J, Jes T. Sudden Unexpected Death in Epilepsy: Continuing the Global Conversation. Epilepsy Australia: Epilepsy Bereaved: SUDEP Aware; 2011. | ||
Steventon A, Bardsley M, Billings J, et al; Whole System Demonstrator Evaluation Team. Effect of telehealth on use of secondary care and mortality: findings from the Whole System Demonstrator cluster randomised trial. BMJ. 2012;344:e3874. | ||
Subasi A. Automatic recognition of alertness level from EEG by using neural network and wavelet coefficients. Expert Syst Appl. 2005;28(4):701–711. | ||
Koza JR. Genetic Programming: On the Programming of Computers by Means of Natural Selection. London and Cambridge, MA: MIT Press; 1992. | ||
Raymer ML, Punch WF, Goodman ED, Kuhn LA. Genetic Programming for Improved Data Mining: Application to the Biochemistry of Protein Interactions, in Proceedings of the First Annual Conference on Genetic Programming: Stanford, CA: MIT Press; 1996:375–380. | ||
Tackett WA. Genetic Programming for Feature Discovery and Image Discrimination: Urbana, IL: ICGA; 1993:303–311. | ||
Bot MC. Gen Program. Feature extraction for the k-nearest neighbor classifier with genetic programming. Gen Program. 2001;2038:256–267. | ||
Sabeti M, Katebi S, Boostani R. Entropy and complexity measures for EEG signal classification of schizophrenic and control participants. Artif Intell Med. 2009;47(3):263–274. | ||
Jirka J. Biometrical Data Processing and Analysis – Exogenous Epilepsy Seizure Source Localization and Classification [dissertation thesis]. Ostrava: VSB TU Ostrava; 2014. | ||
Ferlazzo E, Zifkin BG, Andermann E, Andermann F. Cortical triggers in generalized reflex seizures and epilepsies. Brain. 2005;128(Pt 4):700–710. | ||
Avanzini G. Musicogenic seizures. Ann N Y Acad Sci. 2003;999:95–102. | ||
Tzallas AT, Tsipouras MG, Tsalikakis DG, et al. Automated epileptic seizure detection methods: a review study. In: Epilepsy – Histological, Electroencephalographic and Psychological Aspects. Rijeka: In Tech; 2012:2027–2036. | ||
Lotte F, Congedo M, Lécuyer A, Lamarche F, Arnaldi B. A review of classification algorithms for EEG-based brain. J Neural Eng. 2007;4(2):R1–R13. | ||
Varri A. Digital Processing of the EEG in Epilepsy [licentiate thesis]. Tampere, Finland: Tampere University of Technology; 1988. | ||
Krajca V, Petránek S, Patáková I, Värri A. Automatic identification of significant graphoelements in multichannel EEG recordings by adaptive segmentation and fuzzy clustering. Int J Biomed Comput. 1991;28(1–2):71–89. | ||
Hsu CW, Chang CC, Lin CJ. A practical guide to support vector classification; 2003. Available from: ntur.lib.ntu.edu.tw/bitstream/246246/20060927122852476378/1/freiburg.pdf. Accessed March 1, 2018. | ||
Harding GF, Jeavons PM. Photosensitive Epilepsy. London: MacKeith Press; 1994. | ||
Subasi A. Automatic detection of epileptic seizure using dynamic fuzzy neural networks. Expert Syst Appl. 2006;31(2):320–328. |
 © 2018 The Author(s). This work is published and licensed by Dove Medical Press Limited. The
full terms of this license are available at https://www.dovepress.com/terms
and incorporate the Creative Commons Attribution
- Non Commercial (unported, 3.0) License.
By accessing the work you hereby accept the Terms. Non-commercial uses of the work are permitted
without any further permission from Dove Medical Press Limited, provided the work is properly
attributed. For permission for commercial use of this work, please see paragraphs 4.2 and 5 of our Terms.
© 2018 The Author(s). This work is published and licensed by Dove Medical Press Limited. The
full terms of this license are available at https://www.dovepress.com/terms
and incorporate the Creative Commons Attribution
- Non Commercial (unported, 3.0) License.
By accessing the work you hereby accept the Terms. Non-commercial uses of the work are permitted
without any further permission from Dove Medical Press Limited, provided the work is properly
attributed. For permission for commercial use of this work, please see paragraphs 4.2 and 5 of our Terms.