Back to Journals » Diabetes, Metabolic Syndrome and Obesity » Volume 12
ATP-binding cassette transporter A1 (ABCA1) expression in adipose tissue and its modulation with insulin resistance in obesity
Authors Vincent V ![]() , Thakkar H
, Thakkar H ![]() , Aggarwal S
, Aggarwal S ![]() , Mridha AR
, Mridha AR ![]() , Ramakrishnan L, Singh A
, Ramakrishnan L, Singh A ![]()
Received 19 November 2018
Accepted for publication 8 January 2019
Published 25 February 2019 Volume 2019:12 Pages 275—284
DOI https://doi.org/10.2147/DMSO.S186565
Checked for plagiarism Yes
Review by Single anonymous peer review
Peer reviewer comments 2
Editor who approved publication: Dr Konstantinos Tziomalos
Video abstract presented by Vinnyfred Vincent.
Views: 831
Vinnyfred Vincent,1 Himani Thakkar,1 Sandeep Aggarwal,2 Asit Ranjan Mridha,3 Lakshmy Ramakrishnan,4 Archna Singh1
1Department of Biochemistry, All India Institute of Medical Sciences, New Delhi, India; 2Department of Surgical Disciplines, All India Institute of Medical Sciences, New Delhi, India; 3Department of Pathology, All India Institute of Medical Sciences, New Delhi, India; 4Department of Cardiac Biochemistry, All India Institute of Medical Sciences, New Delhi, India
Purpose: Adipose tissue dysfunction is at the center of metabolic dysfunctions associated with obesity. Through studies in isolated adipocytes and mouse models, ATP-binding cassette transporter A1 (ABCA1) expression in the adipose tissue has been shown to regulate high-density lipoprotein (HDL) cholesterol levels in the circulation and insulin sensitivity at both adipose tissue and whole-body levels. We aimed to explore the possible link between ABCA1 expression in the adipose tissue and metabolic derangements associated with obesity in humans.
Patients and methods: This exploratory study among individuals who were lean (body mass index [BMI]: 22.3±0.34 kg/m2, n=28) and obese (BMI: 44.48±5.3 kg/m2, n=34) compared the expression of ABCA1, adiponectin and GLUT4 (SLC2A4) in visceral and subcutaneous adipose tissue using quantitative real-time PCR and immunohistochemistry. Homeostatic model assessment for insulin resistance (HOMA-IR) and adipose tissue insulin resistance (adipo-IR) were used as insulin resistance markers.
Results: Visceral adipose tissue from individuals who were obese had significantly lower ABCA1 (P=0.04 for mRNA and protein) and adiponectin (P=0.001 for mRNA) expression compared to that from lean individuals. Subcutaneous adipose tissue did not show any significant difference in the expression. When individuals were divided into insulin-sensitive (IS) and insulin-resistant (IR) groups based on HOMA-IR, IR individuals had lower ABCA1 (P=0.0001 for mRNA and P=0.009 for protein) expression compared to IS individuals in visceral adipose tissue, but not in subcutaneous adipose tissue. The difference was significant after adjusting for age, gender and BMI. ABCA1 mRNA expression in visceral adipose tissue correlated negatively with both HOMA-IR (r=–0.44, P=0.0003) and adipo-IR (r=–0.35, P=0.005) after adjusting for age, gender and BMI. ABCA1 expression in either visceral or subcutaneous adipose tissue did not have any significant correlation with HDL cholesterol levels or mean adipocyte area.
Conclusion: Obesity and insulin resistance are associated with lower expression of ABCA1 in visceral adipose tissue in humans.
Keywords: metabolic syndrome, cholesterol, diabetes, adiponectin
Corrigendum for this paper has been published
Plain language summary
Obesity predisposes individuals to diabetes mellitus which presents with increase in blood sugar levels. Insulin is the hormone that prevents uncontrolled increase in blood sugar in human body. Why some individuals with obesity develop resistance to the actions of insulin and subsequently diabetes mellitus while others do not is still not known. In this study we tried to answer this question by looking at the expression of ATP binding cassette transporter A1 (ABCA1) protein in various fat depots of human body namely visceral (abdominal) and subcutaneous (beneath the skin). In this study we found that among individuals with obesity, those with insulin resistance had lower expression of ABCA1 in their visceral fat compared to individuals who were obese but insulin sensitive. ABCA1 expression in visceral fat correlated negatively with presence of insulin resistance in fat and at whole body level. These results suggest possible role of ABCA1 in visceral fat in modulating insulin sensitivity in humans.
Introduction
Obesity, specifically, expansion of visceral adipose tissue, has been shown to be linked with metabolic disorders such as insulin resistance, atherogenic dyslipidemia and hypertension,1 and the rising prevalence of obesity with attendant comorbidities is of great public health concern. Adipose tissue dysfunction is postulated to be the link between these metabolic dysfunctions and obesity.2 How obesity leads to adipose tissue dysfunction and subsequently global metabolic derangements is a topic of intense research. Suggested mechanisms for these derangements include chronic low-grade inflammation in the adipose tissue with release of proinflammatory cytokines3 as well as development of adipose tissue insulin resistance and consequent increase in non-esterified fatty acid (NEFA) efflux. This leads to increased very low density lipoprotein synthesis and secretion from liver and triglyceride (TG) deposition in the skeletal muscle and liver, leading to insulin resistance in these tissues.4 Still, the underlying mechanism through which adipose tissue dysfunction develops in the first place in the context of obesity is not clearly elucidated. Even more puzzling question is why some obese individuals go on to develop insulin resistance and subsequently type 2 diabetes mellitus, while others do not.
ATP-binding cassette transporter A1 (ABCA1) is an essential membrane protein for high-density lipoprotein (HDL) biogenesis, which acts by facilitating the efflux of cellular free cholesterol and phospholipids to extracellular lipid-free apolipoprotein A-I, forming nascent HDL particles.5 The estimated contribution of hepatic and intestinal ABCA1 to plasma HDL pool is 70%–80% and 15%–20%, respectively.6,7 This suggests that ABCA1 expression in cells other than hepatocytes and intestinal epithelial cells would have minimal physiological role. This concept is now under revision, and there is mounting evidence for the role of ABCA1 in various cell types and tissues.8–10 Adipose tissue, with its range of metabolic and immunomodulatory functions, is one such organ under scrutiny. In mouse models, de Haan et al demonstrated that adipocyte-specific abca1 knockout leads to insulin resistance and obese phenotype.11 These mice also showed decreased levels of the most active form of adiponectin, high-molecular-weight adiponectin, in the circulation. In mouse models, Chung et al demonstrated that adipose tissue ABCA1 contributes to HDL biogenesis.12 Cuffe et al showed that adipocyte ABCA1 modulates diet-induced obesity in mouse models.13 Even though these studies suggest a possible role for ABCA1 in adipocytes, it is difficult to extrapolate data from studies on rodent metabolism, which differs substantially from human metabolism.
Thus, our objective was to explore a possible link between ABCA1 expression in the adipose tissue and various components of metabolic syndrome, including insulin resistance and circulating HDL levels, in human participants. We also wanted to explore depot-specific differences, if any, in ABCA1 expression in the adipose tissue from individuals with obesity.
Patients and methods
Study design and participant recruitment
This was an exploratory cross-sectional study. We recruited participants through elective surgery schedule of the Department of Surgical Disciplines, All India Institute of Medical Sciences, New Delhi, India. The study group included 34 individuals with obesity (body mass index [BMI] ≥30) undergoing bariatric surgery, and the control group included 28 individuals who were lean (BMI <25) undergoing surgery for conditions that are not known to cause generalized metabolic derangements, mostly laparoscopic cholecystectomy and hernia repair. We excluded individuals with diabetes mellitus, irrespective of their medication status. Individuals who were on medication for dyslipidemia were also excluded from the study. No statistical methods were used for calculating the sample size.
Anthropometric measurements
Body weight, height, BMI and waist circumference were obtained on the morning of surgery along with relevant clinical history, and the information was recorded using a questionnaire.
Plasma glucose, insulin, NEFA and lipid profile
Blood samples were collected on the morning of the surgery after 12 hours of overnight fast. Glucose was measured using Randox GOD-PAP glucose estimation kit (Randox Laboratories, Crumlin, UK) according to manufacturer’s instructions. Insulin was estimated using chemiluminescence-based immunoassay in a Liaison autoanalyzer (Diasorin, Saluggia, Italy). NEFA was estimated using Randox NEFA estimation kit (Randox Laboratories) according to manufacturer’s instructions. Lipid profile was estimated using AU480 autoanalyzer (Beckman Coulter, Brea, CA, USA). Insulin resistance markers, homeostatic model assessment for insulin resistance (HOMA-IR)14 and adipose tissue insulin resistance (adipo-IR),15 were calculated as described before. HOMA-IR represents insulin resistance at the whole-body level and adipo-IR at the adipose tissue level.
Adipose tissue sample collection
Subcutaneous and visceral adipose tissue samples were collected during the surgery from the incision site and greater omentum, respectively. For isolation of total cellular RNA, samples were flash frozen in liquid nitrogen and RNA was isolated as described below. For immunohistochemistry (IHC), samples were fixed in 10% formaldehyde for 24 hours and embedded in paraffin blocks. Tissue sections of 5 µm thickness were mounted on 3-aminopropyl triethoxysilane (Sigma-Aldrich Co., St Louis, MO, USA)-coated slides.
Quantitative real-time PCR (qPCR) for the mRNA expression of abca1, glut4 (slc2a4) and adipoq
Total cellular RNA was extracted using Ribozol™ RNA extraction reagent (Amresco, Cleveland, OH, USA). Total RNA was quantified using Thermo Scientific™ NanoDrop 2000 spectrophotometer (Thermo Fisher Scientific, Waltham, MA, USA). Purity of RNA was estimated by measuring the absorbance ratios at 260/280 and 260/230. Integrity of RNA was estimated using gel electrophoresis and visualizing the ribosomal RNA fractions. cDNA was synthesized using RevertAid reverse transcriptase (Thermo Fisher Scientific). qPCR was carried out using DyNAmo ColourFlash SYBR Green qPCR kit (Thermo Fisher Scientific) and specific primers in a Bio-Rad CFX96 Touch™ Real-Time PCR Detection System (Bio-Rad Laboratories Inc., Hercules, CA, USA). actb, hprt1 and polr2a were used as reference genes for qPCR. The three aforementioned genes have been identified as the most stable endogenous reference genes in the adipose tissue.16 Expression levels of the target genes (abca1, slc2a4 and adipoq) were normalized to the geometric mean of the expression levels of the three reference genes.
Immuno histochemistry (IHC) for quantification of ABCA1 and GLUT4 (SLC2A4) protein expression
IHC for quantification of ABCA1 and GLUT4 expression was carried out manually using monoclonal antibodies specific to ABCA1 (ab18180, 1:50) and GLUT4 (ab65267, 1:800) (Abcam, Cambridge, UK). Staining was carried out using the UltraVision Quanto Detection System HRP DAB (Thermo Fisher Scientific) according to manufacturer’s instructions, and slides were counterstained using hematoxylin. Negative and positive control slides were included in each set of staining. Negative control slides were stained after omitting the primary antibody incubation step. Immunoreactivity of each tissue section was scored manually using Olympus BX46 microscope (Olympus Corporation, Tokyo, Japan) by a pathologist. For ABCA1 expression, scores of 0, 1 and 2 were assigned based on the staining intensity and for GLUT 4, scores of 0, 1, 2 and 3 were assigned.
Adipocyte size quantification
Pictures captured from IHC slides of the adipose tissue sections were used for quantification of adipocyte size. Three images from different areas of each tissue section were captured at 10× magnification. These images were used to quantify individual adipocyte area using Adiposoft plug-in for Fiji (advanced distribution of ImageJ software [US National Institutes of Health, Bethesda, MD, USA]) in automated analysis mode. A paper validating adiposoft has been previously published.17 Mean adipocyte area was calculated for each tissue section from the individual adipocyte areas.
Statistical analyses
Statistical analysis and creation of graphs were done using the R Core Team (2018, R: A language and environment for statistical computing; R Foundation for Statistical Computing, Vienna, Austria; URL https://www.R-project.org/) and Adobe Illustrator software (Adobe Systems, San Jose, CA, USA). Statistical significance in terms of P-value was calculated using unpaired t-test for normally distributed data and Wilcoxon rank sum test for data that were not normally distributed. Pearson correlation was used to calculate the correlation coefficient and significance of the correlation. A P-value of <0.05 was taken as statistically significant.
Ethics approval and informed consent
The study was approved by the Institute Ethics Committee of All India Institute of Medical Sciences, New Delhi (Ref. No. IESC/T-64/21.01.2015) and was conducted in accordance with the Declaration of Helsinki. All participants gave written informed consent before inclusion in the study. Participants did not receive any stipend for taking part in the study.
Results
Clinical characteristics of participants
Average BMI of individuals in the study group (obese) was 44.48±0.92 kg/m2 and individuals in the control (lean) group was 22.33±0.34 kg/m2. Average age of individuals in the study group and control group was 38±2 and 37±2 years, respectively. Study group included 11 males and 23 females. Control group included 12 males and 16 females (Table 1).
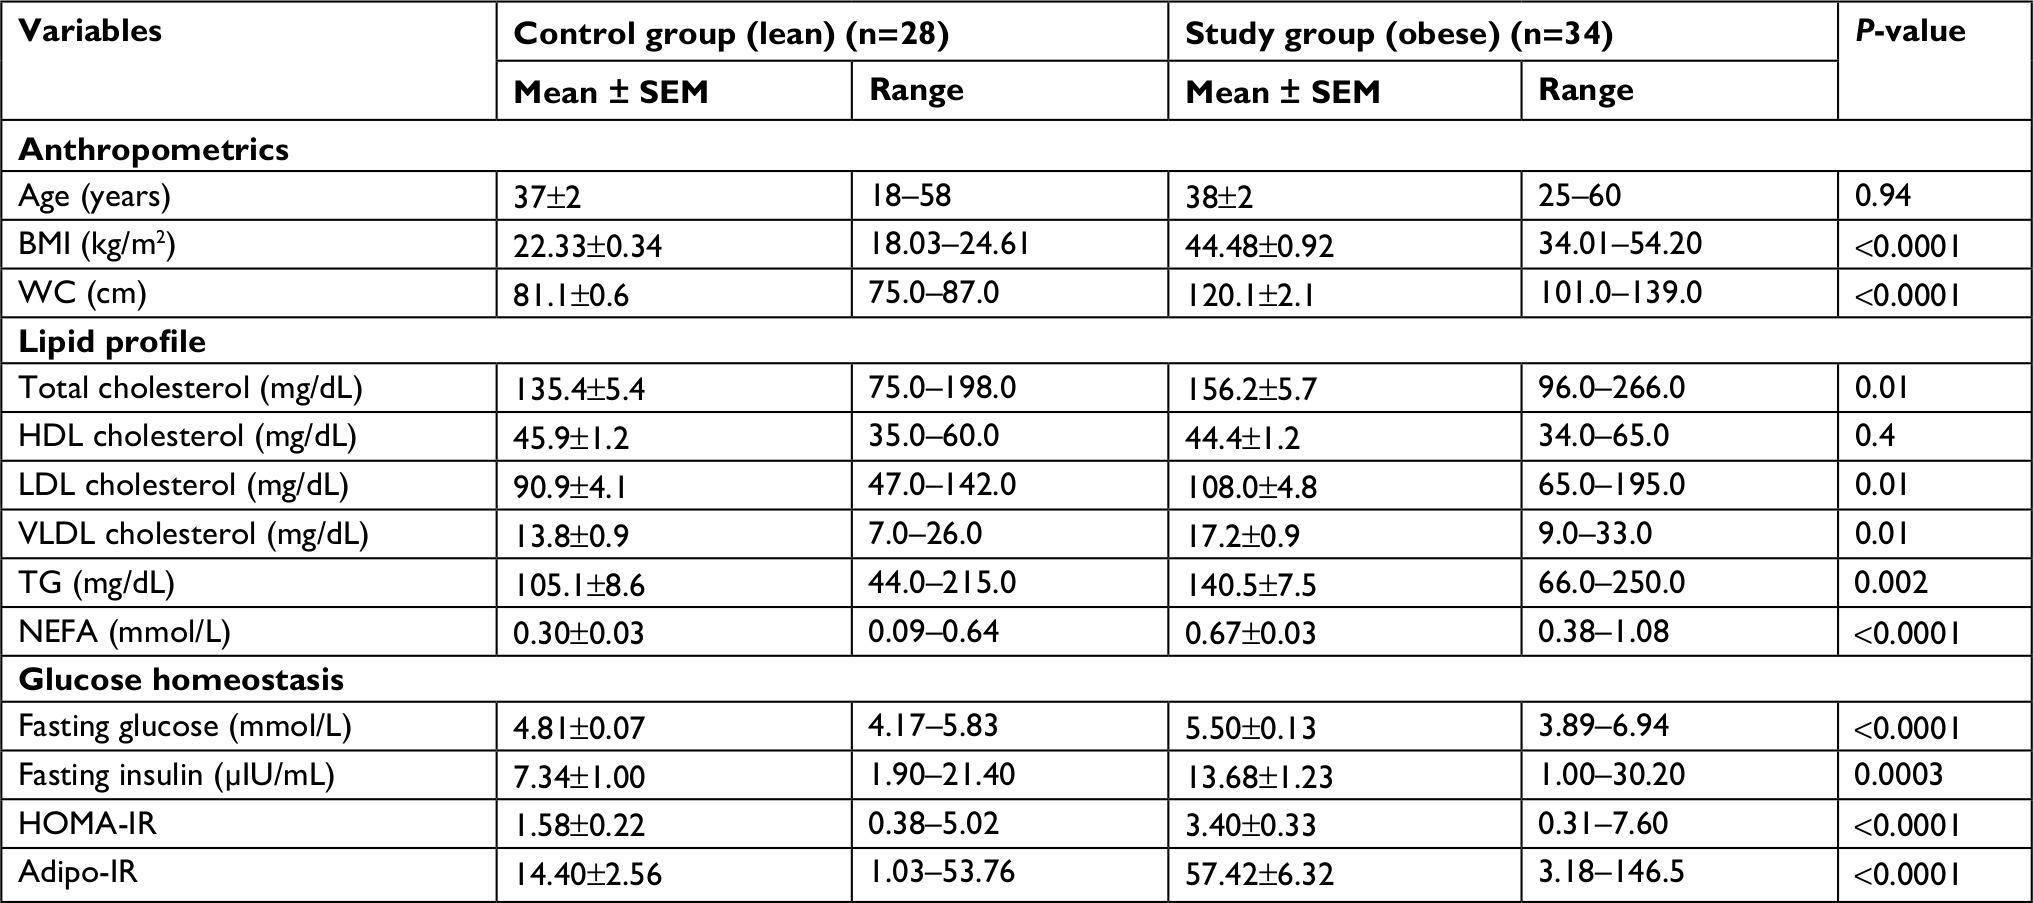 | Table 1 Clinical characteristics of participants Abbreviations: adipo-IR, adipose tissue insulin resistance; BMI, body mass index; HDL, high-density lipoprotein; HOMA-IR, homeostatic model assessment for insulin resistance; LDL, low-density lipoprotein; NEFA, non-esterified fatty acids; SEM, standard error of mean; TG, triglyceride; VLDL, very low-density lipoprotein; WC, waist circumference. |
Expression levels of ABCA1, ADIPOQ and GLUT4 (SLC2A4) in the adipose tissue
There were differences in the expression levels of ABCA1, adiponectin and GLUT4 between adipose tissues from individuals who were lean and individuals who were obese, and these differences were depot specific. The expression levels of abca1 at mRNA level were significantly lower (P=0.04) in the visceral adipose tissue from individuals who were obese compared to individuals who were lean (Figure 1A). Adipoq also showed an expression pattern like that of abca1, with the expression levels being significantly lower (P=0.001) in the visceral adipose tissue from individuals who were obese compared to individuals who were lean (Figure 1A). Subcutaneous adipose tissue did not show any significant difference in the expression of abca1 and adipoq (Figure 1A). Levels of slc2a4 were significantly lower in both visceral (P=0.0004) and subcutaneous (P=0.0002) adipose tissues from individuals who were obese compared to individuals who were lean (Figure 1A). At the protein level, IHC results for ABCA1 and GLUT4 (SLC2A4) showed similar results to qPCR results. ABCA1 expression was significantly lower in visceral adipose tissue (P=0.04) from individuals who were obese compared to individuals who were lean (Figure 1B, C), and subcutaneous adipose tissue did not show any difference (Figure 1B, C). GLUT4 (SLC2A4) was significantly lower in both visceral (P=0.007) and subcutaneous (P=0.009) adipose tissues from individuals who were obese compared to individuals who were lean (Figure 1C).
 | Figure 1 Expression of ABCA1, adiponectin and GLUT4 in the adipose tissue from individuals who were lean and individuals who were obese. Notes: Expression of (A) abca1 (P=0.04 and 0.4), adipoq (P=0.001 and 0.5) and glut4 (slc2a4) (P=0.0004 and 0.0002) at the mRNA level in specified adipose tissue compartments from individuals who were lean and obese. Expression levels normalized to geometric mean of three reference genes (actb, hprt1 and polr2a). Statistical test: Wilcoxon rank sum test (P-value: ns = not significant, *P<0.05, **P<.01, ***P<0.001. (B) Representative images of immunohistochemical staining for ABCA1 in specified adipose tissue compartments. Magnification 10×. Scale bar =100 µm. (C) Heat map showing immunoreactivity scoring for the expression of ABCA1 and GLUT4 (SLC2A4) at the protein level in visceral and subcutaneous adipose tissue compartments from individuals who were lean and obese (lean, n=28; obese, n=34). Abbreviation: ns, nonsignificant. |
Biochemical parameters and insulin resistance markers
There was no significant difference in HDL-cholesterol levels between individuals who were lean and individuals who were obese. NEFA levels were significantly higher in individuals who were obese. Insulin resistance markers (HOMA-IR and adipo-IR) were significantly higher in individuals who were obese compared to individuals who were lean (Table 1). For further analysis, we divided participants into insulin-sensitive (IS) and insulin-resistant (IR) groups taking a HOMA-IR level of 2.5 as the cut-off, which is an established level for this purpose.18 Those individuals with HOMA-IR levels <2.5 were grouped as IS and those with HOMA-IR levels ≥2.5 were grouped as IR. Among lean individuals, 23 were IS and 5 were IR. Among individuals who were obese, 13 were IS and 21 were IR. Average age of individuals in the IS and IR groups was 38±2 and 37±2 years, respectively. IS group included 12 males and 24 females. IR group included 11 males and 15 females. Average BMI of individuals in the IS group was 29.82±1.79 kg/m2 and of individuals in IR group was 40.93±2.03 kg/m2 (Table 2).
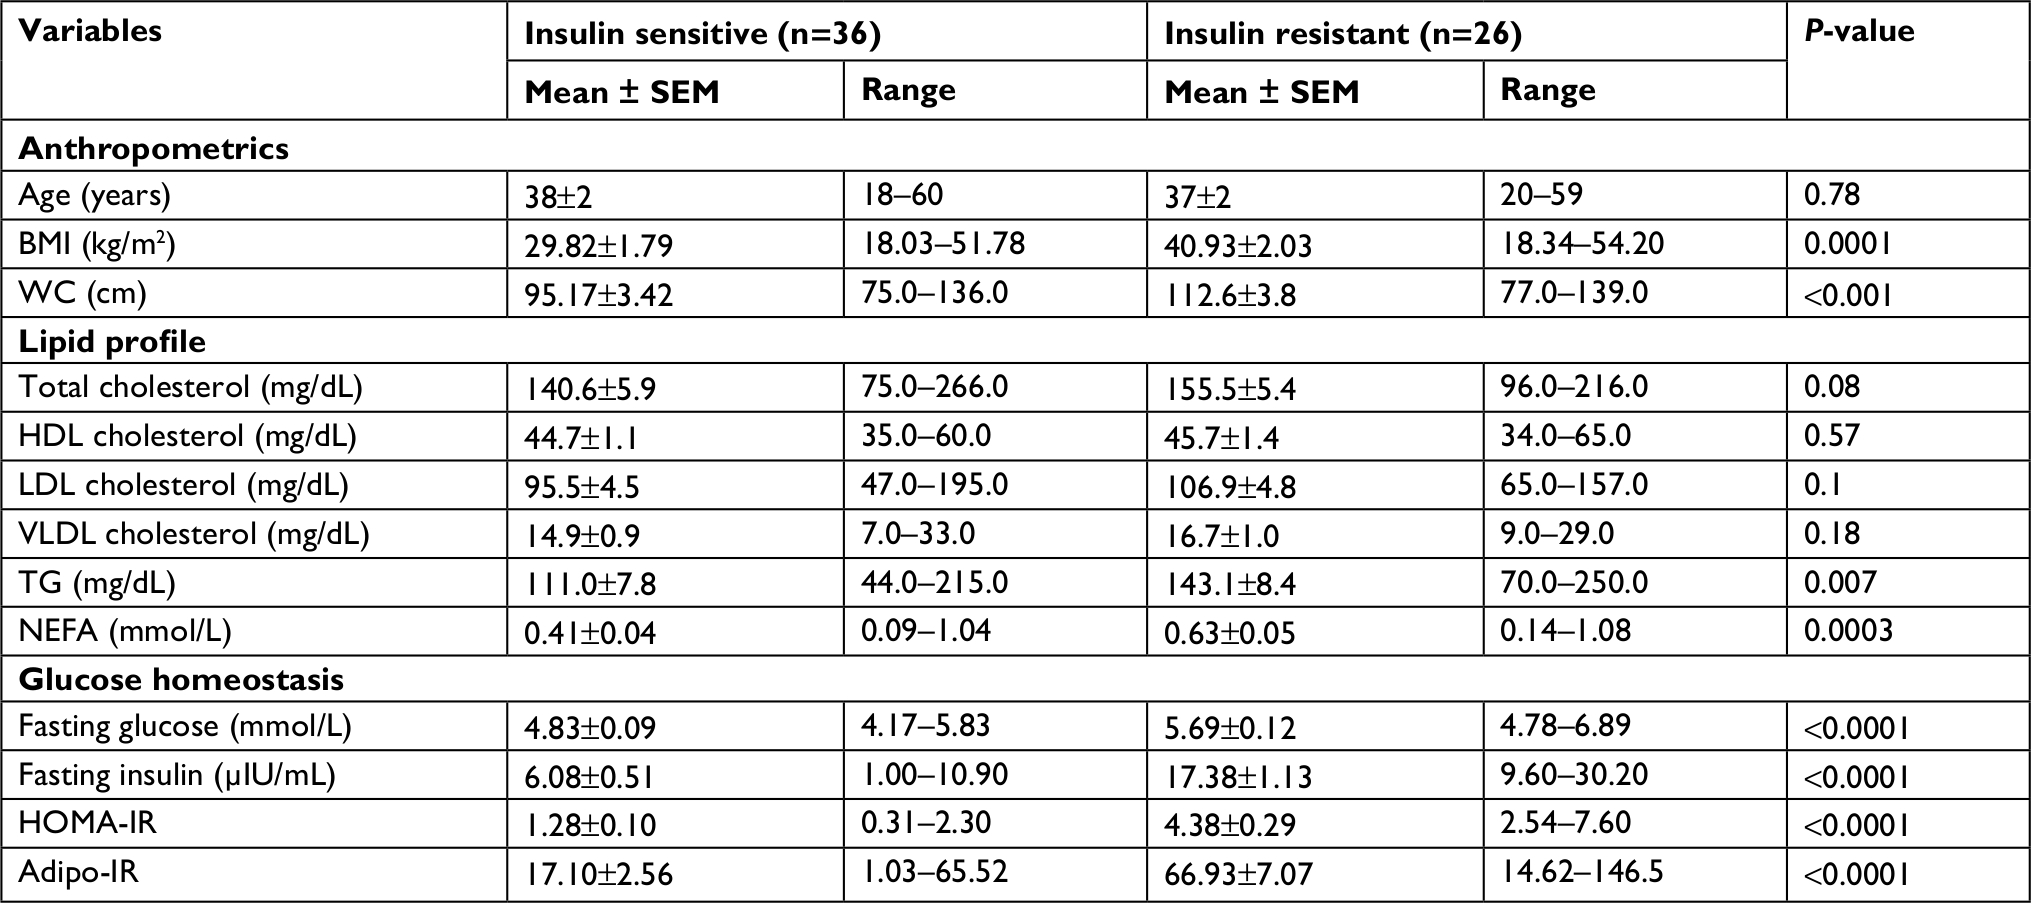 | Table 2 Clinical characteristics of individuals grouped as insulin sensitive and insulin resistant Abbreviations: adipo-IR, adipose tissue insulin resistance; BMI, body mass index; HDL, high-density lipoprotein; HOMA-IR, homeostatic model assessment for insulin resistance; LDL, low-density lipoprotein; NEFA, non-esterified fatty acids; SEM, standard error of mean; TG, triglyceride; VLDL, very low-density lipoprotein; WC, waist circumference. |
Differences in the expression levels of ABCA1, ADIPOQ and GLUT4 (SLC2A4) between IS and IR groups
The expression levels of abca1 (P=0.0001) and adipoq (P=0.04) at mRNA level were significantly lower in visceral adipose tissue from individuals in IR group compared to individuals in IS group (Figure 2A). Subcutaneous adipose tissue did not show any difference (Figure 2A). Glut4 (slc2a4) mRNA expression was significantly lower in both visceral (P=0.001) and subcutaneous (P=0.008) adipose tissues from individuals in IR group compared to individuals in IS group (Figure 2A). At the protein level, IHC results paralleled qPCR results. ABCA1 expression was significantly lower in visceral adipose tissue from individuals in IR group compared to individuals in IS group (P=0.009), and subcutaneous adipose tissue did not show any difference (Figure 2B). GLUT4 (SLC2A4) expression was significantly lower in both visceral (P=0.001) and subcutaneous (P=0.005) adipose tissues from individuals in IR group compared to individuals in IS group (Figure 2B). Unadjusted difference in median abca1 expression in the visceral adipose tissue at the mRNA level between IS and IR (95% CI) was 0.50 (0.26–0.74), P=0.0001, and after adjusting for age, gender and BMI, it was was 0.40 (0.178–0.723), P=0.002. Further, we divided the participants into three groups. 1 – lean and IS, 2 – obese and IS and 3 – obese and IR. There was no significant difference in the expression levels of abca1 in the visceral adipose tissue from individuals who were lean and IS and individuals who were obese and IS at the mRNA level (P=0.61; Figure 2C). The expression of abca1 in visceral adipose tissue from individuals who were obese and IR was significantly lower compared to individuals who were obese and IS at the mRNA level (P=0.02; Figure 2C). At the protein level also, visceral adipose tissue from individuals who were obese and IR had lower ABCA1 expression compared to individuals who were obese and IS, but the difference was not statistically significant (P=0.09; Figure 2D). This shows that ABCA1 expression in visceral adipose tissue is associated with insulin sensitivity rather than presence of obesity.
 | Figure 2 Expression of ABCA1, adiponectin and GLUT4 in adipose tissue from IS and IR individuals. Notes: Expression of (A) abca1 (P=0.0001 and 0.97), adipoq (P=0.04 and 0.24) and glut4 (slc2a4) (P=0.001 and 0.008) at the mRNA level. (B) Heat map showing immunoreactivity scoring for ABCA1 and GLUT4 (SLC2A4) in specified adipose tissue compartments from individuals who were IS and IR (IS, n=36; IR, n=26). (C) Expression of abca1 mRNA and (D) protein in visceral adipose tissue compartment in specified groups (n=23, 13 and 21, respectively). Statistical test: Wilcoxon rank sum test (P-value: *P<0.05, **P<.01, ***P<0.001. Abbreviations: IR, insulin resistant; IS, insulin sensitive; ns, not significant. |
Grouping the individuals into IS and IR groups using the median HOMA-IR of 2.069 instead of 2.5 gave similar results in the expression of abca1 mRNA (visceral P=0.0001 and subcutaneous P=0.56).
Correlation between ABCA1 expression and insulin resistance markers
ABCA1 mRNA expression in the visceral adipose tissue had a significant negative correlation with both HOMA-IR (r=–0.44, P=0.0003) and adipo-IR (r=–0.35, P=0.005), as shown in Figure 3A and 3B. ABCA1 expression in the subcutaneous adipose tissue did not show any significant correlation with either HOMA-IR (r=–0.08, P=0.52) or adipo-IR (r=–0.03, P=0.80). ABCA1 expression in neither visceral adipose tissue (r=0.01, P=0.94) nor subcutaneous adipose tissue (r=0.14, P=0.28) showed any significant correlation with HDL-cholesterol levels.
 | Figure 3 Correlation between abca1 mRNA expression in the visceral adipose tissue with insulin resistance markers and mean adipocyte area. Notes: Correlation between abca1 mRNA in the visceral adipose tissue with (A) HOMA-IR (n=62) and (B) adipo-IR (n=62). (C) Correlation between mean visceral adipocyte area in µm2 and abca1 mRNA expression in the visceral adipose tissue (n=48). Statistical test: Pearson correlation. Abbreviations: adipo-IR, adipose tissue insulin resistance; HOMA-IR, homeostatic model assessment for insulin resistance. |
In a multiple regression analysis model, a single-unit increase in the expression of abca1 mRNA in visceral adipose tissue resulted in a decrease of 1.57 units (0.74–2.39), P<0.001, in HOMA-IR before adjusting for age, gender and BMI. After adjusting for these three parameters, a single-unit increase in abca1 mRNA expression in the visceral adipose tissue resulted in a decrease of 1.10 units (0.316–1.89), P=0.007, in HOMA-IR, showing that the association between ABCA1 expression and insulin sensitivity is independent of the presence of obesity.
Mean visceral adipocyte area did not show any significant correlation with abca1 mRNA expression levels (Figure 3C), again showing that the ABCA1 expression did not correlate significantly with the presence of obesity.
Discussion
Our study aimed to examine whether there is a change in the expression of ABCA1 in adipose tissue associated with obesity and if this change correlates with metabolic derangements associated with obesity. We found a depot-specific lower expression of ABCA1 associated with obesity. Lower ABCA1 expression associated with obesity was limited to the visceral compartment. ABCA1 expression in the visceral adipose tissue correlated inversely with insulin resistance markers both at adipose tissue level (adipo-IR and GLUT4 expression levels) and whole-body level (HOMA-IR). Even with associated obesity, which is considered to be an IR condition, higher ABCA1 expression in the visceral adipose tissue translated into better insulin sensitivity. The association between ABCA1 expression and insulin sensitivity was independent of age, gender and BMI. This shows that insulin sensitivity, rather than the presence of obesity modulates the expression of ABCA1 in visceral adipose tissue. Even though there are studies in mouse models and isolated adipocytes suggesting the possible role of ABCA1 in adipocytes in modulating insulin sensitivity,11,12 we could not find any study suggesting a similar role in humans. Similar studies by Key et al and Tang et al in mouse models with cell-specific ABCA1 knockout in hepatocytes19 and hematopoietic cells,20 respectively, suggest that ABCA1 modulates insulin sensitivity. The present study suggests a possible role of adipose tissue ABCA1 in modulating the insulin resistance associated with obesity in humans.
Development of insulin resistance is thought to be the underlying pathology of metabolic syndrome. Adipose tissue modulates insulin resistance at the whole body level beyond its own ability to take up glucose.21 Insulin resistance in the adipose tissue leads to failure of insulin to suppress NEFA release from the adipose tissue, and increased levels of NEFA in the circulation lead to increased TG release from the liver and deposition of TG in tissues such as skeletal muscle, further producing insulin resistance in these tissues.4 The present study suggests that ABCA1 expression in the adipose tissue could regulate whole-body insulin sensitivity through modulating adipose tissue insulin sensitivity and NEFA release. In support of this hypothesis, we found significantly higher levels of NEFA in both obese and IR individuals.
The expression of ABCA1 paralleled the expression of adiponectin, whose expression has been shown to be regulated at the visceral adipose tissue level. Even though adiponectin is secreted by the adipose tissue, expansion of adipose tissue seen in obesity is associated with decreased levels of adiponectin in the circulation. This decrease has been shown to correlate with the visceral fat area rather than subcutaneous fat area or BMI.22 This parallel expression pattern is in accordance with earlier studies in cultured adipocytes, suggesting that ABCA1 and adiponectin have common modulators for their expression.23 Adiponectin expression is suggested to represent the metabolic health of the adipose tissue since decreased level of adiponectin is associated with dysfunctional adipocytes seen in obesity.24 In the current study, ABCA1 also shows a similar trend, and this could suggest that ABCA1 expression could have a role in the metabolic health of the adipose tissue.
Modulation of ABCA1 expression in the visceral adipose tissue with insulin resistance, which is independent of obesity, and a possible role of ABCA1 in regulating the metabolic health of adipose tissue could explain in part why some obese individuals develop insulin resistance and type 2 diabetes mellitus while others do not.
The difference in expression of ABCA1 in adipose tissue did not translate into a difference in HDL-cholesterol levels in the circulation. These results suggest that ABCA1 expression in the adipose tissue is unlikely to have a direct role in determining the levels of HDL-cholesterol levels in the circulation. Mouse models in which adipose tissue ABCA1 expression was ablated showed significantly lower levels of HDL-cholesterol in the circulation.11 However, the physiological and even the pathological conditions present in human individuals are unlikely to produce effects to the extent of gene knockout scenarios. Further, a qualitative impact could be as significant as a quantitative effect, as reflected in the importance of ABCA1 expression in macrophages. Although cholesterol efflux mediated via ABCA1 expressed in macrophages does not contribute significantly to the levels of HDL in the circulation,25 this ABCA1 expression is physiologically and clinically significant because it promotes cholesterol efflux, thereby preventing accumulation of cholesterol in the macrophages. This decreases their propensity for being converted into foam cells that initiate the atherosclerosis process. This is the major proposed mechanism by which HDL causes antiatherogenic effects.26 Further studies are required to explore the role of ABCA1 expression in the adipose tissue in modulating the functional aspects of HDL.
This study does not provide a causal relationship between ABCA1 expression in the adipose tissue and insulin sensitivity. Isolation of total cellular RNA from the adipose tissue for qPCR analysis means that contribution from other cell types, especially adipose tissue-resident macrophages, cannot be excluded. Also, the lack of difference in HDL levels between obese and non-obese groups could be due to relatively small sample size and a slightly higher percentage of females in the obese group. Based on the difference in ABCA1 gene expression between IS and IR individuals with and without obesity, we calculated the necessary sample size (power 90%, alpha 0.0125) to be 37 in each group (lean IS, lean IR, obese IS and obese IR). Despite these limitations, this study provides directions for future research in the field of metabolic syndrome.
The canonical function of ABCA1 is cholesterol and phospholipid efflux from cells facilitating the conversion of free apo-A1 to nascent HDL. Our study indicates that ABCA1 could play a significant role in modulation of insulin sensitivity with significant metabolic implications, despite a nonsignificant contribution to HDL-cholesterol levels in the circulation. This effect is likely to be present both at adipose tissue level and whole-body level. The correlation observed between ABCA1 expression with insulin sensitivity and adiponectin expression suggests a possible role of ABCA1 in overall metabolic health of the adipose tissue. Although ABCA1 function in adipose tissue has not been analyzed from this perspective, it is potentially of interest to explore the interplay with adipose tissue adipokines and subsequent implications on insulin resistance due to the critical role of ABCA1 in regulating cholesterol and lipid metabolism. Further studies are required to establish a causal relationship between ABCA1 expression in the adipose tissue and insulin sensitivity. Also, it needs to be explored whether ABCA1 influences adipose tissue insulin sensitivity through modulating adipose tissue cholesterol balance or through some other mechanisms. Further studies in this direction could explain why some obese individuals develop insulin resistance and subsequently type 2 diabetes mellitus while others maintain normal insulin sensitivity.
Conclusion
Our results show that obesity and insulin resistance are associated with lower expression of ABCA1 in visceral adipose tissue in humans. The association of ABCA1 expression with insulin resistance was independent of presence of obesity.
Acknowledgments
The authors would like to acknowledge Dr Manjunath Maruti Pol, Dr Harshit Garg and Dr Abhineet KP for helping with the collection of adipose tissue samples and Mr Rintu Kutum for helping with the statistical analysis. Dr Vincent would like to acknowledge the contributions of Dr Anurag Kumar, Dr Ambrish Tiwari and Dr Prajwal Aathreya. This study was supported by an intramural research grant from All India Institute of Medical Sciences, New Delhi to Dr Archna Singh. The sponsors did not have any role in any of the stages from study design to submission of the paper for publication.
Disclosure
The authors report no conflicts of interest in this work.
References
Tchernof A, Després JP. Pathophysiology of human visceral obesity: an update. Physiol Rev. 2013;93(1):359–404. | ||
Després JP, Lemieux I. Abdominal obesity and metabolic syndrome. Nature. 2006;444(7121):881–887. | ||
Engin A. The pathogenesis of obesity-associated adipose tissue inflammation. Adv Exp Med Biol. 2017;960:221–245. | ||
Smith U, Kahn BB. Adipose tissue regulates insulin sensitivity: role of adipogenesis, de novo lipogenesis and novel lipids. J Intern Med. 2016;280(5):465–475. | ||
Dean M, Hamon Y, Chimini G. The human ATP-binding cassette (ABC) transporter superfamily. Genome Res. 2001;11(7):1156–1166. | ||
Timmins JM, Lee JY, Boudyguina E, et al. Targeted inactivation of hepatic ABCA1 causes profound hypoalphalipoproteinemia and kidney hypercatabolism of apoA–I. J Clin Invest. 2005;115(5):1333–1342. | ||
Brunham LR, Kruit JK, Iqbal J. Intestinal ABCA1 directly contributes to HDL biogenesis in vivo. J Clin Invest. 2006;116(4):1052–1062. | ||
Brunham LR, Kruit JK, Pape TD, et al. Beta-cell ABCA1 influences insulin secretion, glucose homeostasis and response to thiazolidinedione treatment. Nat Med. 2007;13(3):340–347. | ||
Karasinska JM, Rinninger F, Lütjohann D, et al. Specific loss of brain Abca1 increases brain cholesterol uptake and influences neuronal structure and function. J Neurosci. 2009;29(11):3579–3589. | ||
Wang X, Collins HL, Ranalletta M, et al. Macrophage ABCA1 and ABCG1, but not SR-BI, promote macrophage reverse cholesterol transport in vivo. J Clin Invest. 2007;117(8):2216–2224. | ||
de Haan W, Bhattacharjee A, Ruddle P, Kang MH, Hayden MR. ABCA1 in adipocytes regulates adipose tissue lipid content, glucose tolerance, and insulin sensitivity. J Lipid Res. 2014;55(3):516–523. | ||
Chung S, Sawyer JK, Gebre AK, Maeda N, Parks JS. Adipose tissue ATP binding cassette transporter A1 contributes to high-density lipoprotein biogenesis in vivo. Circulation. 2011;124(15):1663–1672. | ||
Cuffe H, Liu M, Key CC, et al. Targeted deletion of adipocyte ABCA1 (ATP-binding cassette transporter A1) impairs diet-induced obesity. Arterioscler Thromb Vasc Biol. 2018;38(4):733–743. | ||
Matthews DR, Hosker JP, Rudenski AS, Naylor BA, Treacher DF, Turner RC. Homeostasis model assessment: insulin resistance and beta-cell function from fasting plasma glucose and insulin concentrations in man. Diabetologia. 1985;28(7):412–419. | ||
Gastaldelli A, Harrison SA, Belfort-Aguilar R, et al. Importance of changes in adipose tissue insulin resistance to histological response during thiazolidinedione treatment of patients with nonalcoholic steatohepatitis. Hepatology. 2009;50(4):1087–1093. | ||
Mehta R, Birerdinc A, Hossain N, et al. Validation of endogenous reference genes for qRT-PCR analysis of human visceral adipose samples. BMC Mol Biol. 2010;11:39. | ||
Galarraga M, Campión J, Muñoz-Barrutia A, et al. Adiposoft: automated software for the analysis of white adipose tissue cellularity in histological sections. J Lipid Res. 2012;53(12):2791–2796. | ||
Singh Y, Garg MK, Tandon N, Marwaha RK. A study of insulin resistance by HOMA-IR and its cut-off value to identify metabolic syndrome in urban Indian adolescents. J Clin Res Pediatr Endocrinol. 2013;5(4):245–251. | ||
Key CC, Liu M, Kurtz CL, et al. Hepatocyte ABCA1 deletion impairs liver insulin signaling and lipogenesis. Cell Rep. 2017;19(10):2116–2129. | ||
Tang C, Liu Y, Yang W, et al. Hematopoietic ABCA1 deletion promotes monocytosis and worsens diet-induced insulin resistance in mice. J Lipid Res. 2016;57(1):100–108. | ||
Abel ED, Peroni O, Kim JK, et al. Adipose-selective targeting of the GLUT4 gene impairs insulin action in muscle and liver. Nature. 2001;409(6821):729–733. | ||
Kishida K, Kim KK, Funahashi T, Matsuzawa Y, Kang HC, Shimomura I. Relationships between circulating adiponectin levels and fat distribution in obese subjects. J Atheroscler Thromb. 2011;18(7):592–595. | ||
Iwamoto N, Yokoyama S. Protein kinase D regulates the adiponectin gene expression through phosphorylation of AP-2: a common pathway to the ABCA1 gene regulation. Atherosclerosis. 2011;216(1):90–96. | ||
Ouchi N, Kihara S, Funahashi T, Matsuzawa Y, Walsh K. Obesity, adiponectin and vascular inflammatory disease. Curr Opin Lipidol. 2003;14(6):561–566. | ||
Haghpassand M, Bourassa PA, Francone OL, Aiello RJ. Monocyte/macrophage expression of ABCA1 has minimal contribution to plasma HDL levels. J Clin Invest. 2001;108(9):1315–1320. | ||
Uehara Y, Saku K. High-density lipoprotein and atherosclerosis: roles of lipid transporters. World J Cardiol. 2014;6(10):1049. |
 © 2019 The Author(s). This work is published and licensed by Dove Medical Press Limited. The
full terms of this license are available at https://www.dovepress.com/terms
and incorporate the Creative Commons Attribution
- Non Commercial (unported, 3.0) License.
By accessing the work you hereby accept the Terms. Non-commercial uses of the work are permitted
without any further permission from Dove Medical Press Limited, provided the work is properly
attributed. For permission for commercial use of this work, please see paragraphs 4.2 and 5 of our Terms.
© 2019 The Author(s). This work is published and licensed by Dove Medical Press Limited. The
full terms of this license are available at https://www.dovepress.com/terms
and incorporate the Creative Commons Attribution
- Non Commercial (unported, 3.0) License.
By accessing the work you hereby accept the Terms. Non-commercial uses of the work are permitted
without any further permission from Dove Medical Press Limited, provided the work is properly
attributed. For permission for commercial use of this work, please see paragraphs 4.2 and 5 of our Terms.