")
Back to Journals » International Journal of Nanomedicine » Volume 16
Atomic Layer Deposition of ZrO2 on Titanium Inhibits Bacterial Adhesion and Enhances Osteoblast Viability
Authors Jo Y, Kim YT, Cho H , Ji MK, Heo J, Lim HP
Received 24 December 2020
Accepted for publication 10 February 2021
Published 24 February 2021 Volume 2021:16 Pages 1509—1523
DOI https://doi.org/10.2147/IJN.S298449
Checked for plagiarism Yes
Review by Single anonymous peer review
Peer reviewer comments 3
Editor who approved publication: Dr Thomas Webster
Yujin Jo,1 Yong Tae Kim,2 Hoonsung Cho,2 Min-Kyung Ji,3 Jaeyeong Heo,2,3 Hyun-Pil Lim1
1Department of Prosthodontics, School of Dentistry, Chonnam National University, Gwangju, Korea; 2Department of Materials Science and Engineering, Chonnam National University, Gwangju, 61186, Korea; 3Optoelectronics Convergence Research Center, Chonnam National University, Gwangju, 61186, Republic of Korea
Correspondence: Hyun-Pil Lim
Department of Prosthodontics, School of Dentistry, Chonnam National University, Gwangju, 61186, Korea
Tel +82-10-2645-7528
Fax +82-62-530-5577
Email [email protected]
Jaeyeong Heo
Department of Materials Science and Engineering, Chonnam National University, Gwangju, 61186, Korea
Tel +82-62-530-1716
Fax +82-62-530-1699
Email [email protected]
Purpose: The study was intended to create a uniform zirconia layer even on the surface of complex structures via atomic layer deposition (ALD). The impact of crystalline zirconia deposited by ALD on bacterial adhesion and osteoblast viability was assessed via surface treatment of dental implants.
Methods: Amorphous zirconia was deposited using an atomic layer deposition reactor (Atomic Classic, CN1, Hwaseong, Korea) on titanium discs. Heating the samples at 400°C resulted in crystallization. Samples were divided into three groups: the control group, the group carrying amorphous ALD-zirconia (Z group), and the heat-treated group following zirconia ALD deposition (ZH group).The surface of each sample was analyzed, followed by the assessment of adhesion of Streptococcus mutans and Porphyromonas gingivalis, and viability and differentiation of MC3T3-E1 cells.
Results: The adhesion of S. mutans and P. gingivalis was significantly reduced in the Z and ZH groups compared with the control group (P < 0.05). The viability of MC3T3-E1 cells was significantly increased in the ZH group compared with the control group (P < 0.001), while no significant differences were observed in the Z group (P > 0.05). Differentiation of MC3T3-E1 cells showed a marginally significant increase in the ZH group compared with the control group (P < 0.1), while no significant differences were found in the Z group (P > 0.1).
Conclusion: Compared with the pure titanium group, the groups that were coated with zirconia via ALD showed a decreased adhesion of S. mutans during the early stages of biofilm formation and P. gingivalis adhesion inducing peri-implantitis, and an increase in MC3T3-E1 cell viability and differentiation. The findings indicate the possibility of treating the implant surface to reduce peri-implantitis and improve osseointegration.
Keywords: atomic layer deposition, ALD, surface treatment, titanium, zirconia, implant
Introduction
Zirconia (ZrO2) is a ceramic material showing good mechanical properties and biocompatibility. Since zirconia induces a low degree of bone resorption and immune response in vivo, it has been actively investigated as a material for implant surface treatment.1,2 In addition, coating implants with zirconia reduces bacterial adhesion3 and improves implant osteointegration.4 Thus, treating the implant surface with zirconia is expected to inhibit bacterial adhesion and increase osteoblast viability.
Since dental implants exhibit a thread shape, it is important to coat the implant surface to create a uniform layer even on complex structures without the coated layer peeling off easily. Atomic layer deposition (ALD) is a technique used to deposit a uniform and high-quality thin film and is widely used in semiconductor industry.5 Self-limiting surface chemistry of ALD enables precise thickness control and atomic composition. Compared with chemical vapor deposition, ALD occurs at a low-to-moderate growth temperature (< 500°C) with characteristic self-limited growth.6 ALD-zirconia has also been extensively studied as a potential gate dielectric material for metal-oxide-semiconductor field-effect transistors (MOSFETs).7,8 However, the surface of titanium coated with zirconia via ALD, and its effects on bacterial adhesion and osteoblast viability in dental implants have yet to be reported.
In this study, we investigated the characteristics of titanium surface coated with thin zirconia via ALD, and assessed the impact of zirconia layer obtained via ALD on bacterial adhesion and osteoblast viability in dental implants. Furthermore, this study analyzed the impact of crystallinity of zirconia (amorphous vs cubic/tetragonal phase) obtained via ALD on bacterial adhesion and osteoblast viability.
Materials and Methods
Experimental Materials
Samples
Samples were produced by machining commercially pure titanium (ASTM Grade IV, Kobe Steel, Kobe, Japan) into discs (diameter: 15 mm; thickness: 3mm), followed by grinding and washing before use. Experimental groups were differentiated via zirconia deposition and heat treatment (Table 1).
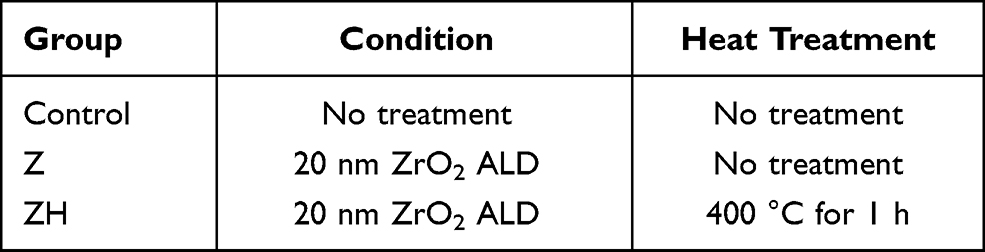 |
Table 1 Experimental Groups |
Zirconia ALD
Zirconia was deposited using an atomic layer deposition reactor (Atomic Classic, CN1, Hwaseong, Korea). The growth temperature was selected at 200°C based on a previous report.8 This study used tetrakis[ethylmethylamido]zirconium(IV) (TEMAZ) as a precursor; H2O (de-ionized water, 18.2 MΩ·cm at 25°C), as an oxidant; and N2 (99.999%), as a carrier and purge gas. The TEMAZ precursor was first injected into a reaction chamber for 1s, followed by nitrogen (N2) for 20s to purge the remaining precursors from the chamber. Then, H2O was injected for 0.05 s to complete the surface reaction to form amorphous ZrO2. After completion of the reaction, N2 was injected for 25s to purge the byproducts and unreacted species (Table 2). The growth-per-cycle based on Si substrate observation was 0.096 ± 0.002 nm/cycle, which was measured by an ellipsometer (J.A. Woollam, ESM 300). A total of 200 cycles were performed to obtain 20-nm-thick ZrO2 films.
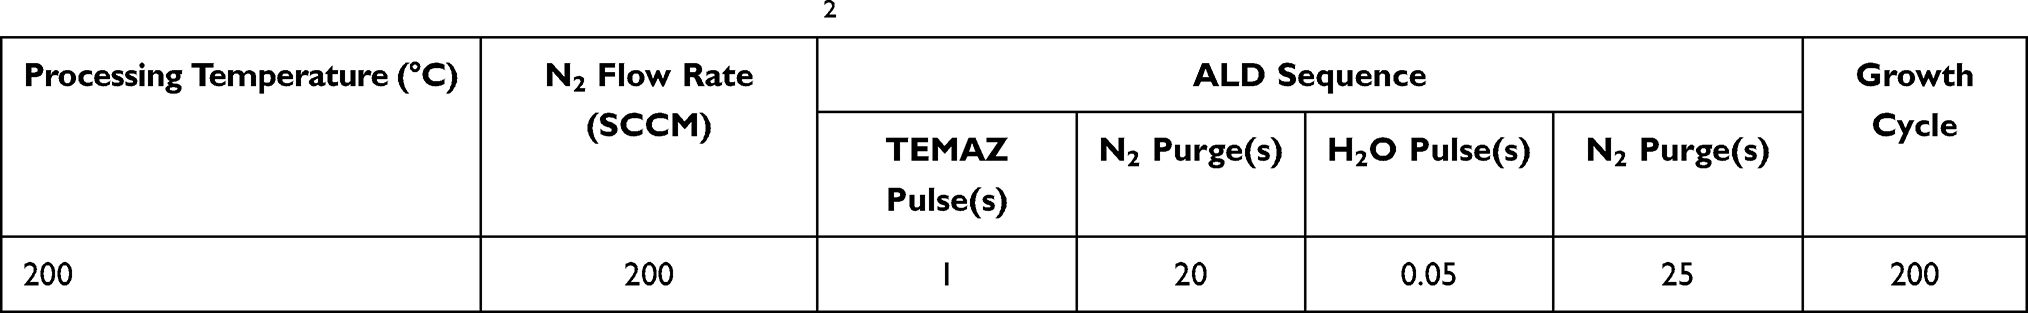 |
Table 2 Processing of Atomic Layer Deposition ZrO2 |
Heat Treatment After Zirconia ALD
As-deposited ZrO2 thin film was in an amorphous form. In order to investigate the effect of crystalline phase of ZrO2, additional heat treatment of group ZH was performed in air using a mini-box furnace (C-A14P, Hantech Co., Gunpo, Korea). The XRD patterns of ALD-ZrO2-coated Ti specimen annealed at 300°C, 400°C and 500°C confirms that the lowest temperature for crystallization is 300°C (Figure 1). In order to fully crystallize the deposited films, we increased the annealing temperature to 400°C in this study.
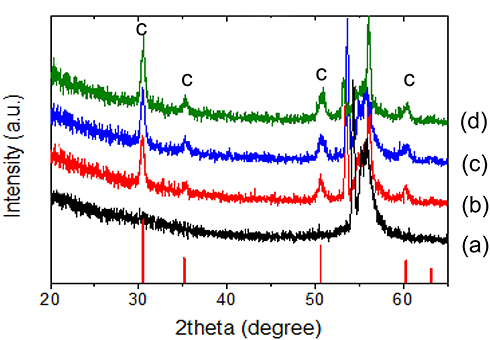 |
Figure 1 X-ray diffraction patterns of ALD-ZrO2-coated Ti specimen annealed at various temperatures. (a) control group, (b) 300°C, (c) 400°C, (d) 500°C. |
Assessment of Surface Characteristics
To distinguish Zr in ALD-ZrO2 and platinum (Pt) as a protective layer in TEM sample preparation, carbon and thin Pt layers were directly coated using a high vacuum coater (EM ACE600, Leica) and an ion sputter (E1030, Hitachi), respectively. Dual-Beam FIB System (Versa™ 3D, FEI) was used for sample preparation and analysis via transmission electron microscope (TEM, Tecnai-F20 ST, FEI). An additional thick layer of Pt was added for protection. Elemental mapping of the sample was also performed via energy dispersive X-ray spectroscopy (EDX). To observe the surface morphologies of ZrO2 films grown on Ti discs, an atomic force microscope (AFM, XE-100, Park Systems, Suwon, Korea) was used. Samples with areas measuring 10 × 10 µm2 in each group were observed at the resonant frequency of 28 kHz. To analyze the chemical composition and state of the film surface, an X-ray photoelectron spectrometer (VG Mulrilab 2000, ThermoScientific, Loughborough, UK) was used. An X-ray diffractometer (X’Pert PRO Multi-Purpose X-Ray Diffractometer, PANalytical, Almelo, Netherlands) was used to analyze the crystal structure after ALD and heat treatment. Diffraction analysis was conducted using CuKα X-ray at a scan speed of 1.5°/min within the range of 2θ between 20° and 90° under glancing mode (ω = 1.5°). The contact angle was measured to compare changes in hydrophilic properties and surface energy of samples between the Z and ZH groups. A water drop was formed on the sample surface with 3 µL of distilled water, and the contact angle was measured using a video contact angle-measuring device (Phoenix 300, SEO Inc., Suwon, Korea). The contact angle of 3 samples in each group was measured and their mean value was analyzed (Surfaceware9 software®, SEO Inc., Suwon, Korea). To measure surface free energy (SFE), the contact angle was measured using diiodomethane following a similar process. SFE was calculated using the Owens-Wendt geometric mean method.9
Assessment of Bacterial Adhesion
Bacterial Culture
To assess bacterial adhesion on the sample surface, Streptococcus mutans (KCOM 1504), which is a gram-positive facultatively anaerobic coccus involved in the early stages of biofilm formation, and Porphyromonas gingivalis (KCOM 2804), which is a gram-negative anaerobic bacterium known to cause peri-implantitis, were used. Each bacterium was obtained from the Korean Collection for Oral Microbiology (KCOM, Gwangju, Korea) and was cultured. S. mutans strains were cultured at 37°C in a culture chamber (LIB-150M, DAIHAN Labtech Co., Namyangju, Korea) with a BHI medium (Brain Heart Infusion, Becton, Dickinson and Company, Sparks, MD, USA). P. gingivalis strains were cultured at 37°C in an anaerobic culture chamber (Forma Anaerobic System 1029; Thermo Fisher Scientific, Waltham, MA, USA) with TSB (Tryptic Soy Broth, Becton, Dickinson and Company, Sparks, MD, USA).
Bacterial Inoculation
Prior to bacterial inoculation, the samples were coated with artificial saliva in order to reproduce the oral environment because it was a study of the implant surface, as well as to facilitate bacterial adhesion to the sample rather than the experimental wells.10 The adherence buffer was treated with 1% mucin (mucin from porcine stomach, M1778; Sigma-Aldrich, St Louis, MO, USA) to produce artificial saliva (Table 3).11 Next, samples were layered in a 24-well plate and artificial saliva was dispensed into each well. The plate was slowly stirred in a culture chamber at 37°C for 2 h to coat the samples with saliva. After removing artificial saliva, the samples were dried for 15 min. Strains of S. mutans and P. gingivalis were cultured for 24 and 48 h, respectively, and the samples were inoculated with 1.5 × 10⁷ CFU/mL of each bacterium.
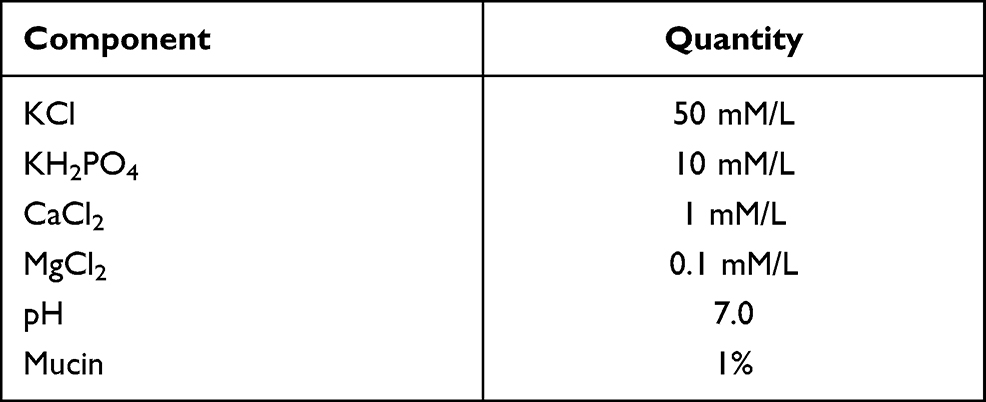 |
Table 3 Composition of Artificial Saliva Used in This Study |
Bacterial Adhesion Assessment
Crystal violet staining assay is used to indirectly determine bacterial viability after staining and quantify the bacteria adhering to samples by staining them with a crystal violet solution, based on the detachment of dead bacteria from the cultured samples. The bacteria were cultured on the samples, and the culture solution was removed. The samples were washed twice with PBS solution to remove nonadhering bacteria, and 500 µL of a 0.3% crystal violet solution was dispensed into each sample, following by staining for 10 minutes. After staining the samples, the crystal violet solution was removed, and the samples were washed three times with PBS solution to remove the remaining solution and then dried for 15 minutes. Each sample was treated with 400 µL of destaining solution (80% ethyl alcohol + 20% acetone) and stirred for 1 hour, followed by transfer of the destaining solution into a 96-well plate (200 µL/well). The absorbance was measured at 595 nm using VersaMax ELISA Microplate Reader (Molecular Device, San Diego, USA). The lower the absorbance, the lower was the number of adherent bacteria.
Visual assessment of bacterial adhesion was performed using a LIVE/DEAD® BacLightTM Bacterial Viability Kit (SYTO 9®, Molecular Probes Europe BV, Leiden, Netherlands). The optimized method was used to repeatedly detect the reduction in culture viability when the proportion of live cells in a sample of 1 x 10⁸ cells/mL fell below ~50% in a growth media used to detect antibiotic-induced death.12 However, in the case of P. gingivalis, an insufficient number of bacteria survived on the sample, so only S. mutans was used for the assessment of bacterial adhesion using a LIVE/DEAD®BacLightTM Bacterial Viability Kit. All bacteria can be stained with 3.34 mM SYTO 9 dye regardless of their viability, and 20 mM propidium iodide penetrates only dead bacteria and destains SYTO 9 dye. This kit enables fluorescence analysis in two different colors based on bacterial viability. After culturing the bacteria, the culture solution on the sample was removed and washed twice with PBS solution to remove bacteria that did not adhere to the sample, followed by the addition of 200 µL of a fluorescent reagent (SYTO 9 dye: propidium iodide: dH2O = 1.5 µL: 1.5 µL: 1 mL) to each sample. The well plate was protected from light with aluminum foil and the sample was stained at room temperature for 15 minutes. Subsequently, the remaining staining solution was carefully washed with PBS solution and the sample fixed with a fixative was analyzed to determine bacterial adherence using a confocal laser scanning microscope (Leica TCS SP5 AOBS/tandem, Leica Microsystems, Bensheim, Germany).
Assessment of Osteoblast Viability
Cell Culture
We commercially purchased MC3T3-E1 cell (MC3T3-E1 Subclone 4, ATCC CRL2593, Rockville, MD, USA) from American Type Culture Collection (Manassas, VA, USA). Compared with primary cell cultures, the clonal mouse pre-osteoblastic MC3T3-E1 cell line exhibits high levels of cellular differentiation and clear reproducibility.13 MC3T3-E1 cells are similar to osteoblasts.14 In particular, the MC3T3-E1 Subclone 4 cells represent a good model for studying in vitro osteoblast differentiation.13 In addition, because of behavior similar to primary calvarial osteoblasts, they were considered appropriate for studying the impact of the implant surface on osteoblasts.13 The osteoblastic cell line MC3T3-E1 was dispensed into α-Minimum Essential Medium (α-MEM, Dulbecco’s Modified Eagle Medium, Gibco-BRL, Grand Island, NY, USA) containing 10% fetal bovine serum (FBS) and 100 U/mL penicillin at a concentration of 1 x 10⁶ cells/mL, and was cultured in a carbon dioxide incubator set at 5% CO2 and 37°C (FormaSeries II 3111 Water Jacketed CO2 Incubator, Thermo Scientific, Waltham, MA, USA). The cell culture was performed in cell culture dishes (9 x 20 mm). The culture medium was changed every 3 days, and the MC3T3-E1 cells were subcultured 4 times.
Cytotoxicity Assessment
Cytotoxicity was measured twice, (at 24 hours and 120 hours) after cell culture. The samples in each group were transferred into a 24-well plate for each group, and 1 mL of MC3T3-E1 cells prepared at a concentration of 4 × 10⁴ cells/mL were dispensed into each well. Thereafter, the experiment was conducted by incubating the cells in CO2 incubators at 5% CO2 and 37°C for 24 hours (n = 9) and 120 hours (n = 6), respectively. Cytotoxicity was assessed using Water-Soluble Tetrazolium salt (WST) assay. The tetrazolium salt of WST-8 reagent (EZ-Cytox, Itsbio, Inc., Seoul, Korea) is reduced to orange-colored formazan in tissue culture medium by cellular dehydrogenases. Since the amount of reduced orange-colored formazan is directly proportional to the number of living cells, the degree of cell viability can be determined at 450 nm absorbance. Each sample was dispensed with 100 µL of WST-8 reagent and placed in an incubator set to 37°C and 5% CO2. When the reagent turned orange, 100 μL was transferred to each well of a 96-well plate, and the absorbance was measured at 450 nm using ELISA (VersaMax ELISA Microplate Reader, Molecular Device, Sunnyvale, CA, USA). The higher the absorbance, the greater was the number of living cells.
Scanning Electron Microscope
The proliferation of osteoblasts was observed using a scanning electron microscope (SEM) at 24 hours, 3 days and 5 days of cell culture. For SEM observations, the cells were fixed in 2.5% glutaraldehyde for 2 hours. After carefully washing with PBS solution twice (10 minutes each), the cells were dehydrated in an ethanol gradient in the order of 40%, 50%, 60%, 70%, 80% and 90% for 5 min at each concentration, followed by 100% ethanol 3 times (10 minutes each). The sample was dried in a clean bench for 1 hour after the dehydration process and coated with platinum in vacuum with a sputter coater (E-1030, Hitachi horiba, Kyoto, Japan) for 60 seconds. The cell morphology was observed using an SEM.
Cellular Differentiation
Six samples per group were seeded in a 24-well plate, and 1 mL of MC3T3-E1 cells prepared at a concentration of 1 × 10⁴ cells/mL was dispensed into each well and cultured in an incubator set at 5% CO2 and 37°C for 21 days.
ARS assay is used to determine cellular differentiation by evaluating calcium deposits in cell culture. The culture solution of the samples was aspirated, carefully washed twice with PBS solution, and then aspirated again. After fixing the samples in 70% ethanol for 1 hour, they were washed twice with distilled water, followed by treatment of each sample with 400 µL of Alizarin red staining solution (TMS-008-C, Thermo Fisher Scientific, Waltham, MA, USA). The plate was then covered with aluminum foil. The degree of staining was monitored at 5-minute intervals, and after 15 minutes, the samples were washed three times with distilled water, and the degree of staining was measured. Each stained sample was treated with 400 µL of 10% cetylpyridinium chloride solution. The plate was stirred at room temperature until all of the staining solution in the samples was destained, and. 100 µL of the destained solution was transferred into each well of a 96-well plate. The absorbance was measured at 570 nm using a VersaMax ELISA Microplate Reader (Molecular Device, San Jose, CA, USA). The higher the absorbance, the greater was the number of differentiated cells.
Statistical Analysis
Statistical analysis was performed using SPSS 21.0 (SPSS Inc., Chicago, IL, USA). When normality was met in the Shapiro–Wilk test, one-way ANOVA was used to test parameters, and Tukey’s test was used as a post hoc test. The significance level was 95%, and when the P-value was lower than 0.05, it was considered statistically significant. When the P-value was lower than 0.1, it was deemed marginally significant. When normality was not met, the Kruskal–Wallis test, a non-parametric test, was used. The Mann–Whitney U-test was used as a post-hoc test to test significance between groups at P < 0.017.
Results
Surface Characteristics
The cross-section of the titanium samples deposited with 400°C-annealed zirconia (ZH) was analyzed using TEM (Figure 2) and via EDX (Figure 3). Conformal growth of ~19–20-nm-thick ZrO2 film on a Ti substrate was observed from the image. The high-resolution lattice image showed 0.296 nm spacing, which corresponds to cubic (111) or tetragonal (101) planes. EDX mapping of Figure 3 also confirmed the formation of a continuous ZrO2 film. Here, the thin carbon-protective layer can be used to distinguish Zr in ZrO2 and Pt in the protective layer, as they exhibit a similar characteristic X-ray energy of ~2.04 keV. In addition, the layered oxygen signal overlapping with the Zr signal also supports this observation.
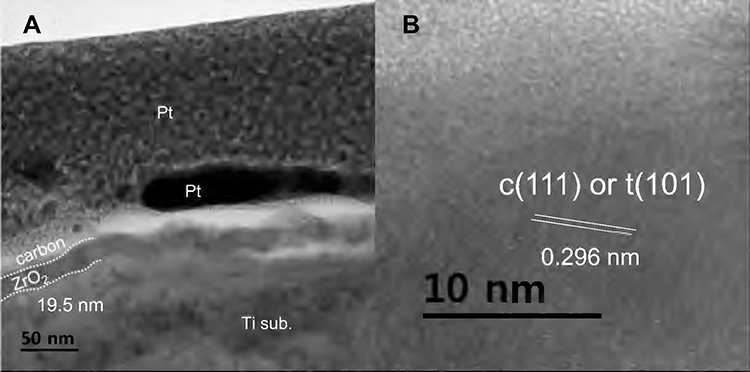 |
Figure 2 (A) Cross-sectional TEM images of ALD-ZrO2-coated Ti specimen after annealing at 400°C. Protective carbon and Pt layers are added during TEM sampling. (B) High-resolution TEM image of ZrO2 layer showing d-spacing of 0.296 nm. |
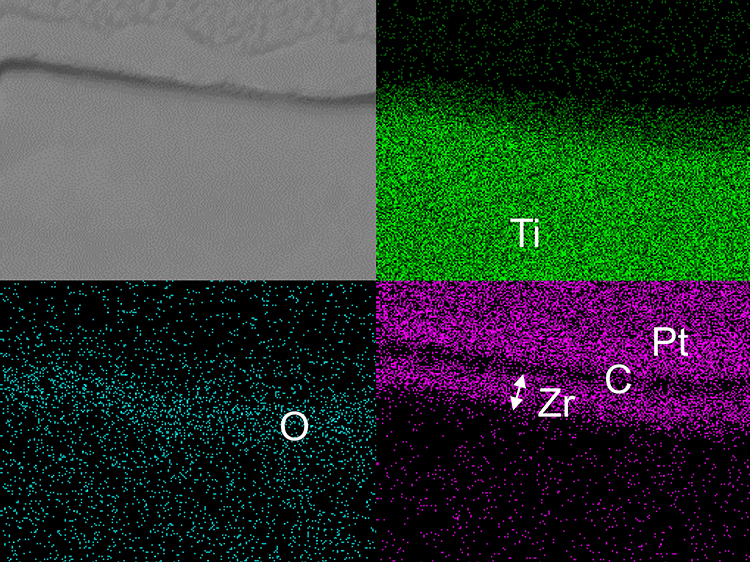 |
Figure 3 EDX elemental mapping of ZrO2-coated Ti specimen. Protective carbon and Pt was additionally coated on ZrO2 layer. Successful growth of continuous ZrO2 is observed. |
Atomic force microscope (AFM) was used to determine the roughness of the surface area (10 × 10 µm2). The AFM results showed that the roughness decreased in the Z and ZH groups compared with the control group. The roughness increased in the ZH group compared with the Z group (Table 4) (Figure 4).
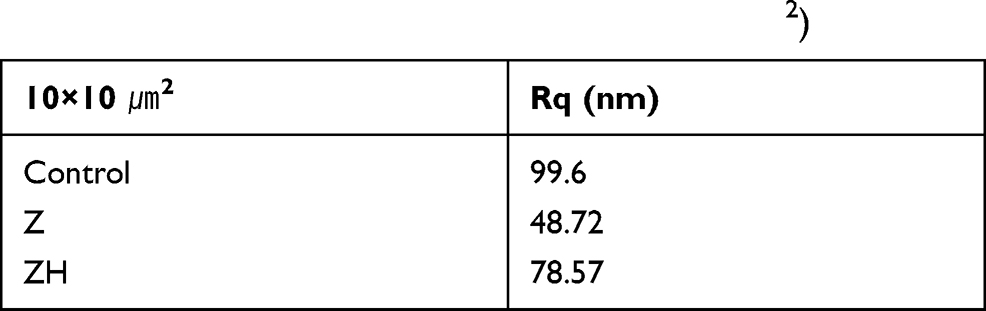 |
Table 4 Roughness Parameters of AFM (10×10 ㎛2) |
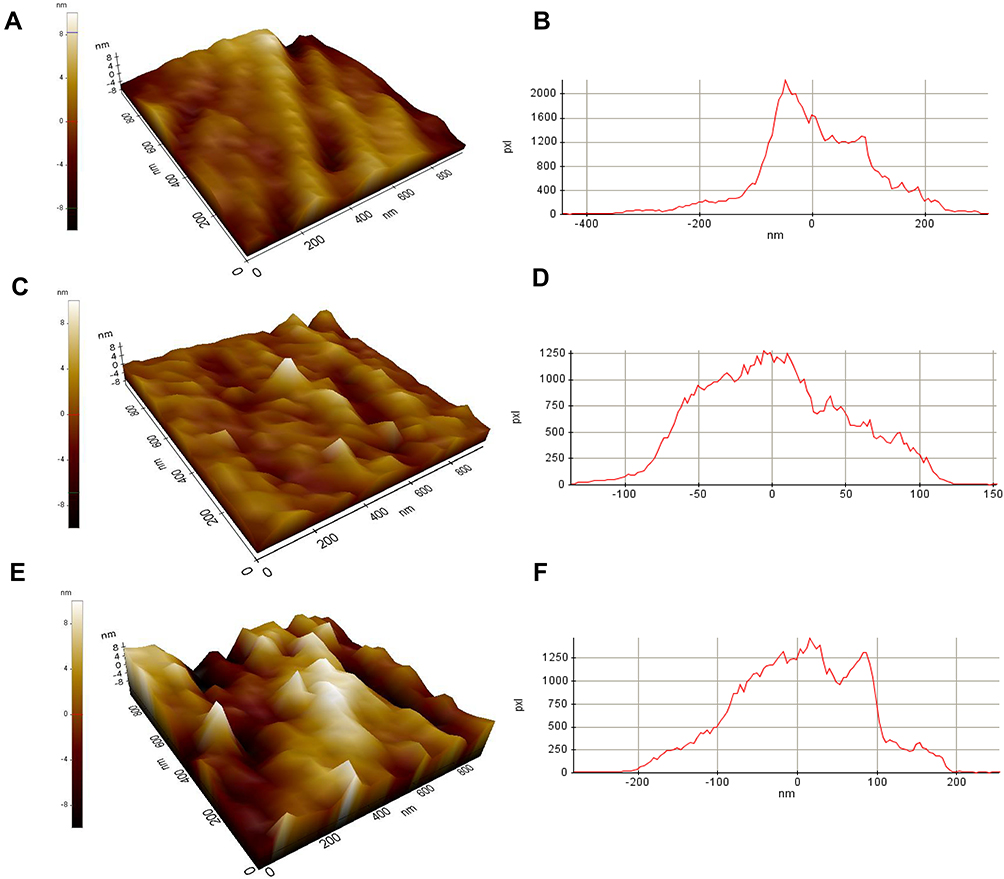 |
Figure 4 AFM surface images (10 × 10 ㎛2) in (A) control group, (C) Z group, (E) ZH group, AFM profile (10 × 10 µm2) of (B) control group,(D) Z group, (F) ZH group. |
XPS analysis showed C(1s), O(1s), and Ti (2p) on the sample surface in the control group, and C (1s), O (1s) and Zr (3d) in the Z and ZH groups (Figure 5). The double peaks of O1s at 530.2 eV and Ti2p at 464.2 eV and 458.4 eV observed in the control group indicate TiO2.15 The C1s peak observed at 284–285 eV in the Z and ZH groups may be attributed to adventitious carbon after air exposure. In both Z and ZH groups, the strongest O 1s peak was observed near 530.0 eV, which corresponds to ZrO2 (Figure 6A).The shape of the Zr 3d peaks observed in the Z and ZH groups suggested that zirconium was oxidized to Zr (IV) on the sample surface regardless of heat treatment (Figure 6B).16 The difference in bond energy between O1s and Zr3d 5/2 was about 347.0 eV, similar to the difference in the oxidation of the bulk of zirconium.17 Therefore, the sample surface appears to contain mainly ZrO2.
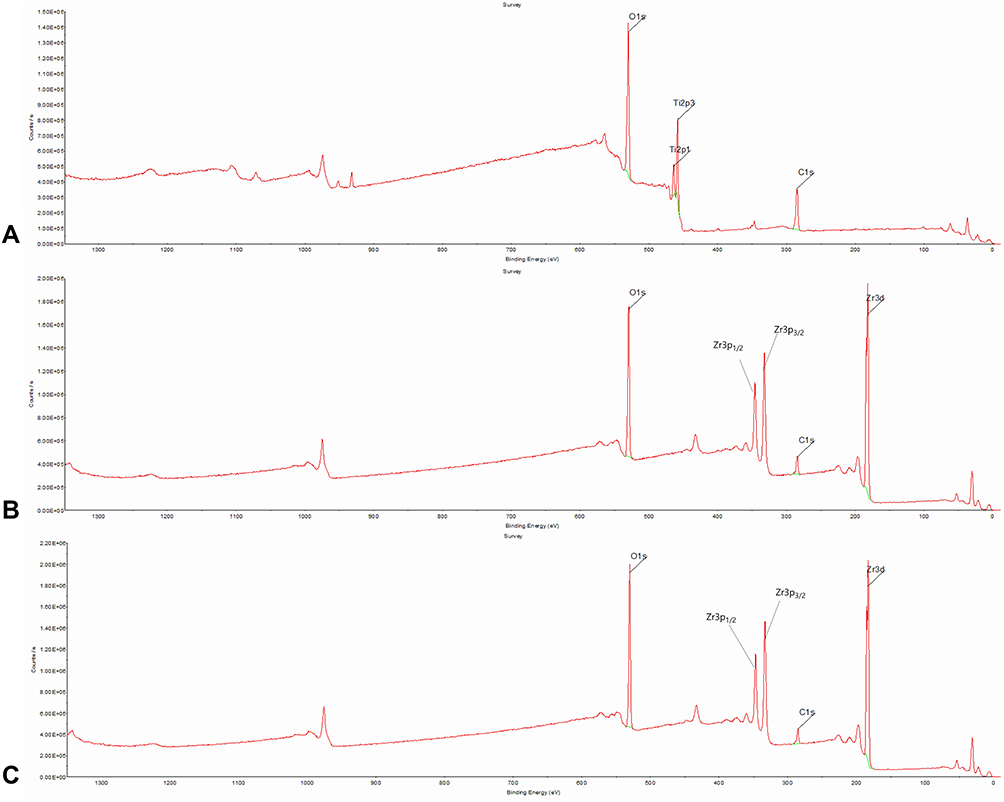 |
Figure 5 XPS profiles of specimens. (A) Control group, (B) group Z, (C) group ZH. |
 |
Figure 6 XPS profiles of ZrO2 ALD-coated specimen (A) O-1s, (B) Zr-3d. |
The crystallinity of the samples in each group was observed via X-ray diffraction (XRD) analysis (Figure 7). The peaks corresponding to the hexagonal crystal structure of Ti of 35.0° (010), 38.4° (200) and 40.2° (110) were observed in the XRD spectrum of the control group.18 In the Z group, no distinct additional peaks were observed corresponding to the crystalline phase of zirconia. In the ZH group, peaks corresponding to the cubic or tetragonal crystal structure of zirconia at ~30°, 50° and 60° were observed,19 which indicates that the ZrO2 of the ZH group was strongly crystallized compared with the Z group.
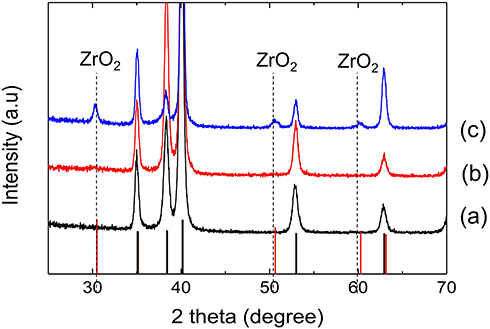 |
Figure 7 X-ray diffraction patterns of specimens (2 theta scan). (a) Control group, (b) group Z, (c) group ZH. |
In addition, the contact angle of the samples in the Z and ZH groups was found to increase compared with the control group (n = 3). The average contact angle of the samples in the control group was 78.01°, and that of the samples in the Z and ZH groups was 99.07° and 101.54°, respectively (Figure 8A).The total SFE of samples was calculated based on the contact angle of distilled water and diiodomethane, and the dispersive components and polar components of SFE were found to decrease in the Z and ZH groups compared with the control group (Figure 8B–D).
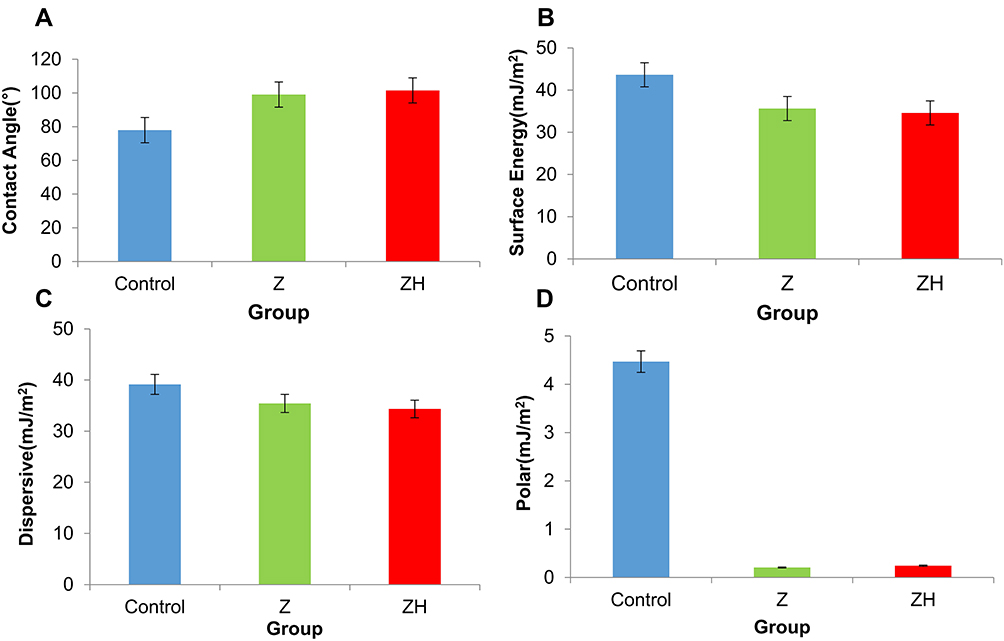 |
Figure 8 (A) Contact angle control group, (B) total free surface energy, (C) surface energy dispersive component, (D) surface energy polar component. |
Assessment of Bacterial Adhesion
Crystal violet staining showed a significant decrease in the adhesion of S.mutans in the Z and ZH groups compared with the control group (P < 0.05), but there was no significant difference in the level of S. mutans adhesion between the Z and ZH groups (P > 0.05) (Figure 9A). A significant decrease in P. gingivalis adhesion was found in the Z and ZH groups compared with the control group (P < 0.001), but there was no significant difference in the level of P. gingivalis adhesion between the Z and ZH groups (P > 0.05) (Figure 9B).
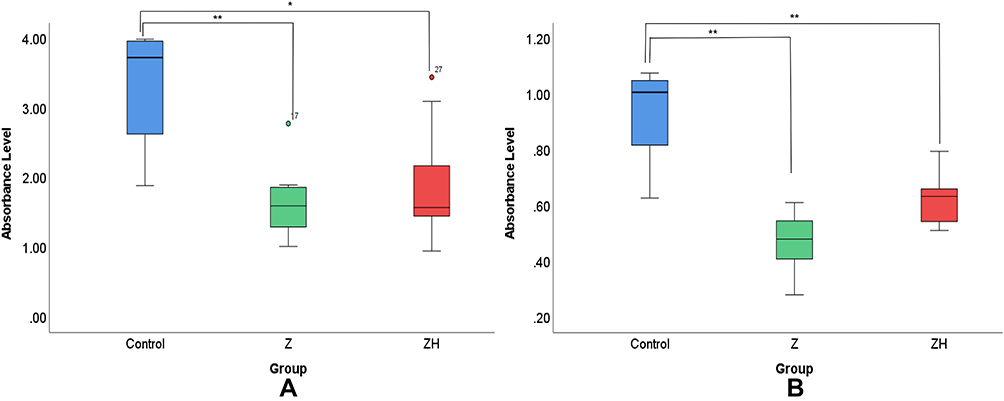 |
Figure 9 Results of crystal violet staining for attachment of (A) S. mutans (n = 9), (B) P. gingivalis (n = 11) on control group; group Z; group ZH. *Significant at P < 0.05, **significant at P < 0.001. |
Fluorescent nucleic acid staining was used only with S.mutans using the LIVE/DEAD® BacLightTM Bacterial Viability Kit. Live bacteria on samples were marked in green, and dead bacteria in red. The number of bacteria marked in green was the highest in the control group compared with the Z and ZH groups. In the Z group, the number of bacteria adhering to the sample surface was lower than in the remaining groups, and most of them were marked in red (Figure 10).
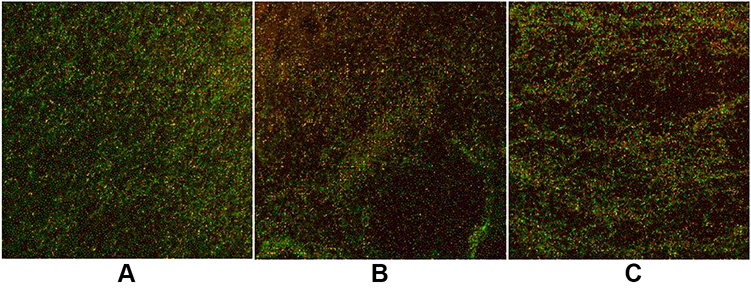 |
Figure 10 Viability of S. mutans biofilm on (A) control group, (B) group Z, (C) group ZH. Green fluorescence indicates viable cells and red fluorescence indicates dead cells. |
Assessment of Osteoblast Viability
Cytotoxicity Assessment/ Scanning Electron Microscope
To assess the viability of MC3T3-E1 cells, 1.0 mL of 4 × 10⁴ MC3T3-E1 cells/mL was dispensed into each sample and the cell adhesion was assessed after 24 h and 5 days using a WST. A significant increase occurred in MC3T3-E1 cell viability after 24 h in the ZH group compared with the control and Z groups (P < 0.001). However, no statistically significant increase in cell viability was detected in the Z group compared with the control group (P > 0.05) (Figure 11A). The viability of MC3T3-E1 cell after 5 days was a significant increase in the ZH group compared with the control group (P < 0.05), but there was no statistically significant increase in the Z group compared with the control group (P > 0.05) (Figure 11B).
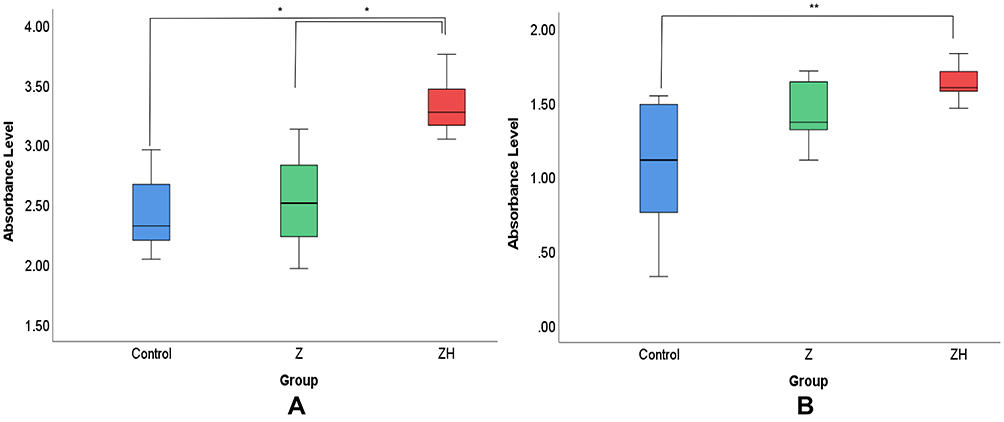 |
Figure 11 Results of WST assay for (A) 24 hours (n = 9), and (B) 5 days (n = 6) to assess the viability of MC3T3-E1 cells on Control group; group Z; group ZH. *Significant at P < 0.05, **Significant at P < 0.001. |
SEM evaluation of osteoblast proliferation 24 h and 3 days after culture revealed strong adherence of MC3T3-E1 cells to all the samples analyzed. Compared with the control group, the Z and ZH groups showed a higher number of cells that adhered to their samples. Osteoblast adhesion was also observed 5 days after culture. After 5 days, well-developed radial projections were detected on the samples in the Z and ZH groups compared with the control group (Figure 12).
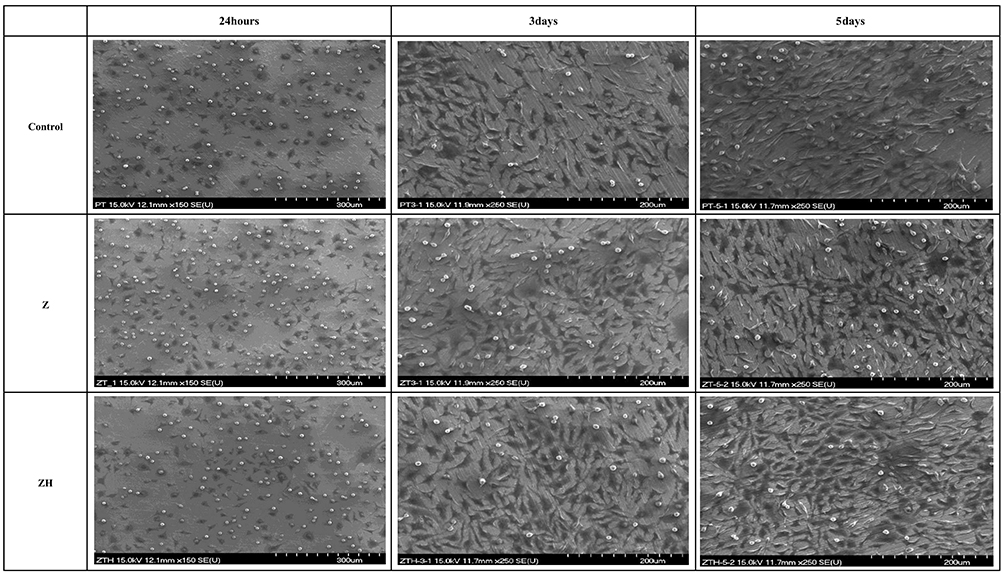 |
Figure 12 FE-SEM images of MC3T3-E1 cells on specimens after 24 hours of cultivation (×150), 3 and 5 days of cultivation (×250). |
Cellular Differentiation
To assess cellular differentiation after 21 days of culture, cells were dyed with ARS and the color intensity was quantified by measuring the absorbance (Figure 13). There was a marginally significant increase in cellular differentiation in the ZH group compared with the control group (P < 0.1), but there was no statistically significant increase in the Z group compared with the control group (P > 0.1) (Figure 14).
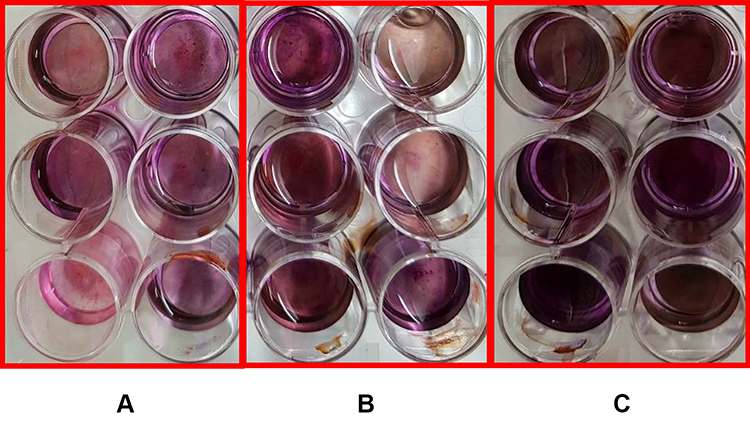 |
Figure 13 Results of ARS staining of (A) control group, (B) group Z, (C) group ZH (n = 9). |
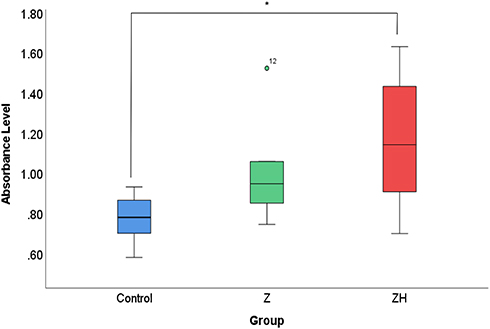 |
Figure 14 Results of ARS assay for 21 days to assess the differentiation of MC3T3-E1 cells on control group; group Z; and group ZH (n = 6). *Marginally Significant at P < 0.1. |
Discussion
Zirconia is used in various fields of structural bioceramics. Although zirconia does not chemically bind with bones, it exhibits high bioaffinity and stress resistance without causing corrosion, inflammatory response or allergies in vivo.20 Due to its high biocompatibility, zirconia has been widely used in the fields of dentistry.20–22 Tetragonal zirconia polycrystal (TZP) is used in dentistry. TZP is synthesized by adding about 3~5% of a stabilizer to pure zirconia (ZrO2). When pure zirconia is plasticized at a high temperature and is cooled to room temperature, the crystal phases transform from a tetragonal to a monoclinic structure. As the volume expands by about 3–5%, internal cracks are generated, which rapidly decrease the strength. In the case of TZP combined with a stabilizer, however, its stable tetragonal form at a high temperature can be maintained at room temperature, revealing high strength and fracture toughness. When zirconia is deposited via ALD, it is amorphous before heat treatment, and cubic or tetragonal in structure until the temperature reaches 300~500°C, which was confirmed in this study. The transformation conditions differ depending on the size of zirconia crystal grains.23 Also, the surface of the nanometer-thick zirconia layer shows varying transformation patterns compared with general zirconia in the bulk state, indicating that it is difficult to predict the temperature of transformation due to heat treatment on the surface coated with zirconia via ALD.17 Additional studies are needed to strengthen the transformation of the surface treated with zirconia. In particular, the viability and differentiation of osteoblasts was not significantly increased on the surface of an amorphous form that was not heat-treated after zirconia ALD, but the viability and differentiation of osteoblasts was increased on the surface of cubic or tetragonal crystal phases following heat treatment. Therefore, the effects of other crystal phases on osteoblasts require further investigation. In addition, the existence of zirconia crystal phases on the surface results in varying nanoroughness as shown by the AFM analysis. The group in which cubic or tetragonal crystal phases were generated from an amorphous form after heat treatment showed an increase in nanoroughness. Gongadze et al24 developed a mathematical model based on experimental evidence to explain the osteoblast response to the nanorough surface of titanium implants. This model showed that electric field concentration affected protein adsorption patterns underlying accelerated osteoblast adhesion.24 Thus, the study analyzed differences in osteoblast response to the round amorphous surface and the surface with sharp crystal phases, and revealed that the surface with multiple sharp spikes significantly increased the surface charge density and field strength near the areas and increased the number of proteins that promoted osteoblast adhesion.24 The crystal phases on the surface with higher nanoroughness promote osteoblast adhesion compared with the amorphous surface.24 In a similar context, Colon et al25 also reported that ceramic materials with additional crystal grain boundaries on the surface showed increased absorption of specific proteins and reinforced the osteoblast function.These results indicate that both the presence and type of crystal phase affected osteoblast activation.24,25
The surface coated with zirconia via ALD not only increased osteoblast viability, but also inhibited S. mutans and P. gingivalis involved in oral bacterial adhesion. In general, oral bacterial adhesion can be divided into 4 stages: bacterial movement to the surface; early-stage adhesion in the reversible/irreversible phase; adhesion caused by specific interactions; and biofilm formation.26 In a healthy state, bacterial adhesion and removal from the oral surface exist in a dynamic equilibrium, but for some reasons increased bacterial accumulation results in disease. Some of the factors that determine the level of bacterial adhesion include surface roughness and SFE.27 An increase in roughness on an irregular surface enhances bacterial adhesion by providing shelter within surface irregularities,28 and the surface with high energy attracts additional bacteria and stronger bonding.27 The effect is amplified selectively in certain bacteria, and these two factors interact with each other and often offset each other’s influence.2 Based on these findings, Al-Radha et al2 explained that the low surface energy of zirconia reduces bacterial adhesion and directly affects the dental pellicle generated by saliva. In this study, total surface energy and the dispersive and polar components in the total surface energy were analyzed using the Owens-Wendt geometric mean method.9 Dispersive components include the Van der Waals interactions. Polar components include certain interactions (dipole-dipole, induced dipole-dipole and hydrogen bonds) with charge transfer (acid γ + and basic γ-) between surrounding media or molecules. The results of this study demonstrate that the total surface energy of samples coated with zirconia was lower than that of the samples in the control group. Further, polar components contributed to differences in the level of bacterial adhesion between the control and the zirconia-deposited groups compared with total surface energy and dispersive components. Polar components show differences in Lewis acid-base components, which appears to be associated with the number and type of bonds between functional groups existing on the surface. A biofilm results from the dissociation and bonding between various functional groups existing on the surface, which are mostly negatively charged at physiological pH 5~7.18 For this reason, the dominant acid components (electron acceptor, γ +) on a specific surface suggest that the negative charges on the bacterial surface exhibit electrostatically dominant interactions. In contrast, the titanium surface coated with zirconia shows mostly basic components (electron donor, γ-), which explains a decrease in bacterial adhesion.29 However, this does not mean that only surface energy alone has a large impact on the level of bacterial adhesion. As shown in this study, bacterial adhesion was further inhibited in the amorphous crystal group that was not heat-treated among the groups subjected to ALD of zirconia, due to the slight difference in surface roughness. When a crystal phase is formed via heat treatment, the nano-roughness increases, suggesting reduced adhesion occurs in the group without heat treatment, which has relatively lower nano-roughness. Almaguer et al18 also reported that the zirconia coating layer itself reduces bacterial adhesion more than pure titanium; however, the amorphous surface showed a lower level of bacterial adhesion than the surface with crystal phases. In this regard, additional studies may be required to investigate the surface with optimal nanoroughness in order to inhibit bacterial adhesion and increase osteoblast activation concurrently. Furthermore, based on the results of the LIVE/DEAD® BacLightTM Bacterial Viability Kit, the level of bacterial adhesion itself was lower in the groups coated with zirconia via ALD, and the number of dead bacteria was also higher in the groups. This strategy indicates that the groups subjected to zirconia ALD were not only capable of inhibiting the adhesion of S. mutans and P. gingivalis, but also exhibited antibacterial effect, which requires further studies.
In contrast to conventional implant surface treatment methods such as polishing, blasting, grinding and mechanical processing, ALD can be used to deposit a very thin layer even on complex shapes such as nonplanar or isogonic surfaces with a high degree of precision, and at a low temperature.30 Therefore, ALD can be used to treat complex and temperature-sensitive materials such as biomolecular and polymer structures.30 It is also possible to precisely control the thickness of deposited layers and evenly deposit materials on the entire surface.30 TEM and AFM analyses suggest that 20-nm-thick zirconia was evenly deposited on titanium samples. Furthermore, since it is possible to easily modify surface composition at the atomic level via ALD, the changes in composition within a single layer can be induced.30 This finding suggests diverse alternatives to conventional surface treatment methods that are limited by the choice of materials, and also expands the scope of developing the implant surface. However, due to the long processing time of ALD, which is a major disadvantage in related industries,5 a follow-up study is needed to determine measures to commercialize ALD.
In this study, titanium implants doped with zirconia via ALD exhibit unique chemical and physical properties associated with nanometer-thick zirconia surface and thus inhibit the adhesion of S. mutans and P. gingivalis causing oral disease and increase osteoblast viability. Ultimately, these surface characteristics appear to affect the type of proteins adsorbed both directly and indirectly.24 However, additional follow-up studies are needed to determine the precise mechanism suggesting that the inhibition of adhesion of oral bacteria other than S. mutans and P. gingivalis can be used to treat not only the surface of implant fixtures, but also the surface of implants that penetrate soft tissues and implant abutments in order to reduce biofilm formation and mucosal inflammation and prevent peri-implantitis.
Conclusions
When the surface of titanium implants is coated with zirconia via ALD, the level of S. mutans and P. gingivalis adhesion is reduced regardless of the presence of zirconia crystal phases deposited on the surface. In terms of osteoblasts, however, there is a significant increase in osteoblast viability of the surface developing crystal phases following heat treatment.The osteoblast differentiation showed a marginally significant increase only in the surface forming crystal phases upon heat treatment. Thus, titanium implants with surface coated with zirconia via ALD can be used to reduce peri-implantitis by inhibiting the adhesion of oral bacteria such as S. mutans and P. gingivalis.To improve osseointegration by increasing osteoblast viability, additional studies investigating crystal phases on the surface coated with zirconia are needed.
Acknowledgments
This work was supported by the National Research Foundation of Korea (NRF) grant funded by the Korea government (MSIP) (No. 2020R1F1A107698211 and 2018R1A6A1A03024334).
Disclosure
The authors report no conflicts of interest in this work.
References
1. Sennerby L, Dasmah A, Larsson B, Iverhed M. Bone tissue responses to surface-modified zirconia implants: a histomorphometric and removal torque study in the rabbit. Clin Implant Dent Relat Res. 2005;7(Suppl 1):S13–20. doi:10.1111/j.1708-8208.2005.tb00070.x
2. Al-Radha AS, Dymock D, Younes C, O’Sullivan D. Surface properties of titanium and zirconia dental implant materials and their effect on bacterial adhesion. J Dent. 2012;40(2):146–153. doi:10.1016/j.jdent.2011.12.006
3. Ong CT, Ivanovski S, Needleman IG, et al. Systematic review of implant outcomes in treated periodontitis subjects. J Clin Periodontol. 2008;35(5):438–462. doi:10.1111/j.1600-051X.2008.01207.x
4. Sollazzo V, Pezzetti F, Scarano A, et al. Zirconium oxide coating improves implant osseointegration in vivo. Dent Mater. 2008;24(3):357–361. doi:10.1016/j.dental.2007.06.003
5. George SM. Atomic layer deposition: an overview. Chem Rev. 2010;110(1):111–131.
6. Johnson RW, Hultqvist A, Bent SF. A brief review of atomic layer deposition: from fundamentals to applications. Mater Today. 2014;17(5):236–246. doi:10.1016/j.mattod.2014.04.026
7. Hausmann DM, Kim E, Becker J, Gordon RG. Atomic layer deposition of hafnium and zirconium oxides using metal amide precursors. Chem Mater. 2002;14(10):4350–4358. doi:10.1021/cm020357x
8. Lee B, Choi KJ, Hande A, et al. A novel thermally-stable zirconium amidinate ALD precursor for ZrO2 thin films. Microelectron Eng. 2009;86(3):272–276. doi:10.1016/j.mee.2008.03.020
9. Zenkiewicz M. New method of analysis of the surface free energy of polymeric materials calculated with Owens-Wendt and Neumann methods. Polimery-W. 2006;51(7–8):584–587. doi:10.14314/polimery.2006.584
10. Ahn S-J, Ahn S-J, Wen ZT, Brady LJ, Burne RA. Characteristics of biofilm formation by Streptococcus mutans in the presence of saliva. Infect Immun. 2008;76(9):4259–4268. doi:10.1128/IAI.00422-08
11. Li YH, Tang N, Aspiras MB, et al. A quorum-sensing signaling system essential for genetic competence in Streptococcus mutans is involved in biofilm formation. J Bacteriol. 2002;184(10):2699–2708. doi:10.1128/JB.184.10.2699-2708.2002
12. Robertson J, McGoverin C, Vanholsbeeck F, Swift S. Optimisation of the protocol for the LIVE/DEAD® BacLightTM bacterial viability kit for rapid determination of bacterial load. Front Microbiol. 2019;10:801. doi:10.3389/fmicb.2019.00801
13. Wang D, Christensen K, Chawla K, Xiao G, Krebsbach PH, Franceschi RT. Isolation and characterization of MC3T3‐E1 preosteoblast subclones with distinct in vitro and in vivo differentiation/mineralization potential. J Bone Miner Res. 1999;14(6):893–903. doi:10.1359/jbmr.1999.14.6.893
14. Sudo H, Kodama H-A, Amagai Y, Yamamoto S, Kasai S. In vitro differentiation and calcification in a new clonal osteogenic cell line derived from newborn mouse calvaria. J Cell Biol. 1983;96(1):191–198. doi:10.1083/jcb.96.1.191
15. Leprince-Wang Y. Study of the initial stages of TiO2 growth on Si wafers by XPS. Surf Coat Technol. 2002;150(2–3):257–262. doi:10.1016/S0257-8972(01)01541-9
16. Kanomata K, Tokoro K, Imai T, et al. Room-temperature atomic layer deposition of ZrO2 using tetrakis(ethylmethylamino)zirconium and plasma-excited humidified argon. Appl Surf Sci. 2016;387:497–502. doi:10.1016/j.apsusc.2016.06.122
17. Kuratani K, Uemura M, Mizuhata M, Kajinami A, Deki S. Novel fabrication of high-quality ZrO2 ceramic thin films from aqueous solution. J Am Ceram Soc. 2005;88(10):2923–2927. doi:10.1111/j.1551-2916.2005.00522.x
18. Almaguer-Flores A, Silva-Bermudez P, Galicia R, Rodil SE. Bacterial adhesion on amorphous and crystalline metal oxide coatings. Mater Sci Eng C. 2015;57:88–99. doi:10.1016/j.msec.2015.07.031
19. Lamperti A, Lamagna L, Congedo G, Spiga S. Cubic/tetragonal phase stabilization in high-kappa ZrO2 thin films grown using O-3-based atomic layer deposition. J Electrochem Soc. 2011;158(10):G221–G226. doi:10.1149/1.3625254
20. Di Carlo F, Prosper L, Ripari F, Scarano A. Bone response to zirconia ceramic implants: an experimental study in rabbit. Key Eng Mater. 2000;192:403–407. doi:10.4028/www.scientific.net/KEM.192-195.403
21. Covacci V, Bruzzese N, Maccauro G, et al. In vitro evaluation of the mutagenic and carcinogenic power of high purity zirconia ceramic. Biomaterials. 1999;20(4):371–376. doi:10.1016/S0142-9612(98)00182-3
22. Hannink RHJ, Kelly PM, Muddle BC. Transformation toughening in zirconia-containing ceramics. J Am Ceram Soc. 2000;83(3):461–487. doi:10.1111/j.1151-2916.2000.tb01221.x
23. Djurado E, Bouvier P, Lucazeau G. Crystallite size effect on the tetragonal-monoclinic transition of undoped nanocrystalline zirconia studied by XRD and Raman spectrometry. J Solid State Chem. 2000;149(2):399–407. doi:10.1006/jssc.1999.8565
24. Gongadze E, Kabaso D, Bauer S, et al. Adhesion of osteoblasts to a nanorough titanium implant surface. Int J Nanomed. 2011;6:1801–1816.
25. Colon G, Ward BC, Webster TJ. Increased osteoblast and decreased Staphylococcus epidermidis functions on nanophase ZnO and TiO2. J Biomed Mater Res A. 2006;78a(3):595–604. doi:10.1002/jbm.a.30789
26. Han A, Tsoi JK, Rodrigues FP, Leprince JG, Palin WM. Bacterial adhesion mechanisms on dental implant surfaces and the influencing factors. Int J Adhes Adhes. 2016;69:58–71. doi:10.1016/j.ijadhadh.2016.03.022
27. Quirynen M, Bollen CML. The influence of surface-roughness and surface-free energy on supragingival and subgingival plaque-formation in man - a review of the literature. J Clin Periodontol. 1995;22(1):1–14. doi:10.1111/j.1600-051X.1995.tb01765.x
28. Pier‐Francesco A, Adams RJ, Waters MG, Williams DW. Titanium surface modification and its effect on the adherence of Porphyromonas gingivalis: an in vitro study. Clin Oral Implants Res. 2006;17(6):633–637. doi:10.1111/j.1600-0501.2006.01274.x
29. Poortinga AT, Bos R, Norde W, Busscher HJ. Electric double layer interactions in bacterial adhesion to surfaces. Surf Sci Rep. 2002;47(1):3–32. doi:10.1016/S0167-5729(02)00032-8
30. Knez M, Niesch K, Niinisto L. Synthesis and surface engineering of complex nanostructures by atomic layer deposition. Adv Mater. 2007;19(21):3425–3438. doi:10.1002/adma.200700079
 © 2021 The Author(s). This work is published and licensed by Dove Medical Press Limited. The full terms of this license are available at https://www.dovepress.com/terms.php and incorporate the Creative Commons Attribution - Non Commercial (unported, v3.0) License.
By accessing the work you hereby accept the Terms. Non-commercial uses of the work are permitted without any further permission from Dove Medical Press Limited, provided the work is properly attributed. For permission for commercial use of this work, please see paragraphs 4.2 and 5 of our Terms.
© 2021 The Author(s). This work is published and licensed by Dove Medical Press Limited. The full terms of this license are available at https://www.dovepress.com/terms.php and incorporate the Creative Commons Attribution - Non Commercial (unported, v3.0) License.
By accessing the work you hereby accept the Terms. Non-commercial uses of the work are permitted without any further permission from Dove Medical Press Limited, provided the work is properly attributed. For permission for commercial use of this work, please see paragraphs 4.2 and 5 of our Terms.