Back to Journals » International Journal of Chronic Obstructive Pulmonary Disease » Volume 12
Asynchrony in respiratory movements between the pulmonary lobes in patients with COPD: continuous measurement of lung density by 4-dimensional dynamic-ventilation CT
Authors Yamashiro T ![]() , Moriya H, Matsuoka S, Nagatani Y, Tsubakimoto M, Tsuchiya N, Murayama S
, Moriya H, Matsuoka S, Nagatani Y, Tsubakimoto M, Tsuchiya N, Murayama S
Received 22 April 2017
Accepted for publication 24 June 2017
Published 20 July 2017 Volume 2017:12 Pages 2101—2109
DOI https://doi.org/10.2147/COPD.S140247
Checked for plagiarism Yes
Review by Single anonymous peer review
Peer reviewer comments 3
Editor who approved publication: Prof. Dr. Richard Russell
Supplementary Video 2: The dynamic-ventilation computed tomography of non-COPD smoker (left) and COPD patients (right). Notes: Respiratory movements of the lung are smaller in COPD patient than in non-COPD smoker. In the axial plane of COPD patient, a p
Views: 321
Tsuneo Yamashiro,1 Hiroshi Moriya,2 Shin Matsuoka,3 Yukihiro Nagatani,4 Maho Tsubakimoto,1 Nanae Tsuchiya,1 Sadayuki Murayama1
On behalf of the ACTIve Study Group
1Department of Radiology, Graduate School of Medical Science, University of the Ryukyus, Nishihara, Okinawa, Japan; 2Department of Radiology, Ohara General Hospital, Fukushima-City, Fukushima, Japan; 3Department of Radiology, St Marianna University School of Medicine, Kawasaki, Kanagawa, Japan; 4Department of Radiology, Shiga University of Medical Science, Otsu, Shiga, Japan
Purpose: Four-dimensional dynamic-ventilation CT imaging demonstrates continuous movement of the lung. The aim of this study was to assess the correlation between interlobar synchrony in lung density and spirometric values in COPD patients and smokers, by measuring the continuous changes in lung density during respiration on the dynamic-ventilation CT.
Materials and methods: Thirty-two smokers, including ten with COPD, underwent dynamic-ventilation CT during free breathing. CT data were continuously reconstructed every 0.5 sec. Mean lung density (MLD) of the five lobes (right upper [RU], right middle [RM], right lower [RL], left upper [LU], and left lower [LL]) was continuously measured by commercially available software using a fixed volume of volume of interest which was placed and tracked on a single designated point in each lobe. Concordance between the MLD time curves of six pairs of lung lobes (RU-RL, RU-RM, RM-RL, LU-LL, RU-LU, and RL-LL lobes) was expressed by cross-correlation coefficients. The relationship between these cross-correlation coefficients and the forced expiratory volume in one second/forced vital capacity (FEV1.0/FVC) values was assessed by Spearman rank correlation analysis.
Results: In all six pairs of the pulmonary lobes, the cross-correlation coefficients of the two MLD curves were significantly positively correlated with FEV1.0/FVC (ρ =0.60–0.73, P<0.001). The mean value of the six coefficients strongly correlated with FEV1.0/FVC (ρ =0.80, P<0.0001).
Conclusion: The synchrony of respiratory movements between the pulmonary lobes is limited or lost in patients with more severe airflow limitation.
Keywords: computed tomography, chronic obstructive pulmonary disease, emphysema, airflow limitation, mean lung density
Introduction
In patients with smoking-induced COPD, many previous publications analyzing radiological findings have reported heterogeneous distributions of emphysema, airflow, or even blood flow in the affected lung. For example, multiple papers have demonstrated that heterogeneous emphysema distribution and inhomogeneous cluster sizes of emphysema exist in the lung by analyzing chest CT;1–5 that heterogeneous gas trapping and pulmonary volume changes are observed on paired inspiratory and expiratory CT scans;6–10 and that, on contrast-enhanced magnetic resonance (MR) imaging and hyperpolarized helium/xenon MR, both blood flow and airflow are distributed heterogeneously in the lung in COPD patients.11–13 Similar inhomogeneous air distribution in the lung by ventilation has also been confirmed by scintigraphy in COPD patients.14
While these observations of the COPD lung have been based on static imaging techniques, some reports using dynamic-ventilatory MR scanning have also demonstrated that asynchronized, heterogeneous movements are observed in the diaphragms or between the chest wall and the diaphragm.15–17 Although these MR scans are not able to visualize the motion of lung parenchyma directly, disconnected (paradoxical) respiratory movement between the chest wall and the diaphragm, which can be considered as the conventional “Hoover sign” at physical exam,18 implies that lung motion itself would be heterogeneous or asynchronized in patients with COPD.
Currently, 320-row and 256-row multidetector CT (MDCT) scanners can continuously scan the thorax under free breathing conditions, which first visualizes respiratory motion of the lung and bronchi directly and can be analyzed quantitatively using designated software or workstations.19,20 Although this 4-dimensional dynamic-ventilation CT currently scans a limited part of the whole lung (≤160 mm in length), the continuous mean lung density (MLD) values of the dynamic CT are measurable in the separated right and left lungs or at a certain tracked point in the lung using various software. Based on strong correlations between the MLD and lung volume (LV) values,21,22 the continuous change in MLD can be considered a good index to reflect respiratory changes in LV.
By using dynamic-ventilation CT, we have recently reported that asynchrony between lung movement and central airway movement exists in patients with severe COPD.20 Although there is no published information on asynchrony or heterogeneity in respiratory movements between or among the lungs, based on previous observations, it can be predicted that dynamic-ventilation CT during respiration would demonstrate some heterogeneous lung movements in paired continuous MLD measurements and bring novel perspectives to better understand COPD physiology.
Thus, we aimed to investigate asynchrony/heterogeneity in continuous lung density measurement of the lung on dynamic-ventilation CT and to assess the correlation with spirometric values in smokers with and without COPD.
Materials and methods
This study was approved by the Institutional Review Board at Ohara General Hospital. Written informed consent from enrolled patients was waived, since all examinations in this study were performed as part of routine clinical care. All patients’ data including CT scans and spirometric values were anonymized for analyses.
Subjects
Thirty-two smokers (16 ex-smokers and 16 current smokers; four females and 28 males; mean age 70±12 years) underwent spirometry and a chest CT at Ohara Medical Center attached to Ohara General Hospital. Among the 32 subjects, the data of 21 subjects were previously analyzed with a different objective for other research.20 They were scanned for preoperative assessment of resectable thoracic neoplasms (n=22) or for an assessment of COPD according to the criteria of the American Thoracic Society and European Respiratory Society (n=10).23 No patients had thoracic tumors with invasion of the chest wall or proximal airways.
CT scan
All patients were scanned on a 320-row MDCT scanner (Aquilion ONE, Toshiba Medical Systems, Otawara, Tochigi, Japan) for both conventional (static) and dynamic-ventilatory scans. Using the wide volume mode (non-helical mode), dynamic scanning was performed at a fixed point without bed movement, resulting in fluoroscopic images of 160 mm in length.19,20 Scanning field of view (FOV) was selected from two settings based on patient body habitus: 320 (medium, n=14) or 400 mm (large, n=18). Other scanning and reconstruction parameters for the dynamic-ventilation CT were as follows: tube currents =40 mA; tube voltage =120 kVp; rotation time =0.35 sec; total scanning time =4.0–6.5 sec; imaging FOV: 320 mm; collimation =0.5 mm; slice thickness =1 mm (without image interval or overlapping); reconstruction kernel = FC15 (for mediastinum); reconstruction interval =0.5 sec/frame (total 8–13 frames); and reconstruction method = half reconstruction. Scan data were converted to CT images using an iterative reconstruction method (Adaptive Iterative Dose Reduction using Three Dimensional Processing [AIDR3D], mild setting). Before the dynamic-ventilatory scanning, patients were coached to repeat deep breathing. Radiologic technologists monitored patients’ respiratory movements and confirmed that expiratory movement from the peak inspiratory phase to the peak expiratory phase was included during the scanning.
Conventional static chest CT was also performed using helical scanning to image the whole thorax. The parameters for the conventional chest CT were as follows: tube currents = automatic exposure control; tube voltage =120 kVp; scanning method = helical scanning; rotation time =0.35 sec; beam pitch =0.828; imaging FOV: 320 mm; collimation =0.5 mm ×80; slice thickness =1 mm; reconstruction kernel = FC17 (for mediastinum); iterative reconstruction = AIDR3D (mild setting).
Image analysis – continuous lung density measurement of the right and left lungs
Using commercially available software (Lung Volume Measurement, Toshiba Medical Systems), the MLD was measured automatically in each frame, and the time curve of the MLD on the dynamic-ventilatory scans was created. On the MLD curve, the inspiratory MLD was defined as the lowest MLD and expiratory MLD as the highest.
Since the whole lung could not be scanned within the 160 mm scan length, the LV was not measured in this experiment. The close correlation between changes in the MLD and those of LV was reported in a previous publication.21
Image analysis – continuous lung density measurement of the five lung lobes
Using another commercially available software program (PhyZiodynamics, Ziosoft Inc., Minato-ku, Tokyo, Japan), the MLD of each of the five lobes (right upper lobe [RUL], right middle lobe [RML], right lower lobe [RLL], left upper lobe [LUL], and left lower lobe [LLL]) was continuously measured. The software tracked on a single designated (center) point of a 3-dimensional spherical volume of interest (VOI) with a fixed volume (10 mm in radius) throughout the dynamic-ventilation CT (Figure 1, Video S1). Since the dynamic CT did not scan the whole thorax, the VOIs were placed at the following points in the five lung lobes: S3 in the RUL and LUL; S4 in the RML; S6 in the RLL and LLL.
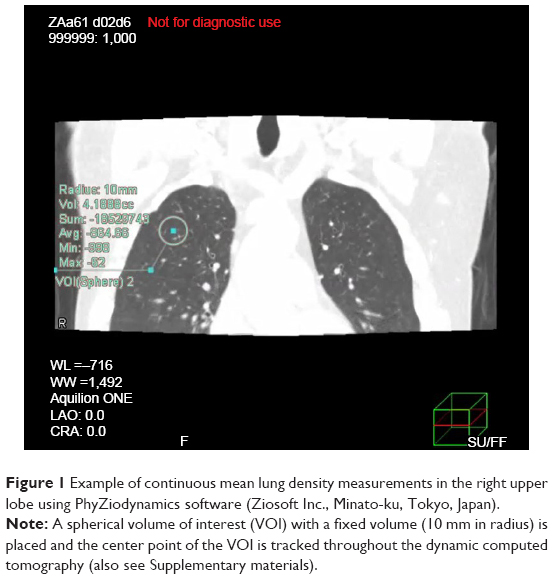 | Figure 1 Example of continuous mean lung density measurements in the right upper lobe using PhyZiodynamics software (Ziosoft Inc., Minato-ku, Tokyo, Japan). |
Similar to the right and left lung measurements, the inspiratory MLD was defined as the lowest MLD and expiratory MLD as the highest on the MLD curve in each lobe.
Image analysis – emphysema measurement on conventional chest CT
On the conventional helical CT scans, an emphysema measurement was performed using the LV measurement software. The percentage low attenuation volume (LAV%, <−950 HU) of the whole lung was obtained automatically.
Spirometry
All subjects performed spirometry, including forced expiratory volume in one second (FEV1.0) and forced vital capacity (FVC), according to American Thoracic Society standards.23 The spirometric values from the study participants are shown in Table 1. Spirometry was performed within 2 weeks of the chest CT.
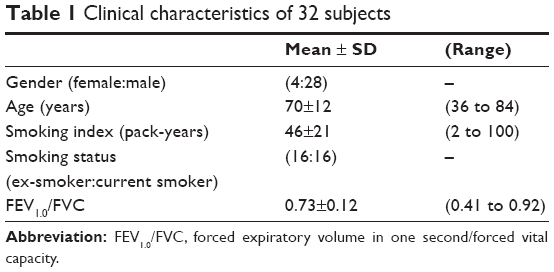 | Table 1 Clinical characteristics of 32 subjects |
Statistical analysis
Cross-correlation coefficients (−1≤ R ≤1) were calculated between the two time curves of the MLD (right–left lungs and six pairs of lung lobes). If the two time curves have similar shapes in direction over time, the coefficient approaches one.19,20 Spearman rank correlation analysis was used to evaluate the associations between the CT indices and the FEV1.0/FVC.
A P-value of <0.05 was considered significant. All statistical analyses were performed using JMP 12.0 software (SAS Institute Inc., Cary, NC, USA).
Results
Radiation dose assessment for dynamic-ventilation CT
For a single gantry rotation of 160 mm (0.35 sec), the CT dose index volume was 1.28 mGy for the medium scanning FOV or 1.41 mGy for the large FOV. The dose-length product value for a single rotation was 20.4 mGy cm (medium FOV) or 22.5 mGy cm (large FOV). The total estimated radiation exposure for the dynamic-ventilation CT for 4.0–6.5 sec varied from 3.7 to 6.1 mSv (mean 5.4 mSv).
Dynamic MLD and static LAV% measurements
During the dynamic-ventilation CT, the change in MLD ranged from 46.5 to 84.6 HU in the right/left lungs and in each lung lobe (right lung, 65.6 HU; left lung; 67.6 HU; RUL; 47.6 HU; RML, 46.5 HU; RLL, 84.6 HU; LUL, 52.2 HU; LLL, 78.3 HU, respectively). The changes in MLD were larger in the lower lobes than in the upper lobes. All MLD values, particularly at expiratory phase, were significantly correlated with FEV1.0/FVC (Table 2, Video S2). The expiratory MLD of the right and left lungs achieved the highest and the second highest correlation coefficients to FEV1.0/FVC (the right lung, ρ =0.78; the left lung, ρ =0.74; P<0.0001 for both). The LAV% of the whole lung also significantly correlated with FEV1.0/FVC (ρ =−0.73, P<0.0001) (Table 2).
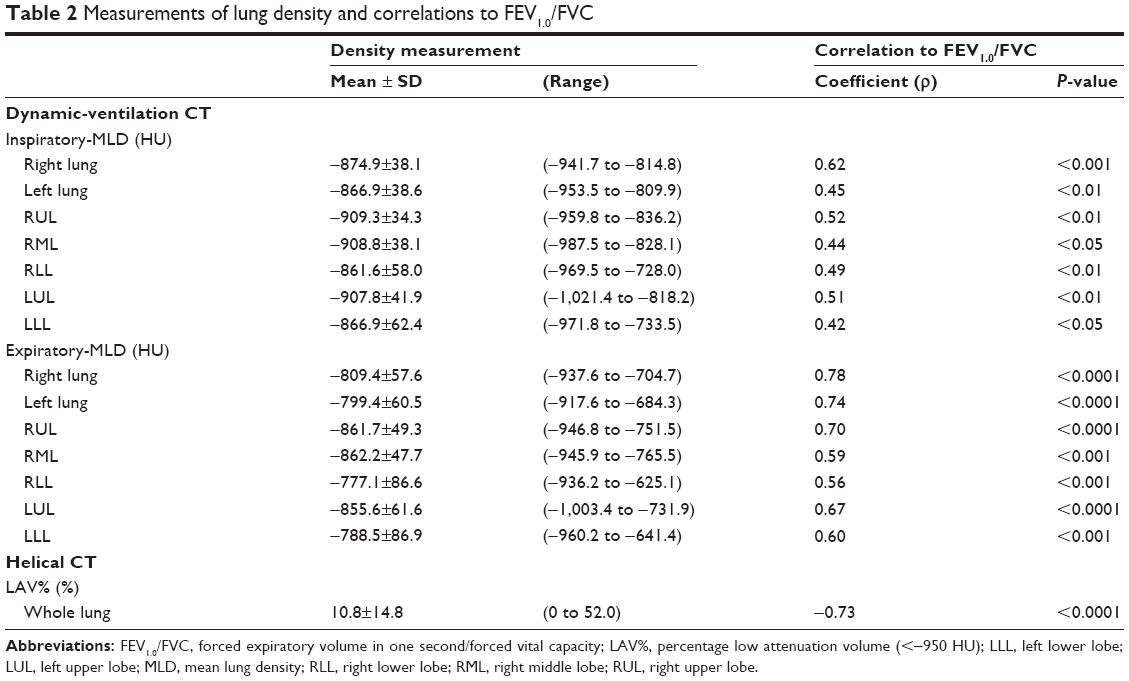 | Table 2 Measurements of lung density and correlations to FEV1.0/FVC |
Synchrony of MLD curves between the right and left lungs
The cross-correlation coefficient between the two MLD curves of the right and left lungs was significantly correlated with the FEV1.0/FVC (ρ =0.66, P<0.0001) (Table 3, Figure 2). This implies that the synchrony between the right and left lung movements was limited in severe COPD patients compared with smokers without airflow limitation.
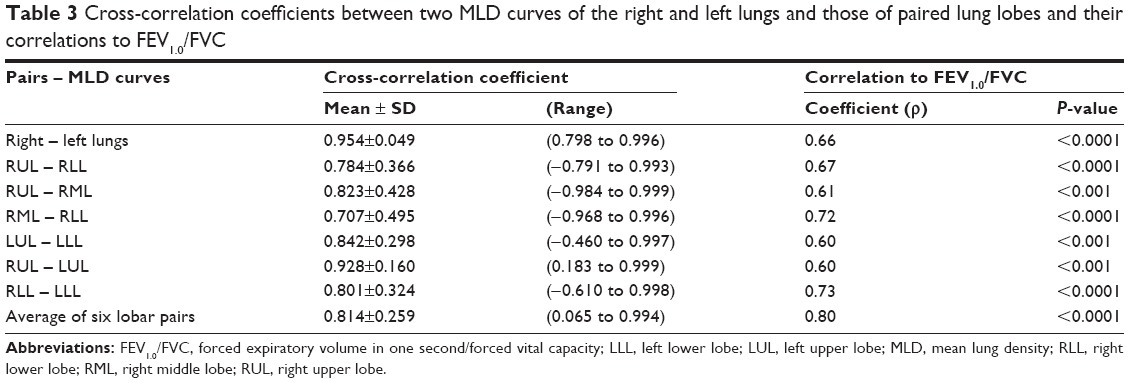 | Table 3 Cross-correlation coefficients between two MLD curves of the right and left lungs and those of paired lung lobes and their correlations to FEV1.0/FVC |
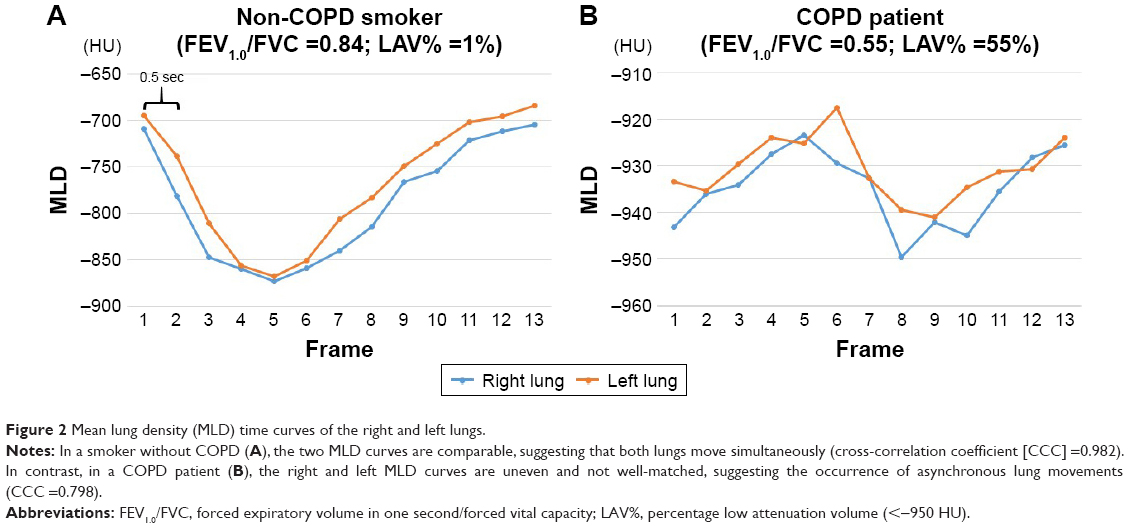 | Figure 2 Mean lung density (MLD) time curves of the right and left lungs. |
Synchrony of MLD curves between the paired lung lobes
Similar to the cross-correlation between the right and left lungs, the cross-correlation coefficients of the two MLD curves from all six pairs of the pulmonary lobes were significantly positively correlated with FEV1.0/FVC (ρ =0.60 −0.73, P<0.001) (Table 3, Figure 3). Further, the mean value of the six coefficients from the six lobar pairs strongly correlated with FEV1.0/FVC (ρ =0.80, P<0.0001) (Figure 4), which was the highest correlation in this study. These observations suggested that the synchrony of respiratory movements among the lung lobes was limited and lost in severe COPD patients.
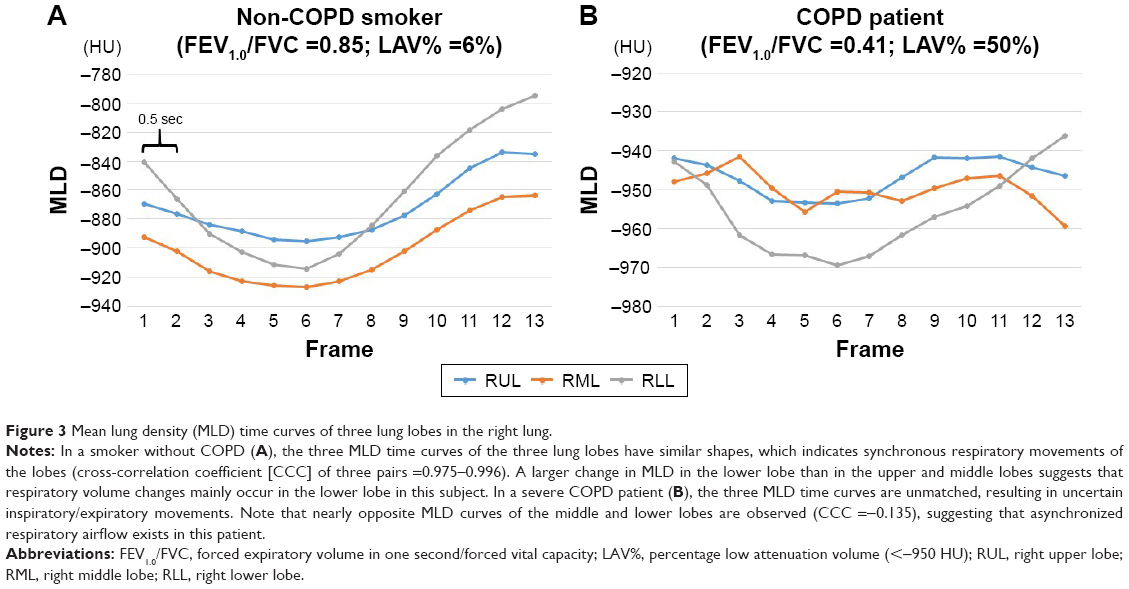 | Figure 3 Mean lung density (MLD) time curves of three lung lobes in the right lung. |
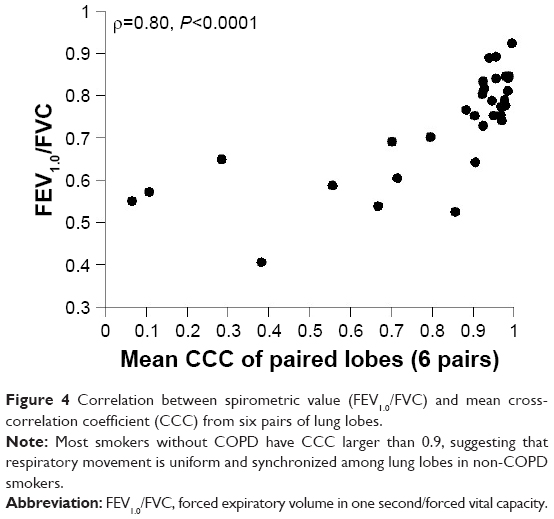 | Figure 4 Correlation between spirometric value (FEV1.0/FVC) and mean cross-correlation coefficient (CCC) from six pairs of lung lobes. |
Correlation between synchrony of MLD curves and emphysema index
Significant and insignificant correlations were found between LAV% of the whole lung and cross-correlation coefficients of paired MLD curves (Table 4). This implies that the extent of emphysema may partially cause asynchrony of inter-lung and interlobar movements but that emphysema severity would not be the sole factor of heterogeneous lung movements observed in severe COPD patients.
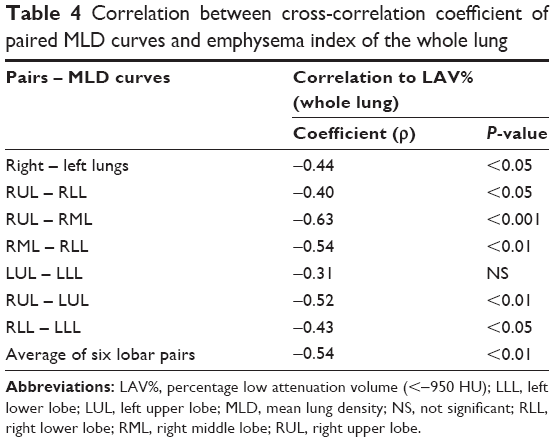 | Table 4 Correlation between cross-correlation coefficient of paired MLD curves and emphysema index of the whole lung |
Discussion
In this study, we first examined continuous MLD measurement on dynamic-ventilation CT in the separated right and left lungs and in five lung lobes and found that synchrony in MLD curves between the paired right-left lungs or paired lung lobes was reduced in severe COPD patients. These observations lead to the concept that respiratory movement of the lung would be heterogeneous or asynchronized (pantomime-like movement) as COPD progresses. The dynamic-ventilation CT which directly depicts respiratory lung movement shows the previously unknown, ambiguous physiological phenomena of COPD, which may be expanded to therapeutic strategies for the management of COPD.
Although this is the first study demonstrating heterogeneous asynchronized lung movement using 4-dimensional CT, inhomogeneous air distribution by ventilation in COPD patients has been demonstrated by several different imaging modalities, including xenon-inhaled (xenon-enhanced) CT scanning using a dual-energy technique.24–26 The latest study analyzing xenon-CT in COPD patients has shown that decreased air distribution is observed even in the non-emphysematous, apparently normal lung areas, suggesting the presence of other coexisting conditions such as proximal or small airway disease in COPD.25 Considering that inhomogeneous air distribution by ventilation has also been demonstrated by paired inspiratory and expiratory CT6–9 and hyperpolarized xenon or helium MR,12,13 our observation of asynchronized, heterogeneous lung movement by ventilation in COPD is consistent with these previous publications and further expands the 4-dimensional imaging approach.
It is still difficult to explain why this heterogeneous, asynchronized respiratory movement in the lung is observed on dynamic-ventilation CT in patients with COPD. However, there are several potential components that prevent uniform (homogeneous) lung movement in COPD. For example, inhomogeneous distribution and heterogeneous progress of pulmonary emphysema must cause heterogeneous respiratory movement of the lung; more progressed, emphysematous parts would not move largely during ventilation, while the normal or less affected lung areas would greatly inflate/deflate. Also, various degrees of proximal airway disease at different points in COPD can lead to heterogeneous respiratory movement of the lung (Video S2). The pulmonary lobe or segment with more severe airway disease (bronchial wall thickening and narrowed luminal size) would show delayed, prolonged expiration compared with other lobes/segments without severe airway disease. Further, disconnection between chest wall movement and diaphragmatic movement and those between the right and left diaphragmatic movement in COPD, which has already been reported by dynamic-ventilation MR,16 are also important to understand heterogeneous lung movements between the right and left lungs and between the upper and lower lobes observed in this study. In other words, all significant factors of COPD, such as emphysema, airway disease, and abnormalities of extrapulmonary structures (flattened diaphragms or thinned respiratory muscles), may integratively lead to asynchronized, heterogeneous lung movements in COPD.
If asynchrony or heterogeneity in lung movement is truly important to understand COPD physiology, it would be of interest to monitor the change in the asynchrony/heterogeneity before and after therapeutic interventions in COPD patients. Medications such as bronchodilators and also respiratory rehabilitation methods may result in a decrease in the asynchrony/heterogeneity of lung movement. Suga et al have reported that asynchronized, paradoxical movements of the right and left diaphragms are restored after LV reduction surgery, as evaluated with dynamic-ventilation MR.17 We have started planning future studies in order to expand our observations to clinical care of COPD patients, based on a prediction that the asynchrony/heterogeneity of lung movement can be used as a comprehensive physiological CT index in COPD and would be improved after a combination of different therapeutic approaches for COPD patients. Also, MLD curves from the two adjacent lobes with very different or opposite shapes (Figure 3) may imply the presence of collateral ventilation between these lobes. Since collateral ventilation prevents successful endobronchial valve treatment for severe COPD patients,27 dynamic-ventilation CT may have a clinical role, similar to the conventional catheter-based endobronchial measurement method, in determining the usefulness of valve treatment. Although this study demonstrates purely physiological aspects of COPD by using dynamic-ventilation CT, future studies may reveal more advantages of dynamic-ventilation CT in daily clinical care for COPD patients, such as the combination of paradoxical airway movement20 and heterogeneity of lobar movement which may be a target for intrabronchial stenting or other therapeutic options.
This study has several limitations which should be noted. First, the total number of enrolled subjects was small, particularly the number of COPD patients. The very small number of female COPD patients (n=2) may raise the question of whether our observations are applicable to all COPD patients. Also, many enrolled patients underwent the dynamic CT scan as a preoperative assessment for tumor invasion or adhesion to the pleura. Although we confirmed that no patient had a large tumor which invaded the adjacent structures or occluded the proximal bronchi, our observations should be reproduced among smokers/COPD patients without thoracic neoplasms in the future. Second, the dynamic-ventilation CT could not scan the entire thorax. Although we believed that it was best at the moment to utilize the MLD measurement instead of right and left LV measurements, true respiratory changes in LV could not be measured. Third, due to the limited scan field, the VOI in each lung lobe was small and it was unclear whether or not the measured MLD in the VOI truly represented the respiratory movement of the targeted lobe. Since we found that interlobar asynchrony or heterogeneity in respiratory movement existed in severe COPD patients, such asynchrony may be observed even in the single lung lobe, which was not able to be assessed by our current method. In future studies, the current technique should be improved by multiple VOI measurements in each lobe or more comprehensive, dynamic measurements of the entire scanned lung. Also, weaker correlations between spirometric values and expiratory MLD of the lower lobes than those of the upper lobes, which is discordant to previous studies analyzing CT-based LV on combined inspiratory and expiratory scans,9 may have been due to the small VOI which could not cover the entire lower lobes. Fourth, we evaluated correlations between CT data and spirometric values only, which should be expanded with more physiological and clinical parameters such as plethysmographic values or the 6-minute walk test.
Conclusion
We have reported that the synchrony of respiratory movements between the right and left lungs and between the pulmonary lobes is limited or lost in COPD patients with more severe airflow limitation. Asynchrony/heterogeneity in lung movements, which can be exclusively observed by the 4-dimensional dynamic-ventilation CT, may be an important clue to comprehend the pathophysiology of COPD.
Acknowledgments
University of the Ryukyus, Ohara General Hospital, and Shiga University of Medical Science received a research grant from Toshiba Medical Systems. University of the Ryukyus also received a research grant from Ziosoft Inc.
This retrospective study was arranged as part of the Area-detector Computed Tomography for the Investigation of Thoracic Diseases (ACTIve), a multicenter research alliance in Japan. The authors thank Mr Shinsuke Tsukagoshi, Mr Tatsuya Kimoto, (Toshiba Medical Systems), and Mr Yasuhiro Kondo (Ziosoft) for their technical support.
The ACTIve Study Group currently consists of the following institutions:
Ohara General Hospital, Fukushima-City, Fukushima, Japan (Kotaro Sakuma, MD, Hiroshi Moriya, MD, PhD); Saitama International Medical Center, Saitama Medical University, Hidaka, Saitama, Japan (Fumikazu Sakai, MD, PhD); Kanagawa Cardiovascular and Respiratory Center, Yokohama, Kanagawa, Japan (Tae Iwasawa, MD, PhD); Shiga University of Medical Science, Otsu, Shiga, Japan (Yukihiro Nagatani, MD, Norihisa Nitta, MD, Kiyoshi Murata, MD); Osaka University, Suita, Osaka, Japan (Masahiro Yanagawa, MD, PhD, Osamu Honda, MD, PhD, Noriyuki Tomiyama, MD, PhD); Osaka Medical College, Takatsuki, Osaka, Japan (Mitsuhiro Koyama, MD, PhD); Tenri Hospital, Tenri, Nara, Japan (Yuko Nishimoto, MD, Satoshi Noma, MD, PhD); Kobe University, Kobe, Hyogo, Japan (Yoshiharu Ohno, MD, PhD); Okayama University, Okayama-City, Okayama, Japan (Katsuhide Kojima, MD); University of the Ryukyus, Nishihara, Okinawa, Japan (Tsuneo Yamashiro, MD, Yanyan Xu, MD, Maho Tsubakimoto, MD, Nanae Tsuchiya, MD, PhD, Sadayuki Murayama, MD, PhD).
Disclosure
Dr Yamashiro receives a research grant from the Japan Society for the Promotion of Science (Kakenhi-16K19837). The authors report no conflicts of interest in this work.
References
Mishima M, Hirai T, Itoh H, et al. Complexity of terminal airspace geometry assessed by lung computed tomography in normal subjects and patients with chronic obstructive pulmonary disease. Proc Natl Acad Sci U S A. 1999;96(16):8829–8834. | ||
Park YS, Seo JB, Kim N, et al. Texture-based quantification of pulmonary emphysema on high-resolution computed tomography: comparison with density-based quantification and correlation with pulmonary function test. Invest Radiol. 2008;43(6):395–402. | ||
Chabat F, Yang GZ, Hansell DM. Obstructive lung diseases: texture classification for differentiation at CT. Radiology. 2003;228(3):871–877. | ||
Chae EJ, Seo JB, Song JW, et al. Slope of emphysema index: an objective descriptor of regional heterogeneity of emphysema and an independent determinant of pulmonary function. AJR Am J Roentgenol. 2010;194(3):W248–W255. | ||
Hwang J, Lee M, Lee SM, et al. A size-based emphysema severity index: robust to the breath-hold-level variations and correlated with clinical parameters. Int J Chron Obstruct Pulmon Dis. 2016;11:1835–1841. | ||
Salito C, Barazzetti L, Woods JC, Aliverti A. Heterogeneity of specific gas volume changes: a new tool to plan lung volume reduction in COPD. Chest. 2014;146(6):1554–1565. | ||
Aliverti A, Pennati F, Salito C, Woods JC. Regional lung function and heterogeneity of specific gas volume in healthy and emphysematous subjects. Eur Respir J. 2013;41(5):1179–1188. | ||
Koyama H, Ohno Y, Fujisawa Y, et al. 3D lung motion assessments on inspiratory/expiratory thin-section CT: capability for pulmonary functional loss of smoking-related COPD in comparison with lung destruction and air trapping. Eur J Radiol. 2016;85(2):352–359. | ||
Kitano M, Iwano S, Hashimoto N, Matsuo K, Hasegawa Y, Naganawa S. Lobar analysis of collapsibility indices to assess functional lung volumes in COPD patients. Int J Chron Obstruct Pulmon Dis. 2014;9:1347–1356. | ||
Nishino M, Roberts DH, Sitek A, Raptopoulos V, Boiselle PM, Hatabu H. Loss of anteroposterior intralobar attenuation gradient of the lung: correlation with pulmonary function. Acad Radiol. 2006;13(5):589–597. | ||
Jang YM, Oh YM, Seo JB, et al. Quantitatively assessed dynamic contrast-enhanced magnetic resonance imaging in patients with chronic obstructive pulmonary disease: correlation of perfusion parameters with pulmonary function test and quantitative computed tomography. Invest Radiol. 2008;43(6):403–410. | ||
Kirby M, Svenningsen S, Owrangi A, et al. Hyperpolarized 3He and 129Xe MR imaging in healthy volunteers and patients with chronic obstructive pulmonary disease. Radiology. 2012;265(2):600–610. | ||
Kirby M, Svenningsen S, Kanhere N, et al. Pulmonary ventilation visualized using hyperpolarized helium-3 and xenon-129 magnetic resonance imaging: differences in COPD and relationship to emphysema. J Appl Physiol (1985). 2013;114(6):707–715. | ||
Satoh K, Takahashi K, Sasaki M, et al. Comparison of 99mTc-Technegas SPECT with 133Xe dynamic SPECT in pulmonary emphysema. Ann Nucl Med. 1997;11(3):201–206. | ||
Iwasawa T, Kagei S, Gotoh T, et al. Magnetic resonance analysis of abnormal diaphragmatic motion in patients with emphysema. Eur Respir J. 2002;19(2):225–231. | ||
Suga K, Tsukuda T, Awaya H, et al. Impaired respiratory mechanics in pulmonary emphysema: evaluation with dynamic breathing MRI. J Magn Reson Imaging. 1999;10(4):510–520. | ||
Suga K, Tsukuda T, Awaya H, Matsunaga N, Sugi K, Esato K. Interactions of regional respiratory mechanics and pulmonary ventilatory impairment in pulmonary emphysema: assessment with dynamic MRI and xenon-133 single-photon emission CT. Chest. 2000;117(6):1646–1655. | ||
Garcia-Pachon E. Paradoxical movement of the lateral rib margin (Hoover sign) for detecting obstructive airway disease. Chest. 2002;122(2):651–655. | ||
Yamashiro T, Tsubakimoto M, Nagatani Y, et al. Automated continuous quantitative measurement of proximal airways on dynamic ventilation CT: initial experience using an ex vivo porcine lung phantom. Int J Chron Obstruct Pulmon Dis. 2015;10:2045–2054. | ||
Yamashiro T, Moriya H, Tsubakimoto M, Matsuoka S, Murayama S. Continuous quantitative measurement of the proximal airway dimensions and lung density on four-dimensional dynamic-ventilation CT in smokers. Int J Chron Obstruct Pulmon Dis. 2016;11:755–764. | ||
Yamashiro T, Matsuoka S, Bartholmai BJ, et al. Collapsibility of lung volume by paired inspiratory and expiratory CT scans: correlations with lung function and mean lung density. Acad Radiol. 2010;17(4):489–495. | ||
Kundu S, Gu S, Leader JK, et al. Assessment of lung volume collapsibility in chronic obstructive lung disease patients using CT. Eur Radiol. 2013;23(6):1564–1572. | ||
Vestbo J, Hurd SS, Agusti AG, et al. Global strategy for the diagnosis, management, and prevention of chronic obstructive pulmonary disease: GOLD executive summary. Am J Respir Crit Care Med. 2013;187(4):347–365. | ||
Park EA, Goo JM, Park SJ, et al. Chronic obstructive pulmonary disease: quantitative and visual ventilation pattern analysis at xenon ventilation CT performed by using a dual-energy technique. Radiology. 2010;256(3):985–997. | ||
Kyoyama H, Hirata Y, Kikuchi S, et al. Evaluation of pulmonary function using single-breath-hold dual-energy computed tomography with xenon: results of a preliminary study. Medicine (Baltimore). 2017;96(3):e5937. | ||
Lee SM, Seo JB, Hwang HJ, et al. Assessment of regional emphysema, air-trapping and Xenon-ventilation using dual-energy computed tomography in chronic obstructive pulmonary disease patients. Eur Radiol. 2017;27(7):2818–2827. | ||
Herzog D, Thomsen C, Poellinger A, et al. Outcomes of endobronchial valve treatment based on the precise criteria of an endobronchial catheter for detection of collateral ventilation under spontaneous breathing. Respiration. 2016;91(1):69–78. |
 © 2017 The Author(s). This work is published and licensed by Dove Medical Press Limited. The
full terms of this license are available at https://www.dovepress.com/terms
and incorporate the Creative Commons Attribution
- Non Commercial (unported, 3.0) License.
By accessing the work you hereby accept the Terms. Non-commercial uses of the work are permitted
without any further permission from Dove Medical Press Limited, provided the work is properly
attributed. For permission for commercial use of this work, please see paragraphs 4.2 and 5 of our Terms.
© 2017 The Author(s). This work is published and licensed by Dove Medical Press Limited. The
full terms of this license are available at https://www.dovepress.com/terms
and incorporate the Creative Commons Attribution
- Non Commercial (unported, 3.0) License.
By accessing the work you hereby accept the Terms. Non-commercial uses of the work are permitted
without any further permission from Dove Medical Press Limited, provided the work is properly
attributed. For permission for commercial use of this work, please see paragraphs 4.2 and 5 of our Terms.