Back to Journals » Diabetes, Metabolic Syndrome and Obesity » Volume 13
Asymptomatic Hyperuricemia Associates with Cardiometabolic Risk Indicators in Overweight/Obese but Not in Lean Adolescents
Authors Sebekova K ![]() , Gurecka R
, Gurecka R ![]() , Podracka L
, Podracka L ![]()
Received 16 June 2020
Accepted for publication 15 August 2020
Published 27 October 2020 Volume 2020:13 Pages 3977—3992
DOI https://doi.org/10.2147/DMSO.S267123
Checked for plagiarism Yes
Review by Single anonymous peer review
Peer reviewer comments 2
Editor who approved publication: Dr Konstantinos Tziomalos
Katarina Sebekova,1 Radana Gurecka,1,2 Ludmila Podracka3,4
1Institute of Molecular BioMedicine, Faculty of Medicine, Comenius University, Bratislava, Slovakia; 2Institute of Medical Physics, Biophysics, Informatics and Telemedicine, Faculty of Medicine, Comenius University, Bratislava, Slovakia; 3Department of Pediatrics, Faculty of Medicine, Comenius University, Bratislava, Slovakia; 4The National Institute of Children’s Health, Bratislava, Slovakia
Correspondence: Katarina Sebekova
Institute of Molecular BioMedicine, Medical Faculty, Comenius University, Sasinkova 4, 811 08 Bratislava, Slovakia
Tel +421-2-9011-9429
Fax +421-2-9011-9631
Email [email protected]
Purpose: In overweight/obese adolescents, asymptomatic hyperuricemia is associated with increased prevalence of metabolic syndrome, its components, and a higher cardiometabolic risk. Whether similar associations exist in lean hyperuricemic adolescents is unknown.
Subjects and Methods: In 2424 adolescents (51.9% females) aged 16– 19 years, anthropometric variables, blood pressure, uric acid, glucose, insulin, lipid profile, inflammatory markers, and renal function were determined. Continuous cardiometabolic score was calculated. Normouricemic vs hyperuricemic subjects were compared among lean and overweight/obese individuals of both sexes.
Results: Females (5.4%) and males (13.3%) presented with hyperuricemia; among them 63% of females and 53% of males were lean. In both sexes, hyperuricemic lean and hyperuricemic overweight/obese adolescents displayed similar uric acid concentrations (eg, males: 455± 30 vs 461± 32 μmol/L, respectively, p=0.933). Lean normouricemic adolescents manifested significantly lower uric acid levels than their overweight/obese peers (eg, males: 333± 46 vs 357± 41 μmol/L, respectively, p< 0.001). Lean normouricemic and hyperuricemic subjects presented similar cardiometabolic score (eg, males: 2.60± 0.67 vs 2.64± 0.60, respectively, p=0.998); among overweight/obese adolescents those with hyperuricemia displayed higher scores compared with their normouricemic counterparts (eg, males: 3.36± 1.04 vs 4.21± 1.65, respectively, p< 0.001). A decision-tree model revealed phenotypes associated with higher uricemia, however, distribution of individuals with hyperuricemia among phenotypes was random.
Conclusion: In lean adolescents, hyperuricemia is not associated with cardiometabolic profile indicating an increased risk. Existence of this rather prevalent phenotype remains undetected unless lean and overweight/obese subjects are analyzed separately. Longitudinal studies are needed to elucidate the potential clinical consequences of asymptomatic hyperuricemia in lean subjects in later life.
Keywords: uric acid, continuous cardiometabolic score, sex-difference, obesity, lean phenotype
Introduction
In humans, uric acid is a bioactive end-product of purine metabolism and is excreted mainly via urine. Although uric acid is not part of any definition of metabolic syndrome (MetS), studies in adolescents document a significant correlation between uricemia and components of MetS, and other cardiovascular disease indicators, eg, inflammatory markers or glomerular filtration rate.1–5 Serum uric acid (SUA) levels rise with increasing number of manifested MetS components, the prevalence of MetS rises across quartiles of SUA, and clustering of cardiometabolic risk factors with rising SUA levels imposes increased cardiometabolic risk.3,4,6 High baseline SUA levels during adolescence are associated with higher risk of later development of hypertension, and in males also of MetS.7
Body mass index (BMI) and waist circumference generally display the highest correlation with SUA,2–4 suggesting that obesity and central fat distribution play a major role linking hyperuricemia with cardiometabolic risk factors clustering in MetS. However, the 12-year trend in Japanese adolescent males showed a significant decrease in mean BMI, associated with an increase of mean SUA levels and the prevalence of hyperuricemia.1 Data from the US adolescents also suggest that a proportion of hyperuricemic adolescents are nonobese.8 The world-wide rocketing incidence of obesity in youth prompted several studies on the association of hyperuricemia with MetS, its components, and other cardiometabolic risk markers in obese children and adolescents.9–13 In contrast, the prevalence of hyperuricemia, and whether hyperuricemia is associated with cardiometabolic profile indicating an increased risk in nonobese adolescents, remains largely unknown.
We assumed that a higher proportion of hyperuricemic adolescents are overweight/obese rather than lean; and that both lean and overweight/obese hyperuricemic adolescents present worse cardiometabolic characteristics and a worse continuous cardiometabolic score (a proxy measure of cardiometabolic risk) compared with their normouricemic peers. Due to sex-differences in the pathophysiology of MetS and in the prevalence of MetS components,14,15 we anticipated sex-differences in association of metabolic factors with SUA and in their clustering patterns. To verify our hypothesis, we analyzed data obtained from 2424 apparently healthy 16–19-year-old adolescents.
Methods
Study Design and Subjects
We performed a secondary analysis of data obtained in the cross-sectional study “Respect for Health“ which aimed to assess the health status of secondary school students in the Bratislava region. Information on study objectives and procedures was provided to parents and students at school meetings. Participation was voluntary; a signed informed consent to participate was required from full-aged participants, in minors from their parents or legal guardians. The survey was carried out in accordance with the Declaration of Helsinki, after approval of the protocol by The Ethics Board of the Health Department of the Bratislava Self-governing Region.
Study design had been described in detail previously.16 Briefly, any acute or chronic illness, in females pregnancy or lactation were exclusion criteria. Anthropometric, blood chemistry and hematology data were obtained from 2960 students aged 11–23 years. After exclusion of non-Caucasians, potential diabetics, adolescents presenting C-reactive protein (CRP) concentration >10 mg/L, estimated glomerular filtration rate <1 mL/s/1.73 m2, and those aged ≤15 or ≥20 years, data from 2424 White Caucasians of Central European descent (51.9% females) aged 16–19 years were analyzed.
Measurements
Anthropometric measurements were performed by trained personnel in accordance with standard anthropometric guidelines, on barefoot students wearing light clothing. Height was measured using a potable extendable stadiometer, waist circumference using a flexible tape, body weight employing digital scales (Omron BF510, Kyoto, Japan). BMI and waist-to-height ratio (WHtR) were calculated.
Blood pressure (BP) was measured in seated subjects on a dominant arm after 10 min rest, three times in five-minute intervals, using a digital monitor (Omron M-6 Comfort, Kyoto, Japan). The mean of the last two measurements was recorded.
Blood was collected from antecubital vein after overnight fasting. In the central laboratory, plasma glucose, insulin, total cholesterol, high-density lipoprotein cholesterol (HDL-C), triacylglycerols, creatinine, uric acid, and high sensitive CRP were analyzed using standard laboratory methods (Advia 2400 analyzer, Siemens, Germany). Blood count was performed (Sysmex XE-2100 analyzer, Sysmex Corporation, Kobe, Japan). Insulin resistance was estimated using the Homeostasis Model Assessment for Insulin Resistance (HOMA-IR),17 low-density lipoprotein cholesterol (LDL-C) was calculated using Friedewald formula, atherogenic index of plasma as log (triacylglycerols/HDL-C),18 estimated glomerular filtration rate employing the equation for the full age spectrum,19 and continuous cardiometabolic score according to the modified formula of Soldatovic et al,20 eg, WHtR/0.5+fasting glycemia/5.6+triacylglycerols/1.7+SBP/130−HDL-C/1.02 (males) or 1.28 (females)+fasting insulinemia/20+CRP/3. To clarify whether the increase in the score is conditional only on the presence of obesity, alternatively we calculated the score after omitting the WHtR component.
Definition of Hyperuricemia, Cardiometabolic Risk Factors and Metabolic Syndrome
Hyperuricemia was classified as SUA concentration ≥340 μmol/L in females, and ≥420 μmol/L in males, according to the age- and sex-specific reference ranges of the laboratory.
Presence of general overweight/obesity was classified using the international age- and sex-specific cutoff points for BMI in 16–18-year olds,21 and as BMI ≥25 kg/m2 in individuals aged ≥18 years. Centrally obese were considered as individuals displaying WHtR ≥0.5. Adolescents presenting either with general overweight/obesity or central obesity were classified as overweight/obese, those not meeting either criteria, as lean.
MetS was defined as a presence of at least three cardiometabolic risk factors: elevated BP, eg SBP ≥130 mmHg and/or DBP ≥85 mmHg; elevated triacylglycerols (≥1.7 mmol/L), low HDL-C (males: <1.03 mmol/L, females: <1.29 mmol/L); elevated fasting glycemia (≥5.6 mmol/L), central obesity (WHtR ≥0.5). Moreover, the concentration of fasting insulin ≥20 μIU/mL,22 CRP >3 mg/L,23 or atherogenic index ≥0.1118 were also considered as markers of increased cardiometabolic risk.
Statistical Analysis
Data distribution was checked by using the D’Agostino’s test. Skewed data were logarithmically transformed. Two sets of continuous variables were compared by using the two-sided unpaired Student’s t-test. Proportions were compared employing the two-sided Fisher’s exact test. In both sexes, individuals were classified according to the presence/absence of hyperuricemia, and presence/absence of overweight/obesity. Between-group comparison of SUA and proxy measures of obesity was performed employing analysis of variance (ANOVA) with post hoc Bonferroni test to correct for multiple comparisons. In all other variables, four groups were compared using the two-factor ANOVA, with categorized SUA status and that of overweight/obesity entered as fixed factors, and their interaction. Binary logistic regression analyses with each single cardiometabolic risk factor or maker, or MetS as dependent variables and SUA and overweight/obesity status as covariates were performed. Odds were adjusted for the first category, ie, lean normouricemic subjects. Pearson’s or Spearman's correlation coefficients were calculated. Whereas the number of subjects in the groups differed, we used the Fisher's r-to-z transformation (two-sided) to assess the significance of the difference between two correlation coefficients. Results of normally distributed data are presented as the mean ±SD, of data analyzed after log transformation as back-transformed geometric mean (interval −1SD, +1SD), as odds and 95%CI or as counts and percentages. To detect and visualize interaction patterns of independent variables affecting SUA, and to predict outcomes, a decision-tree model employing a chi-squared automatic interaction detection was employed. Independent categorized variables, (eg, elevated/nonelevated BP, glycemia, insulinemia, triacylglycerols, atherogenic index, CRP; low/not decreased HDL-C; estimated glomerular filtration rate ≥/< the median; and in overweight/obese groups also presence/absence of central obesity, and general overweight/obesity), and age as an influence variable were entered into the model. A p-value of <0.05 was considered as statistically significant. Analyses were performed by using GraphPad Prism v. 6.0 software (GraphPad Software, San Diego, CA, USA), and SPSS v.16 for Windows software (SPSS Inc., Chicago, IL, USA).
Results
Males differed from females in all variables except for age, HOMA-IR, triacylglycerolemia, and the prevalence of hypertriacylglycerolemia (SuppIementary Table S1). In the whole cohort, 9.2% of adolescents were hyperuricemic, 76.3% were lean.
Females
Among 1259 females, 79% were lean, and 5.3% presented hyperuricemia (Table 1). Twenty normouricemic females presented isolated central obesity, 118 displayed only general overweight/obesity, and 82 displayed both types of obesity. Their SUA levels averaged 259±34 μmol/L, 268±43 μmol/L, and 269±44 μmol/L, respectively (p=0.620). Four hyperuricemic females were centrally obese, eight presented isolated general overweight/obesity, and 14 were concurrently overweight/obese and centrally obese, presenting SUA concentrations of 394±84 μmol/L, 379±36 μmol/L, and 367±21 μmol/L, respectively (p=0.469). As the type of obesity did not affect uricemia significantly, females presenting either type of obesity were combined into overweight/obese (normouricemic or hyperuricemic) groups. Mean SUA levels (252±49 μmol/L), as well as the prevalence of hyperuricemia (4.1%) were lower in lean, compared with overweight/obese, females (279±53 μmol/L and 10.6%, respectively; p<0.001, both) and 61.8% of hyperuricemic females were lean. Lean hyperuricemic females presented about 49% higher mean SUA levels compared with their normouricemic peers; while in overweight/obese hyperuricemic vs normouricemic females the difference reached about 40% (Figure 1A). Normouricemic lean females presented lower mean SUA levels compared with their overweight/obese counterparts (p<0.001); hyperuricemic lean and overweight/obese females displayed similar uricemia (p=0.994), (Figure 1A).
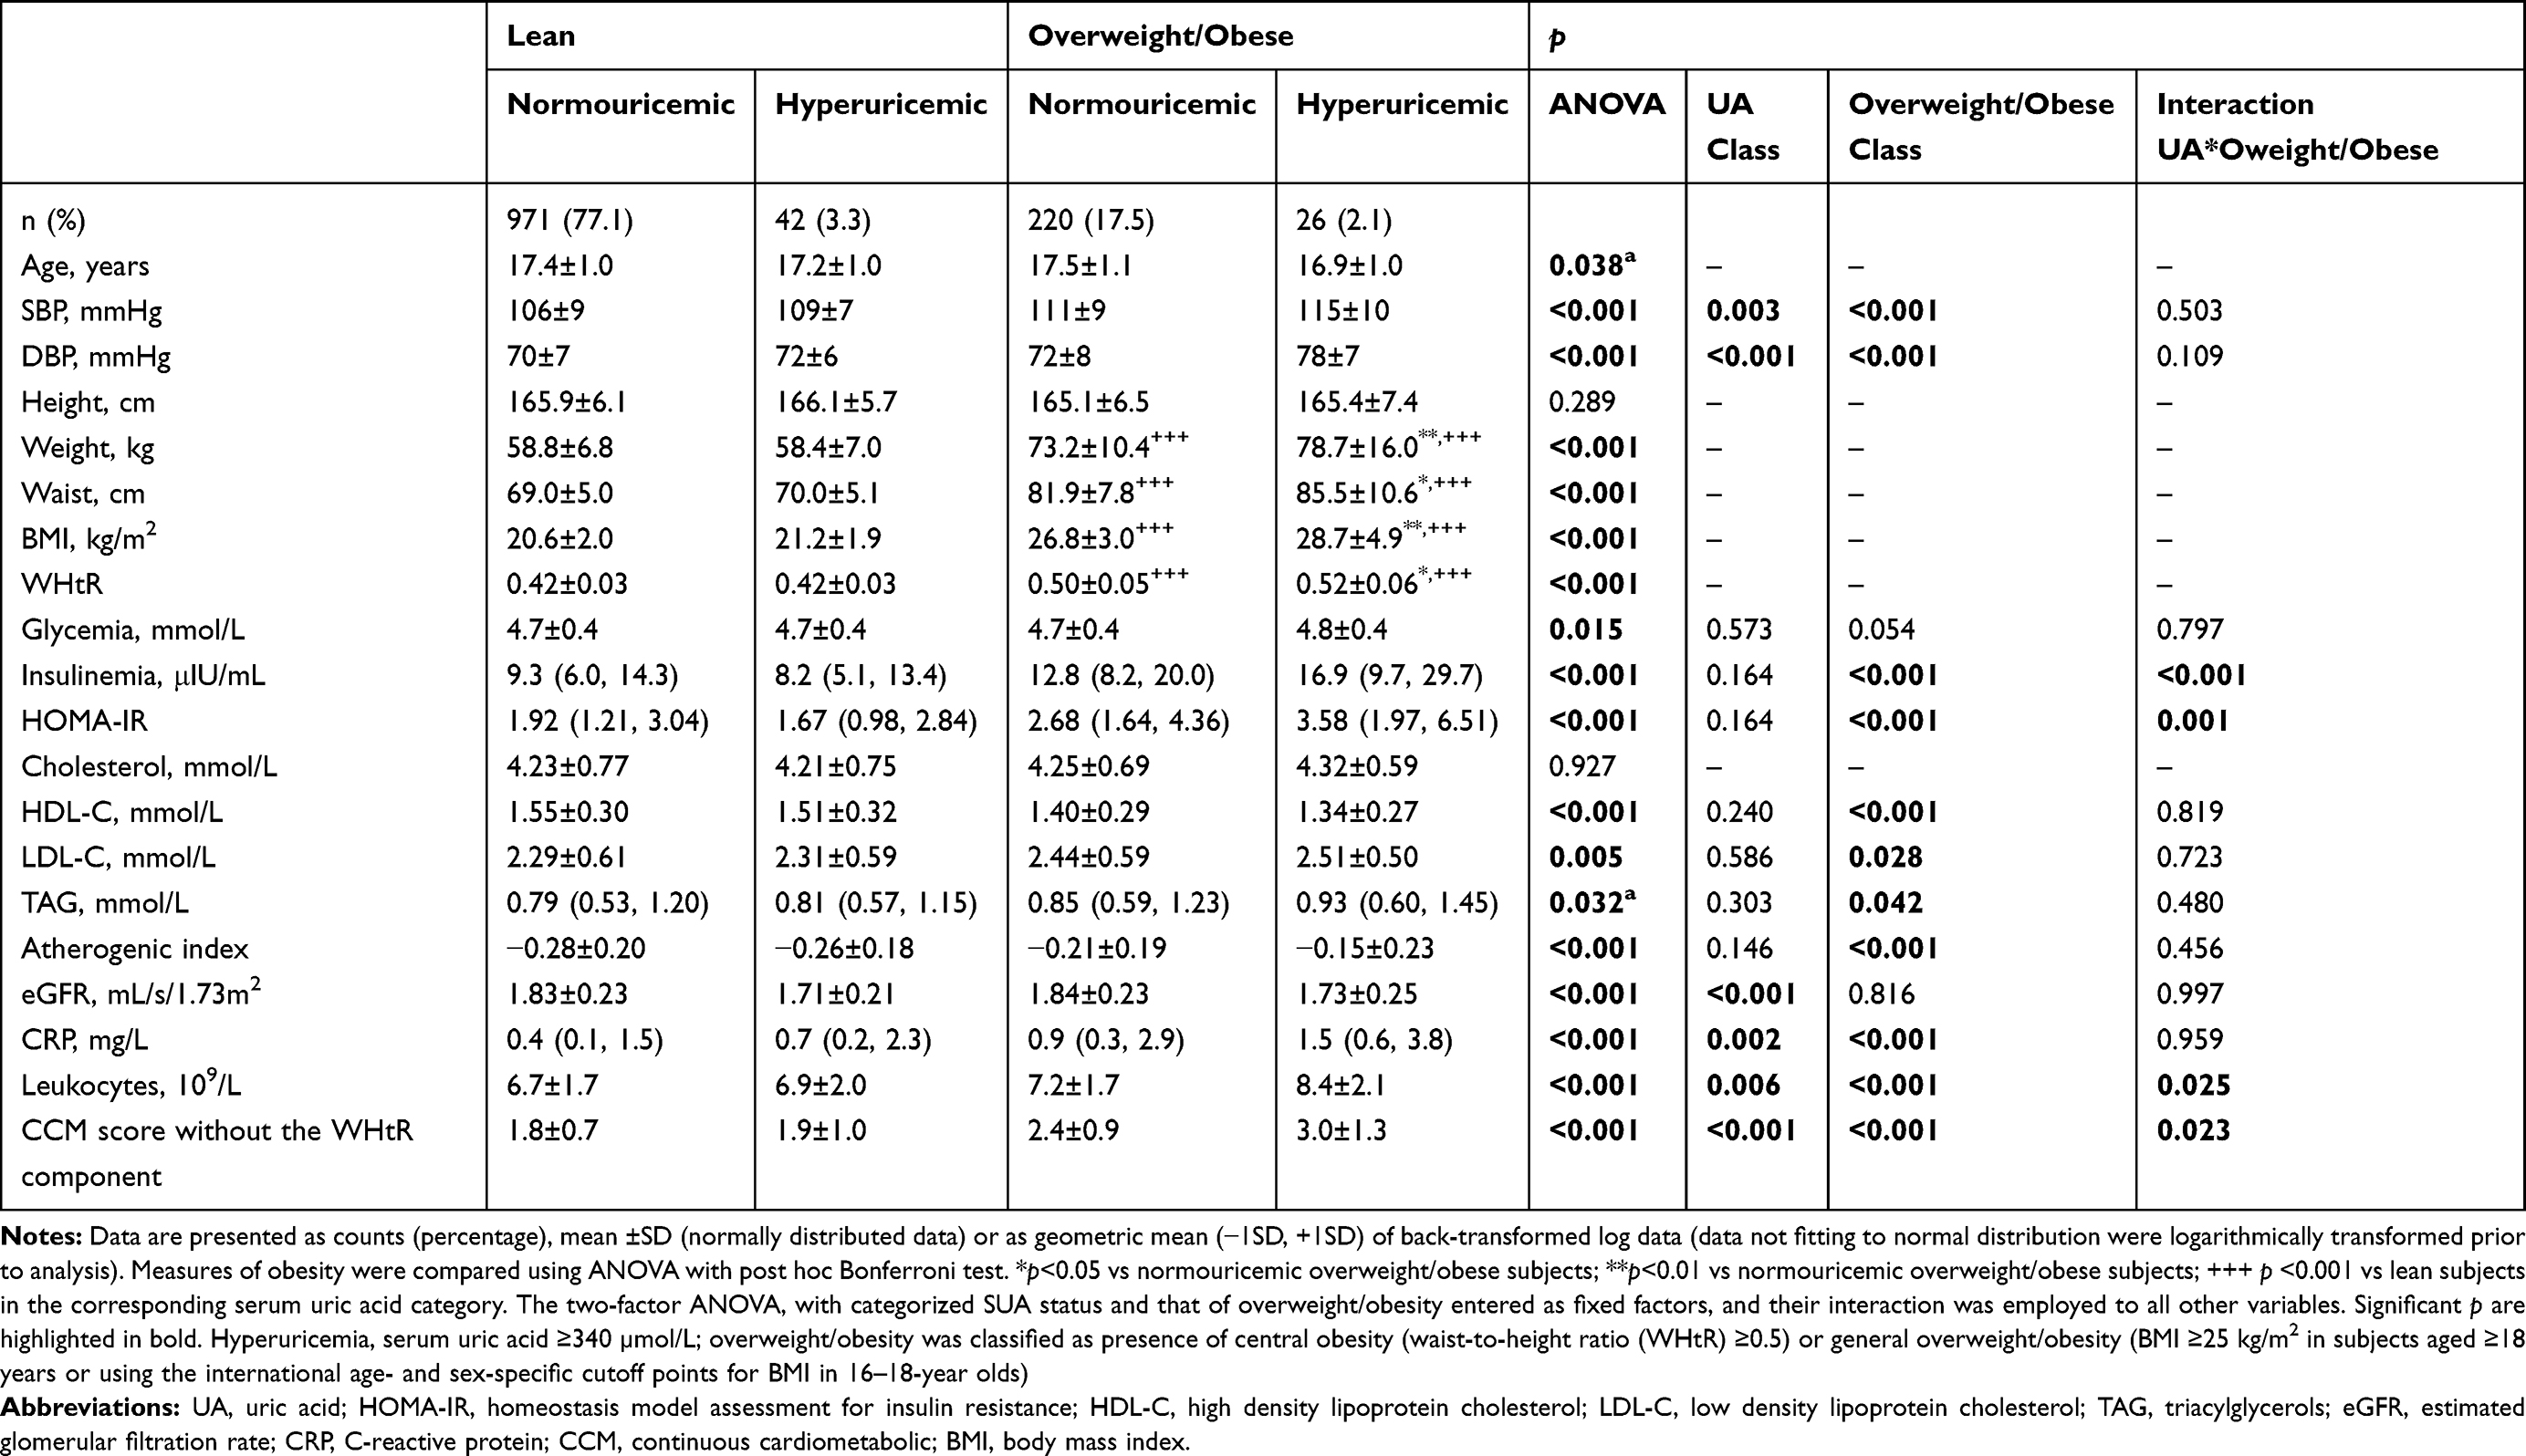 |
Table 1 Characteristics of Females |
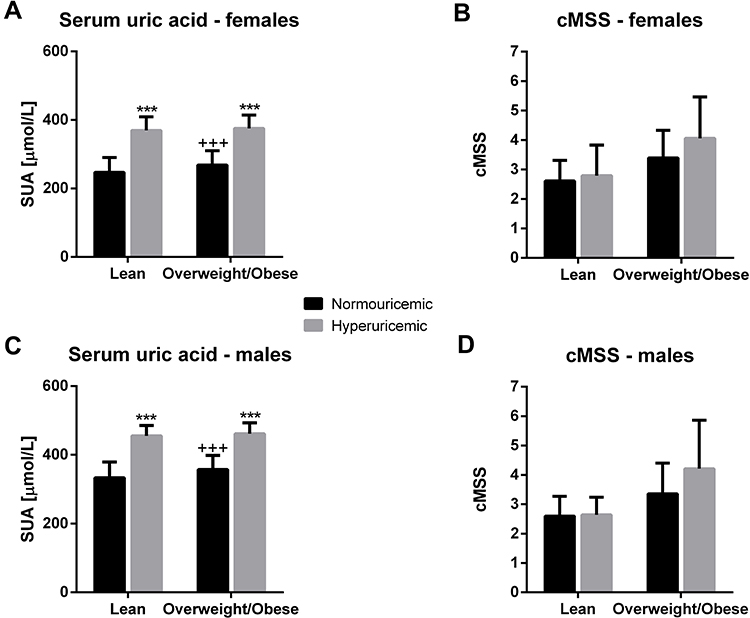 |
Figure 1 Serum uric acid concentrations and continuous cardiometabolic score according to the presence or absence of overweight/obesity in normouricemic and hyperuricemic females and males (A) serum uric acid concentrations in females; (B) continuous cardiometabolic score in females; (C) serum uric acid concentrations in males; (D) continuous cardiometabolic score in males SUA levels were compared using ANOVA with post hoc Bonferroni test to correct for multiple comparisons. ***p<0.001 vs normouricemic subjects of the same body frame. +++p<0.001 vs lean subjects in the corresponding serum uric acid category. cMSS in four groups was compared using the two-factor ANOVA, with categorized SUA status and that of overweight/obesity entered as fixed factors, and their interaction. ANOVA (p<0.001) indicated that both independent factors (p<0.001, both) affect the continuous cardiometabolic score in females, and that the score depends on the interaction of two factors (interaction: p=0.017). In males, both independent factors, as well as their interaction affected the continuous cardiometabolic score (p<0.001, all). |
While lean normouricemic and hyperuricemic females presented similar proxy measures of obesity, overweight/obese hyperuricemic females displayed higher body weight, waist circumference, BMI, as well as WHtR compared with their normouricemic peers (Table 1). Body weight, waist circumference, and BMI showed positive association with SUA levels both in lean and overweight/obese females (Table 2). Although that with WHtR showed significance only in overweight/obese females, comparison of two correlation coefficients showed no significant difference (Table 2).
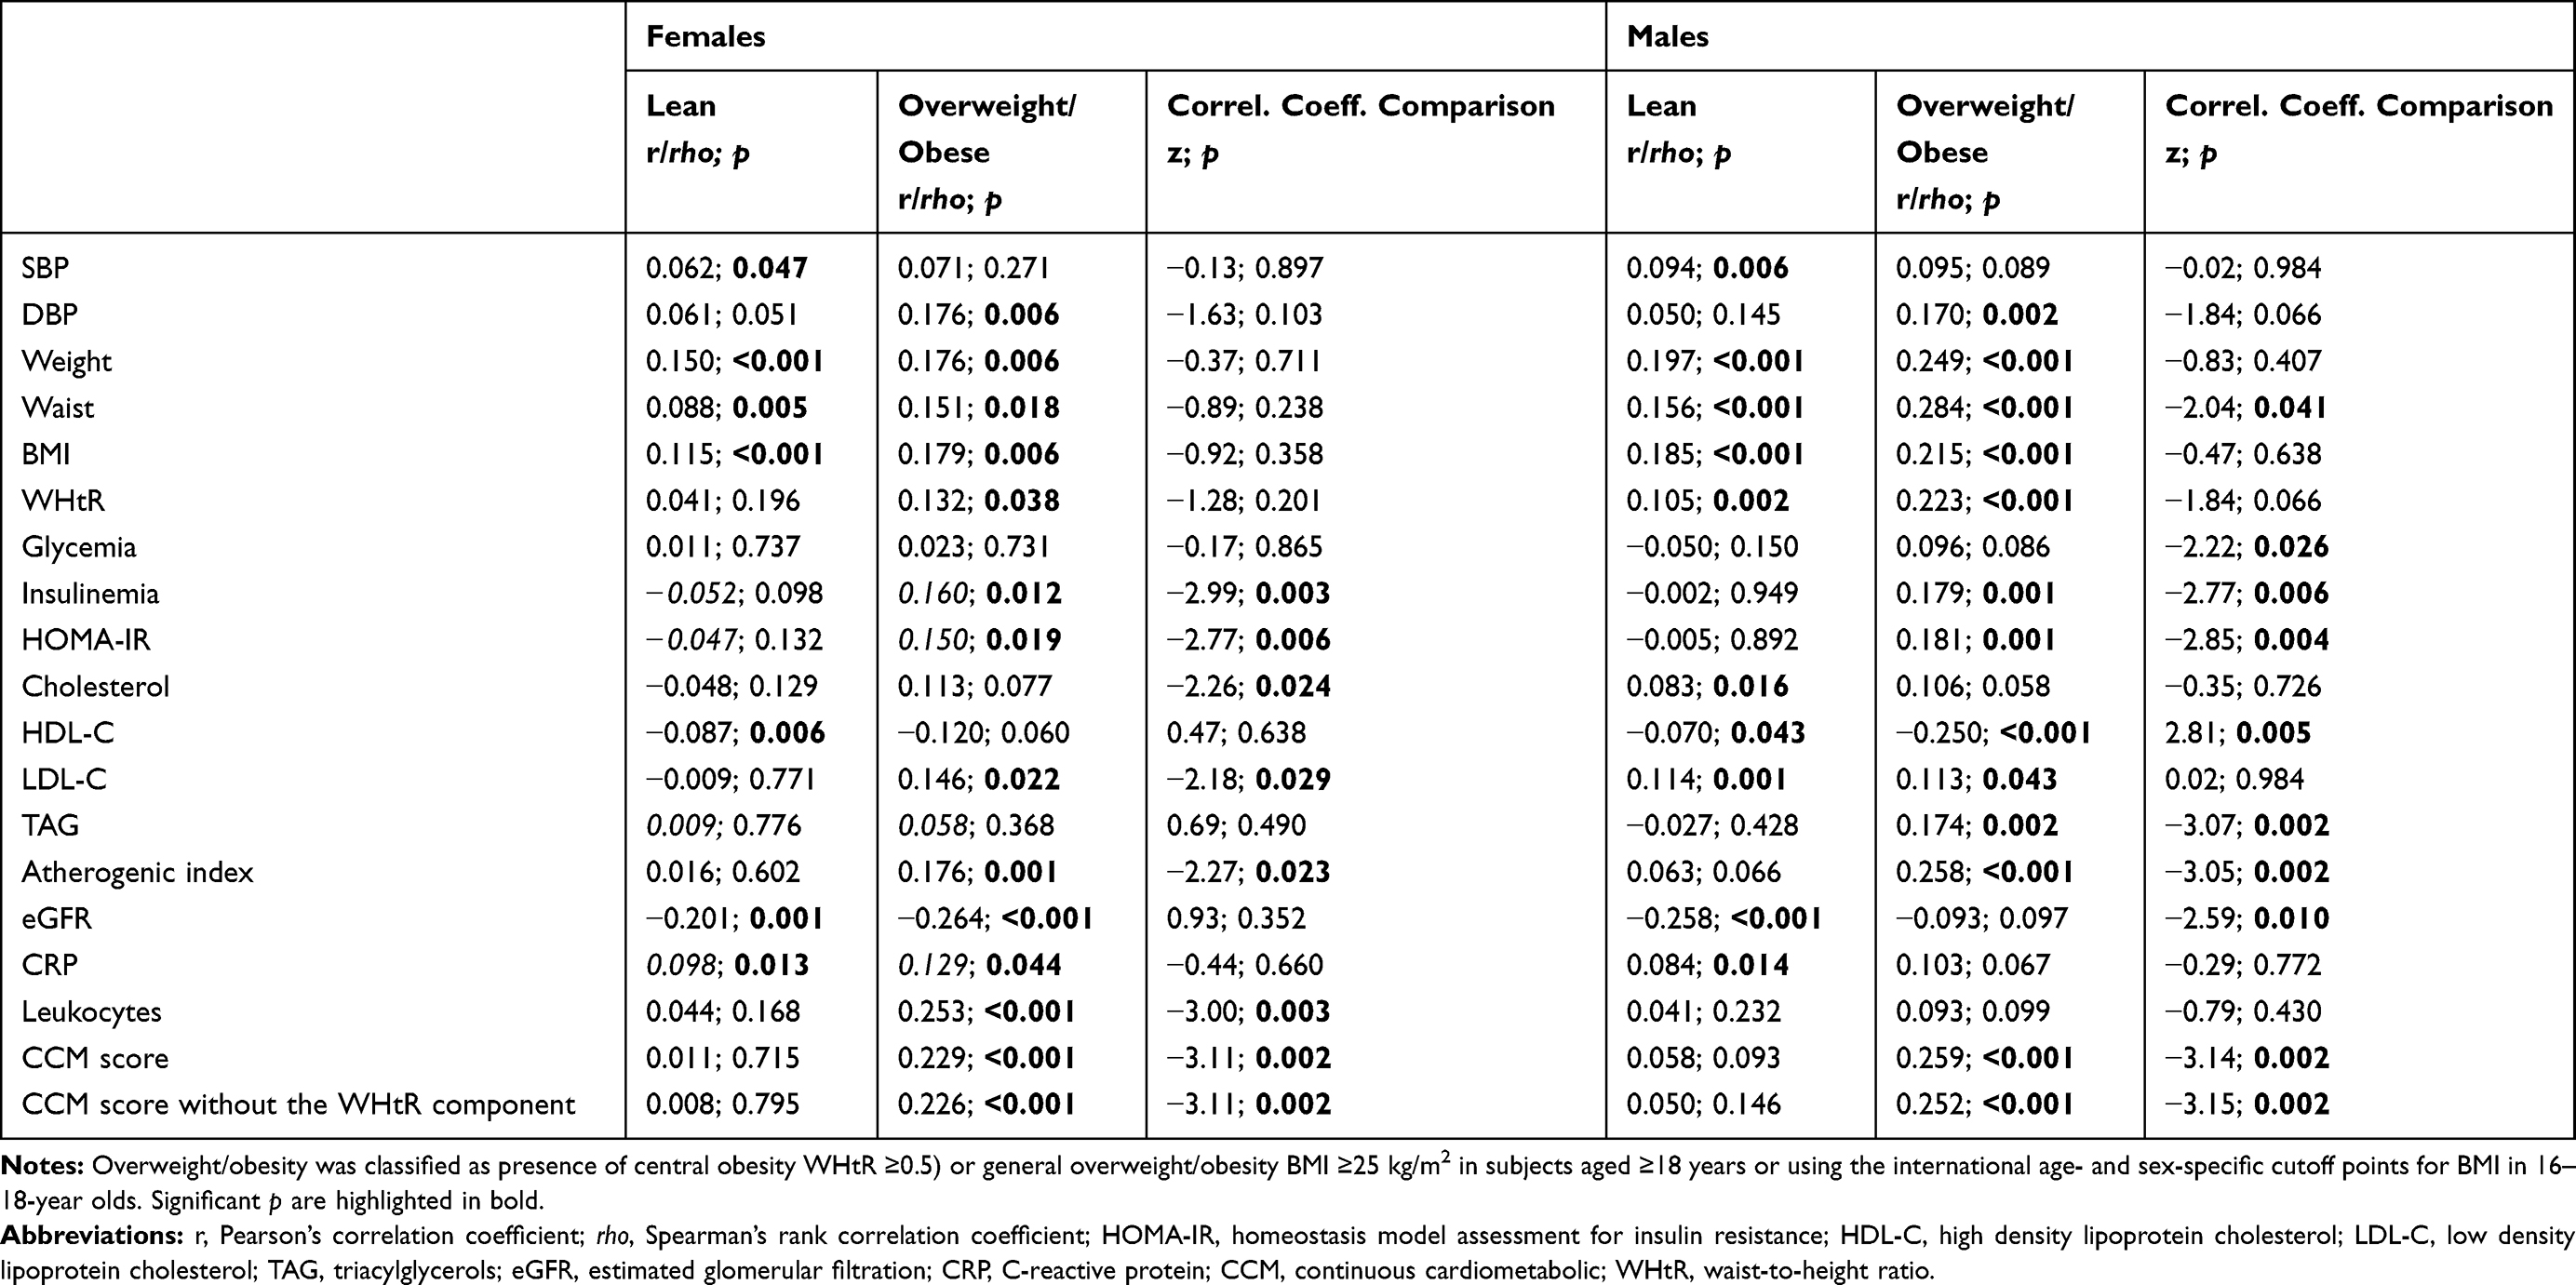 |
Table 2 Pearson’s or Spearman's Correlations Between Serum Uric Acid and Cardiometabolic Risk Factors and Markers in Females and Males |
Only glomerular filtration rate was independently impacted solely by uricemia (Table 1). This was reflected by a significant inverse relationship between these variables, regardless of overweight/obesity status (Table 2). In comparison with the reference group of lean normouricemic females, only lean hyperuricemic females had higher odds to present glomerular filtration rate less than the median value (Table 3).
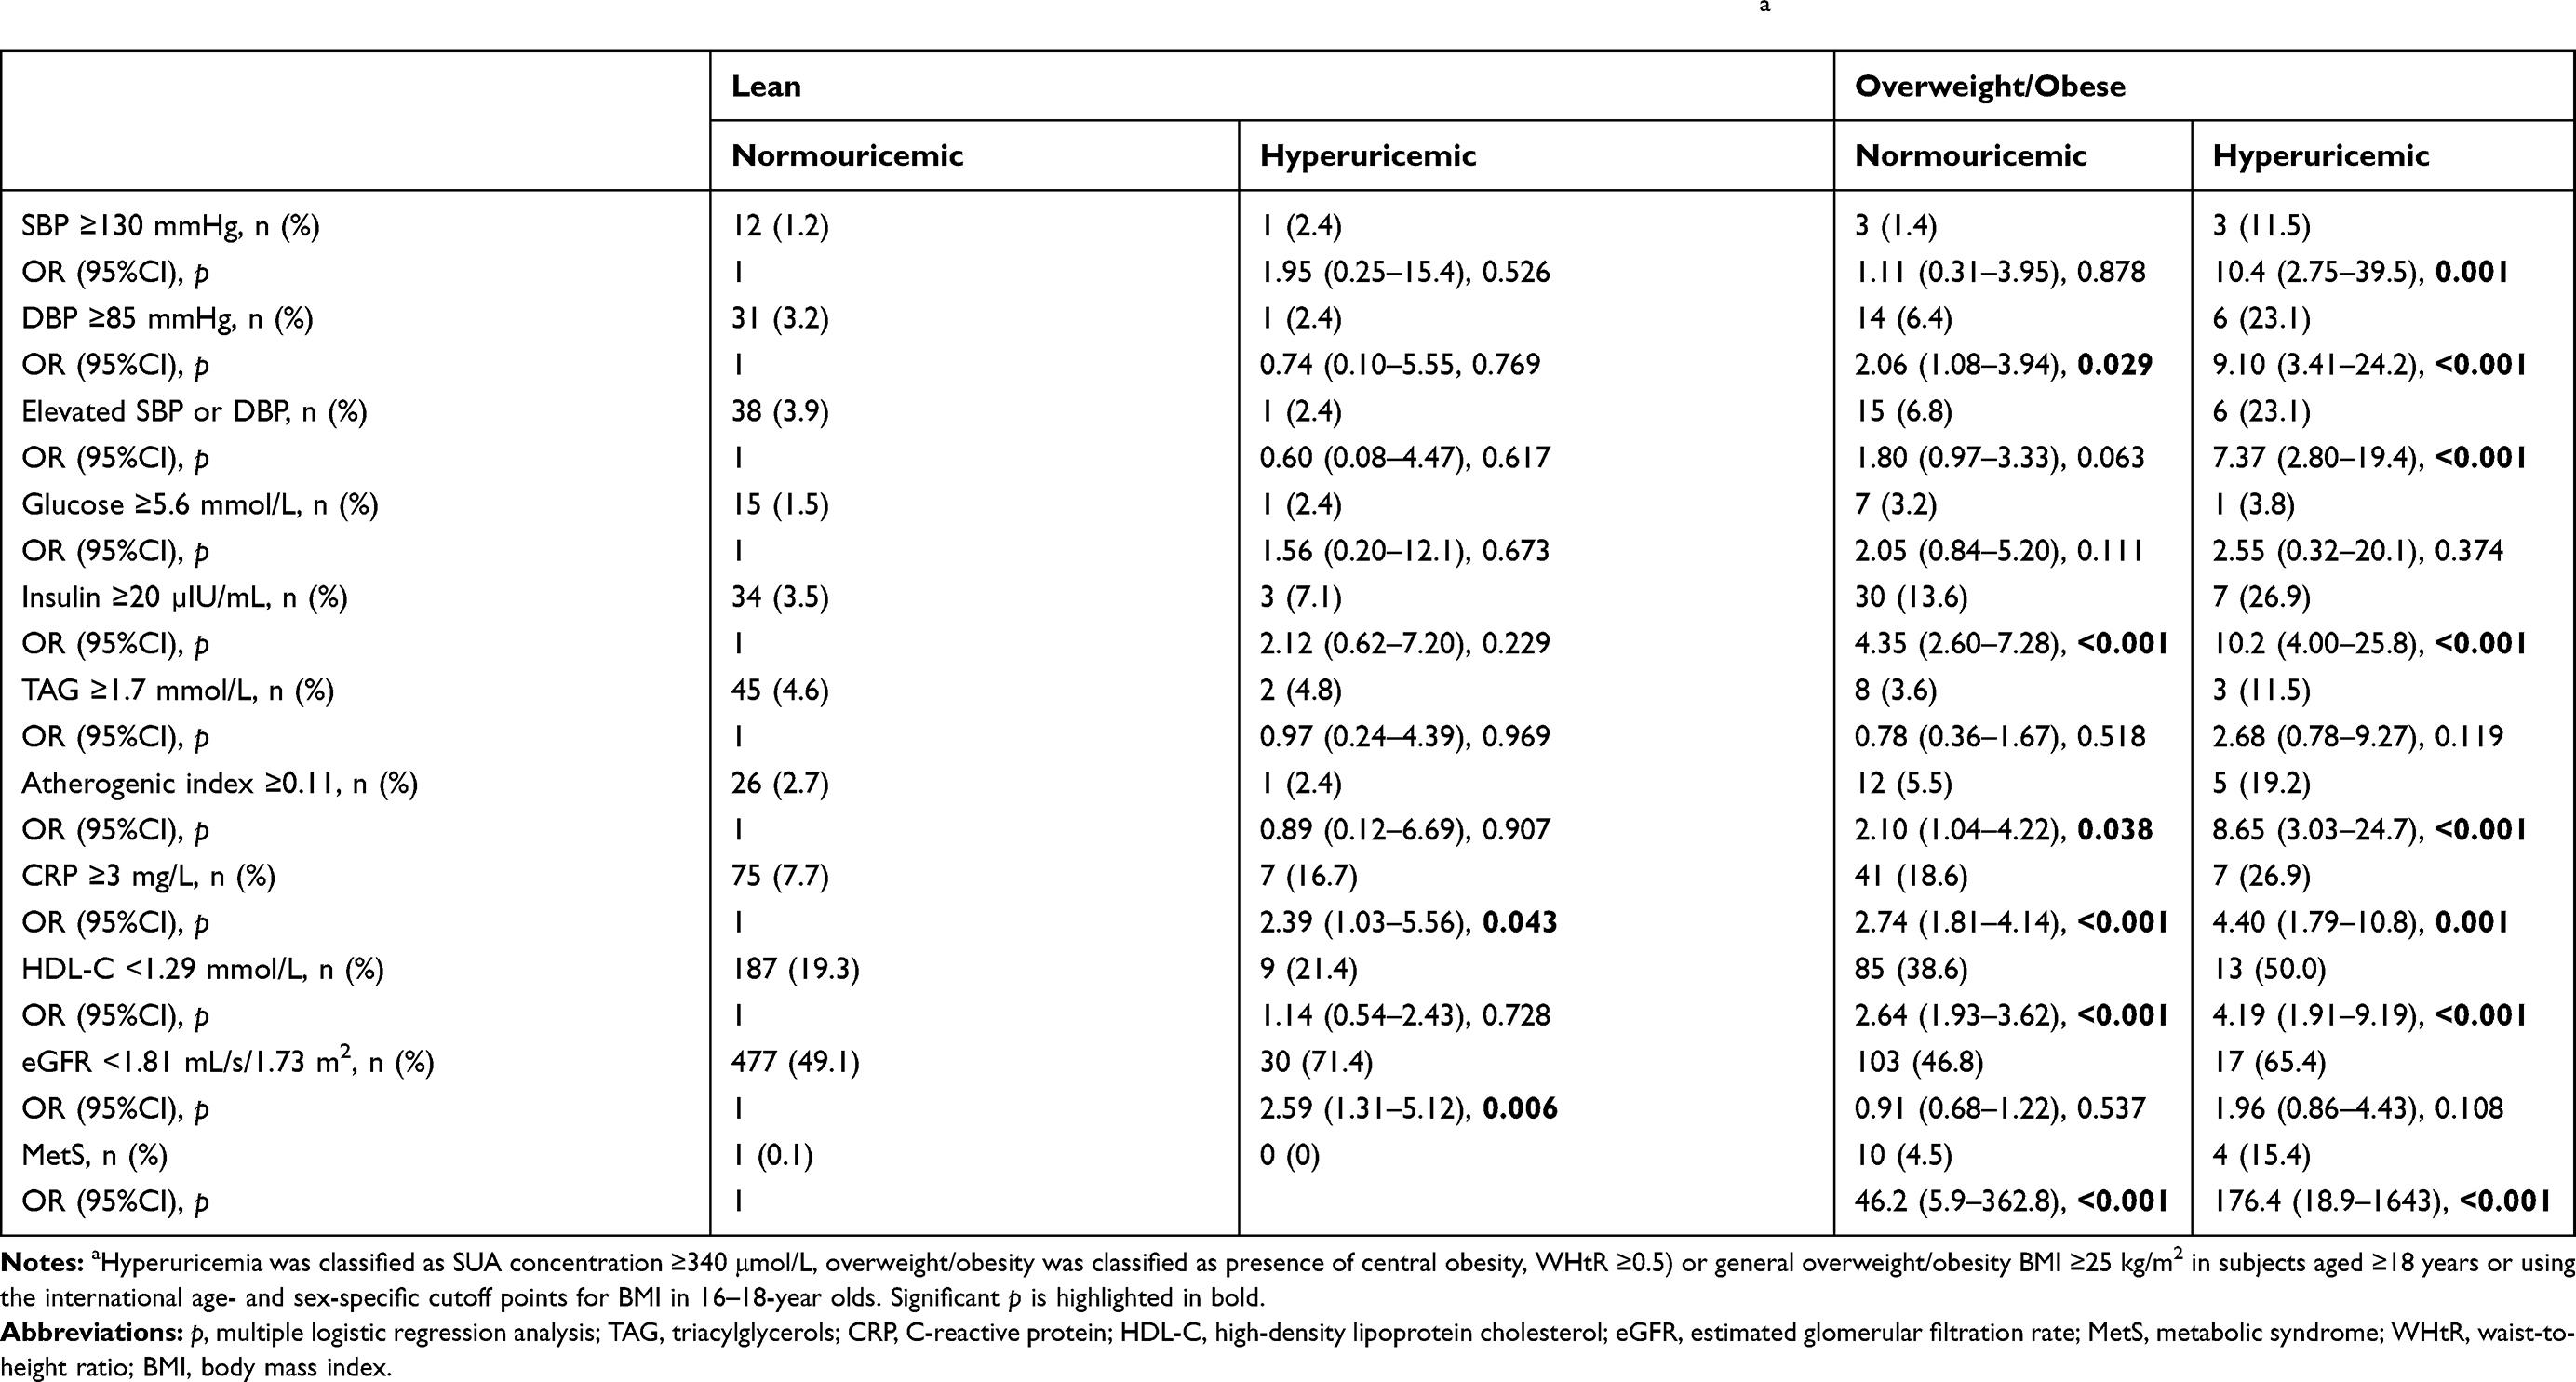 |
Table 3 Odds Ratios of Cardiometabolic Risk Factors by Serum Uric Acid and Overweight/Obesity Categories in Femalesa |
Two-factor ANOVA indicated an independent impact of both, uricemia and overweight/obesity, on SBP, DBP, and CRP; while in the case of leukocyte counts their interaction was also significant (Table 1). SBP showed a direct relationship with SUA in lean females, DBP and leukocyte counts in overweight/obese females, and CRP showed a significant association in both categories (Table 2). Correlation coefficient differed significantly only for leukocyte counts. Hyperuricemic overweight/obese females had about a 10-fold higher odds for elevated SBP than lean normouricemic subjects; while the odds for elevated DBP were higher in both groups of overweight/obese females (Table 3). CRP was the only variable for which all three groups showed higher odds to present values >3 mg/L in comparison with the reference group (Table 3).
Although ANOVA indicated significant difference in glycemia between the groups, it did not identify either the independent factors, or their interaction as significant (Table 1); and the odds for hyperglycemia were similar across four groups (Table 3). Insulinemia and insulin resistance were significantly impacted by the presence of overweight/obesity, and the interaction of two independent factors (Table 1). Both variables showed a significant positive correlation with SUA levels (Table 2). Regardless of uricemia, overweight/obese females had higher odds to present elevated fasting plasma insulin compared with lean normouricemic females (Table 3).
Presence of overweight/obesity significantly impacted lipid profile (except for total cholesterol levels), and atherogenic index of plasma (Table 1). However, only odds for low HDL-C and increased atherogenic index were higher in overweight/obese groups (Table 3). Neither total cholesterol, nor triacylglycerols showed a significant correlation with SUA; HDL-C correlated inversely in lean females, and LDL-C and atherogenic index showed a positive relationship with SUA in overweight/obese females (Table 2).
ANOVA (p<0.001) indicated that both independent factors (p<0.001, both) affect the continuous cardiometabolic score in females, and that the score depends on the interaction of two factors (interaction: p=0.017), (Figure 1B). Almost identical results were obtained if WHtR was omitted from the equation (Table 1). Correlation between the scores and SUA were significant only in overweight/obese females (Table 2).
Males
Among 1165 males, 72.6% were lean, 13.4% presented hyperuricemia (Table 4). Normouricemic centrally obese (n=9), overweight/obese (n=144) males, and those presenting combined obesity (n=93) displayed similar SUA levels (366±40 μmol/L, 356±41 μmol/L, and 357±41 μmol/L, respectively (p=0.765). Among hyperuricemic males, 26 presented isolated general overweight/obesity, and 47 displayed concurrently central obesity and general overweight/obesity. Their mean SUA concentrations were similar (464±29 μmol/L, and 460±34 μmol/L, respectively, p=0.620). Thus, regardless of the type of obesity, males were classified as overweight/obese and grouped according to SUA concentrations. SUA levels were lower in lean (345±57 μmol/L) compared with overweight/obese males (380±59 μmol/L, p<0.001). The prevalence of hyperuricemia was higher among overweight/obese (22.9%) compared with lean males (9.8%, p<0.001). 53.2% of hyperuricemic males were lean. Lean hyperuricemic males presented about 37% higher mean SUA levels compared with their normouricemic peers, in overweight/obese males the difference reached about 29% (Figure 1C). Lean normouricemic males displayed lower mean SUA levels compared with normouricemic overweight/obese peers (p<0.001), while the difference among hyperuricemic males was insignificant (p=0.933), (Figure 1C).
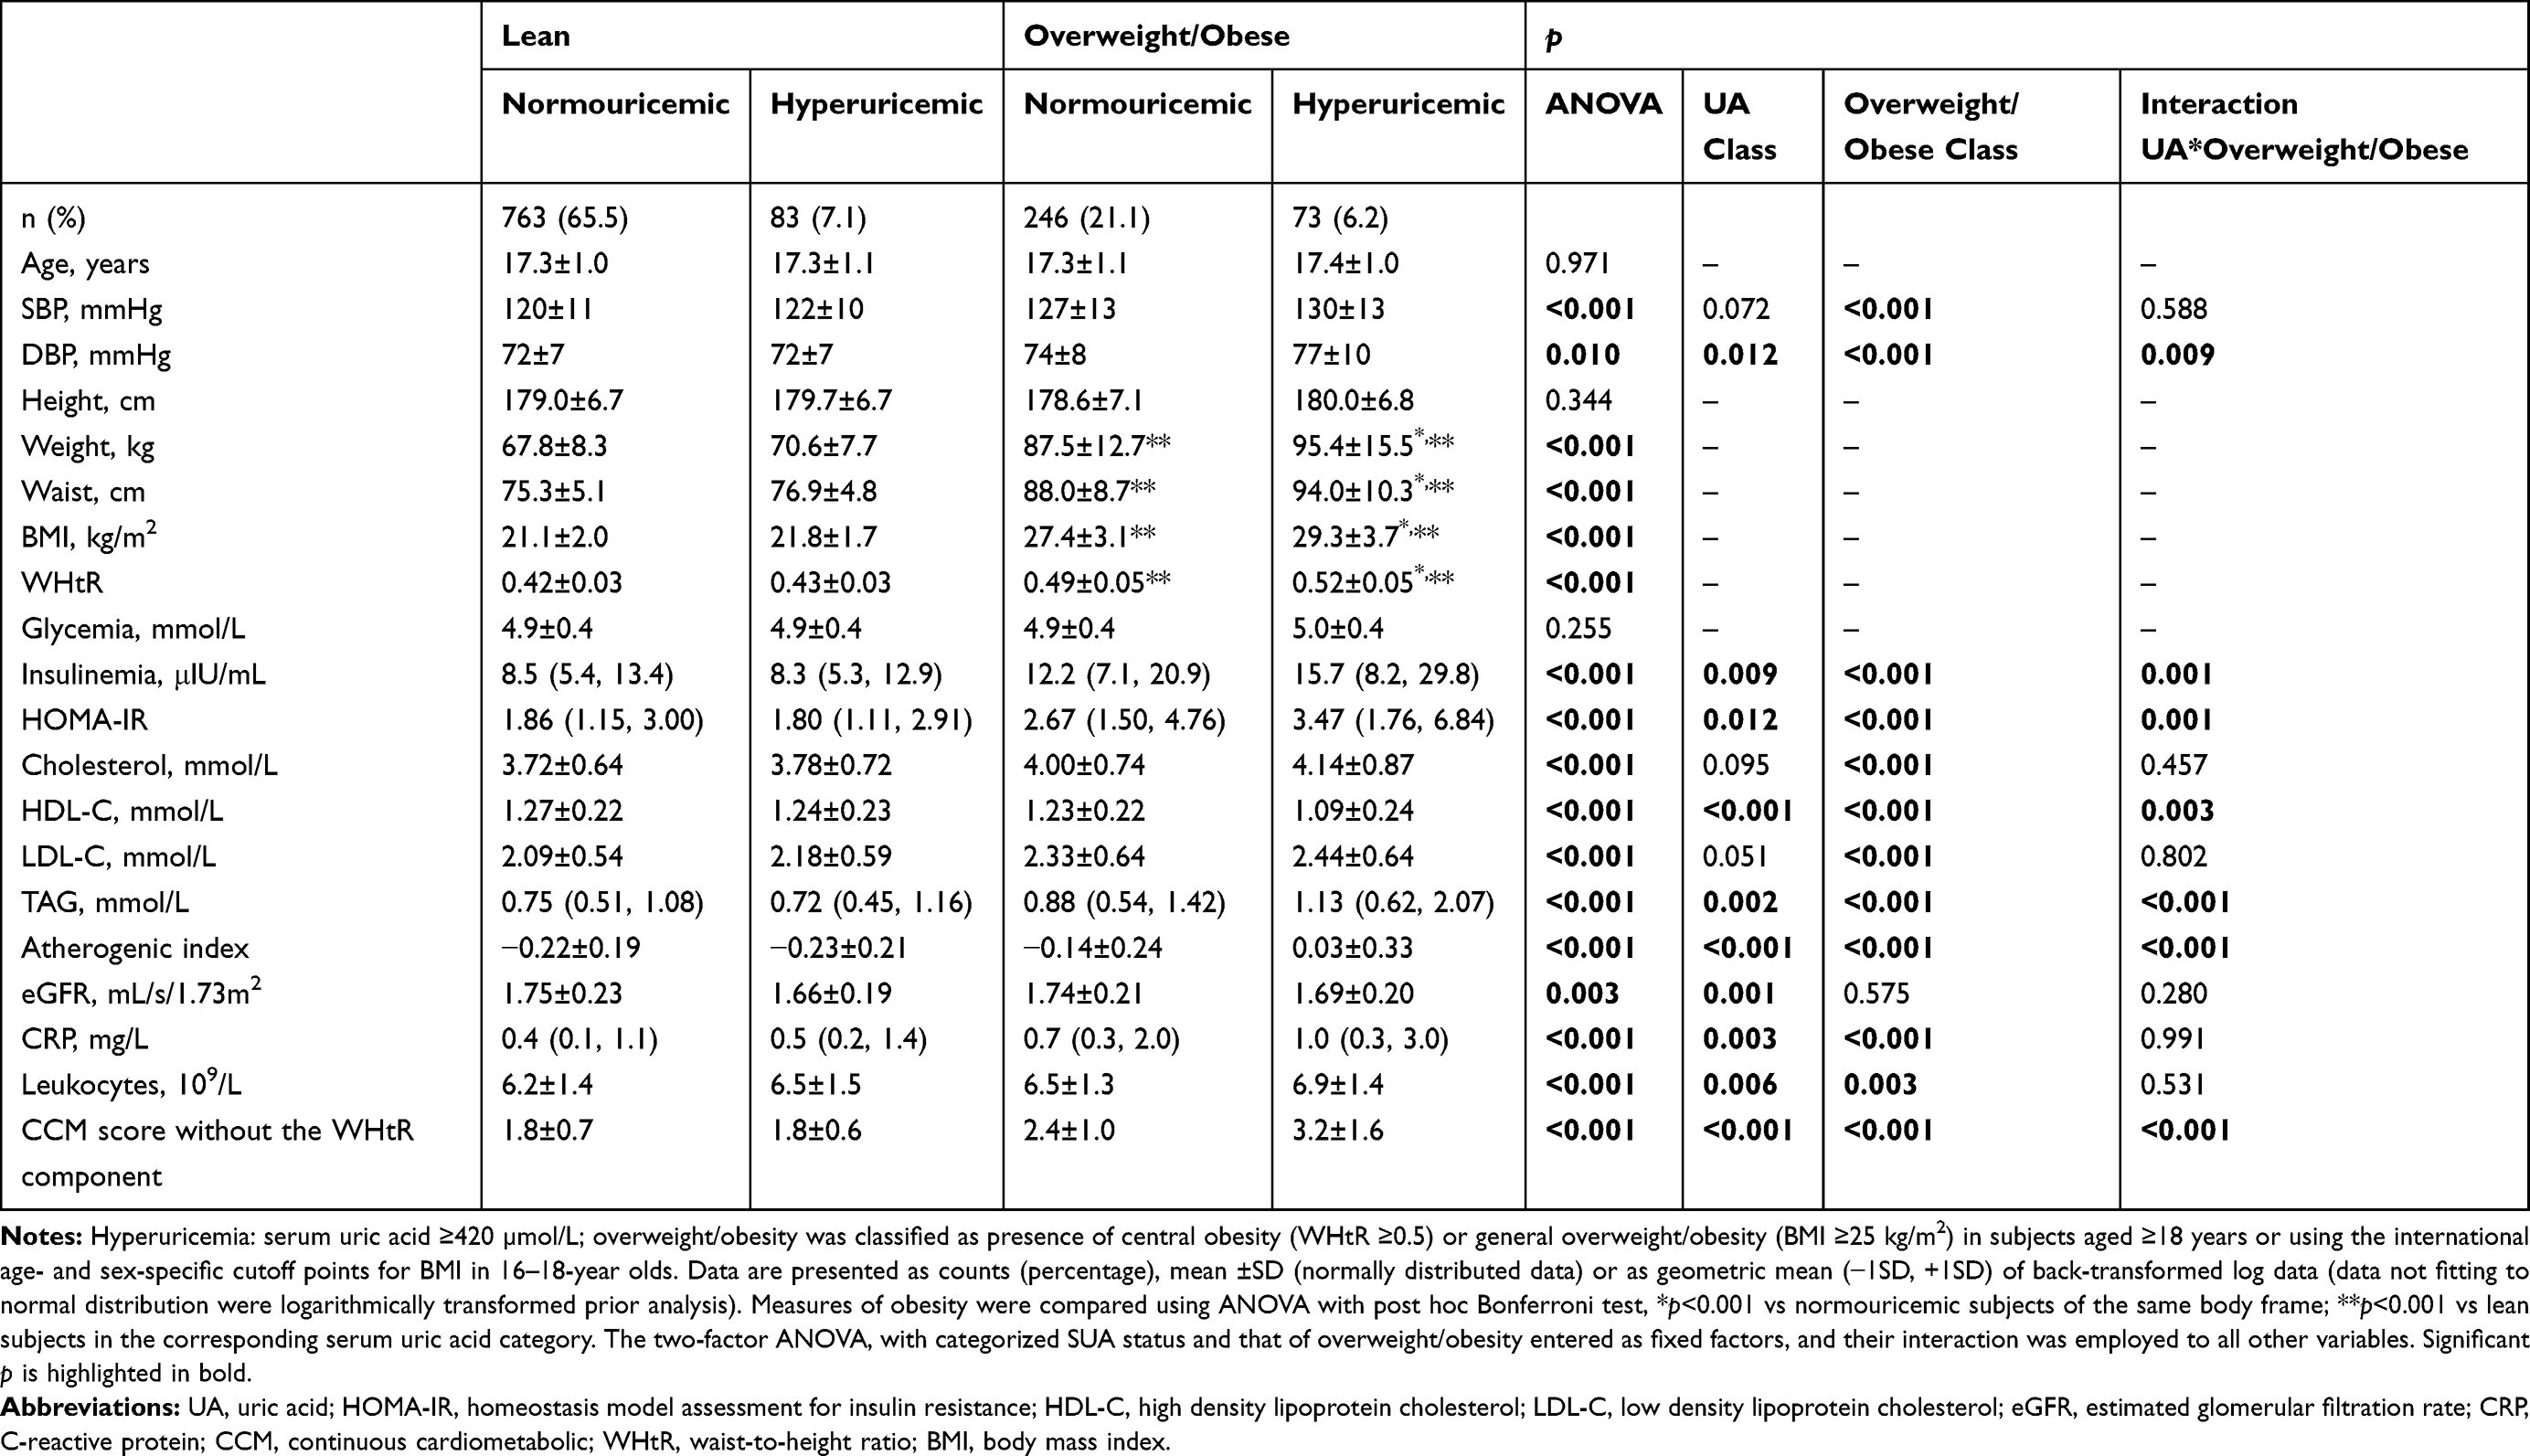 |
Table 4 Characteristics of Males |
As in females, proxy measures of obesity did not differ significantly between lean normouricemic and hyperuricemic subjects, while overweight/obese hyperuricemic males presented higher body weight, waist circumference, BMI, and WHtR compared with their normouircemic peers (Table 4). Proxy measures of obesity showed significant correlation with SUA both in lean and overweight/obese males (Table 2).
As in females, estimated glomerular filtration rate was the single variable impacted solely by presence of hyperuricemia (Table 4). It showed a significant (inverse) relationship with SUA only in lean males (Table 2), and lean hyperuricemic subjects had higher odds to present glomerular filtration rate less than median (Table 5).
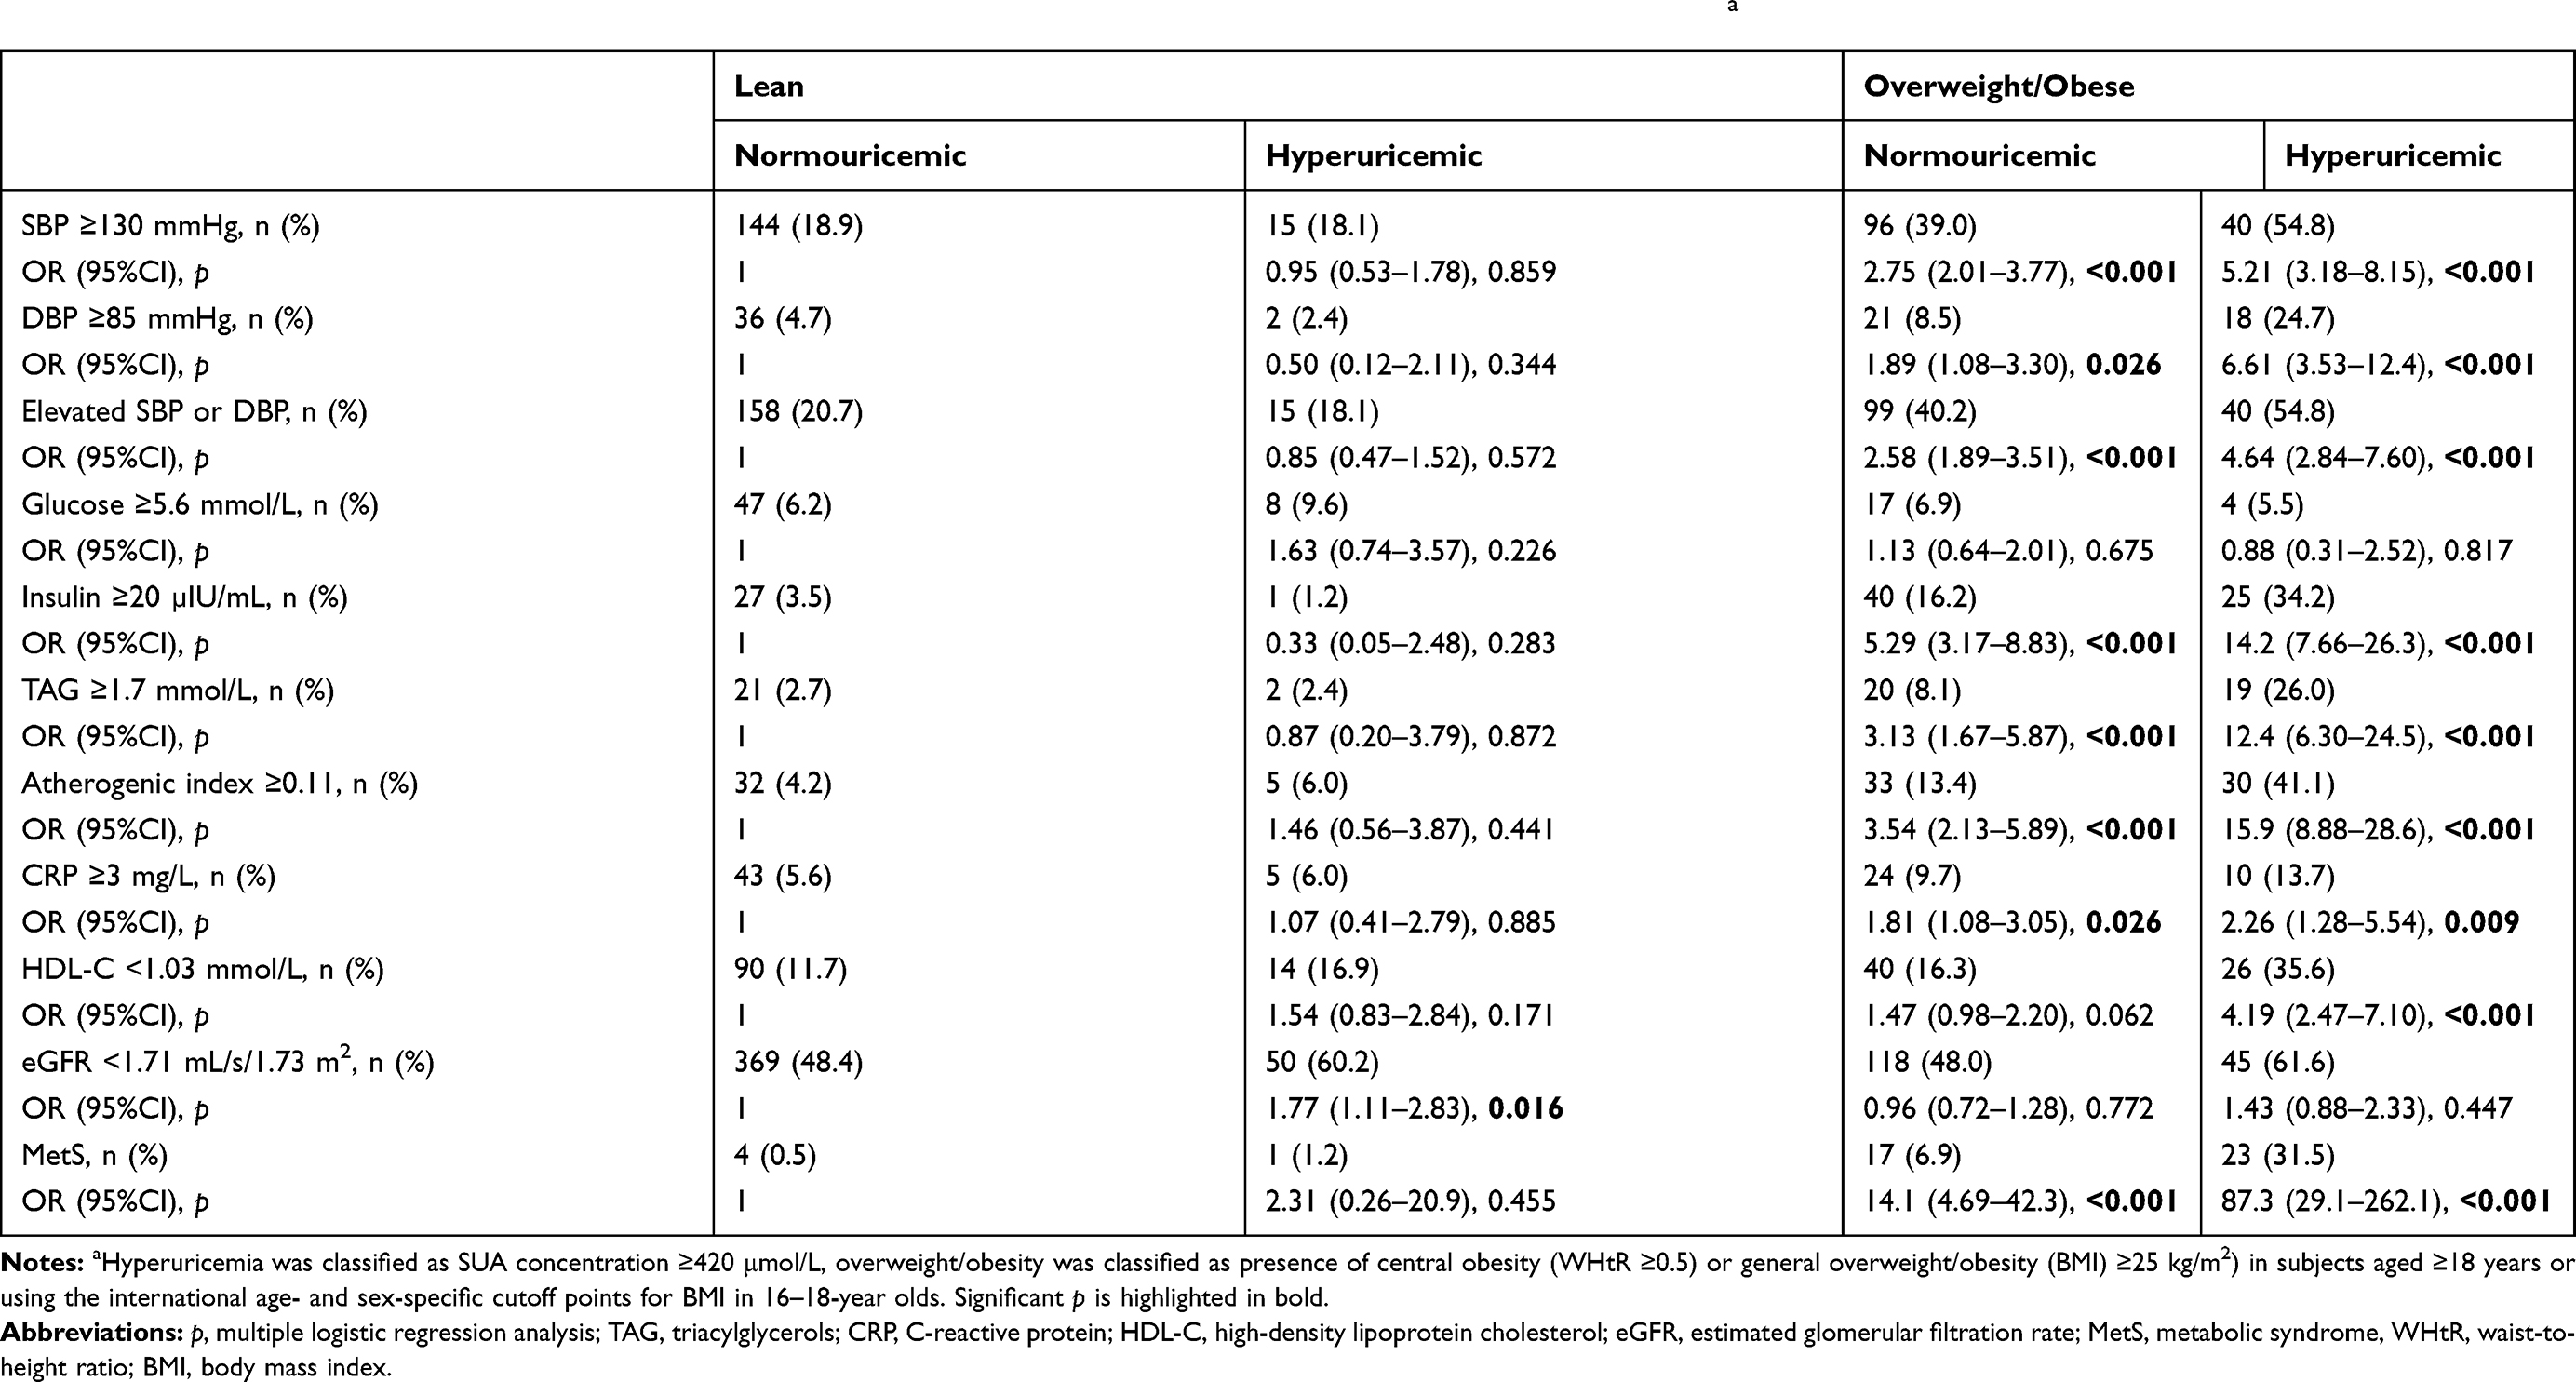 |
Table 5 Odds Ratios of Cardiometabolic Risk Factors by Serum Uric Acid and Overweight/Obesity Categories in Malesa |
Among independent factors, overweight/obesity significantly affected SBP; while presence or absence of hyperuricemia as well as that of overweight/obesity showed significant impact on DBP, with a significant interaction (Table 4). SBP showed significant correlation with SUA in lean males, DBP correlated with uricemia in overweight/obese males but Fisher's r-to-z transformation did not indicate significant differences (Table 2). Normouricemic and hyperuricemic overweight/obese males had higher odds to present elevated SBP, as well as DBP, compared with lean normouricemic subjects (Table 5).
Neither fasting plasma glucose concentration (Table 4), nor the odds for presenting elevated glycemia (Table 5) differed significantly among the four groups. Glycemia did not correlate with SUA significantly (Table 2). The ANOVA indicated a significant independent effect of both factors, including their interaction, on insulinemia and HOMA-IR (Table 4), indicating that overweight/obese males maintained glycemia with higher insulin levels, and were more insulin resistant, particularly if they were also obese. Thus, correlations between insulin concentrations or insulin resistance index and SUA were significant only in overweight/obese males (Table 2).
Total cholesterol and LDL-C levels appeared to be significantly higher in presence of obesity; while HDL-C, triacylglycerols, and atherogenic index were significantly affected by both independent factors but their interaction was significant (Table 4). Cholesterolemia significantly associated with SUA levels in lean males, triacylglycerolemia and atherogenic index correlated with uricemia in overweight/obese subjects, and HDL-C and LDL-C in both categories (Table 2). Odds for manifestation of elevated triacylglycerols and that of atherogenic index were increased in both groups of overweight/obese males, while only hyperuricemic overweight/obese males had higher odds to present low HDL-C (Table 5).
Inflammatory markers, CRP and leukocyte counts were independently affected by both classification factors (Table 4). Although CRP showed significant correlation with SUA only in lean males (Table 2), correlation coefficients did not differ significantly. Normouricemic as well as hyperuricemic overweight/obese males had higher odds for elevated CRP compared with the reference group (Table 5).
Two-factor ANOVA (p<0.001) indicated that both independent factors (p<0.001, both) affect the continuous cardiometabolic score in males, and that the score depends on the interaction of two factors (interaction: p<0.001), (Figure 1D). Identical results were obtained if WHtR was omitted from the equation (Table 4). Correlations between the scores and SUA were significant only in overweight/obese males (Table 2). The odds to present MetS were increased in both normouricemic and hyperuricemic overweight/obese males (Table 5).
Decision-tree Models
The decision-tree model selected glomerular filtration rate as the predictor variable of SUA in the primary split both in females (Figure 2A; detailed classification tree given in the SuppIemental Figure S1), and in males (Figure 2B; SuppIemental Figure S2). In both sexes, in subjects with glomerular filtration rate less than median (females: <1.81 mL/s/1.73 m2, males: <1.71 mL/s/1.73 m2), HDL-C and insulinemia predicted SUA levels in the next nodes; while in individuals with glomerular filtration rate greater than or equal to median, BP and triacylglycerols were subsequent determinants of SUA levels. Phenotypes with a higher risk did not unequivocally display higher mean SUA levels, as visible in the terminal nodes predicted by triacylglycerols in both sexes and by insulin in males. Females presenting a rare phenotype, ie, glomerular filtration rate less than median and elevated fasting insulin levels, displayed the highest mean SUA concentration and the highest prevalence of hyperuricemia (20%). In males, those with lower glomerular filtration rate and low HDL-C presented the highest SUA levels as well as the highest prevalence of hyperuricemia (23.5%). 52% of hyperuricemic females clustered among those presenting glomerular filtration rate less than median, low HDL-C, and normal fasting insulinemia (Supplementary Figure S1). The highest prevalence of hyperuricemic males (48%) was in the phenotype with glomerular filtration rate less than median, not presenting low HDL-C and elevated fasting insulinemia (Supplementary Figure S2).
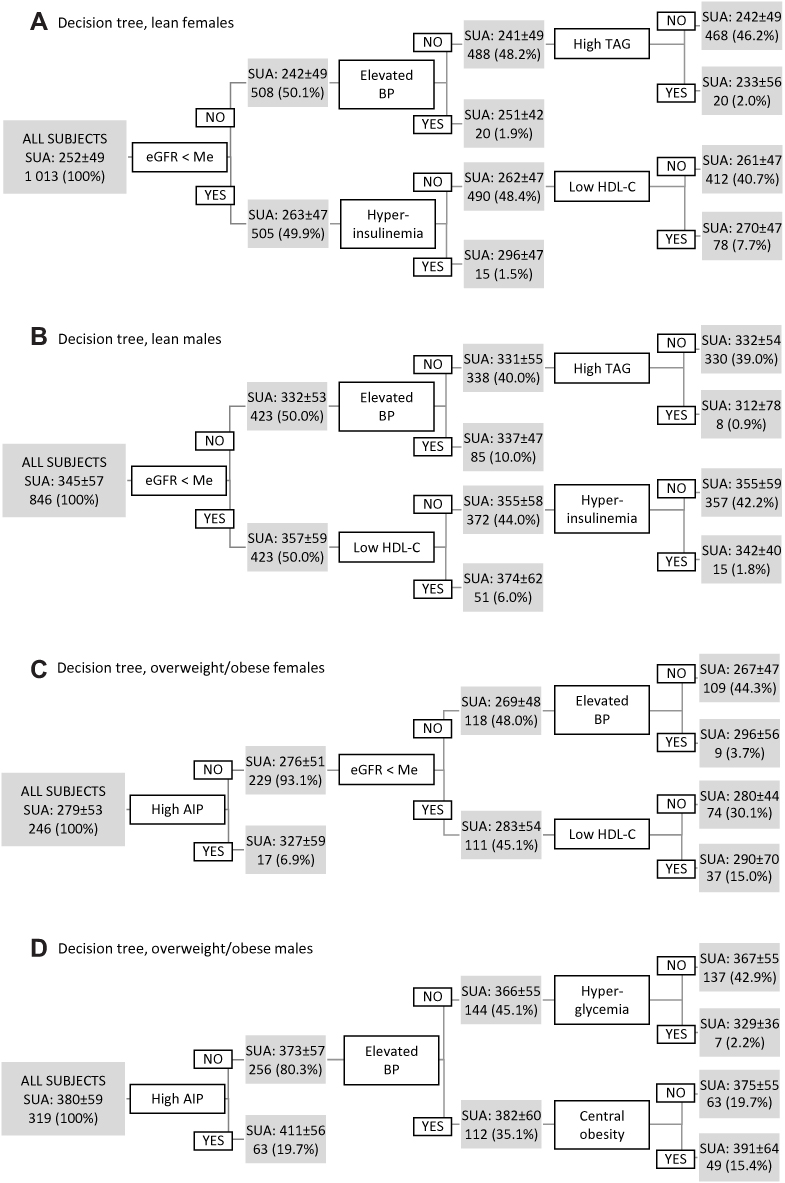 |
Figure 2 Decision tree visualizing patterns how presence or absence of independent categorical variables impact serum uric acid concentration in (A) lean females; (B) lean males; (C) overweight/obese females; (D) overweight/obese males. In each node, SUA concentration given as mean ±SD, second row: number of subjects in node (percentage of all subjects). Notes: Me, median (females: 1.81 mL/s/1.73 m2, males: 1.71 mL/s/1.73 m2); BP, blood pressure; elevated, SBP ≥130 mmHg and/or DBP ≥85 mmHg; TAG, triacylglycerols, elevated: ≥1.7 mmol/L; hyperinsulinemia, fasting insulinemia ≥20 μIU/mL; HDL-C, high-density lipoprotein cholesterol; low, <1.29 mmol/L (females) or <1.03 mmol/L (males); AIP, atherogenic index of plasma; high, ≥0.11; hyperglycemia, fasting glycemia ≥5.6 mmol/L; central obesity, waist/height ≥0.5. Abbreviations: SUA, serum uric acid; eGFR, estimated glomerular filtration rate; Me, median in corresponding sex; BP, blood pressure; TAG, triacylglycerols; HDL-C, high-density lipoprotein cholesterol; AIP, atherogenic index of plasma. |
The top-level node of the decision tree in overweight/obese females (Figure 2C, Supplementary Figure S3) and males (Figure 2D, Supplementary Figure S4) showed that about 7% of females and 20% of males presented increased atherogenic index. In both sexes, this phenotype associated with the highest mean SUA levels. The prevalence of hyperuricemic subjects reached 29% in these females and 48% in males and was the highest among all phenotypes. Forty-one percent of hyperuricemic overweight/obese males presented this phenotype. In females not presenting elevated atherogenic index, glomerular filtration rate, BP, and HDL-C were subsequently used in decision-tree construction. In all node-pairs, phenotypes with higher cardiometabolic risk presented higher mean SUA levels. In males, the model subsequently selected BP, glycemia, and central obesity to predict SUA concentrations. Among normotensive males who did not present increased atherogenic index, normoglycemic subjects paradoxically displayed higher uricemia compared with their peers displaying elevated fasting glycemia.
Discussion
This study provides evidence that: (1) more than a half of adolescents with asymptomatic hyperuricemia are lean. (2) While normouricemic overweight/obese adolescents display higher SUA levels compared with their lean counterparts, hyperuricemic lean and overweight/obese subjects present similar SUA concentrations. (3) In lean adolescents, asymptomatic hyperuricemia is not associated with increased continuous cardiometabolic risk score. (4) Phenotypes associated with the highest SUA levels differ between lean and overweight/obese adolescents.
The prevalence of hyperuricemia in our study was similar to that reported for 18–25-year old healthy Slovaks (males: 12.7%, females: 4.0%).24 Our data are also in line with other reports, indicating higher prevalence of hyperuricemia in overweight/obese adolescents (12%-38%) compared with the general population (7%-30%), and mostly higher in males (5%-27%) than in females (1%-19%).25 To our knowledge, there are no data on the prevalence of hyperuricemia in lean adolescents. The Japanese study mentioned that a proportion of nonobese adolescent males was hyperuricemic but the authors did not comment on this finding.1 We show that although the prevalence of hyperuricemia is higher in overweight/obese compared with lean subjects, more than a half of hyperuricemic adolescents are lean. In line with other studies,26,27 overweight/obese adolescents presented higher SUA levels compared with their lean peers. However, overweight/obesity impacted SUA levels only in normouricemic subjects; hyperuricemic adolescents displayed similar SUA concentrations regardless of the presence or absence of overweight/obesity.
In the general population and in obese adolescents, rising SUA concentrations are associated with a worsening of different components of MetS.2–4,10,26 Large studies on the general population of adolescents documented an increase in mean SUA levels across cardiovascular risk classes4 and a worsening of continuous MetS z-score with rising SUA levels.6 Our hyperuricemic overweight/obese adolescents also displayed higher continuous cardiometabolic scores compared with their normouricemic peers, suggesting that asymptomatic hyperuricemia is associated with worse cardiometabolic status only in overweight/obese adolescents. Even though, we neither revealed systematic worsening in variables characterizing cardiometabolic risk nor documented a significant deterioration in continuous cardiometabolic score in lean hyperuricemic vs normouricemic adolescents, these findings should be interpreted with caution.
Lean hyperuricemic adolescents displayed preserved insulin sensitivity. In overweight/obese subjects, hyperuricemia aggravated the already present overweight/obesity-associated insulin resistance.25 Experimental studies document that uric acid increases hepatic fat accumulation and glucose production; induces proinflammatory endocrine imbalance in the adipose tissue, representing an underlying mechanism of the low-grade inflammation and insulin resistance; and inhibits insulin signalling in the muscle.28,29 In young females, basal SUA levels or their change over three years did not track with changes in insulin sensitivity, beta-cell function or glycemia, even in those with recent gestational diabetes mellitus.30 A different study documented an increased risk for new-onset diabetes in healthy lean females presenting high normal SUA levels at baseline.31 Whether these sex-specific results were affected by the transition of a proportion of females into postmenopausal state during the follow-up, remains unclear. Since hyperuricemia commonly precedes the development of hyperinsulinemia,32 further studies are needed to clarify whether in lean adolescents elevation of SUA over prolonged periods is associated with increased risk of hyperinsulinemia, insulin resistance or diabetes.
We revealed a worse lipid profile only in hyperuricemic vs normouricemic overweight/obese males. This corresponds to the results from the Taiwanese military cohort, describing associations between atherogenic lipid profiles and hyperuricemia merely in males.33 Whether the association between hyperuricemia and dyslipidemia is sex-specific remains unclear. In adults, hyperuricemia is a potential risk of later development of high LDL-C and hypertriacylglycerolemia.34 In our multivariate analysis, the increased atherogenic index of plasma unequivocally predetermined high SUA levels in overweight/obese individuals of both sexes. Thus, in adolescents hyperuricemia accelerates manifestation of atherogenic dyslipidemia particularly in the presence of overweight/obesity, associated per se with this metabolic derangement.
Experimental and clinical studies (even in children and adolescents) suggest that SUA is a true modifying and possibly causal factor for essential hypertension, among others via reduction of nitric oxide levels in the endothelium, induction of oxidative stress, and activation of the renin–angiotensin system.35,36 In our cohort, independent effects of hyperuricemia on SBP and DBP as well as odds to present BP ≥130/85 mmHg showed sex differences. Although overweight/obese hyperuricemic females displayed about 1.6-fold higher odds to present elevated BP compared with overweight/obese hyperuricemic males, overlapping confidence intervals suggest that this might be a tendency. In the Taiwanese military cohort, the association between hyperuricemia and raised blood pressure was greater in females than in males; while general as well as central obesity rose in parallel with an increase in SUA concentrations in both sexes.33 In addition, other data from adults suggest a modifying effect of obesity on the association between hyperuricemia and hypertension.37 However, a large Israeli study on healthy 40–70-year old subjects showed that high normal SUA levels (slightly above our reference range) at baseline predicted an increased risk of developing hypertension during a 10-year follow-up, even in subjects nonobese at baseline.38
Pediatric patients with hyperuricemia had an increased risk of mortality, among others, due to kidney diseases.39 Regardless of sex, our lean adolescents presented an inverse relationship between SUA levels and estimated glomerular filtration rate and the odds for glomerular filtration rate below the median was increased in hyperuricemic lean adolescents. Association between lower glomerular filtration rate and higher uric acid levels has formerly been documented in overweight/obese children and adolescents.12,13 Similarly, apparently healthy hyperuricemic adolescents and adults presented lower glomerular filtration rate compared with their normouricemic peers.31,38,40 In these studies, including ours, the decline in glomerular filtration rate was within the normal range values, reaching 7–10%. Such a mild decline cannot explain the observed rise in SUA levels: in adults, hypofiltration (estimated glomerular filtration rate less than age-/sex-specific fifth percentile) associated with about a 16% rise in uricemia.41
In adults, elevated CRP level is an independent predictor of all-cause, and cardiovascular mortality risk.42 Moreover, baseline SUA level predicted probability of developing clinically relevant increased CRP during three years of follow-up.43 In obese juveniles, associations between uricemia, markers of inflammation, and BMI have been described.5 In our females, hyperuricemia was associated with higher CRP even in the absence of obesity. The linkage between hyperuricemia and low-grade inflammation might be sex-specific, similarly as the association between CRP and MetS, which is present in females but not in males.44
Observed discrete decline in glomerular filtration rate, and a mild rise of CRP levels in females, might be forerunners of overt manifestation of increased cardiometabolic risk in the future. The coexistence of elevated SUA with lower renal function over prolonged periods may eventually evoke elevation of BP. Hypertension frequently presents concurrently with other cardiovascular disease risk factors, such as insulin resistance, atherogenic dyslipidemia, and central obesity, constituting the MetS.45–47 Compared with manifestation of isolated components, clustering of hyperuricemia with the components in MetS confers a higher probability of manifestation of cardiovascular and renal diseases, diabetes, and mortality.45,47 As hyperuricemia is a marker of poor outcome,39,48 a missing link between hyperuricemia and a continuous cardiometabolic score in our lean hyperuricemic adolescents might only be a temporary finding. Persistent elevation of SUA might, in the long-term, exert negative health effects even in lean subjects. In adults free from MetS at baseline, elevated baseline SUA levels increased the odds to manifest MetS seven years later, regardless of their BMI status at baseline.49 Longitudinal studies are needed to elucidate whether cardiometabolic risk of lean hyperuricemic adolescents increases with aging, eventually with respect to body weight gain.
Decision-tree models confirmed the difference in determinants of uricemia in lean and overweight/obese adolescents. The model identified phenotypes displaying the highest mean SUA levels; but it did not meet our expectations in terms of prediction. Hyperuricemic subjects did not unequivocally cluster in certain phenotypes, their distribution among the end-nodes appeared to be rather random than reflecting preferential clustering. In the end-node pairs, phenotypes with higher cardiometabolic risk did not unambiguously present higher SUA levels. Nevertheless, these differences were not robust, suggesting rather a statistical than clinical significance. As the prevalence of MetS, its components, as well as that of other indicators of increased cardiometabolic risk increases by aging, the question arises whether decision-tree modelling might be a useful predictive tool for identification of hyperuricemia-associated phenotypes in older populations.
Metabolic derangements observed in lean hyperuricemic adolescents do not elucidate the background leading to rise in SUA levels to the range displayed by their overweight/obese peers. Since we neither have data on the consumption of purines-rich food, fructose-containing beverages, and alcohol, nor those on physical activity or genetics of our adolescents, we might only speculate on the role of lifestyle or genetic factors.
The strength of this study is a reasonably large sample of apparently healthy young adolescents that minimized confounding by comorbidities. Our study was probably the first to examine the associations between SUA levels and variables characterizing cardiometabolic risk separately in overweight/obese and in lean adolescents of both sexes. There is a limitation of generalizing our findings to populations with different epidemiological, anthropometric or clinical characteristics. Observed associations might be biased by voluntary participation and potential participation of close relatives. Although we were able to examine the relationship between SUA levels and other variables, cross-sectional design did not allow for examination of causality.
Conclusions
About seven out of 100 apparently healthy adolescent males and about three out of 100 females present hyperuricemic lean phenotypes. These individuals remain largely undiagnosed, unless there is a reasonable indication to analyze SUA concentration. Different associations of hyperuricemia with variables characterizing cardiovascular risk in lean and overweight/obese subjects remains undiscovered unless these groups are analyzed separately. Further studies are needed to elucidate which mechanisms lead to hyperuricemia in lean adolescents, and whether hyperuricemia in lean adolescents might have clinical consequences in later life. Knowledge on prognosis of these individuals is essential to identify potential proper follow-up strategies.
Data Sharing Statement
The datasets used and/or analyzed during the current study are available from the corresponding author on reasonable request.
Acknowledgments
We thank all those who put their effort toward the accomplishment of the Respect for Health study. This work was supported by grants from The Slovak Research and Development Agency (APVV, 0447–12); The Scientific Grant Agency of the Ministry of Education, Science, Research and Sport of the Slovak Republic and the Slovak Academy of Sciences (VEGA, 1/0637/13); Ministry of Health of the Slovak Republic (2018/36-LFUK-10), and by the Bratislava Self-governing Region.
Author Contributions
All authors contributed to data analysis, drafting or revising the article, have agreed on the journal to which the article will be submitted, gave final approval of the version to be published, and agree to be accountable for all aspects of the work.
Disclosure
The authors report no conflicts of interest in this work.
References
1. Ogura T, Matsuura K, Matsumoto Y, et al. Recent trends of hyperuricemia and obesity in Japanese male adolescents, 1991 through 2002. Metabolism. 2004;53(4):448–453. doi:10.1016/j.metabol.2003.11.017
2. Bonora E, Targher G, Zenere MB, et al. Relationship of uric acid concentration to cardiovascular risk factors in young men. Role of obesity and central fat distribution. The verona young men atherosclerosis risk factors study. Int J Obes Relat Metab Disord. 1996;20(11):975–980.
3. Ford ES, Li C, Cook S, Choi HK. Serum concentrations of uric acid and the metabolic syndrome among US children and adolescents. Circulation. 2007;115(19):2526–2532. doi:10.1161/CIRCULATIONAHA.106.657627
4. Goncalves JP, Ramos E, Severo M, et al. Serum uric acid and cardiovascular risk among Portuguese adolescents. J Adolesc Health. 2015;56(4):376–381. doi:10.1016/j.jadohealth.2014.11.010
5. Wasilewska A, Tenderenda E, Taranta-Janusz K, Tobolczyk J, Stypulkowska J. Markers of systemic inflammation in children with hyperuricemia. Acta Paediatr. 2012;101(5):497–500. doi:10.1111/j.1651-2227.2011.02582.x
6. Lee AM, Gurka MJ, DeBoer MD. Correlation of metabolic syndrome severity with cardiovascular health markers in adolescents. Metabolism. 2017;69:87–95. doi:10.1016/j.metabol.2017.01.008
7. Sun HL, Pei D, Lue KH, Chen YL. Uric acid levels can predict metabolic syndrome and hypertension in adolescents: a 10-year longitudinal study. PLoS One. 2015;10(11):e0143786. doi:10.1371/journal.pone.0143786
8. Kumar R, Khalsa DD, Carmody JB. Serum uric acid and hyperuricemia in U.S. adolescents: 40-year trends. Clin Exp Rheumatol. 2016;34(1 Suppl 95):S2223.
9. Tang L, Kubota M, Nagai A, Mamemoto K, Tokuda M. Hyperuricemia in obese children and adolescents: the relationship with metabolic syndrome. Pediatr Rep. 2010;2(1):e12.
10. Luciano R, Shashaj B, Spreghini M, et al. Percentiles of serum uric acid and cardiometabolic abnormalities in obese Italian children and adolescents. Ital J Pediatr. 2017;43(1):3. doi:10.1186/s13052-016-0321-0
11. Ozalp Kizilay D, Sen S. Associations between serum uric acid concentrations and cardiometabolic risk and renal injury in obese and overweight children. J Clin Res Pediatr Endocrinol. 2019;11(3):262–269. doi:10.4274/jcrpe.galenos.2018.2019.0241
12. Ricotti R, Genoni G, Giglione E, et al. High-normal estimated glomerular filtration rate and hyperuricemia positively correlate with metabolic impairment in pediatric obese patients. PLoS One. 2018;13(3):e0193755. doi:10.1371/journal.pone.0193755
13. Santucci MP, Muzzio ML, Peredo MS, et al. Different alterations of glomerular filtration rate and their association with uric acid in children and adolescents with type 1 diabetes or with overweight/obesity. Pediatr Diabetes. 2020;21(4):657–663. doi:10.1111/pedi.13008
14. Rochlani Y, Pothineni NV, Mehta JL. Metabolic syndrome: does it differ between women and men? Cardiovasc Drugs Ther. 2015;29(4):329–338.
15. Ostrihonova T, Rimarova K, Beresova J, Kontrosova S, Dorko E, Diabelkova J. Prevalence and trends of metabolic syndrome in slovakia during the period of 2003-2012. Cent Eur J Public Health. 2017;25(4):313–320. doi:10.21101/cejph.a4968
16. Gurecka R, Koborova I, Sebek J, Sebekova K. Presence of cardiometabolic risk factors is not associated with microalbuminuria in 14-to-20-years old slovak adolescents: a cross-sectional, population study. PLoS One. 2015;10(6):e0129311. doi:10.1371/journal.pone.0129311
17. Matthews DR, Hosker JP, Rudenski AS, Naylor BA, Treacher DF, Turner RC. Homeostasis model assessment: IR and beta-cell function from fasting plasma glucose and insulin concentration in man. Diabetologia. 1985;28(7):412–419. doi:10.1007/BF00280883
18. Dobiasova M, Frohlich J. The plasma parameter log (TG/HDL-C) as an atherogenic index: correlation with lipoprotein particle size and esterification rate in apoB-lipoprotein-depleted plasma (FER(HDL)). Clin Biochem. 2001;34(7):583–588. doi:10.1016/S0009-9120(01)00263-6
19. Pottel H, Hoste L, Dubourg L, et al. An estimated glomerular filtration rate equation for the full age spectrum. Nephrol Dial Transplant. 2016;31(5):798–806. doi:10.1093/ndt/gfv454
20. Soldatovic I, Vukovic R, Culafic D, Gajic M, Dimitrijevic-Sreckovic V. siMS Score: simple Method for Quantifying Metabolic Syndrome. PLoS One. 2016;11(1):e0146143. doi:10.1371/journal.pone.0146143
21. Cole TJ, Bellizzi MC, Flegal KM, Dietz WH. Establishing a standard definition for child overweight and obesity worldwide: international survey. BMJ. 2000;320(7244):1240–1243. doi:10.1136/bmj.320.7244.1240
22. Sebekova K, Stefikova K, Polakovicova D, Spustova V, Dzurik R. Does magnesium dysbalance participate in the development of insulin resistance in early stages of renal disease? Physiol Res. 2002;51(6):605–612.
23. Ridker PM. Clinical application of C-reactive protein for cardiovascular disease detection and prevention. Circulation. 2003;107(3):363–369. doi:10.1161/01.CIR.0000053730.47739.3C
24. Hertelyova Z, Vaskova J, Vasko L. Waist circumference-to-height ratio detected in a convenient sample of young slovak people with increased cardio-metabolic risk. Cent Eur J Public Health. 2016;24(2):95–102. doi:10.21101/cejph.a4007
25. Kubota M. Hyperuricemia in children and adolescents: present knowledge and future directions. J Nutr Metab. 2019;2019:3480718. doi:10.1155/2019/3480718
26. Krzystek-Korpacka M, Patryn E, Kustrzeba-Wojcicka I, Chrzanowska J, Gamian A, Noczynska A. Gender-specific association of serum uric acid with metabolic syndrome and its components in juvenile obesity. Clin Chem Lab Med. 2011;49(1):129–136. doi:10.1515/CCLM.2011.011
27. Mele C, Tagliaferri MA, Saraceno G, et al. Serum uric acid potentially links metabolic health to measures of fuel use in lean and obese individuals. Nutr Metab Cardiovasc Dis. 2018;28(10):1029–1035. doi:10.1016/j.numecd.2018.06.010
28. Lima WG, Martins-Santos ME, Chaves VE. Uric acid as a modulator of glucose and lipid metabolism. Biochimie. 2015;116:17–23. doi:10.1016/j.biochi.2015.06.025
29. Wan X, Xu C, Lin Y, et al. Uric acid regulates hepatic steatosis and insulin resistance through the NLRP3 inflammasome-dependent mechanism. J Hepatol. 2016;64(4):925–932. doi:10.1016/j.jhep.2015.11.022
30. Volpe A, Ye C, Hanley AJ, Connelly PW, Zinman B, Retnakaran R. Changes over time in uric acid in relation to changes in insulin sensitivity, beta-cell function, and glycemia. J Clin Endocrinol Metab. 2020;105(3):e651e659. doi:10.1210/clinem/dgz199
31. Shani M, Vinker S, Dinour D, et al. High normal uric acid levels are associated with an increased risk of diabetes in lean, normoglycemic healthy women. J Clin Endocrinol Metab. 2016;101(10):3772–3778. doi:10.1210/jc.2016-2107
32. Johnson RJ, Nakagawa T, Sanchez-Lozada LG, et al. Sugar, uric acid, and the etiology of diabetes and obesity. Diabetes. 2013;62(10):3307–3315. doi:10.2337/db12-1814
33. Lin YK, Lin YP, Lee JT, et al. Sex-specific association of hyperuricemia with cardiometabolic abnormalities in a military cohort: the CHIEF study. Medicine. 2020;99(12):e19535. doi:10.1097/MD.0000000000019535
34. Kuwabara M, Borghi C, Cicero AFG, et al. Elevated serum uric acid increases risks for developing high LDL cholesterol and hypertriglyceridemia: A five-year cohort study in Japan. Int J Cardiol. 2018;261:183–188. doi:10.1016/j.ijcard.2018.03.045
35. Wang Y, Hu JW, Lv YB, et al. The role of uric acid in hypertension of adolescents, prehypertension and salt sensitivity of blood pressure. Med Sci Monit. 2017;23:790–795. doi:10.12659/MSM.899563
36. Cortese F, Giordano P, Scicchitano P, et al. Uric acid: from a biological advantage to a potential danger. A focus on cardiovascular effects. Vascul Pharmacol. 2019;120:106565. doi:10.1016/j.vph.2019.106565
37. Tian S, Liu Y, Xu Y, Feng A. Does obesity modify the epidemiological association between hyperuricemia and the prevalence of hypertension among Northern Chinese community-dwelling people? A Chinese population-based study. BMJ Open. 2019;9(11):e031803. doi:10.1136/bmjopen-2019-031803
38. Leiba A, Vinker S, Dinour D, Holtzman EJ, Shani M. Uric acid levels within the normal range predict increased risk of hypertension: a cohort study. J Am Soc Hypertens. 2015;9(8):600–609. doi:10.1016/j.jash.2015.05.010
39. Hsia SH, Chou IJ, Kuo CF, et al. Survival impact of serum uric acid levels in children and adolescents. Rheumatol Int. 2013;33(11):2797–2802. doi:10.1007/s00296-013-2808-y
40. Lu J, Sun W, Cui L, et al. A cross-sectional study on uric acid levels among Chinese adolescents. Pediatr Nephrol. 2020;35(3):441–446. doi:10.1007/s00467-019-04357-w
41. Okada R, Yasuda Y, Tsushita K, Wakai K, Hamajima N, Matsuo S. Glomerular hyperfiltration in prediabetes and prehypertension. Nephrol Dial Transplant. 2012;27(5):1821–1825. doi:10.1093/ndt/gfr651
42. Li Y, Zhong X, Cheng G, et al. Hs-CRP and all-cause, cardiovascular, and cancer mortality risk: A meta-analysis. Atherosclerosis. 2017;259:75–82. doi:10.1016/j.atherosclerosis.2017.02.003
43. Ruggiero C, Cherubini A, Miller E
44. Bo S, Gentile L, Ciccone G, et al. The metabolic syndrome and high C-reactive protein: prevalence and differences by sex in a southern-European population-based cohort. Diabetes Metab Res Rev. 2005;21(6):515–524. doi:10.1002/dmrr.561
45. Redon J, Cifkova R, Laurent S, et al. The metabolic syndrome in hypertension: european society of hypertension position statement. J Hypertens. 2008;26(10):1891–1900. doi:10.1097/HJH.0b013e328302ca38
46. Karuparthi PR, Yerram P, Lastra G, Hayden MR, Sowers JR. Understanding essential hypertension from the perspective of the cardiometabolic syndrome. J Am Soc Hypertens. 2007;1(2):120–134. doi:10.1016/j.jash.2007.01.006
47. Manrique C, Lastra G, Whaley-Connell A, Sowers JR. Hypertension and the cardiometabolic syndrome. J Clin Hypertens. 2005;7(8):471–476. doi:10.1111/j.1524-6175.2005.04617.x
48. Zhao G, Huang L, Song M, Song Y. Baseline serum uric acid level as a predictor of cardiovascular disease related mortality and all-cause mortality: a meta-analysis of prospective studies. Atherosclerosis. 2013;231(1):61–68. doi:10.1016/j.atherosclerosis.2013.08.023
49. Norvik JV, Storhaug HM, Ytrehus K, et al. Overweight modifies the longitudinal association between uric acid and some components of the metabolic syndrome: the Tromsø Study. BMC Cardiovasc Disord. 2016;16:85. doi:10.1186/s12872-016-0265-8
 © 2020 The Author(s). This work is published and licensed by Dove Medical Press Limited. The
full terms of this license are available at https://www.dovepress.com/terms
and incorporate the Creative Commons Attribution
- Non Commercial (unported, 3.0) License.
By accessing the work you hereby accept the Terms. Non-commercial uses of the work are permitted
without any further permission from Dove Medical Press Limited, provided the work is properly
attributed. For permission for commercial use of this work, please see paragraphs 4.2 and 5 of our Terms.
© 2020 The Author(s). This work is published and licensed by Dove Medical Press Limited. The
full terms of this license are available at https://www.dovepress.com/terms
and incorporate the Creative Commons Attribution
- Non Commercial (unported, 3.0) License.
By accessing the work you hereby accept the Terms. Non-commercial uses of the work are permitted
without any further permission from Dove Medical Press Limited, provided the work is properly
attributed. For permission for commercial use of this work, please see paragraphs 4.2 and 5 of our Terms.