")
Back to Journals » Neuropsychiatric Disease and Treatment » Volume 18
Associations of Serum Cytokines, Growth Factors, and High-Sensitivity C-Reactive Protein Levels in Patients with Major Depression with and without Type 2 Diabetes Mellitus: An Explanatory Investigation
Authors Hoshikawa T, Okamoto N , Natsuyama T, Fujii R, Ikenouchi A , Honma Y, Harada M, Yoshimura R
Received 19 November 2021
Accepted for publication 4 January 2022
Published 3 February 2022 Volume 2022:18 Pages 173—186
DOI https://doi.org/10.2147/NDT.S350121
Checked for plagiarism Yes
Review by Single anonymous peer review
Peer reviewer comments 3
Editor who approved publication: Dr Taro Kishi
Takashi Hoshikawa,1 Naomichi Okamoto,1 Tomoya Natsuyama,1 Rintaro Fujii,1 Atsuko Ikenouchi,1 Yuichi Honma,2 Masaru Harada,2 Reiji Yoshimura1
1Department of Psychiatry, University of Occupational and Environmental Health, Kitakyushu, Fukuoka, 8078555, Japan; 2 3rd Internal Medicine, University of Occupational and Environmental Health, Kitakyushu, Fukuoka, 8078555, Japan
Correspondence: Reiji Yoshimura
Department of Psychiatry, University of Occupational and Environmental Health, Kitakyushu, Fukuoka, 8078555, Japan
, Tel +81936917253
, Fax +81936924894
, Email [email protected]
Purpose: We investigated the serum levels of cytokines, including interleukin 1β (IL-β), IL-6, IL-8, IL-10, tumor necrosis factor-alpha (TNF-α), and growth factors, including brain-derived neurotrophic factor, vascular endothelial growth factor, and insulin-like growth factor 1, and their association with major depression in patients with and without type 2 diabetes mellitus. We also investigated the response to antidepressant treatment in both groups.
Patients and Methods: Forty-one patients with major depression were recruited at the University Hospital of Occupational and Environmental Health. All patients were diagnosed with major depression using the Diagnostic and Statistical Manual for Mental Disorders, Fifth Edition. Type 2 diabetes mellitus was diagnosed according to the criteria of the Japan Diabetes Society. Six healthy controls with no history of psychiatric or physical diseases were also enrolled. Serum levels of several cytokines, growth factors, and high-sensitivity C-reactive protein (hs-CRP) were measured. The clinical symptoms of patients with major depression were assessed using the Montgomery-Asberg Depression Rating Scale.
Results: Significant differences in cytokines, growth factors, and hs-CRP were observed between the major depression and healthy control groups. Serum TNF-α levels were significantly higher in patients with major depression and type 2 diabetes mellitus than in those without type 2 diabetes mellitus. In the major depression group, serum IL-6 and hs-CRP levels tended to be higher in patients with type 2 diabetes mellitus than in those without. Several correlations among cytokines, growth factors, and hs-CRP were observed in patients with major depression with and without type 2 diabetes mellitus. Responses to pharmacological interventions for major depression did not differ between patients with and without type 2 diabetes mellitus.
Conclusion: Serum levels of TNF-α, hs-CRP, and IL-6 were different between patients with major depression with and without type 2 diabetes mellitus. Also, correlations were found between serum levels of cytokines, growth factors, and hs-CRP in patients with major depression. Inflammatory factors, which may be associated with growth factors, may be involved in the pathophysiology of major depression, particularly among patients with comorbid type 2 diabetes mellitus.
Keywords: major depression, diabetes mellitus, cytokine, growth factor, high-sensitivity C-reactive protein, brain-derived neurotrophic factor
Introduction
Given that diabetes mellitus and major depression affect approximately 8.3% and 10% of the global population, respectively,1,2 a degree of comorbidity between the two conditions is expected.3 Significant depressive symptoms affect approximately one in four adults with type 1 and type 2 diabetes, whereas a formal diagnosis of depressive disorder is made in approximately 10–15% of people with diabetes mellitus.4 The relationship between major depression and diabetes mellitus is likely associated with a variety of biological mechanisms. Accumulating evidence suggests that inflammation plays a role in Inflammation plays the role, not the biomarkers. Biomarkers are a measure of inflammation as assessed with specific substances, such as cytokines and growth factors among many others.5 Meta-analyses have also reported significantly higher concentrations of the proinflammatory cytokines tumor necrosis factor-alpha (TNF-α) and IL-6 in patients with major depression than in healthy controls.6 Another meta-analysis7 confirmed the presence of higher mean levels of CRP in patients with major depression than in healthy controls. Research has also indicated that decreased plasma levels of brain-derived neurotrophic factor (BDNF) may be among the pathogenic factors involved in dementia and major depression, as well as type 2 diabetes mellitus, potentially explaining the clustering of these conditions in epidemiological studies.8 We previously reported that peripheral BDNF levels are decreased in patients with major depression and that BDNF polymorphisms are associated with treatment response.9 These findings suggest that BDNF is best understood as a biomarker for major depression and its response to treatment rather than as a risk factor for major depression.10–12 Although previous studies have demonstrated that the levels of proinflammatory cytokines (such as CRP) and growth factors, including BDNF, are altered in both major depression and diabetes mellitus, the precise associations between these factors and depression in patients with and without diabetes mellitus remain to be determined. It has been reported that BDNF Val66Met polymorphism might be implicated in the pathogenesis of depression in type 2 diabetes mellitus by decreasing serum BDNF levels in Han Chinese Subjects.13 These diverse challenges may activate common processes in which cytokines, which are inflammatory signaling molecules, provoke the dysregulation of several growth factors, including brain-derived neurotrophic factor, fibroblast growth factor-2, macrophage migration inhibitory factor, and erythropoietin, which might be associated with the development of depressive disorders and their comorbid illnesses, such as heart disease, diabetes mellitus, autoimmune conditions, and poststroke depression.14 Therefore, the present study aimed to perform the explanatory investigation for plasma levels of cytokines, including IL-1β, IL-6, IL-8, IL-10, and TNF-α; growth factors, including BDNF; vascular endothelial growth factor (VEGF); and insulin-like growth factor 1 (IGF-1), and their associations with major depression in patients with and without type 2 diabetes mellitus. We also investigated the drug responses in both groups. Although previous reports have shown the relationships among inflammation, major depression, and diabetes mellitus,15–17 there are no reports demonstrating the associations between cytokine and growth factor levels in patients with or without type 2 diabetes mellitus. To the best of our knowledge, this is the first report to describe such associations.
Patients and Methods
Ethics Statement
The study protocol was approved by the Ethics Committee of the University of Occupational and Environmental Health, Kitakyushu, Japan (approval no. UOHECRB21-057). All study participants provided written informed consent upon receiving an explanation of the study protocol and potential risks, which was conducted in accordance with the Declaration of Helsinki.
Participants
Forty-one patients with major depression participated in this study. The patients were recruited at the University Hospital of Occupational and Environmental Health, Japan. All patients were diagnosed with major depression using the Diagnostic and Statistical Manual for Mental Disorders, Fifth Edition.18 The exclusion criteria included a history of major neurological disease, epilepsy, cerebrovascular accident, head trauma with cognitive sequelae, and intellectual disability. Three of the 41 patients did not take any antidepressant medications, while 38 were taking antidepressant drugs. Type 2 diabetes mellitus was diagnosed according to the criteria of the Japan Diabetes Society. All patients with type 2 diabetes mellitus had no complications (stage 2). Of the 41 patients with major depression, 13 had concomitant type 2 diabetes. The distribution of medications taken by patients with type 2 diabetes mellitus is shown in Table 1. The duration of medication periods was 1–32 (median 3) years in the patients with major depression. Doses of antidepressants were kept constant doses at least 2 weeks before enrolling the study. Six healthy controls with no history of psychiatric or physical disease were enrolled in the present study. As this was an explanatory investigation, we did not perform a power analysis to determine the sample size for comparison in the present study.
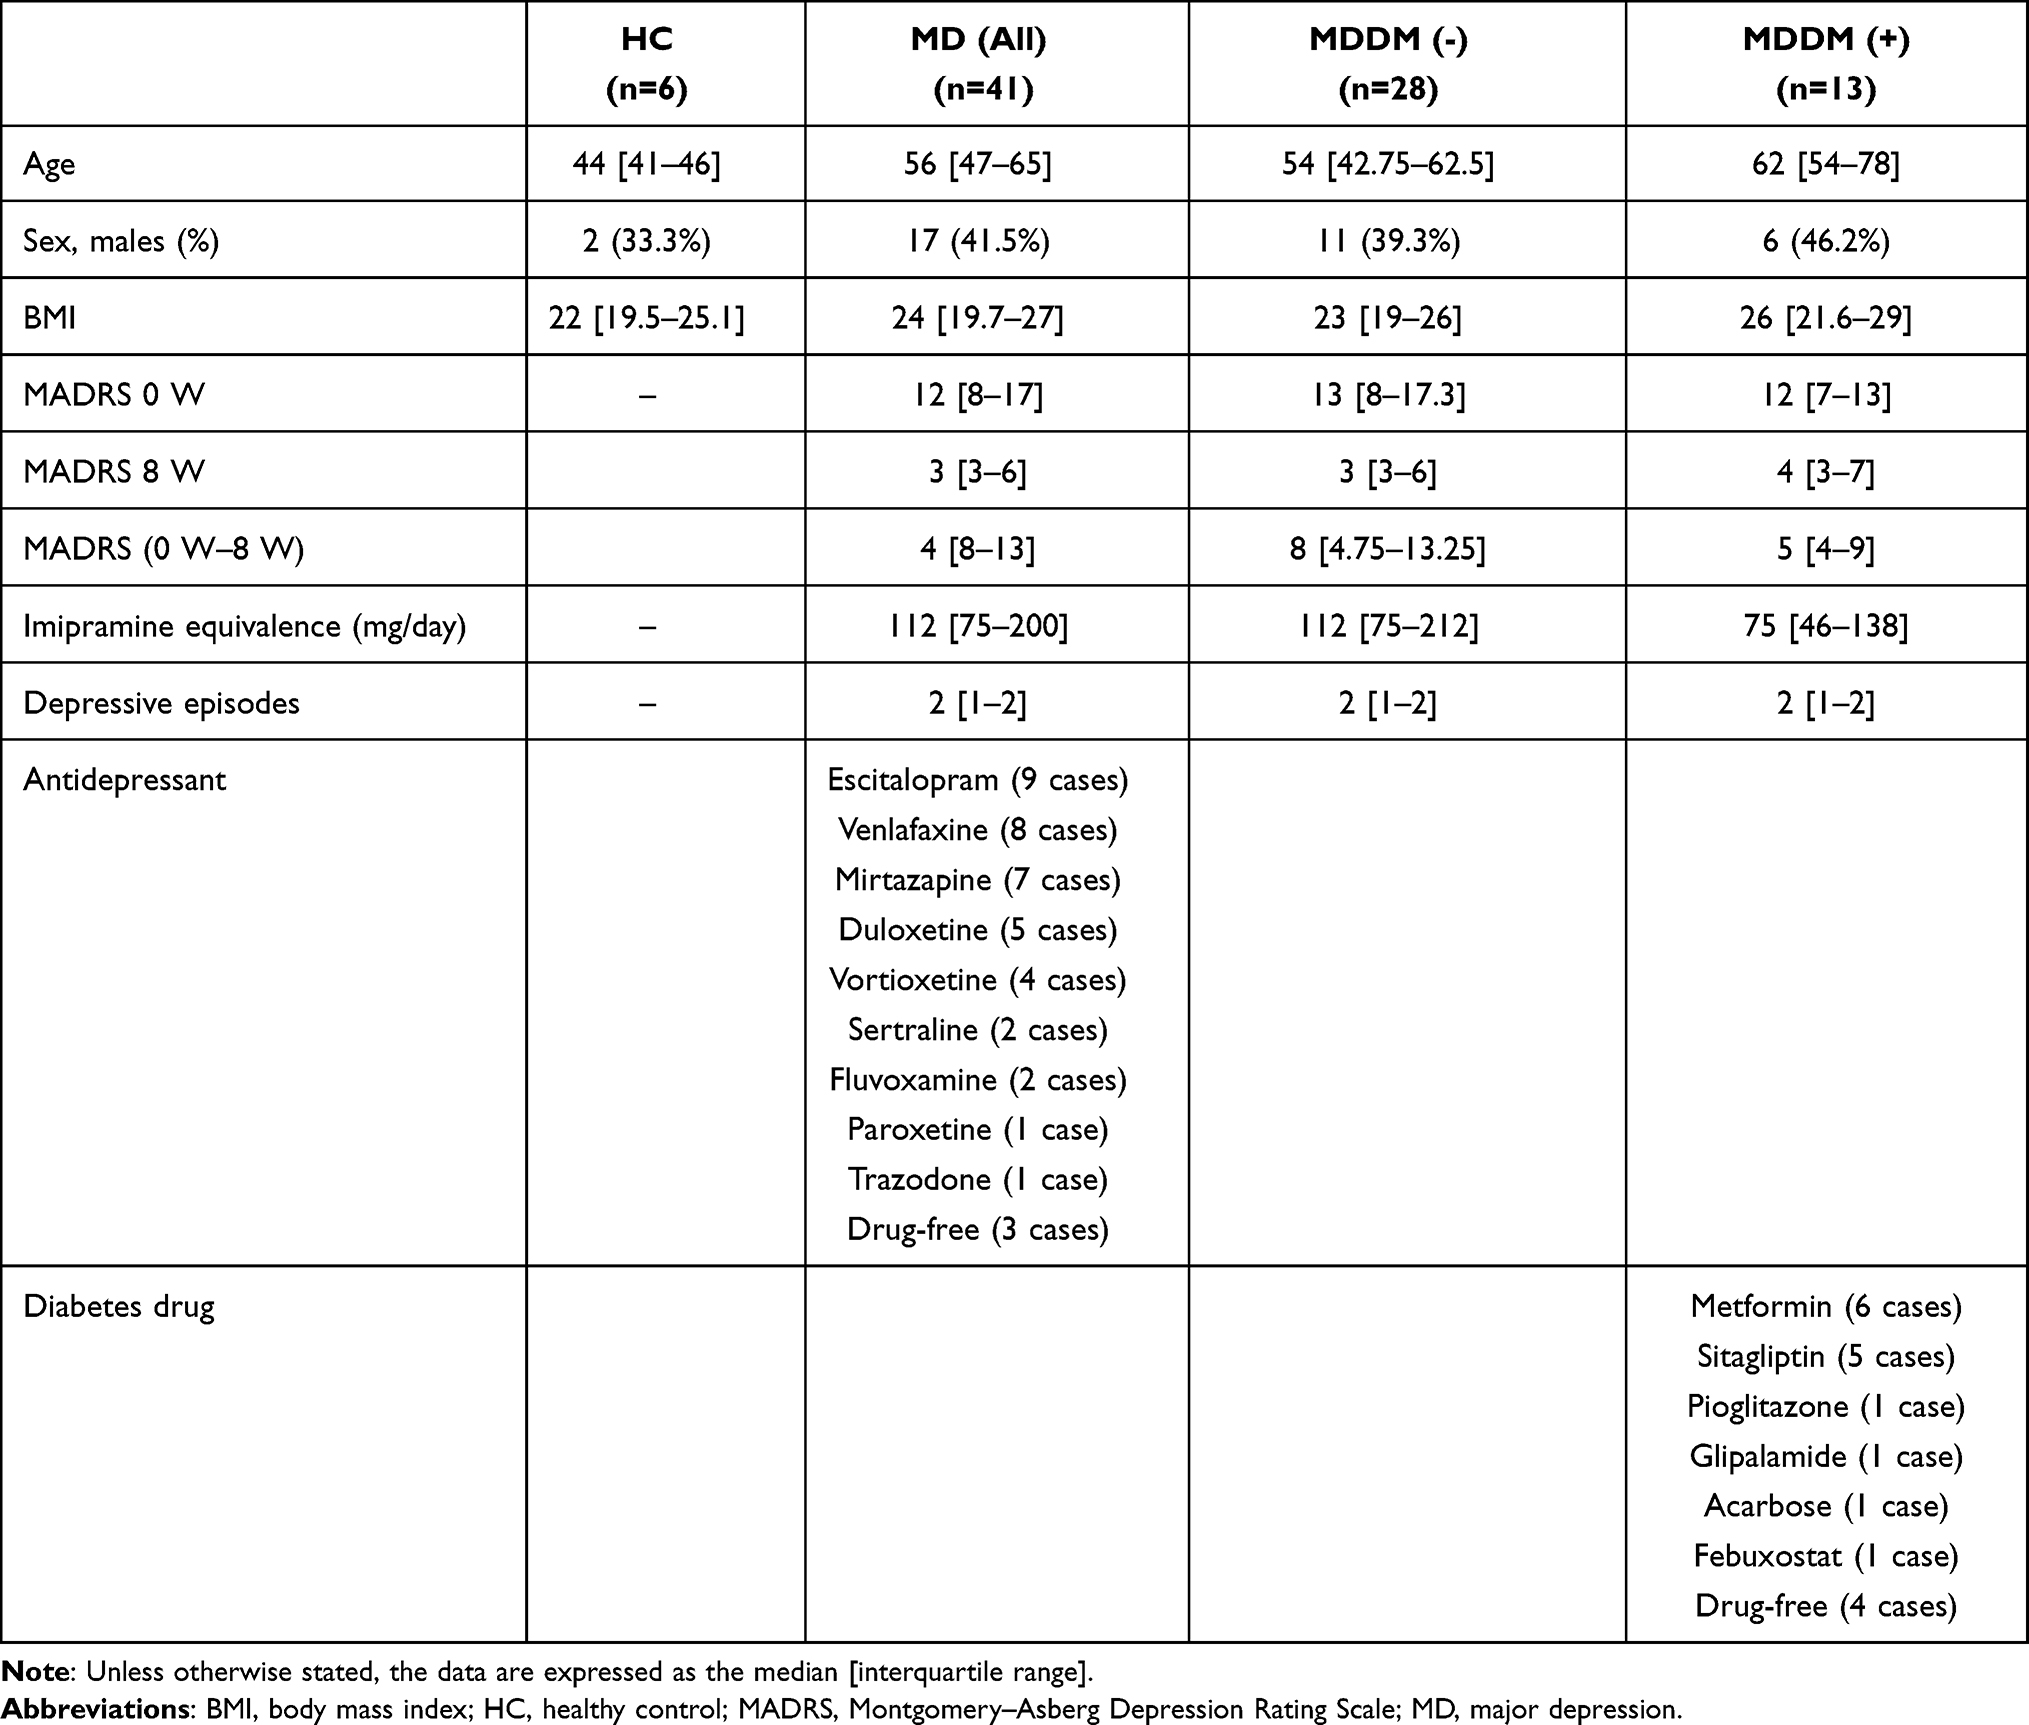 |
Table 1 Distribution of Demographic Characteristics in the Major Depression and Healthy Control Groups |
Clinical Assessment and Blood Sampling
The clinical symptoms of patients with major depression were assessed using the Montgomery–Asberg Depression Rating Scale (MADRS).19 Blood samples were taken from 7:00 am to 9:00 am before breakfast (at least 12 h after the last medication, because two patients took laxatives). After resting overnight, 15 mL of venous blood was drawn from the patients in the supine position. The serum samples were immediately separated using a centrifuge (2000 g, 10 min, 4°C) and stored at −80°C until they were used for the assays. The participants fasted and rested for at least 30 min prior to blood collection.
Measurement of Serum IGF-1, Hs-CRP, Cytokine, TNF-α, VEGF, and BDNF Levels
Blood samples were collected at the University of Occupational and Environmental Health and transferred to SRL Inc. (Kitakyushu, Japan). Serum IGF-1, cytokine (IL-1β, IL-6, IL-8, IL-10, and TNF-α), VEGF, and BDNF levels were measured using the sandwich enzyme immunoassay technique. A microplate was pre-coated with human monoclonal antibody. Standards and samples were pipetted into the wells, and any IGF-1, IL-1β, IL-6, IL-10, TNF-α, VEGF, or BDNF was bound by the immobilized antibody. After washing away any unbound substances, a biotinylated polyclonal antibody specific for humans was added to the wells. After washing to remove any unbound antibody-biotin reagent, enzyme-linked streptavidin was added to the wells. After washing away any unbound streptavidin-enzyme reagent, a substrate solution was added to the wells and color developed in proportion to the amount of IGF-1, IL-1β, IL-6, IL-8, IL-10, TNF-α, VEGF, BDNF, and hs-CRP bound in the initial step. Color development was stopped and the intensity of the color was measured. The intra- and inter-assay coefficients of variation were <8%. The limit of detections of IGF-1, IL-1β, IL-6, IL-8, IL-10, TNF-α, VEGF, BDNF were 4ng/mL, 11pg/mL, 0.3pg/mL, 2.1pg/mL, 3pg/mL, 0.15pg/mL, 21pg/mL, 62.5pg/mL, respectively.
Measurement of Serum Hs-CRP Levels
Polystyrene particles coated with monoclonal antibodies specific to human CRP were aggregated when mixed with samples containing CRP. These aggregates scattered a beam of light passing through the sample. The intensity of the scattered light was proportional to the concentration of the relevant protein in the sample. The results were evaluated by comparison with a standard of known concentration. The hs-CRP levels were measured using a commercially available enzyme-linked immunosorbent assay kit (Meso Scale Diagnostics, LLC., Rockville, MD, USA). The intra- and inter-assay coefficients of variation were <8%. The limit of detection of hs-CRP was 51ng/mL.
Statistical Analysis
Comparisons between the three groups were performed using analysis of variance (ANOVA) and analysis of covariance (ANCOVA). We used age as a covariate in ANCOVA. Correlations between variables were assessed using Spearman’s rank correlation coefficients. In the correlation matrix, positive correlations are shown in red, negative correlations are shown in green, and the strength of the correlation is expressed in terms of concentration. Logistic regression analysis was conducted in the MD group, with the prevalence of diabetes as the objective variable. In addition, we conducted a receiver operating characteristic (ROC) analysis. All data are expressed as medians and their interquartile ranges (IQR). All statistical analyses were performed using EZR software version 1.50 (Jichi Medical University Saitama Medical Center, Japan), a modified version of R Commander.20 The distribution of the data was checked with a histogram. Analysis items with p<0.05 were considered statistically significant. This was a preliminary study and no correction for multiple testing was made to prevent an increase in type two error.
Results
Background Characteristics
The present study included 41 patients with major depression, with or without type 2 diabetes mellitus, and six healthy controls. The background and clinical characteristics of the patients with major depression and healthy controls are shown in Table 1. The median decrease in MADRS scores from weeks 0 to 8 was 4 points in the major depression group (8–13 points). During the same period, the median MADRS scores in patients with and without type 2 diabetes mellitus decreased by 5 points (IQR, 4–9) and 8 points (IQR, 4.75–13.25), respectively.
Serum Levels of Cytokines, Hs-CRP, and Growth Factors in the Major Depression and Healthy Control Groups
We evaluated serum levels of IGF-1, cytokines (IL-6 and TNF-α), hs-CRP, VEGF, and BDNF among patients with major depression and healthy controls (Table 2, Figure 1). However, we could not determine serum levels of IL-1β, IL-8, and IL-10 because the measured values were below the level of detection. Serum levels of IL-6 and TNF-α were significantly higher in the major depression group than in the healthy control group. We also compared serum levels of IGF-1, cytokines (IL-6 and TNF-α), hs-CRP, VEGF, and BDNF between patients with and without type 2 diabetes mellitus in the major depression group. In this group, serum TNF-α levels were significantly higher in patients with type 2 diabetes mellitus than in those without type 2 diabetes mellitus. There was also a trend toward higher serum IL-6 and hs-CRP levels in patients with major depression and type 2 diabetes mellitus than in their counterparts without type 2 diabetes mellitus.
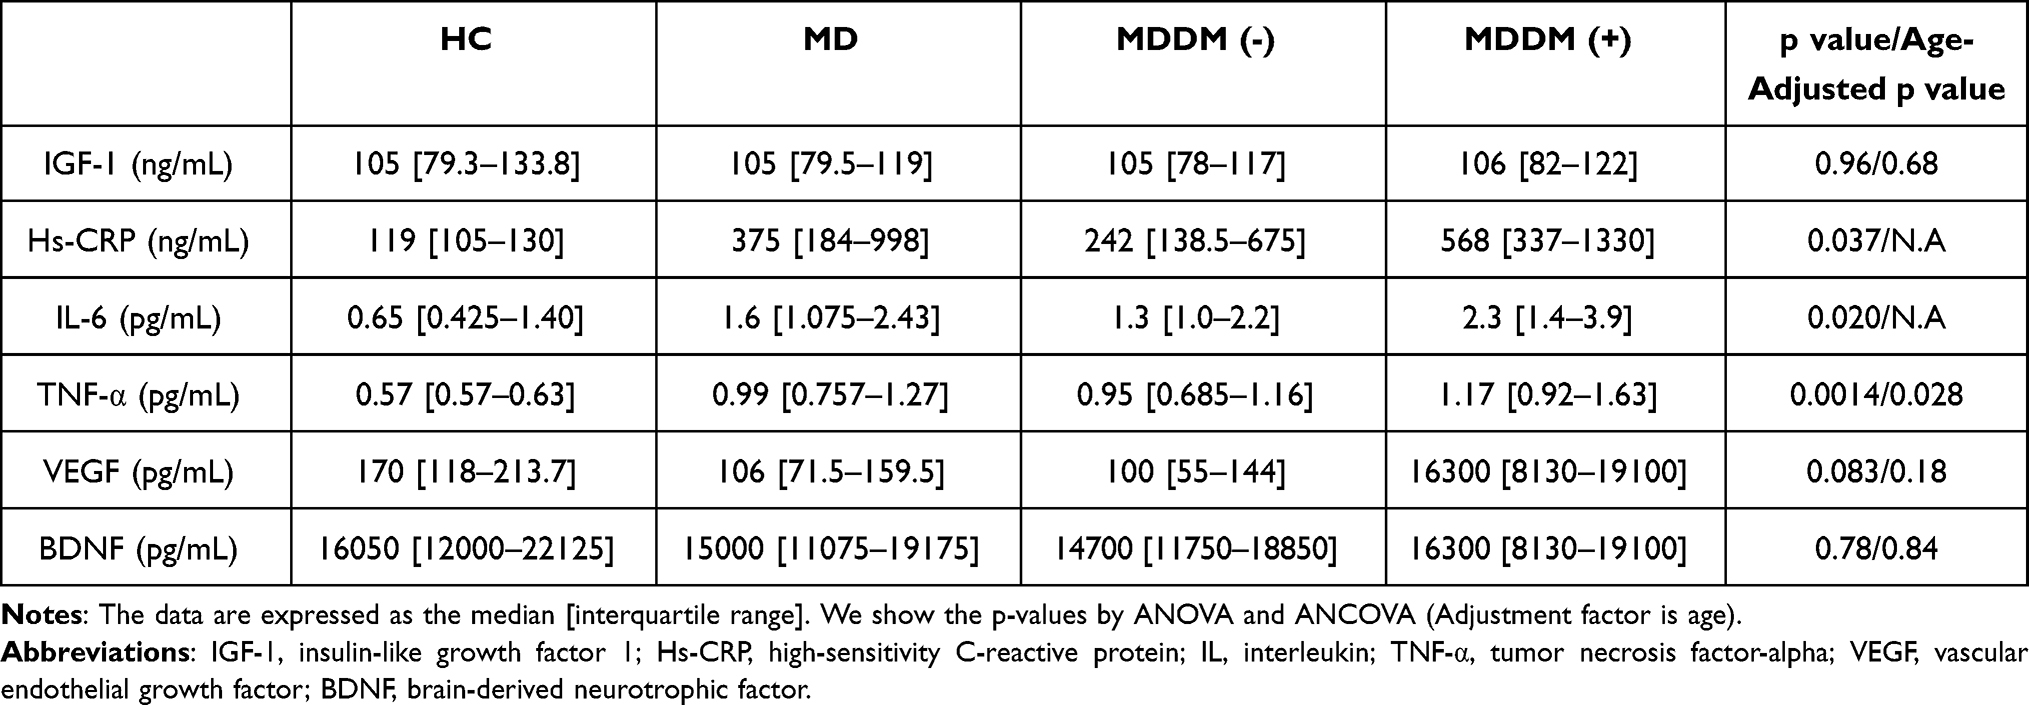 |
Table 2 Serum Levels of IGF-1, Hs-CRP, Cytokines, TNF-α, VEGF, and BDNF in the Major Depression and Healthy Control Groups |
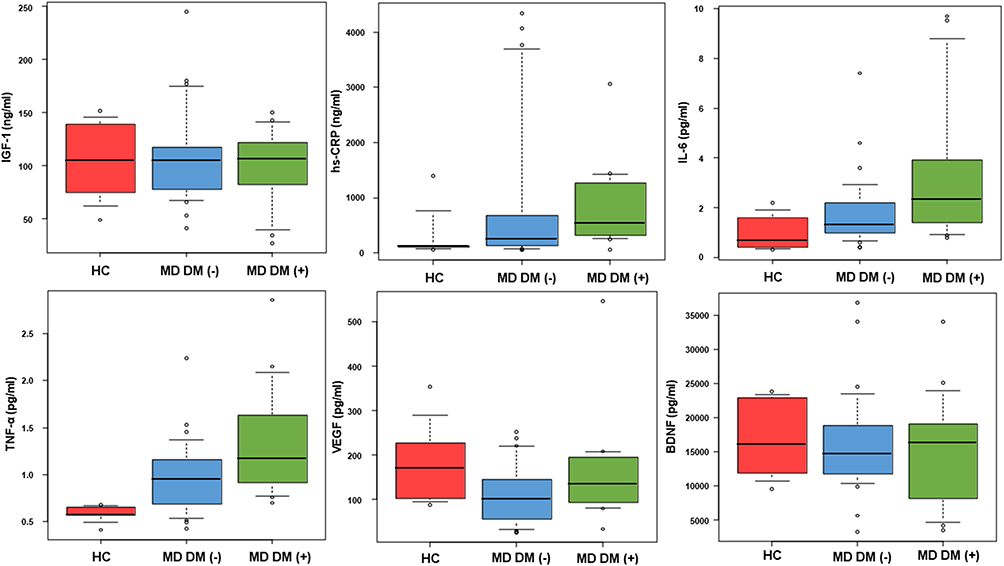 |
Figure 1 Serum levels of IGF-1, hs-CRP, cytokines (IL-6 and TNF-α), VEGF, and BDNF. We present a box-and-whisker diagram of serum levels of IGF-1, hs-CRP, cytokines (IL-6 and TNF-α), VEGF, and BDNF. |
Relationships Among Serum Levels of Cytokines, Growth Factors, Hs-CRP, and Severity of Depressive Symptoms in the Healthy Control Group
In healthy controls, we observed no significant correlations among the serum levels of cytokines, growth factors, and hs-CRP (Table 3).
 |
Table 3 Correlations Among IGF-1, Hs-CRP, Cytokine, TNF-α, VEGF, BDNF, and HbA1c Levels in the Healthy Control Group |
Relationships Among Serum Levels of Cytokines, Growth Factors, Hs-CRP, and Severity of Depressive Symptoms in the Major Depression Group
Serum IL-6 levels exhibited a significant positive correlation with serum TNF-α and hs-CRP levels in the major depression group. There were also significant positive correlations between serum TNF-α levels and serum hs-CRP levels and between serum BDNF levels and serum VEGF levels. A significant negative correlation was observed between serum TNF-α levels and serum BDNF levels, while a significant positive correlation was observed between serum hs-CRP levels and serum glycated hemoglobin (HbA1c) levels. No correlations were observed between MADRS scores and serum levels of cytokines, growth factors, or hs-CRP levels (Table 4).
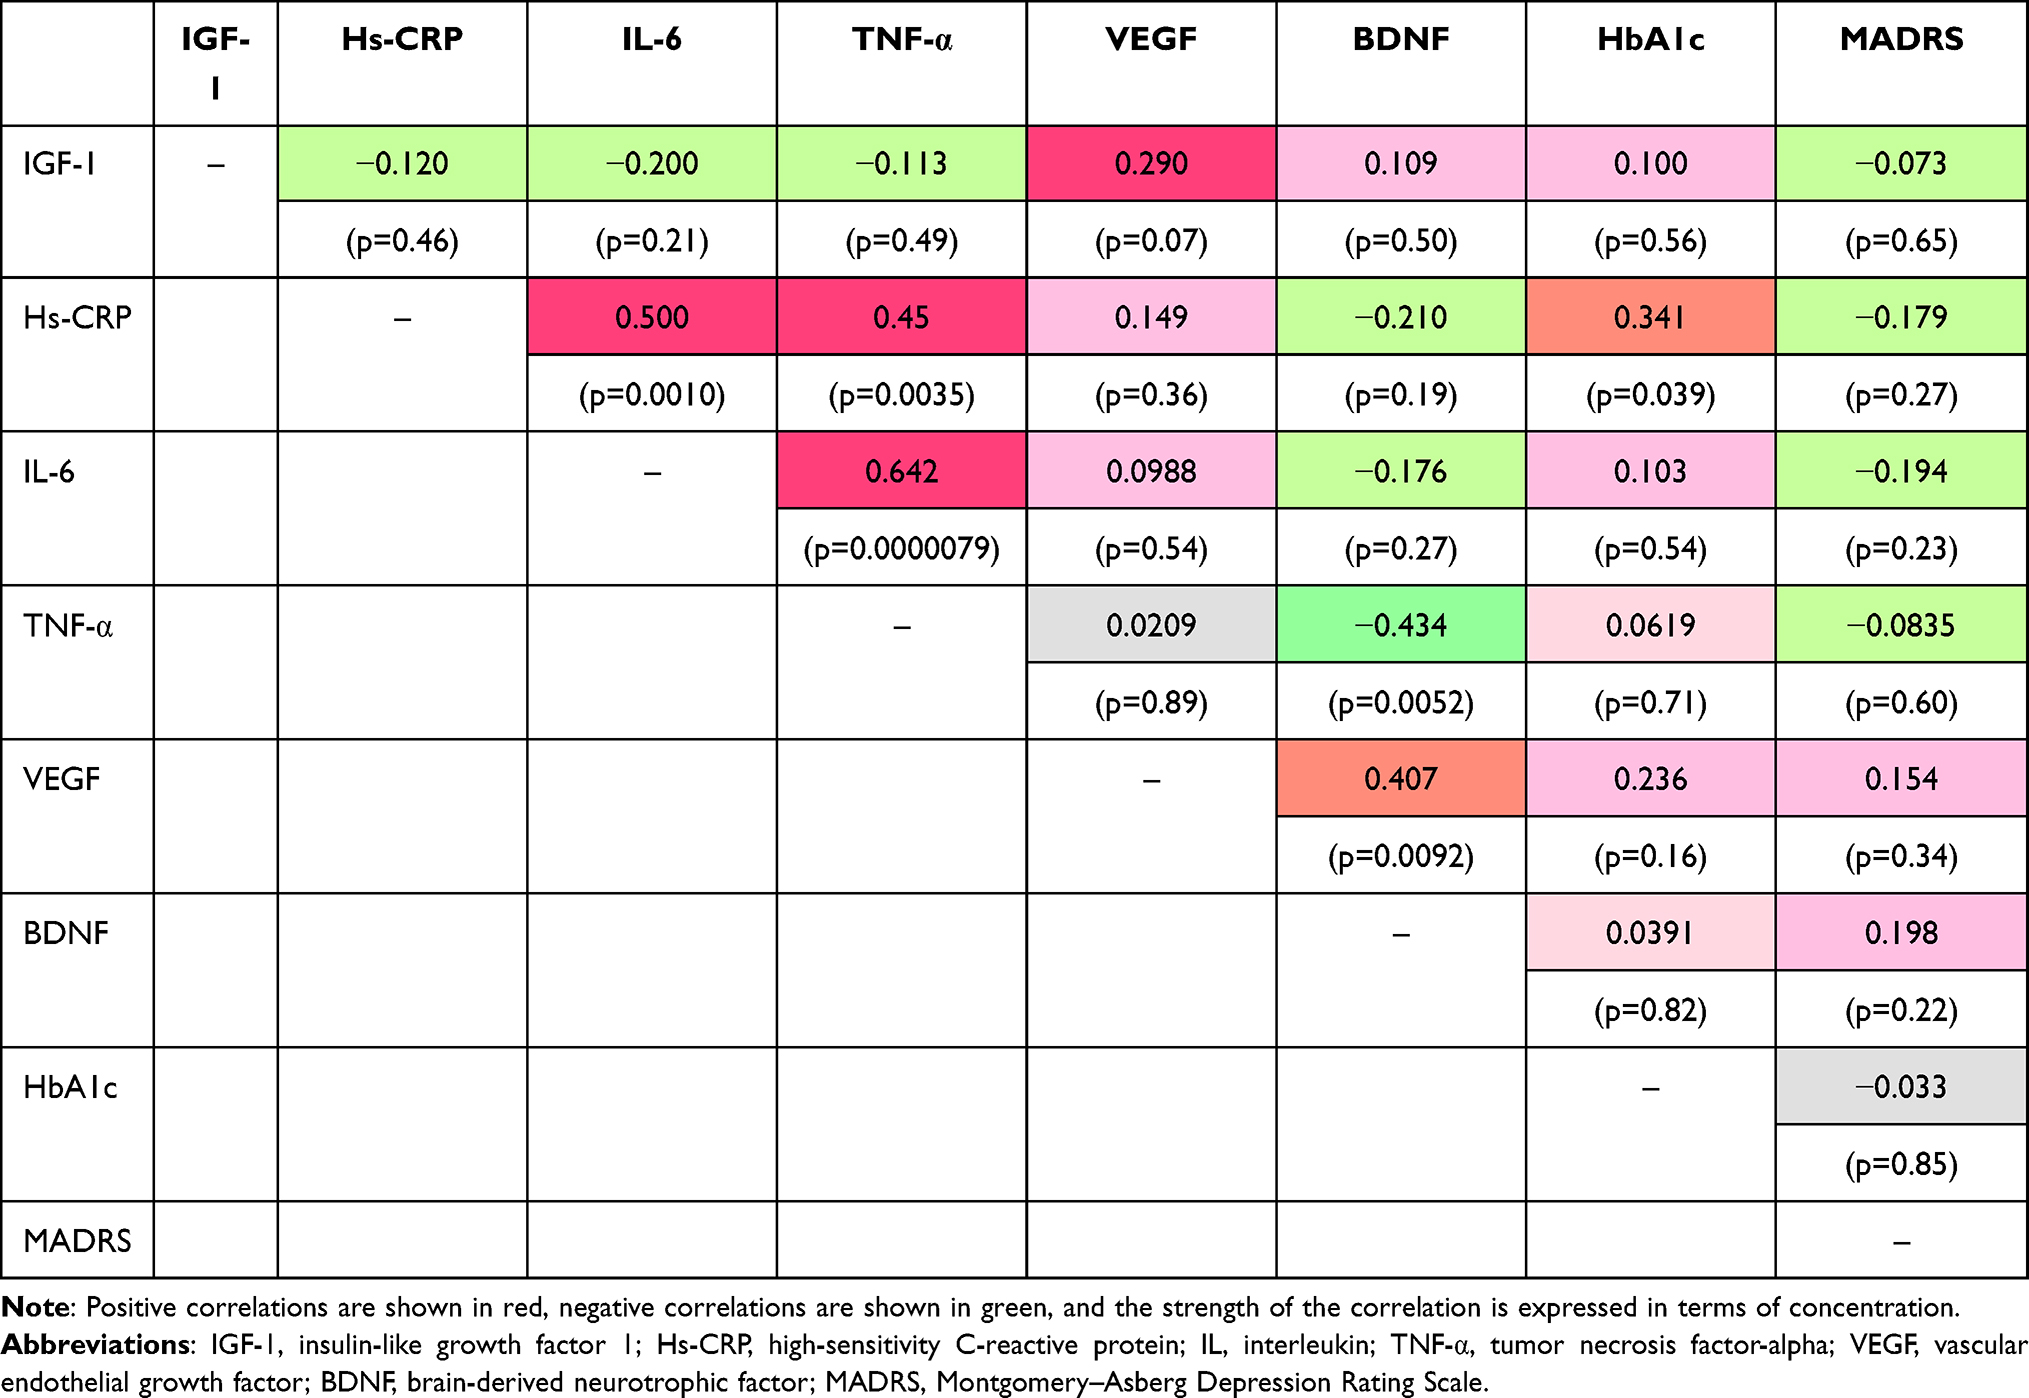 |
Table 4 Correlations Among IGF-1, Hs-CRP, Cytokines, TNF-α, VEGF, BDNF, HbA1c, and MADRS in the Major Depression Group |
Relationships Among Serum Levels of Cytokines, Growth Factors, Hs-CRP, and Severity of Depressive Symptoms in Patients with Major Depression without Type 2 Diabetes Mellitus
Among patients with major depression without type 2 diabetes mellitus, serum IL-6 levels exhibited a significant positive correlation with serum TNF-α and hs-CRP levels. A significant positive correlation was also observed between serum BDNF levels and serum VEGF levels, while a significant negative correlation was observed between serum hs-CRP levels and serum HbA1c levels. No correlations were observed between MADRS scores and serum levels of cytokines, growth factors, or hs-CRP (Table 5).
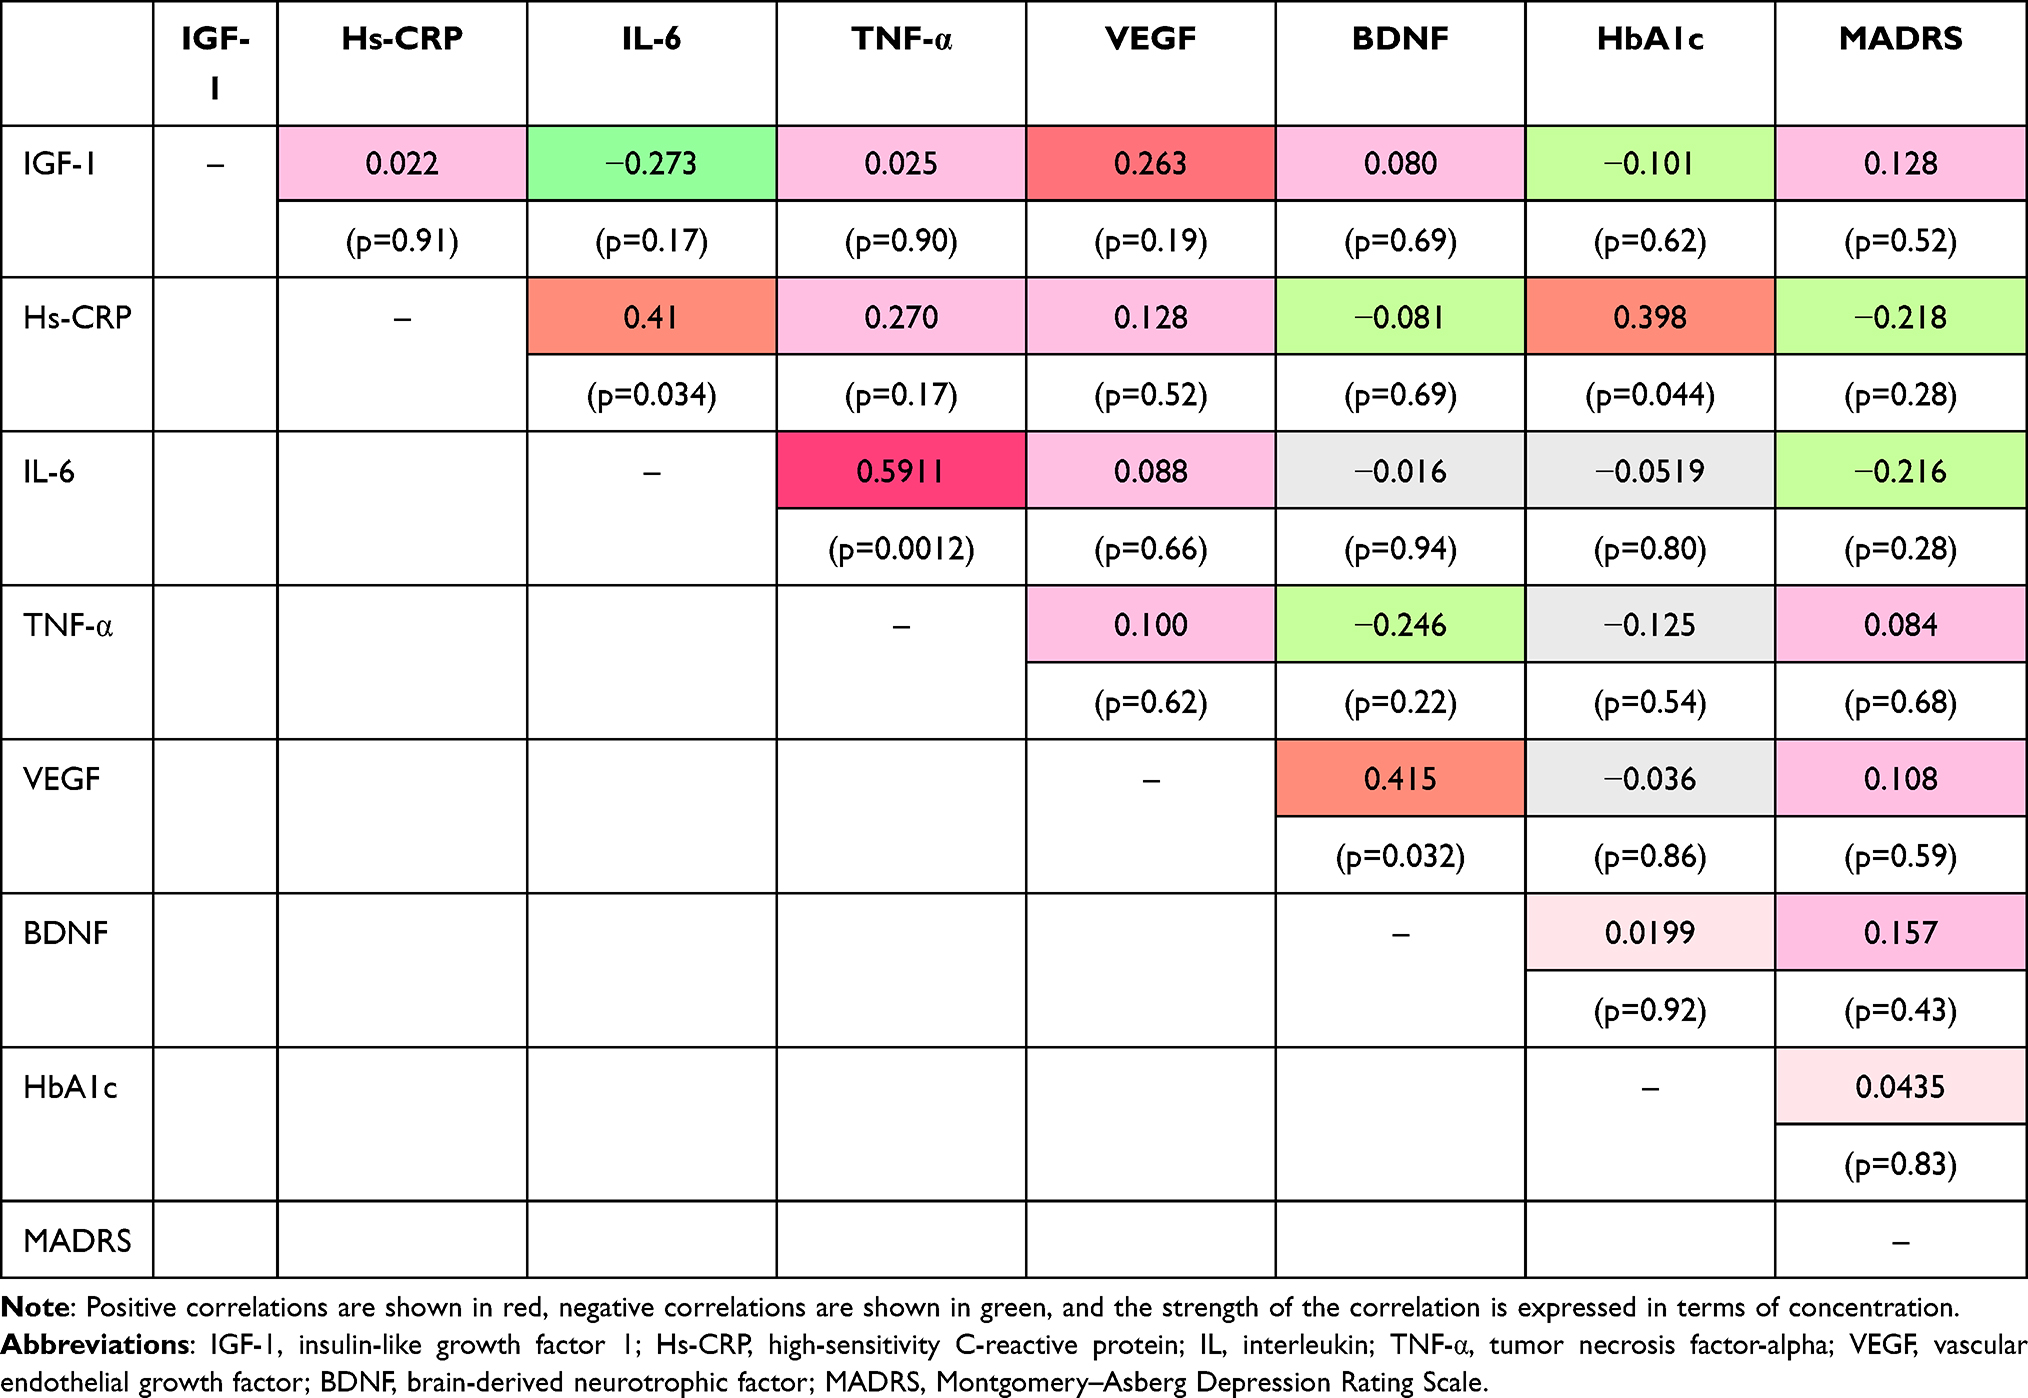 |
Table 5 Correlations Among IGF-1, Hs-CRP, Cytokine, TNF-α, VEGF, BDNF, HbA1c, and MADRS in the Major Depression Group without Diabetes Mellitus |
Relationships Among Serum Levels of Cytokines, Growth Factors, Hs-CRP, and Severity of Depressive Symptoms in Patients with Major Depression and Type 2 Diabetes Mellitus
Serum IL-6 levels exhibited a significant positive correlation with serum TNF-α levels in patients with both major depression and type 2 diabetes mellitus and a positive correlation was found between serum IL-6 and hs-CRP levels. Significant positive correlations were also observed between serum TNF-α levels and serum hs-CRP levels and between serum TNF-α levels and serum IGF-1 levels. Serum BDNF levels were significantly negatively correlated with serum hs-CRP levels and serum TNF-α levels. No correlations were observed between MADRS scores and serum levels of cytokines, growth factors, or hs-CRP (Table 6).
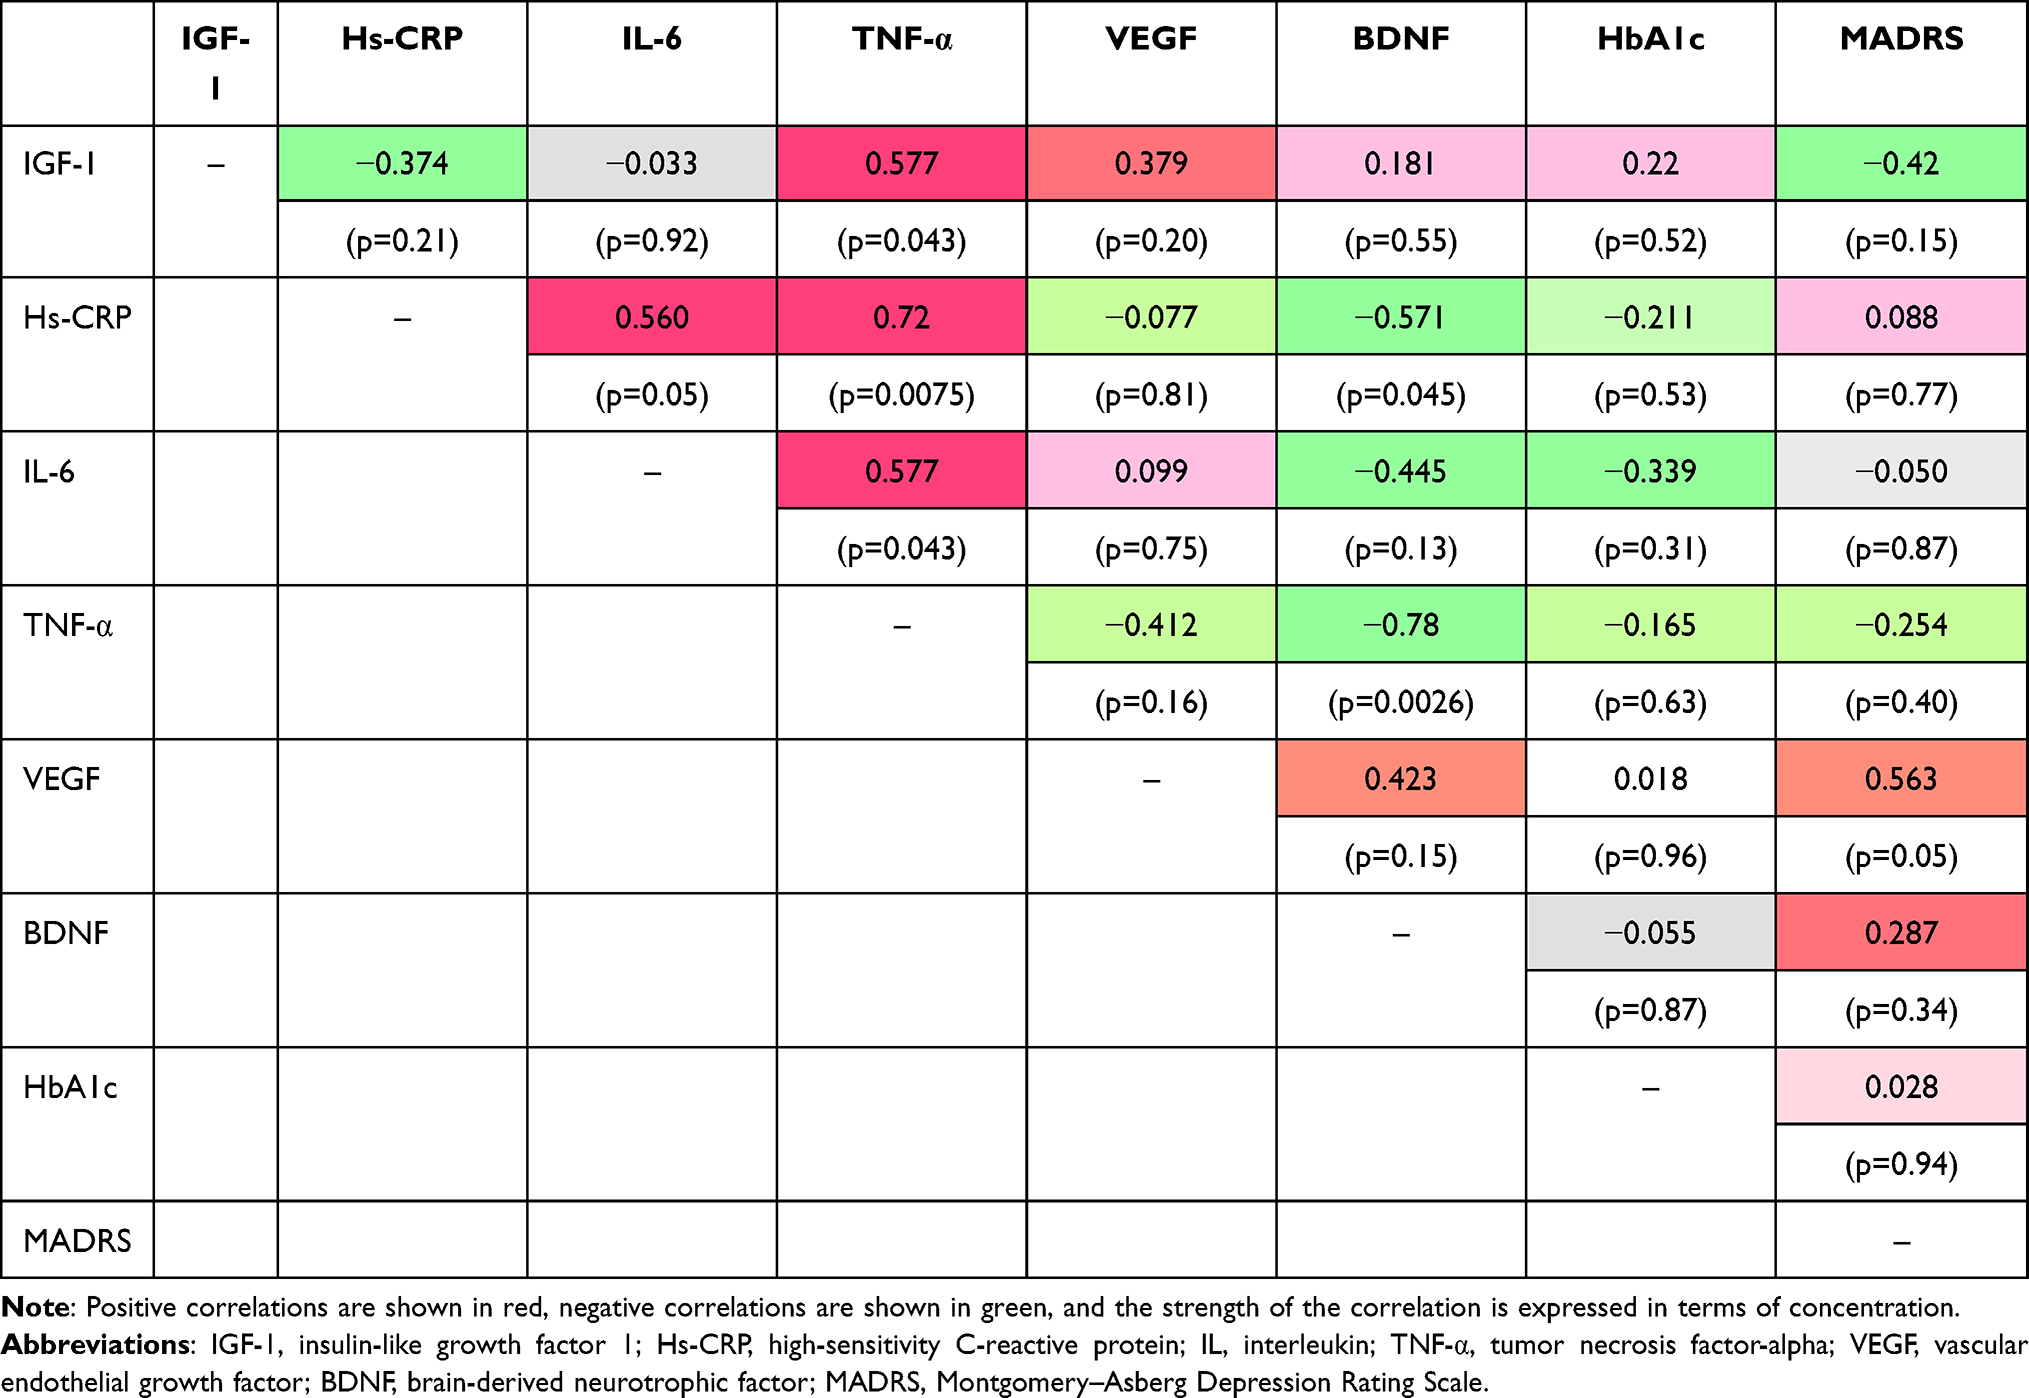 |
Table 6 Correlations Among IGF-1, Hs-CRP, Cytokines, TNF-α, VEGF, BDNF, HbA1c, and MADRS in the Major Depression Group with Diabetes Mellitus |
Odds Ratios for Patients with Major Depression and Comorbid Type 2 Diabetes Mellitus Relative to Patients with Major Depression without Type 2 Diabetes Mellitus Obtained via Logistic Regression Analysis
Logistic regression analysis revealed no significant associations between serum levels of cytokines, growth factors and hs-CRP and prevalence of diabetes. (Table 7). In addition, we conducted a ROC curve to calculate the sensitivity and specificity of each substance. (Figure 2). The sensitivity and specificity in patients with major depression with or without type 2 diabetes mellitus of IGF-1, hs-CRP, IL-6, TNF-α, VGF, and BDNF was 38.5%/74.1%1 (cut-off; 117ng/mL, AUC; 0.48), 92.3%/51.9% (cut-off; 249ng/mL, AUC; 0.679), 46.2%/85.2% (cut-off; 2.5pg/mL, AUC; 0.681), 61.5%/70.4% (cut-off; 1.07pg/mL, AUC; 0.699), 53.8%/63% (cut-off; 16300pg/mL, AUC; 0.46), respectively.
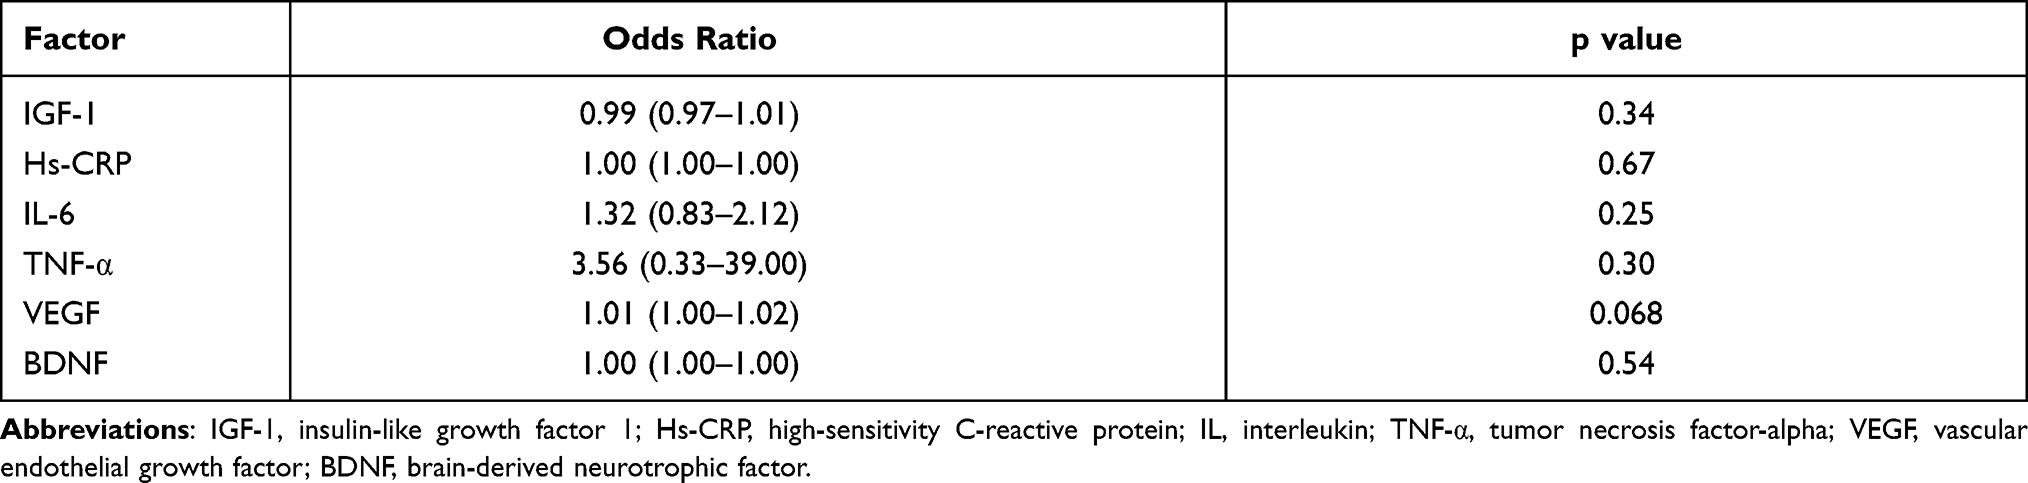 |
Table 7 Odds Ratios for Patients with Major Depression and Comorbid Type 2 Diabetes Mellitus Relative to Patients with Major Depression without Type 2 Diabetes Mellitus Obtained via Logistic Regression Analysis |
 |
Figure 2 Receiver operating characteristic (ROC) curve to calculate the sensitivity and specificity of each substance. (A) IGF-1, (B) Hs-CRP, (C) IL-6, (D) TNF-α, (E) VEGF, (F) BDNF. |
Discussion
In the present study, we investigated the plasma levels of cytokines, growth factors, and hs-CRP, and their associations with major depression among patients with and without type 2 diabetes mellitus. In accordance with previous findings, serum levels of IL-6 and TNF-α were significantly higher in the major depression group than in the healthy control group.6 Among patients with major depression, only serum levels of TNF-α, but not IL-6, were higher in patients with type 2 diabetes mellitus than in those without type 2 diabetes mellitus. Serum TNF-α levels were also inversely correlated with serum BDNF levels in the major depression group. The new finding in the present study was serum TNF-α was higher in patients with major depression with type 2 diabetes mellitus than without type 2 diabetes mellitus. Mata-analysis indicated that higher levels plasma TNF-α was associated with risk of type 2 diabetes mellitus.21 TNF-α plays an integral role in the pathophysiology of major depression, and the mechanism of antidepressant agents.22 Moreover, meta-analysis showed that plasma levels of TNF-α also increased in major depression.6,23,24 Taken together, plasma levels of TNF-α is considered to additively and/or synergistically increased in patients with type 2 diabetes mellitus.
Recent work demonstrated that 21 patients had MDD and 40 patients did not have MDD. Diabetic patients with MDD had significantly higher CRP levels and 24-hour urine free cortisol. The other metabolic and inflammatory parameters were not statistically different between groups. There was a significantly higher prevalence of cardiovascular events in individuals with MDD: 38% for the depressive group vs 15% for non-depressive group. Patients with MDD had a 3.5-fold greater odd of having cardiovascular disease. The result suggested that Diabetic patients with depression are more likely to have cardiovascular events, and different factors can determine this high association.25 Another report demonstrated that Dyadic adjustment was significantly associated with cytokine IL-8. Interpersonal relationship functioning was significantly associated with biomarker HbA1c, and cytokines TNF-alpha, and IL-1ra. Social functioning was significantly correlated with cytokines IL-17, IL-1ra, IL-2r, IL-6, and eotaxin. Depression was significantly correlated with HbA1C, which revealed significant relationships between molecular mediators of the inflammatory and immune systems and variables measuring the relational context patients with T2DM. The initial findings suggest a next step in understanding and exploring the complex but important biopsychosocial pathways in Type 2 DM.26
Another important new finding in the present study was inverse correlation between serum TNF-α and serum BDNF in patients with major depression. TNF-α is a cytokine that is a well-known factor in multiple disease conditions and is recognized for its major role in central nervous system signaling. TNF-α signaling is most commonly associated with neurotoxicity, but in some conditions, it has been found to be neuroprotective. TNF-α has long been known to induce nuclear factor-kappa B, NF-κB, signaling by, in most cases, translocating the p65 (RelA) DNA binding factor to the nucleus. Thus, TNF-α dominantly might reveal neurotoxic effect in the brain, which was associated with decreased BDNF leading to apoptosis. Inflammatory processes attenuate BDNF production in the pathophysiology of major depressive disorder. The Netherlands Study of Depression and Anxiety reported an association between serum levels of BDNF and plasma levels of IL-6 and TNF-α among patients with major depression and non-depressed controls.27 Many studies,9–12,28 including our previous study, have demonstrated that BDNF is an important biomarker in the pathophysiology of major depression, which is related to decreased synaptic plasticity and neuronal atrophy, whereas elevated BDNF levels are associated with survival and neuronal differentiation, which is compatible with the synaptic plasticity hypothesis of major depression. The use of peripheral growth factors, including BDNF,10–12,28 VEGF,12,29,30 and IGF-1,31–34 has not been robustly established; however, these peripheral biomarkers are useful in differentiating between healthy individuals and patients with major depression. According to the synaptic plasticity theory of major depression, reduced levels of growth factors are observed in patients with major depression when compared to healthy controls. When we compared the levels of cytokines and growth factors between patients with major depression with and without type 2 diabetes mellitus, serum levels of TNF-α, but not IL-6, were significantly higher in patients with type 2 diabetes mellitus than in those without type 2 diabetes mellitus. Moreover, the odds ratio for serum TNF-α level was 3.56 in patients with type 2 diabetes mellitus when the non-diabetes group was used as the reference, although the difference was not statistically significant (p=0.30) in the logistic regression analysis (Table 7). Serum IL-6 levels were also higher in patients with type 2 diabetes mellitus, but these levels did not reach the level of significance. However, our findings indicated that serum TNF-α levels were inversely correlated with serum BDNF levels in the major depression group. TNF-α is required for synaptic scaling. We suggest that, by modulating TNF-α levels, glia actively participate in homeostatic activity-dependent regulation of synaptic connectivity.35 TNF-α mediates some forms of homeostatic synaptic plasticity, and recent studies have investigated some of the in vivo contributions of TNF-α-mediated homeostatic synaptic plasticity. Such studies have reported that TNF-α-mediated homeostatic synaptic plasticity plays a role in a variety of functions, including the developmental plasticity of sensory systems, models of drug addiction, and the response to psychiatric drugs.36 TNF-α is a proinflammatory cytokine that exerts both homeostatic and pathophysiological roles in the central nervous system (CNS). In major depressive episodes, microglia release large amounts of TNF-α, which is an important component associated with several neuropsychiatric diseases. As microglial activation and upregulation of TNF-α expression are common features of major depression, TNF-α signaling may represent a valuable target for intervention.37 Recent meta-analyses have assessed the levels of proinflammatory cytokines, including TNF-α, before and after treatment in patients with major depression, and the researchers found that TNF-α levels were not significantly changed when simply looking at the effects of treatment with antidepressants.38 In the present study, most patients received selective serotonin reuptake inhibitors (SSRIs), serotonin-norepinephrine reuptake inhibitors (SNRIs), or mirtazapine. We believe that the effects of these antidepressants might influence the results of serum TNF-α levels in our preliminary study. It has been reported that TNF-α increases the phosphorylated form of the cyclic adenosine monophosphate (cAMP)-responsive element binding protein and activates the transcription of exons IV and VI in the BDNF gene, and that the TNF-α-mediated increase in BDNF expression is accompanied by an increase in calcitonin gene-related peptide levels. The effect of TNF-α on BDNF expression depends on sodium influx through tetrode toxin-sensitive channels and p38-mitogen-activated protein kinase. Furthermore, electrical stimulation and forskolin potentiate the TNF-α-mediated upregulation of BDNF expression.39
IL-6 is a key component of the molecular mechanisms underlying the pathophysiology of major depression. IL-6 knockout mice exhibit depression-like behaviors and altered IL-6-dependent signaling pathways.40 IL-6 may influence neuronal functionality, including the cholinergic phenotype of sympathetic neurons.41–43 Sensory neurons are particularly affected by IL-6 deficiency, since under normal conditions, IL-6 knockout mice demonstrate a reduction in the compound action potential of the sensory branch of the sciatic nerve, which is also highly dependent on IL-6 for functional recovery following injury.44 The results of studies of IL-6 knockout mice imply that IL-6 plays a role in sympathetic sprouting induced by nerve injury.45 IL-6 also promotes sprouting and functional recovery of cultured hippocampal neurons and plays a key role in adult neurogenesis,46 the process by which new neurons and glial cells are generated from neural stem cells. Neurogenesis is also altered in many neuropathological situations, and the detrimental role of inflammation has usually been suggested. IL-6 is upregulated and may play a role in neurogenesis. Glial fibrillary acidic protein-IL6 mice exhibit reduced hippocampal neurogenesis and decreased neuronal differentiation. In contrast, other studies have reported that IL-6 promotes gliogenesis through the STAT-3 pathway and neurogenesis through the mitogen-activated protein kinase/cAMP response element binding protein pathway.47
Although we previously reported that plasma IL-6 levels48 and serum BDNF levels9 were associated with scores on the Hamilton Rating Scale for Depression among patients with major depression, we observed no correlations among serum IL-6 levels, BDNF levels, and MADRS scores in the present study. It is possible that most patients enrolled in the present study had mild-to-moderate depression. In addition, we observed no significant difference in the response to antidepressant treatment between patients with and without type 2 diabetes mellitus in the major depression group. In accordance with previous findings, our results suggest that the severity of major depression and treatment response remain unaffected by concurrent diabetes.49 A study conducted in Europe reported that individuals with major depression and comorbid diabetes were significantly older and heavier than those without diabetes.49 In our study, patients with major depression who also had type 2 diabetes mellitus were significantly older than those who had major depression without type 2 diabetes mellitus, and there were no differences in the severity of depression between the two groups.
IGF-1 also plays an important role in the CNS. Studies have shown that IGF-1 affects the structure and function of synapses, regulates glucose metabolism in brain cells, inhibits the apoptosis of neurons and glial cells, regulates enzyme activity, reduces CNS damage caused by various pathological factors, and exerts protective effects on the growth, development, and remodeling of nerve tissues. Recent meta-analyses have demonstrated that peripheral IGF-1 levels are increased in patients with major depression.31–34 However, we observed no differences in serum IGF-1 levels between the major depression group and the healthy control group or between patients with and without type 2 diabetes mellitus in the major depression group. In addition, in the major depression group, serum IGF-1 levels were positively associated with serum TNF-α levels in patients with type 2 diabetes mellitus. In the present study, we observed no difference in the response to antidepressants between patients with and without type 2 diabetes mellitus in the major depression group. Most antidepressants used in the major depression group were SSRIs or SNRIs. There was no difference of response rate (50% or more decreasing of the MADRS score) between the SSRIs group (add response rate 63.1%) and SNRIs group (add response rate 61.3%) (p=1.000, Fisher’s exact test) in the present study, which supporting the notion that they can be used as first-line treatment for major depression with or without comorbid diabetes mellitus. This is in accordance with a report that demonstrated the usefulness of SSRIs or SNRIs in patients with major depression and diabetes mellitus.50,51
The present study had several limitations. First, the sample size was small, with only six participants in the healthy control group, which might have biased the results obtained. In brief, as this was an explanatory investigation, we did not perform a power analysis to determine the sample size for comparison in the present study. For the same reason, no correction for significant differences was made for multiple testing to prevent an increase in type two error. Second, we did not include patients with diabetes mellitus without depression, and only patients with mild-to-moderate depressive symptoms were included. Third, we could not rule out the possibility of the influence of antidepressants and/or diabetic medications on the results. Fourth, we did not regulate the types of pharmacological interventions. Fifth, the aging effect could influence the results. Finally, we must elucidate the most suitable antidepressants for patients with major depression with type 2 diabetes mellitus. Further studies with larger sample sizes, particularly, with more healthy controls, are required to address these points and confirm our explanatory investigation.
Conclusions
Our findings indicated that serum levels of IL-6 and TNF-α were higher in the major depression group than in the healthy control group. However, among patients in the major depression group, only serum TNF-α levels were significantly higher in patients with type 2 diabetes mellitus than in those without. Serum cytokine levels were also inversely correlated with the serum levels of growth factors in the major depression group, particularly, among patients with type 2 diabetes mellitus. It seems however not to be useful for these factors as biomarkers to differentiate between patients with major depression with or without type 2 diabetes mellitus, because of the low sensitivity and specificity. Moreover, responses to pharmacological interventions for major depression did not differ between patients with and those without type 2 diabetes mellitus.
Abbreviations
BDNF, brain-derived neurotrophic factor; ERK1/2, extracellular signal-regulated kinases 1/2; hs-CRP, high-sensitivity C-reactive protein; IGF-1, insulin-like growth factor 1; IL-β, interleukin 1β; JNK, c-Jun N-terminal kinase; MADRS, Montgomery–Asberg Depression Rating Scale; NF-κB, nuclear factor kappa-light-chain-enhancer of activated B cells; RR, relative risk; TNF-α, tumor necrosis factor-alpha; VEGF, vascular endothelial growth factor.
Data Sharing Statement
The original contributions presented in the study are included in the article, and further inquiries can be directed to the corresponding author.
Ethics Statement
Studies involving human participants were reviewed and approved by the Ethics Committee of the University of Occupational and Environmental Health (approval number: UOEHCRB19- 024). The patients/participants provided written informed consent to participate in the study.
Acknowledgment
The authors gratefully thank Ms. Tomomi Ishiba for assisting with blood sampling and paperwork.
Funding
This work was supported in part by grants from the Institute of Health, Labor, and Welfare in Japan to RY (18K07576).
Disclosure
All authors report no conflicts of interest in this work.
References
1. Whiting DR, Guariguata L, Weil C, Shaw J. IDF diabetes atlas: global estimates of the prevalence of diabetes for 2011 and 2030. Diabetes Res Clin Pract. 2011;94(3):311–321. doi:10.1016/j.diabres.2011.10.029
2. Malhi GS, Mann JJ. Depression. Lancet. 2018;392(10161):2299–2312. doi:10.1016/s0140-6736(18)31948-2
3. Moulton CD, Pickup JC, Ismail K. The link between depression and diabetes: the search for shared mechanisms. Lancet Diabetes Endocrinol. 2015;3(6):461–471. doi:10.1016/s2213-8587(15)00134-5
4. Anderson RJ, Freedland KE, Clouse RE, Lustman PJ. The prevalence of comorbid depression in adults with diabetes: a meta-analysis. Diabetes Care. 2001;24(6):1069–1078. doi:10.2337/diacare.24.6.1069
5. Schnell O, Amann-Zalan I, Jelsovsky Z, et al. Changes in A1C levels are significantly associated with changes in levels of the cardiovascular risk biomarker hs-CRP: results from the SteP study. Diabetes Care. 2013;36(7):2084–2089. doi:10.2337/dc12-1711
6. Goldsmith DR, Rapaport MH, Miller BJ. A meta-analysis of blood cytokine network alterations in psychiatric patients: comparisons between schizophrenia, bipolar disorder and depression. Mol Psychiatry. 2016;21(12):1696–1709. PMID: 26903267. doi:10.1038/mp.2016.3
7. Osimo EF, Baxter LJ, Lewis G, et al. Prevalence of low-grade inflammation in depression: a systematic review and meta-analysis of CRP levels. Psychol Med. 2019;49(12):1958–1970. PMID: 31258105. doi:10.1017/S0033291719001454
8. Krabbe KS, Nielsen AR, Krogh-Madsen R, et al. Brain-derived neurotrophic factor (BDNF) and type 2 diabetes. Diabetologia. 2006;50(2):431–438. doi:10.1007/s00125-006-0537-4
9. Yoshimura R, Kishi T, Atake K, Katsuki A, Iwata N. Serum brain-derived neurotrophic factor, and plasma catecholamine metabolites in people with major depression: preliminary cross-sectional study. Front Psychiatry. 2018;9:52. doi:10.3389/fpsyt.2018.00052
10. Polyakova M, Stuke K, Schuemberg K, et al. BDNF as a biomarker for successful treatment of mood disorders: a systematic & quantitative meta-analysis. J Affect Disord. 2015;174:432–440. PMID: 25553404. doi:10.1016/j.jad.2014.11.044
11. Zhou C, Zhong J, Zou B, et al. Meta-analyses of comparative efficacy of antidepressant medications on peripheral BDNF concentration in patients with depression. PLoS One. 2017;12(2):e0172270. PMID: 28241064. doi:10.1371/journal.pone.0172270
12. Cakici N, Suterland AL, Penninx B, et al. Altered peripheral blood compounds in drug-naïve first-episode patients with either schizophrenia or major depressive disorder: a meta-analysis. Brain Behav Immun. 2020;88:547–558. PMID: 32330592. doi:10.1016/j.bbi.2020.04.039
13. Zhou J-X, Li H-C, Bai X-J, et al. Functional Val66Met polymorphism of brain- derived neurotrophic factor in type 2 diabetes with depression in Han Chinese subjects. Behav Brain Funct. 2013;9:34. doi:10.1186/1744-9081-9-34
14. Anisman H, Hayley S. Inflammatory factors contribute to depression and its comorbid conditions. Sci Signal. 2012;5(244):pe45. doi:10.1126/scisignal.2003579
15. Sartorius N. Depression and diabetes. Dialogues Clin Neurosci. 2018;20(1):47–52. doi:10.31887/DCNS.2018.20.1/nsartorius
16. Khandaker GM, Dantzer R, Jones PB. Immunopsychiatry: important facts. Psychol Med. 2017;47(13):2229–2237. doi:10.1017/S0033291717000745
17. Benatti C, Blom JMC, Rigillo G, et al. Disease-induced neuroinflammation and depression. CNS Neurol Disord Drug Targets. 2016;15(4):414–433. doi:10.2174/1871527315666160321104749
18. American Psychiatric Association. Diagnostic and Statistical Manual of Mental Disorders.
19. Montgomery SA, Åsberg M. A new depression scale designed to be sensitive to change. Br J Psychiatry. 1979;134(4):382–389. doi:10.1192/bjp.134.4.382
20. Kanda Y. Investigation of the freely available easy-to-use software “EZR” for medical statistics. Bone Marrow Transplant. 2013;48(3):452–458. doi:10.1038/bmt.2012.244
21. Liu C, Feng X, Li Q, Wang Y, Li Q, Hua M. Adiponectin TNF-α and inflammatory cytokines and risk of type 2 diabetes: a systematic review and meta-analysis. Cytokine. 2016;86:100–109. doi:10.1016/j.cyto.2016.06.028
22. Ma K, Zhang H, Baloch Z. Pathogenetic and therapeutic applications of tumor necrosis factor-α (TNF-α) in major depressive disorder: a systematic review. Int J Mol Sci. 2016;17(5):733. doi:10.3390/ijms17050733
23. Dowlati Y, Herrmann N, Swardfager W, et al. A meta-analysis of cytokines in major depression. Biol Psychiatry. 2010;67(5):446–457. doi:10.1016/j.biopsych.2009.09.033
24. Ng A, Tam WW, Zhang MW, et al. IL-1β, IL-6, TNF- α and CRP in elderly patients with depression or Alzheimer’s disease: systematic review and meta-analysis. Sci Rep. 2018;8(1):12050. doi:10.1038/s41598-018-30487-6
25. Alvarez A, Faccioli J, Guinzbourg M, et al. Endocrine and inflammatory profiles in type 2 diabetic patients with and without major depressive disorder. BMC Res Notes. 2013;6:61. doi:10.1186/1756-0500-6-61
26. Olson MM, Trevino DB, Islam J, et al. The biopsychosocial milieu of type 2 diabetes: an exploratory study of the impact of social relationships on a chronic inflammatory disease. Int J Psychiatry Med. 2010;40(3):289–305. doi:10.2190/PM.40.3.e
27. Patas K, Penninx BWJH, Bus BAA, et al. Association between serum brain-derived neurotrophic factor and plasma interleukin-6 in major depressive disorder with melancholic features. Brain Behav Immun. 2014;36:71–79. doi:10.1016/j.bbi.2013.10.007
28. Kishi T, Yoshimura R, Ikuta T, Iwata N. Brain-derived neurotrophic factor and major depressive disorder: evidence from meta-analyses. Front Psychiatry. 2018;8:308. doi:10.3389/fpsyt.2017.00308
29. Pu J, Liu Y, Gui S, et al. Vascular endothelial growth factor in major depressive disorder, schizophrenia, and bipolar disorder: a network meta-analysis. Psychiatry Res. 2020;292:113319. doi:10.1016/j.psychres.2020.113319
30. Carvalho AF, Köhler CA, McIntyre RS, et al. Peripheral vascular endothelial growth factor as a novel depression biomarker: a meta-analysis. Psychoneuroendocrinology. 2015;62:18–26. doi:10.1016/j.psyneuen.2015.07.002
31. Chen M, Zhang L, Jiang Q. Peripheral IGF-1 in bipolar disorder and major depressive disorder: a systematic review and meta-analysis. Ann Palliat Med. 2020;9(6):4044–4053. doi:10.21037/apm-20-1967
32. Troyan AS, Levada OA. The diagnostic value of the combination of serum brain-derived neurotrophic factor and insulin-like growth factor-1 for major depressive disorder diagnosis and treatment efficacy. Front Psychiatry. 2020;11:800. doi:10.3389/fpsyt.2020.00800
33. van Varsseveld NC, van Bunderen CC, Sohl E, et al. Serum insulin-like growth factor 1 and late-life depression: a population-based study. Psychoneuroendocrinology. 2015;54:31–40. doi:10.1016/j.psyneuen.2015.01.014
34. Tu KY, Wu MK, Chen YW, et al. Significantly higher peripheral insulin-like growth factor-1 levels in patients with major depressive disorder or bipolar disorder than in healthy controls: a meta-analysis and review under guideline of PRISMA. Medicine. 2016;95(4):e2411–e2411. doi:10.1097/MD.0000000000002411
35. Stellwagen D, Malenka RC. Synaptic scaling mediated by glial TNF-α. Nature. 2006;440(7087):1054–1059. doi:10.1038/nature04671
36. Heir R, Stellwagen D. TNF-mediated homeostatic synaptic plasticity: from in vitro to in vivo models. Front Cell Neurosci. 2020;14:565841. doi:10.3389/fncel.2020.565841
37. Olmos G, Lladó J. Tumor necrosis factor alpha: a link between neuroinflammation and excitotoxicity. Mediators Inflamm. 2014;2014;861231. doi:10.1155/2014/861231
38. Strawbridge R, Arnone D, Danese A, Papadopoulos A, Herane Vives A, Cleare AJ. Inflammation and clinical response to treatment in depression: a meta-analysis. Eur Neuropsychopharmacol. 2015;25(10):1532–1543. doi:10.1016/j.euroneuro.2015.06.007
39. Bałkowiec-Iskra E, Vermehren-Schmaedick A, Balkowiec A. Tumor necrosis factor-α increases brain-derived neurotrophic factor expression in trigeminal ganglion neurons in an activity-dependent manner. Neuroscience. 2011;180:322–333. doi:10.1016/j.neuroscience.2011.02.028
40. Chourbaji S, Urani A, Inta I, et al. IL-6 knockout mice exhibit resistance to stress-induced development of depression-like behaviors. Neurobiol Dis. 2006;23(3):587–594. doi:10.1016/j.nbd.2006.05.001
41. März P, Cheng JG, Gadient RA, et al. Sympathetic neurons can produce and respond to interleukin 6. Proc Natl Acad Sci U S A. 1998;95(6):3251–3256. doi:10.1073/pnas.95.6.3251
42. Oh YJ, O’Malley KL. IL-6 increases choline acetyltransferase but not neuropeptide transcripts in sympathetic neurons. Neuroreport. 1994;5(8):937–940. doi:10.1097/00001756-199404000-00021
43. Fann MJ, Patterson PH. Neuropoietic cytokines and activin A differentially regulate the phenotype of cultured sympathetic neurons. Proc Natl Acad Sci U S A. 1994;91(1):43–47. doi:10.1073/pnas.91.1.43
44. Cafferty WBJ, Gardiner NJ, Das P, Qiu J, McMahon SB, Thompson SWN. Conditioning injury-induced spinal axon regeneration fails in interleukin-6 knock-out mice. J Neurosci. 2004;24(18):4432–4443. doi:10.1523/JNEUROSCI.2245-02.2004
45. Murphy PG, Ramer MS, Borthwick L, Gauldie J, Richardson PM, Bisby MA. Endogenous interleukin-6 contributes to hypersensitivity to cutaneous stimuli and changes in neuropeptides associated with chronic nerve constriction in mice. Eur J Neurosci. 1999;11(7):2243–2253. doi:10.1046/j.1460-9568.1999.00641.x
46. Deverman BE, Patterson PH. Cytokines and CNS development. Neuron. 2009;64(1):61–78. doi:10.1016/j.neuron.2009.09.002
47. Erta M, Quintana A, Hidalgo J. Interleukin-6, a major cytokine in the central nervous system. Int J Biol Sci. 2012;8(9):1254–1266. doi:10.7150/ijbs.4679
48. Yoshimura R, Kishi T, Iwata N. Plasma levels of IL-6 in patients with untreated major depressive disorder: comparison with catecholamine metabolites. Neuropsychiatr Dis Treat. 2019;15:2655–2661. doi:10.2147/NDT.S195379
49. Fugger G, Dold M, Bartova L, et al. Major depression and comorbid diabetes - findings from the European group for the study of resistant depression. Prog Neuropsychopharmacol Biol Psychiatry. 2019;94:109638. doi:10.1016/j.pnpbp.2019.109638
50. Krishnan KRR. Treatment of depression in the medically ill. J Clin Psychopharmacol. 2005;25(4):S14–S18. doi:10.1097/01.jcp.0000162808.92194.2a
51. Westanmo AD, Gayken J, Haight R. Duloxetine: a balanced and selective norepinephrine- and serotonin-reuptake inhibitor. Am J Health Syst Pharm. 2005;62(23):2481–2490. doi:10.2146/ajhp050006
 © 2022 The Author(s). This work is published and licensed by Dove Medical Press Limited. The
full terms of this license are available at https://www.dovepress.com/terms.php
and incorporate the Creative Commons Attribution
- Non Commercial (unported, v3.0) License.
By accessing the work you hereby accept the Terms. Non-commercial uses of the work are permitted
without any further permission from Dove Medical Press Limited, provided the work is properly
attributed. For permission for commercial use of this work, please see paragraphs 4.2 and 5 of our Terms.
© 2022 The Author(s). This work is published and licensed by Dove Medical Press Limited. The
full terms of this license are available at https://www.dovepress.com/terms.php
and incorporate the Creative Commons Attribution
- Non Commercial (unported, v3.0) License.
By accessing the work you hereby accept the Terms. Non-commercial uses of the work are permitted
without any further permission from Dove Medical Press Limited, provided the work is properly
attributed. For permission for commercial use of this work, please see paragraphs 4.2 and 5 of our Terms.