Back to Journals » Diabetes, Metabolic Syndrome and Obesity » Volume 16
Associations of Relative Fat Mass, a Novel Adiposity Indicator, with Non-Alcoholic Fatty Liver Disease and Cardiovascular Disease: Data from SPECT-China
Authors Shen W, Cai L, Wang B, Wang Y, Wang N, Lu Y ![]()
Received 28 May 2023
Accepted for publication 2 August 2023
Published 8 August 2023 Volume 2023:16 Pages 2377—2387
DOI https://doi.org/10.2147/DMSO.S423272
Checked for plagiarism Yes
Review by Single anonymous peer review
Peer reviewer comments 3
Editor who approved publication: Professor Gian Paolo Fadini
Wenqi Shen,* Lingli Cai,* Bin Wang, Yuying Wang, Ningjian Wang, Yingli Lu
Institute and Department of Endocrinology and Metabolism, Shanghai Ninth People’s Hospital, Shanghai Jiao Tong University School of Medicine, Shanghai, People’s Republic of China
*These authors contributed equally to this work
Correspondence: Yingli Lu, Institute and Department of Endocrinology and Metabolism, Shanghai Ninth People’s Hospital, Shanghai Jiao Tong University School of Medicine, Shanghai, People’s Republic of China, Tel +86 136 3635 2507, Email [email protected]
Purpose: This study aimed to determine the associations of relative fat mass (RFM), a novel adiposity indicator, with the prevalence of non-alcoholic fatty liver disease (NAFLD) and cardiovascular disease (CVD) and compared the disease discriminative ability of RFM with other common adiposity indicators in the general Chinese population.
Patients and Methods: This cross-sectional study consisted of 11,532 adult participants from the SPECT-China study (2014– 2016). We included RFM and six other adiposity indicators, including body mass index (BMI), waist circumference (WC), waist-to-hip ratio (WHR), waist-to-height ratio (WHtR), visceral adiposity index (VAI), and lipid accumulation product (LAP). Binary logistic regression analysis was used to assess the relationship between adiposity indicators and the prevalence of NAFLD and CVD. The receiver operating characteristic (ROC) curve was used to evaluate the ability to screen NAFLD and CVD.
Results: After adjusting for confounding variables, RFM showed a strong association with the prevalence of NAFLD and CVD. In men, each 1-SD (standard deviation) increase in RFM was associated with more than 3-fold increased risk of NAFLD (OR: 4.33, 95% CI: 3.79– 4.93) and 66% increased risk of CVD (OR: 1.66, 95% CI: 1.36– 2.02); in women, per 1-SD increase in RFM was associated with about 4-fold increased risk of NAFLD (OR: 5.16, 95% CI: 4.62– 5.77) and 26% increased risk of CVD (OR: 1.26, 95% CI: 1.08– 1.47). ROC analysis showed that RFM and WHtR were the strongest predictors for CVD.
Conclusion: RFM was significantly associated with prevalent NAFLD and CVD in Chinese adults and might be considered a simple tool for disease prediction. Further large longitudinal studies are needed to verify our findings.
Keywords: relative fat mass, obesity, anthropometric measures, non-alcoholic fatty liver disease, cardiovascular disease
Introduction
Changes in eating habits and lifestyles in the past few decades have made obesity a major health problem that affects more than two billion people worldwide.1 The observed rise in obesity prevalence leads to massive increases in the costs of health care and imposes a huge burden on societies. It raises even more concerns considering the secondary diseases and complications associated with obesity, including cardiovascular disease (CVD), non-alcoholic fatty liver disease (NAFLD), diabetes, poor mental health, and certain types of cancer.2–5 Parallel to the increased prevalence of obesity, the prevalence of NAFLD and CVD are also rising. Obesity is associated with a 3.5-fold increased risk of NAFLD,6 and a 10 kg increment in body weight leads to a 12% increased risk of coronary artery disease.7 NAFLD and CVD are two interconnected conditions that share several pathophysiologic mechanisms, including insulin resistance, dyslipidemia, increased oxidative stress, and endothelial dysfunction, especially in the context of obesity. Given that excessive adipose accumulation contributed to the progression of NAFLD and CVD,8–10 monitoring and evaluating an individual’s adiposity status might be useful in identifying diseases at an early stage.
Dual-energy X-ray absorptiometry (DEXA), computed tomography (CT), magnetic resonance imaging (MRI), and dual bioelectrical impedance analysis (BIA) are recommended quantitative approaches to detecting body composition and adiposity distribution. However, these imaging techniques are time and money-consuming, and some have radiation exposure, thus are not applicable for routine clinical practice.11 Many indicators have been established as simple and inexpensive tools to assess adiposity. Recently, a sex-specific index described as relative fat mass (FRM) was proposed.12 The calculation of RFM was based on waist circumference (WC) and height. Woolcott et al demonstrated that RFM could better estimate body fat percentage than body mass index (BMI) when using DEXA as the reference method. Guzmán-León et al further validated the precision of RFM in estimating body fat using four different body composition methods (DEXA, BIA, air displacement plethysmography, 4-compartment model).13 Due to its simplicity and better performance than BMI in diagnosing body fat-defined obesity, RFM is suggested to be used in daily clinical practice as a tool for the evaluation of body composition. In recent years, researchers conducted several studies using RFM as an indicator for adiposity, and they found that RFM could predict type 2 diabetes,14 severe liver disease,15 heart failure,16 and metabolic syndrome.17 However, there are no studies demonstrating the predictive role of RFM in identifying CVD, and evidence on NAFLD is limited. Besides, previous studies mostly conducted the comparisons between RFM and conventional adiposity indicators such as BMI and WC, but not other novel adiposity indicators.
Based on the above considerations, we hypothesize that RFM is a possible candidate adiposity indicator for identifying the risk of NAFLD and CVD. Using data from the SPECT-China study, this study aimed to (1) determine the associations of RFM with the prevalence of NAFLD and CVD in the general Chinese population (2) test whether RFM is superior in discriminating NAFLD and CVD as compared with six other adiposity indicators including BMI, WC, waist-to-hip ratio (WHR), waist-to-height ratio (WHtR), visceral adiposity index (VAI), and the lipid accumulation product (LAP). These comparison data could provide an overview of how adiposity indicators performed in identifying diseases, giving researchers more options when choosing which adiposity indicator to use to predict NAFLD and CVD in the future.
Materials and Methods
Study Population
The data of this population-based cross-sectional study was obtained from the SPECT-China study, an ongoing prospective cohort study designed to investigate the risk factors for metabolic diseases in the general population in East China (www.chictr.org.cn.ChiCTR-ECS-14005052). Detailed information about SPECT-China Study was published in previous reports.18 In brief, from February 2014 to May 2016, 13,064 participants who lived in their current resident for over six months were recruited from 23 sites in Shanghai, Zhejiang, Jiangsu, Anhui, and Jiangxi Provinces using a stratified and cluster-sampling strategy.19 The Ethics Committee of Shanghai Ninth People’s Hospital, Shanghai Jiao Tong University School of Medicine reviewed and accepted the study’s protocol (approval number 2013 (86)). The Declaration of Helsinki’s ethical principles were followed in all procedures. All participants provided verbal and written consent before any data were collected.
We first excluded participants with complete missing questionnaire data (n=192), laboratory data (n=199), and younger than 18 years old (n=7). In this study, participants with missing data on weight, height, waist circumference, or hip circumference (n=493), missing lipid profiles (n=5), missing liver ultrasound information (n=300), and missing CVD diagnosis (n=336) were also excluded. Finally, 11,532 participants with valid data were included for further analysis. The inclusion and exclusion of the participants are shown in the flowchart in Supplementary Figure 1.
Data Collection
A systematic questionnaire was used to obtain information on demographic characteristics, medical history, family history, and lifestyle information, such as current smoking, and current alcohol consumption. In every site, anthropometric measurements, including height, weight, waist circumference, hip circumference, and blood pressure, were carried out by the same group of skilled medical personnel in accordance with established procedures as described previously.20 After at least 8 hours of overnight fasting, a blood sample from each participant was collected by venipuncture. The blood specimens were centrifuged after being left at ambient temperature for two hours, and the blood serum was extracted. Fasting plasma glucose (FPG), glycosylated hemoglobin (HbA1c), alanine transaminase (ALT), aspartate transaminase (AST), total cholesterol (TC), triglycerides (TG), low-density lipoprotein (LDL), and high-density lipoprotein (HDL) were measured using a Beckman Coulter AU680 (Brea, USA). HbA1c values were tested by high-performance liquid chromatography with a Medconn hemoglobin testing system (MQ-2000PT, Medconn, Shanghai, China).
Calculation of Adiposity Indicators
Body weight, height, waist circumference, and hip circumference were measured using the standard method. In brief, height and weight were measured using a stadiometer and electronic weight scale. Participants were asked to stand in a natural straight position without shoes and in lightweight clothes, the record was accurate to 0.1cm and 0.1kg. WC and HC were measured using nonelastic tape. Participants were asked to breathe out normally. WC was accurately measured to 0.1 cm at the midpoint between the iliac crest and the lowest border of the rib cage. HC was accurately measured to 0.1 cm at the hip’s broadest point at the level of the greater trochanter.
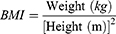

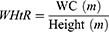
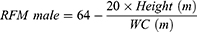
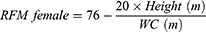
VAI, LAP, and RFM are sex-specific indicators, the equations are listed as follow:


Definition of Variables
Self-reported educational levels were recorded, and we classified them into university/college education and others. A person was considered a current smoker if he or she had smoked at least 100 cigarettes in his/her lifetime and continued to smoke regularly. Alcohol intake was self-reported by participants in the questionnaire, current drinking was defined as having consumed a drink containing alcohol more than once per month in the past year, the same as previous study.21 Diabetes was determined by a FPG level of 7.0 mmol/L or higher, an HbA1c of 6.5% or higher, or a self-reported previous diagnosis of diabetes by a physician. Blood pressure was measured after at least 10 min of rest. Hypertension was defined as a systolic blood pressure over 140 mmHg, a diastolic blood pressure over 90 mmHg, or a self-reported previous diagnosis of hypertension by a physician.
Outcomes Definition
Abdominal ultrasonography (MINDRAY M7, MINDRAY, Shenzhen, China) was performed to diagnose hepatic steatosis. According to standard criteria,22 the presentation of steatosis was defined as increased liver echogenicity, stronger echoes in the liver parenchyma compared to the renal parenchyma, vessel blurring, and narrowing of the lumen of the hepatic veins. NAFLD was defined as ultrasound evidence of hepatic steatosis without secondary cause (excessive alcohol consumption, defined as > 140 g/week for men, > 70 g/week for women, self-reported viral hepatitis, autoimmune hepatic disease, other chronic hepatic diseases, utilization of hepatotoxic medicines).
The outcome CVD was defined as a self-reported previous diagnosis of coronary heart disease, myocardial infarction, or stroke. The linked question in the questionnaire was “Have you ever been told by a health-care professionals that you have coronary heart disease, myocardial infarction, or stroke?” The identical question was used in another sizable study in China, with a validation rate of 91.07%.23 The registration platform further confirmed the self-reported diagnosis.
Statistical Analysis
All analyses were performed using the SPSS software version 25.0 (IBM Corporation., Armonk, NY). A two-sided P <0.05 was considered statistically significant. Continuous variables were presented as mean ± standard deviation (SD) or median (25th–75th percentile) based on their distribution. Categorical variables were presented as a percentage (%). To compare the associations across different indicators, all continuous adiposity indicators were standardized for further analyses. Pearson’s correlation and Spearman correlation coefficients were used where appropriate to assess the correlations between different variables. Logistic regression analysis was performed for the association of RFM and other adiposity indicators with the prevalence of NAFLD and CVD within each sex. Odds ratios (ORs) with 95% confidence intervals (CIs) were calculated. The ORs indicated the change in the odds per 1-SD increase in the adiposity indicators. We ran three models. The first model was unadjusted, then we ran a second model adjusted for age, and a third model adjusted for age, smoking, drinking, HbA1c, LDL, and hypertension. A receiver operating characteristic (ROC) curve with area under the curve (AUC) and 95% CI was used to evaluate the ability of the adiposity indicators to identify NAFLD and CVD. The Youden index value (sensitivity+specificity-1) was used to determine the optimal cut-offs. We further examined associations of the adiposity indicators with NAFLD and CVD in subgroups according to participants’ age (< 50 years; 50–60 years; and ≥ 60 years), and BMI groups (<24 kg/m2, ≥24 kg/m2).
Results
Characteristics of the Enrolled Participants
The characteristics of the participants are shown in Table 1. The mean age of the study population was 54.51±12.97 years, and 60.5% (n = 6870) were women. We identified NAFLD among 5584 participants (50.7%), with a higher proportion among men than among women (56.7% vs 46.6%). We identified CVD among 1088 participants (9.5%), and the proportion was comparable between men and women. Only 2.1% and 7.4% of the women were current smokers and drinkers, respectively.
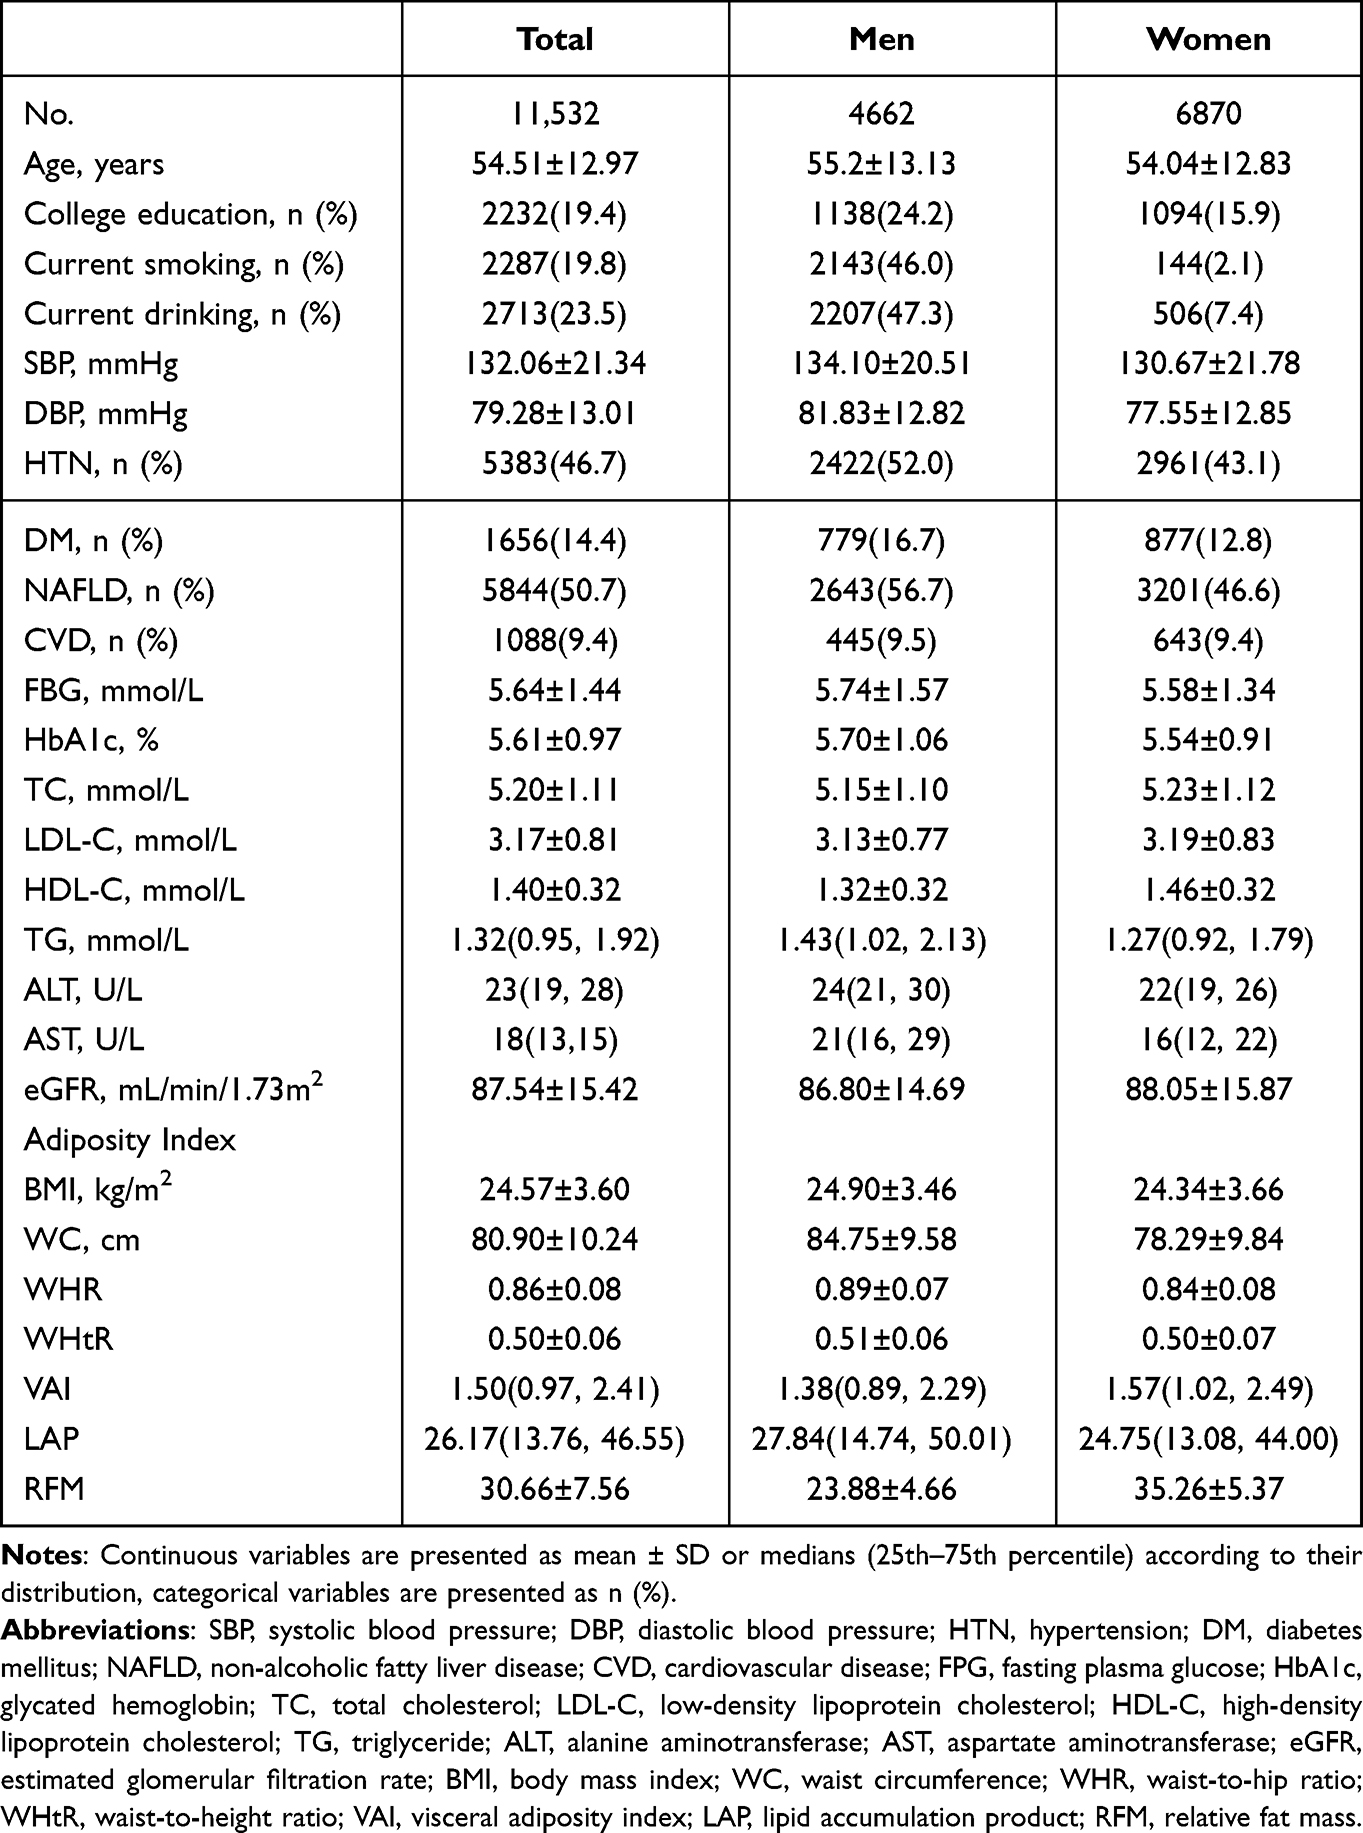 |
Table 1 Descriptive Characteristics of the SPECT-China Participants by Sex (n =11,532) |
Correlation Between RFM and Other Adiposity Indicators
We examined the correlations between RFM and other adiposity indicators (BMI, WC, WHR, WHtR, LAP, VAI). RFM showed moderate to strong correlations with other validated adiposity indicators (all p<0.001). The correlation was stronger among women (Supplementary Table 1).
Association of Adiposity Indicators with the Prevalence of NAFLD Among Men and Women
The performance of BMI, WC, WHR, WHtR, VAI, LAP, and RFM to identify NAFLD is presented in Table 2. In both sexes, all adiposity indicators were significantly associated with NAFLD. When comparing the standardized adiposity indicators, LAP and RFM showed stronger associations with NAFLD compared with other indicators in both sexes. Per 1-SD increase in BMI, WC, WHR, WHtR, and VAI were associated with 228%, 195%, 93%, 173%, and 205% increased risk of NAFLD in the men, a comparable change in RFM was associated with 333% increased risk of NAFLD [OR: 4.33, 95% CI (3.79–4.93)]. Likewise, 1-SD increase in BMI, WC, WHR, WHtR, and VAI was associated with 235%, 236%, 95%, 186%, and 143% increased risk of NAFLD in the women, a comparable change in RFM was associated with 416% increased risk of NAFLD [OR: 5.16, 95% CI (4.62–5.77)]. These associations were all fully adjusted for age, current smoking, current drinking, education, HbA1c, LDL-C, and hypertension.
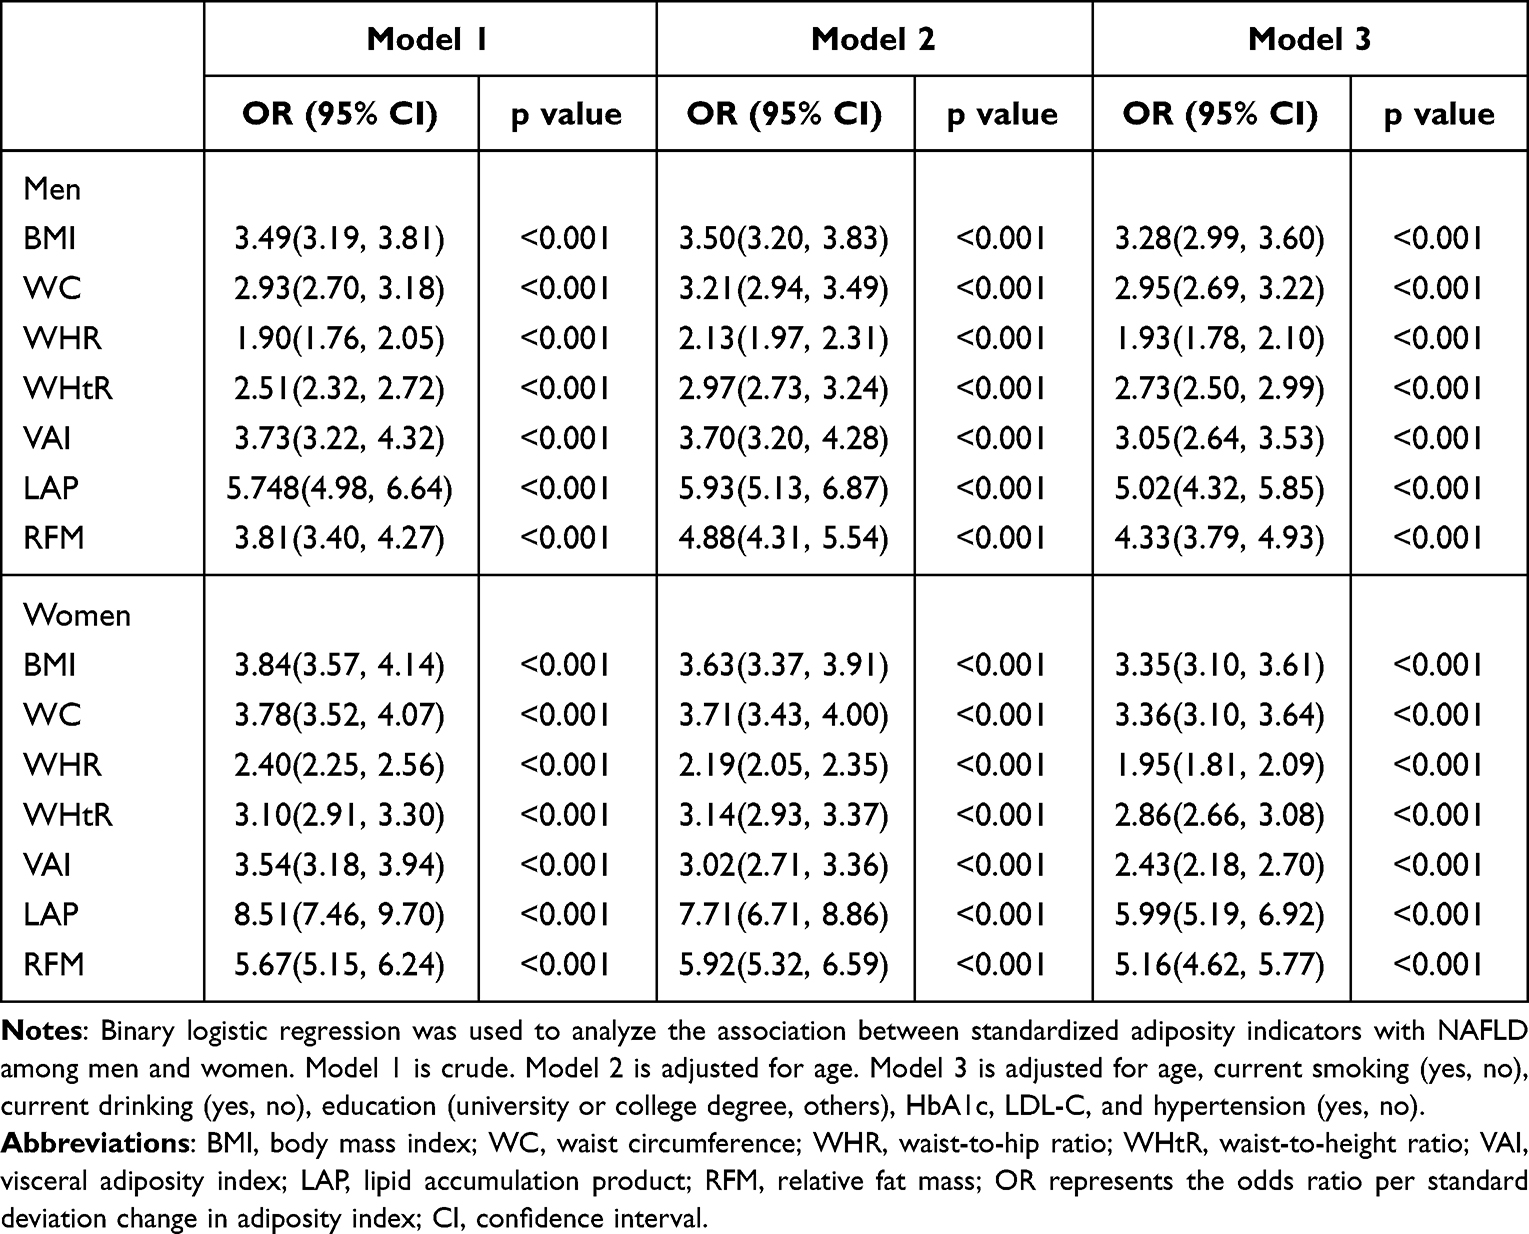 |
Table 2 Associations of Standardized Adiposity Indicators with NAFLD Among Men and Women |
Association of Adiposity Indicators with the Prevalence of CVD Among Men and Women
Table 3 shows the standardized effects of the different adiposity indicators on CVD. BMI, WC, WHtR, and RFM were significantly associated with CVD in men. While BMI, WC, WHtR, VAI, LAP and RFM were significantly associated with CVD in women. RFM showed the greater association in the unadjusted analysis [OR: 2.55, 95% CI (2.12–3.07) in men; OR: 2.57, 95% CI (2.26–2.93) in women], although it lost strength in the association after adjustment for confounding factors (age, current smoking, current drinking, education, HbA1c, LDL-C, and hypertension), the results indicated that RFM still had the strongest associations with the risk of CVD. Specifically, 1 SD increase in RFM was associated with 66% increased odds of CVD [OR: 1.66, 95% CI (1.36–2.02)] in men. In women, 1 SD increase in RFM was associated with 26% increased odds of CVD [OR: 1.26, 95% CI (1.08–1.47)].
 |
Table 3 Associations of Standardized Adiposity Indicators with CVD Among Men and Women |
ROC Analysis
ROC analysis was used to evaluate the capacity of adiposity indicators to identify NAFLD and CVD by sex (Figure 1). AUC was used to assess the performance of each indicator, and the Youden Index was used to identify optimal cut-offs. All indicators performed better for identifying NAFLD in women (AUC 0.722–0.804) than in men (AUC 0.670–0.778). Likewise, all indicators performed better for identifying CVD in women (AUC 0.613–0.673) than in men (AUC 0.531–0.649). LAP had the biggest AUC for NAFLD in both sexes, followed by BMI. In both sexes, RFM and WHtR presented the same discriminatory power for CVD. The AUC of RFM and WHtR were greater than that of other indicators for CVD [AUC women = 0.673 (95% CI 0.653 to 0.694); AUC men=0.649 (95% CI 0.623 to 0.675)]. Optimal cutoffs for RFM are presented in Table 4.
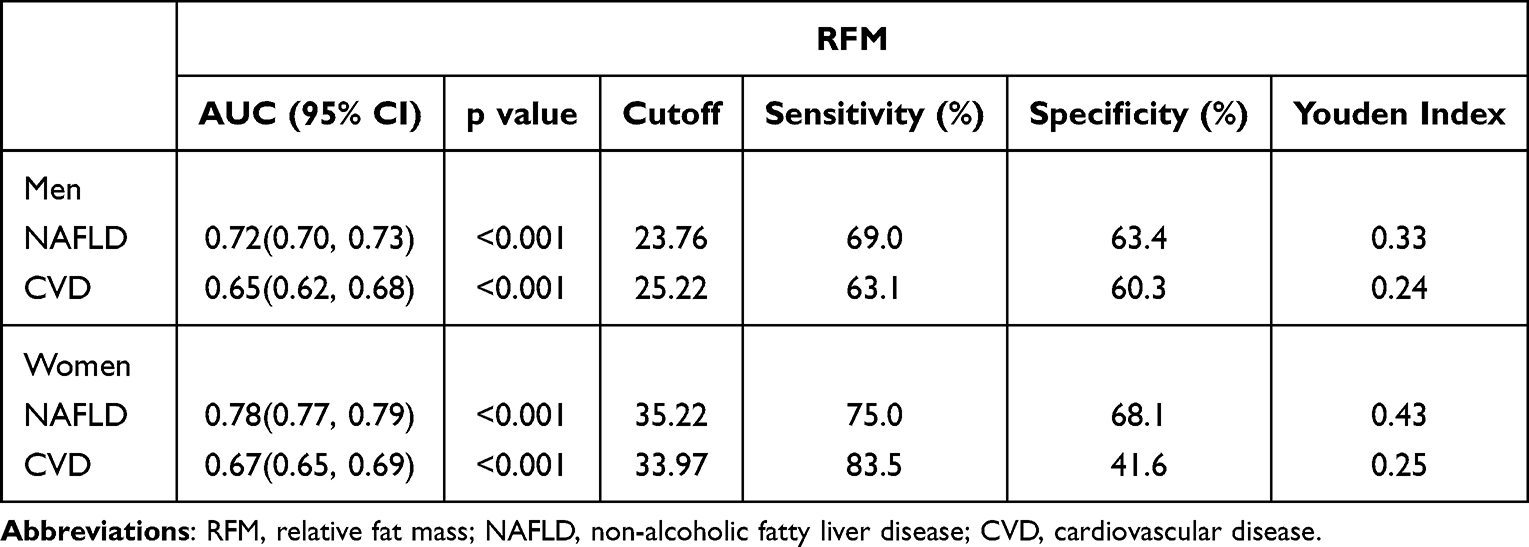 |
Table 4 Power of RFM for Screening NAFLD and CVD Among Men and Women |
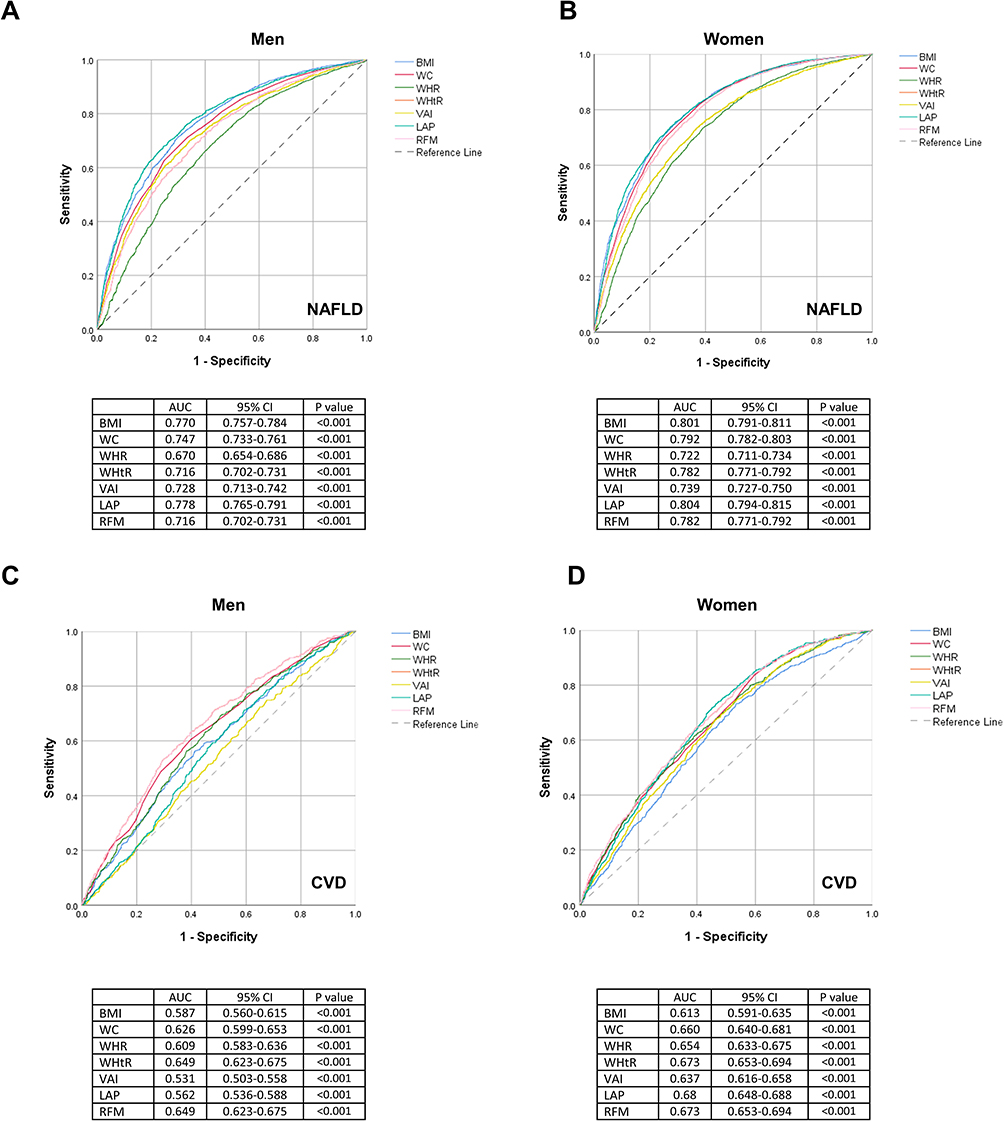 |
Figure 1 ROC curves of the adiposity indicators for identification of NAFLD and CVD by sex. (A) ROC Curve for NAFLD in Men, (B) ROC Curve for NAFLD in Women, (C) ROC Curve for CVD in Men, (D) ROC Curve for CVD in Women. Abbreviations: BMI, body mass index; WC, waist circumference; WHR, waist-to-hip ratio; WHtR, waist-to-height ratio; VAI, visceral adiposity index; LAP, lipid accumulation product; RFM, relative fat mass; ROC, receiver operating characteristic curve. |
Subgroup Analysis
We further examined associations of adiposity indicators with NAFLD and CVD in each age group. As shown in Supplementary Table 2, adiposity indicators tended to be more strongly associated with NAFLD and CVD in younger participants (< 50 years). RFM displayed the greatest risk for CVD across all age groups. We also examined associations of adiposity indices with NAFLD and CVD across BMI categories (<24 kg/m2, ≥24 kg/m2), RFM displayed a stronger association for NAFLD and CVD in participants with higher BMI (Supplementary Table 3).
Discussion
Our study concluded that in general Chinese populations, RFM had a strong association with the prevalence of NAFLD and CVD. This easily obtained index could be applied as a preliminary tool for NAFLD and CVD screening in routine clinical practice.
Many indicators have been established as simple and inexpensive tools to assess adiposity. BMI is the most commonly used measurement to classify obesity. The limitation of BMI is obvious, since it can only detect general obesity and lack ability to differentiate between muscle mass and fat mass.24 Studies have shown that the distribution rather than amount of adipose tissue plays a more important role in the development of diseases.25 In this regard, other anthropometric indicators, such as WC, WHR, and WHtR are used as central obesity indicators in clinical settings.26 Novel measures of central adiposity have also been introduced, in the current study, we included two novel indicators, LAP and VAI, the calculation of these two indicators included lipid information, theoretically, making them more scientifically sound than basal anthropometric measures in predicting adiposity related disease. They have been demonstrated to be better associated with several metabolic diseases than conventional indicators only use anthropometric measures.27,28
NAFLD is now the leading cause of chronic liver disease in the globe. Our study showed that LAP was the index with the highest association with NAFLD in logistic regression and had the largest AUC in ROC analysis. Several studies have demonstrated the strong correlation of LAP with NAFLD. Zhang found that LAP had the best diagnostic value for NAFLD in an elderly Chinese population.29 In a large cross-sectional study that evaluated 40,459 Chinese, LAP also showed excellent performance for diagnosing NAFLD, with an AUC of 0.843 and 0.887 in men and women.30 In our study, in both crude and adjusted logistic analysis, RFM came next in identifying NAFLD after the LAP. However, in the ROC analysis, conventional indicators such as BMI and WC yield good performance in predicting NAFLD, slightly better than RFM. This indicates that RFM is a useful tool to discrimen NAFLD, but not superior to conventional indicators. The better ability of LAP to predict NAFLD may due to the fact that the LAP formula integrated TG, elevated TG levels are critical in the pathophysiology of NAFLD, and visceral fat accumulation may contribute to the development of hepatic steatosis by releasing free fatty acids and adipocytokines. LAP may be the best indicators for NAFLD risk screening. However, the equation of LAP is relatively complex with the inclusion of lipid measures, making it hard to widely use LAP in large-scale epidemiological surveys. BMI, RFM, WHtR could be an alternative in epidemiology survey due to their convenience and inexpensive characteristics.
Cardiovascular disease is the leading cause of death in the world. To date, the best adiposity index that associates strongly with CVD remains controversial, the divergences in results require further studies involving new indicators such as RFM. Based on higher odd ratios from standardized units in logistic analysis and larger AUC in the ROC analysis. RFM was found to be more significantly associated with CVD than other adiposity indicators. These associations were seen in both sexes and all age groups, but they were the strongest in younger people. Several previous studies suggest that WHtR may be a better indicator than other conventional indicators such as BMI, WC, and WHR for evaluating CVD events.31–33 In agreement with other studies, in the present study, WHtR tended toward the best performance for discriminating CVD. The comparisons of novel indicators for predicting CVD were relatively limited, in our study, RFM showed similar and slightly better performance than WHtR, LAP and VAI were no better than conventional adiposity indicators. In particular, RFM had a larger odds ratio for CVD than WHtR. It should be noted that the equation of RFM is primarily driven from WHtR, thus, they showed identical AUC in the ROC analysis. The message delivered by WHtR is simple and easy interpreted, and the cutoff of 0.5 has been proved in both sexes and populations.34 When the WHtR value was 0.5, the associated RFM value was 24 for men and 36 for women, which was close to the RFM cut-off in our study. Although RFM is easy to apply, it involves a greater number of mathematical calculations when compared to WHtR, which can be a limiting factor for its use.
In addition, in our study, adiposity indicators generally showed better performance in women than man in terms of discriminating NAFLD and CVD, gender disparities in body fat distribution have long been noted, many other studies have also demonstrated this similar sex-specific difference,35,36 one probable explanation could be women tend to have pear-shaped body and have more concentrated fat distribution around hip, the increment in abdominal section in women may indicate a transition from a healthy body fat storage to a metabolically damaging body fat storage, thus have stronger association with health-related outcomes.
Some strengths and limitations need to be mentioned to better interpret this study’s results. To the best of our knowledge, this is the first large-scale cross-sectional study that evaluated the association of RFM with NAFLD and CVD in the Chinese population, and compared it with six other adiposity indicators. The present study demonstrated that RFM is a reliable indicator to discriminate the risk of both NAFLD and CVD, and it had a stronger association with CVD than other indicators. We also acknowledge some limitations of the present study. First, as a cross-sectional study, the results could only imply association, and has less ability to infer causal inference between RFM and disease outcomes. Second, ultrasonography is a well-validated method to diagnose NAFLD, however, the gold standard measure of liver biopsy is not available in this study, which may lead to classification error. Third, although we adjusted for multivariable in the logistic regression analysis, many other related factors may not be fully eliminated and may influence associations. Fourth, the diagnosis of CVD was based on self-reported questionnaires, which might lead to misreporting, under-reporting,and recall bias. Prospective studies should be conducted to investigate RFM’s predictive potential to identify those at risk of developing NAFLD and CVD.
Conclusion
In conclusion, our findings suggest that RFM was significantly associated with prevalent NAFLD and CVD in Chinese adults and might be considered a simple tool for disease prediction. Further large longitudinal studies are needed to verify our findings.
Data Sharing Statement
The data that support the findings of this study are available on request from the corresponding author.
Acknowledgments
We express our sincere gratitude to all colleagues and participants joined the SPECT-China study.
Author Contributions
All authors made a significant contribution to the work reported, whether that is in the conception, study design, execution, acquisition of data, analysis and interpretation, or in all these areas; took part in drafting, revising or critically reviewing the article; gave final approval of the version to be published; have agreed on the journal to which the article has been submitted; and agree to be accountable for all aspects of the work.
Funding
This study was supported by National Natural Science Foundation of China (82120108008, 82170870); Science and Technology Commission of Shanghai Municipality (22015810500); The Major Science and Technology Innovation Program of Shanghai Municipal Education Commission (2019-01-07-00-01-E00059). The funders had no involvement in the execution, management, analysis, or interpretation of the study, or in the creation, evaluation, or approval of the publication.
Disclosure
The authors report no conflicts of interest in this work.
References
1. González-Muniesa P, Mártinez-González M-A, Hu FB, et al. Obesity. Nat Rev Dis Primers. 2017;3:17034. doi:10.1038/nrdp.2017.34
2. Kyrgiou M, Kalliala I, Markozannes G, et al. Adiposity and cancer at major anatomical sites: umbrella review of the literature. BMJ. 2017;356:j477. doi:10.1136/bmj.j477
3. Powell-Wiley TM, Poirier P, Burke LE, et al. Obesity and cardiovascular disease: a scientific statement from the American heart association. Circulation. 2021;143(21). doi:10.1161/CIR.0000000000000973
4. Piché M-E, Tchernof A, Després J-P. Obesity phenotypes, diabetes, and cardiovascular diseases. Circ Res. 2020;126(11):1477–1500. doi:10.1161/CIRCRESAHA.120.316101
5. Fan J-G, Kim S-U, Wong VW-S. New trends on obesity and NAFLD in Asia. J Hepatol. 2017;67(4):862–873. doi:10.1016/j.jhep.2017.06.003
6. Li L, Liu DW, Yan HY, Wang ZY, Zhao SH, Wang B. Obesity is an independent risk factor for non-alcoholic fatty liver disease: evidence from a meta-analysis of 21 cohort studies. Obes Rev. 2016;17(6):510–519. doi:10.1111/obr.12407
7. Mandviwala T, Khalid U, Deswal A. Obesity and cardiovascular disease: a risk factor or a risk marker? Curr Atheroscler Rep. 2016;18(5):21. doi:10.1007/s11883-016-0575-4
8. Gutiérrez-Cuevas J, Santos A, Armendariz-Borunda J. Pathophysiological molecular mechanisms of obesity: a link between MAFLD and NASH with cardiovascular diseases. Int J Mol Sci. 2021;22(21):11629. doi:10.3390/ijms222111629
9. Gutiérrez-Cuevas J, Sandoval-Rodriguez A, Meza-Rios A, et al. Molecular mechanisms of obesity-linked cardiac dysfunction: an update on current knowledge. Cells. 2021;10(3):629.
10. Gutiérrez-Cuevas J, Lucano-Landeros S, López-Cifuentes D, Santos A, Armendariz-Borunda J. Epidemiologic, genetic, pathogenic, metabolic, epigenetic aspects involved in NASH-HCC: current therapeutic strategies. Cancers. 2022;15(1). doi:10.3390/cancers15010023
11. Duren DL, Sherwood RJ, Czerwinski SA, et al. Body composition methods: comparisons and interpretation. J Diabetes Sci Technol. 2008;2(6):1139–1146. doi:10.1177/193229680800200623
12. Woolcott OO, Bergman RN. Relative fat mass (RFM) as a new estimator of whole-body fat percentage ─ A cross-sectional study in American adult individuals. Sci Rep. 2018;8(1):10980. doi:10.1038/s41598-018-29362-1
13. Guzmán-León AE, Velarde AG, Vidal-Salas M, Urquijo-Ruiz LG, Caraveo-Gutiérrez LA, Valencia ME. External validation of the relative fat mass (RFM) index in adults from north-west Mexico using different reference methods. PLoS One. 2019;14(12):e0226767. doi:10.1371/journal.pone.0226767
14. Suthahar N, Wang K, Zwartkruis VW, et al. Associations of relative fat mass, a new index of adiposity, with type-2 diabetes in the general population. Eur J Intern Med. 2023;109:73–78. doi:10.1016/j.ejim.2022.12.024
15. Andreasson A, Carlsson AC, Önnerhag K, Hagström H. Predictive capacity for mortality and severe liver disease of the relative fat mass algorithm. Clin Gastroenterol Hepatol. 2019;17(12):2619–2620. doi:10.1016/j.cgh.2018.11.026
16. Suthahar N, Meems LMG, Withaar C, et al. Relative fat mass, a new index of adiposity, is strongly associated with incident heart failure: data from PREVEND. Sci Rep. 2022;12(1):147. doi:10.1038/s41598-021-02409-6
17. Kobo O, Leiba R, Avizohar O, Karban A. Relative fat mass (RFM) as abdominal obesity criterion for metabolic syndrome. Eur J Intern Med. 2019;63:e9–e11
18. Wang N, Zhang K, Han B, et al. Follicle stimulating hormone, its novel association with sex hormone binding globulin in men and postmenopausal women. Endocrine. 2017;56(3):649–657. doi:10.1007/s12020-017-1272-y
19. Wang B, Zhang W, Chen C, et al. Lead exposure and impaired glucose homeostasis in Chinese adults: a repeated measures study with 5 years of follow-up. Ecotoxicol Environ Saf. 2022;243:113953. doi:10.1016/j.ecoenv.2022.113953
20. Wan H, Wang Y, Xiang Q, et al. Associations between abdominal obesity indices and diabetic complications: Chinese visceral adiposity index and neck circumference. Cardiovasc Diabetol. 2020;19(1):118. doi:10.1186/s12933-020-01095-4
21. Xu Y, Wang L, He J, et al. Prevalence and control of diabetes in Chinese adults. JAMA. 2013;310(9):948–959. doi:10.1001/jama.2013.168118
22. Farrell GC, Chitturi S, Lau GKK, Sollano JD. Guidelines for the assessment and management of non-alcoholic fatty liver disease in the Asia-Pacific region: executive summary. J Gastroenterol Hepatol. 2007;22(6):775–777. doi:10.1111/j.1440-1746.2007.05002.x
23. Lu J, Bi Y, Wang T, et al. The relationship between insulin-sensitive obesity and cardiovascular diseases in a Chinese population: results of the REACTION study. Int J Cardiol. 2014;172(2):388–394. doi:10.1016/j.ijcard.2014.01.073
24. Haufs MG, Zöllner YF. Waist-Hip ratio more appropriate than body mass index. Dtsch Arztebl Int. 2020;117(39):659. doi:10.3238/arztebl.2020.0659a
25. Jayedi A, Soltani S, Zargar MS, Khan TA, Shab-Bidar S. Central fatness and risk of all cause mortality: systematic review and dose-response meta-analysis of 72 prospective cohort studies. BMJ. 2020;370:m3324. doi:10.1136/bmj.m3324
26. Lee CMY, Huxley RR, Wildman RP, Woodward M. Indices of abdominal obesity are better discriminators of cardiovascular risk factors than BMI: a meta-analysis. J Clin Epidemiol. 2008;61(7):646–653. doi:10.1016/j.jclinepi.2007.08.012
27. Koloverou E, Panagiotakos DB, Kyrou I, et al. Visceral adiposity index outperforms common anthropometric indices in predicting 10-year diabetes risk: results from the ATTICA study. Diabetes Metab Res Rev. 2019;35(6):e3161. doi:10.1002/dmrr.3161
28. Amato MC, Giordano C. Visceral adiposity index: an indicator of adipose tissue dysfunction. Int J Endocrinol. 2014;2014:730827. doi:10.1155/2014/730827
29. Zhang Y, Li B, Liu N, Wang P, He J. Evaluation of different anthropometric indicators for screening for non-alcoholic fatty liver disease in elderly individuals. Int J Endocrinol. 2021;2021:6678755. doi:10.1155/2021/6678755
30. Dai H, Wang W, Chen R, Chen Z, Lu Y, Yuan H. Lipid accumulation product is a powerful tool to predict non-alcoholic fatty liver disease in Chinese adults. Nutr Metab. 2017;14:49. doi:10.1186/s12986-017-0206-2
31. Ashwell M, Gunn P, Gibson S. Waist-to-height ratio is a better screening tool than waist circumference and BMI for adult cardiometabolic risk factors: systematic review and meta-analysis. Obes Rev. 2012;13(3):275–286. doi:10.1111/j.1467-789X.2011.00952.x
32. Ke J-F, Wang J-W, Lu J-X, Zhang Z-H, Liu Y, Li L-X. Waist-to-height ratio has a stronger association with cardiovascular risks than waist circumference, waist-Hip ratio and body mass index in type 2 diabetes. Diabetes Res Clin Pract. 2022;183:109151. doi:10.1016/j.diabres.2021.109151
33. Mehran L, Amouzegar A, Fanaei SM, Masoumi S, Azizi F. Anthropometric measures and risk of all-cause and cardiovascular mortality: an 18 years follow-up. Obes Res Clin Pract. 2022;16(1):63–71. doi:10.1016/j.orcp.2021.12.004
34. Browning LM, Hsieh SD, Ashwell M. A systematic review of waist-to-height ratio as a screening tool for the prediction of cardiovascular disease and diabetes: 0·5 could be a suitable global boundary value. Nutr Res Rev. 2010;23(2):247–269. doi:10.1017/S0954422410000144
35. Lee K, Sung J-A, Kim J-S, Park T-J. The roles of obesity and gender on the relationship between metabolic risk factors and non-alcoholic fatty liver disease in Koreans. Diabetes Metab Res Rev. 2009;25(2):150–155. doi:10.1002/dmrr.924
36. Razzouk L, Muntner P. Ethnic, gender, and age-related differences in patients with the metabolic syndrome. Curr Hypertens Rep. 2009;11(2):127–132. doi:10.1007/s11906-009-0023-8
 © 2023 The Author(s). This work is published and licensed by Dove Medical Press Limited. The
full terms of this license are available at https://www.dovepress.com/terms
and incorporate the Creative Commons Attribution
- Non Commercial (unported, 3.0) License.
By accessing the work you hereby accept the Terms. Non-commercial uses of the work are permitted
without any further permission from Dove Medical Press Limited, provided the work is properly
attributed. For permission for commercial use of this work, please see paragraphs 4.2 and 5 of our Terms.
© 2023 The Author(s). This work is published and licensed by Dove Medical Press Limited. The
full terms of this license are available at https://www.dovepress.com/terms
and incorporate the Creative Commons Attribution
- Non Commercial (unported, 3.0) License.
By accessing the work you hereby accept the Terms. Non-commercial uses of the work are permitted
without any further permission from Dove Medical Press Limited, provided the work is properly
attributed. For permission for commercial use of this work, please see paragraphs 4.2 and 5 of our Terms.
Recommended articles
Effects of High-Fat Diet on Cardiovascular Protein Expression in Mice Based on Proteomics
Pan X, Zhang X, Ban J, Yue L, Ren L, Chen S
Diabetes, Metabolic Syndrome and Obesity 2023, 16:873-882
Published Date: 28 March 2023
Association of Serum Leptin and Adiponectin Concentrations with Type 2 Diabetes Biomarkers and Complications Among Saudi Women
Mohammed Saeed W, Nasser Binjawhar D
Diabetes, Metabolic Syndrome and Obesity 2023, 16:2129-2140
Published Date: 13 July 2023
Hypertension and Histopathology Severity of Non-Alcoholic Fatty Liver Disease Among Adults with Obesity: A Cross-Sectional Study
Chambergo-Michilot D, Rodrigo-Gallardo PK, Huaman MR, Vasquez-Chavesta AZ, Salinas-Sedo G, Toro-Huamanchumo CJ
Clinical and Experimental Gastroenterology 2023, 16:129-136
Published Date: 14 August 2023
A Systematic Bibliometric Analysis of Cardiovascular Disease Risk in Obesity (2014–2024)
Yang H, Zhang T, Wang D, Loi E, Geng Q, Wu B, Wang X, Cai R
Journal of Multidisciplinary Healthcare 2025, 18:3233-3255
Published Date: 7 June 2025
Exploring the Relationship Between Inflammatory Biomarkers and Anthropometric Measures of Obesity in Healthy Adults: A Case Control Study
El-Aghbary DA, Thabet RA, Almorish MA, AlSayaghi KM, Elkhalifa AME
Diabetes, Metabolic Syndrome and Obesity 2025, 18:3403-3414
Published Date: 9 September 2025