Back to Journals » Nature and Science of Sleep » Volume 15
Associations of Baseline Sleep Microarchitecture with Cognitive Function After 8 Years in Middle-Aged and Older Men from a Community-Based Cohort Study
Authors Parker JL ![]() , Vakulin A, Melaku YA
, Vakulin A, Melaku YA ![]() , Wittert GA, Martin SA, D'Rozario AL
, Wittert GA, Martin SA, D'Rozario AL ![]() , Catcheside PG, Lechat B
, Catcheside PG, Lechat B ![]() , Toson B, Teare AJ, Appleton SL
, Toson B, Teare AJ, Appleton SL ![]() , Adams RJ
, Adams RJ ![]()
Received 10 January 2023
Accepted for publication 17 May 2023
Published 24 May 2023 Volume 2023:15 Pages 389—406
DOI https://doi.org/10.2147/NSS.S401655
Checked for plagiarism Yes
Review by Single anonymous peer review
Peer reviewer comments 2
Editor who approved publication: Prof. Dr. Ahmed BaHammam
Jesse L Parker,1 Andrew Vakulin,1,2 Yohannes Adama Melaku,1 Gary A Wittert,3,4 Sean A Martin,3,4 Angela L D’Rozario,2,5 Peter G Catcheside,1 Bastien Lechat,1 Barbara Toson,6 Alison J Teare,1 Sarah L Appleton,1,4,* Robert J Adams1,4,7,*
1Flinders Health and Medical Research Institute, Adelaide Institute for Sleep Health, Flinders University, Adelaide, SA, Australia; 2CIRUS, Centre for Sleep and Chronobiology, Woolcock Institute of Medical Research, University of Sydney, Sydney, NSW, Australia; 3Freemasons Centre for Male Health and Wellbeing, Adelaide Medical School, University of Adelaide, Adelaide, SA, Australia; 4South Australian Health and Medical Research Institute, Adelaide, SA, Australia; 5The University of Sydney, Faculty of Science, School of Psychology, Sydney, NSW, Australia; 6College of Medicine and Public Health, Flinders University, Adelaide, SA, Australia; 7Respiratory and Sleep Services, Southern Adelaide Local Health Network, Adelaide, SA, Australia
*These authors contributed equally to this work
Correspondence: Jesse L Parker, Flinders Health and Medical Research Institute, Adelaide Institute for Sleep Health, Mark Oliphant Building, Flinders University, 5 Laffer Drive, Bedford Park, Adelaide, SA, 5042, Australia, Tel +61 0420431392, Email [email protected]
Purpose: Prospective studies examining associations between baseline sleep microarchitecture and future cognitive function recruited from small samples with predominantly short follow-up. This study examined sleep microarchitecture predictors of cognitive function (visual attention, processing speed, and executive function) after 8 years in community-dwelling men.
Patients and Methods: Florey Adelaide Male Ageing Study participants (n=477) underwent home-based polysomnography (2010– 2011), with 157 completing baseline (2007– 2010) and follow-up (2018– 2019) cognitive assessments (trail-making tests A [TMT-A] and B [TMT-B] and the standardized mini-mental state examination [SMMSE]). Whole-night F4-M1 sleep EEG recordings were processed following artifact exclusion, and quantitative EEG characteristics were obtained using validated algorithms. Associations between baseline sleep microarchitecture and future cognitive function (visual attention, processing speed, and executive function) were examined using linear regression models adjusted for baseline obstructive sleep apnoea, other risk factors, and cognition.
Results: The final sample included men aged (mean [SD]) 58.9 (8.9) years at baseline, overweight (BMI 28.5 [4.2] kg/m2), and well educated (75.2% ≥Bachelor, Certificate, or Trade), with majorly normal baseline cognition. Median (IQR) follow-up was 8.3 (7.9, 8.6) years. In adjusted analyses, NREM and REM sleep EEG spectral power was not associated with TMT-A, TMT-B, or SMMSE performance (all p> 0.05). A significant association of higher N3 sleep fast spindle density with worse TMT-B performance (B=1.06, 95% CI [0.13, 2.00], p=0.026) did not persist following adjustment for baseline TMT-B performance.
Conclusion: In this sample of community-dwelling men, sleep microarchitecture was not independently associated with visual attention, processing speed, or executive function after 8 years.
Keywords: quantitative EEG, spindles, attention, processing speed, executive function
Corrigendum for this paper has been published.
Plain Language Summary
- Finer-grained EEG parameters (quantitative EEG) may help identify individuals at risk of future cognitive decline.
- However, studies using large samples have yet to examine if quantitative EEG can predict future cognitive decline.
- The present study examined associations between quantitative EEG measured in 2010–2011 and cognition measured 8 years later in community-dwelling men.
- Relative (%) EEG power in specific frequency bands (delta, theta, alpha, sigma, and beta) was assessed during REM and NREM sleep, and sleep spindles were assessed during N2 and N3 sleep.
- Specific quantitative EEG parameters measured in 2010–2011 were associated with visual attention and processing speed after 8 years, but only at the unadjusted level.
- These results suggest quantitative EEG parameters have limited prognostic value as early markers of cognitive decline, indicating a need for further studies in community samples.
Introduction
Normal aging is associated with cognitive decline in many individuals.1 With rising life expectancy comes a corresponding increase in age-associated mild cognitive impairment (MCI) with a 20–30% conversion rate to clinical dementia/Alzheimer’s disease (AD).1 Disrupted sleep electroencephalography (EEG) macroarchitecture and obstructive sleep apnoea (OSA), a highly prevalent sleep-related breathing disorder,2 show associations with cognitive impairment.3,4 However, these frequently weak and inconsistent associations support a need to establish sensitive and robust markers of cognitive functional decline.
Emerging evidence supports that finer-grained sleep EEG microarchitecture parameters assessed through quantitative EEG (qEEG) power spectral analysis (PSA) could provide valuable cognitive function markers.5 Our group reported independent cross-sectional associations between several qEEG markers during rapid eye movement (REM) and non-REM (NREM) sleep and worse visual attention and processing speed (trail-making test A performance) and executive function (trail-making test B performance) in community-dwelling men ≥65 years.6 These findings suggest sleep qEEG may have prognostic value as a particularly sensitive and robust cognitive function marker among older community-dwelling populations.
Prospective studies examining associations between qEEG markers and future cognitive function either included relatively short follow-ups (1–2 years) or recruited smaller samples of older (≥60 years) participants, many with baseline impairment.7–11 Furthermore, previous small studies examined qEEG markers during wakefulness,8–11 limiting the evidence on prospective associations between sleep qEEG markers and future cognitive function. Lower alpha power during wakefulness was associated with a 1-year transition from MCI to AD.8 Moreover, lower theta power during wakefulness was associated with further cognitive decline after 21 months in participants with stable and progressive MCI.9 In older participants with subjective cognitive complaints, higher theta power during wakefulness was associated with conversion to MCI or dementia after 7–9 years.10 Greater EEG slowing (theta/alpha ratio) during wakefulness was associated with a transition from MCI to dementia after 1.5 years.11 In community-dwelling women ≥65 years from the Study of Osteoporotic Fractures, higher theta and alpha power during NREM sleep and alpha and sigma power during REM sleep were associated with MCI over 5 years.12
Preliminary evidence from small studies in healthy participants13,14 and people with MCI15 suggests sleep spindles may be associated with cognitive decline. Sleep spindles are brief bursts of oscillatory neural activity (11–16 Hz, ≥0.5 ≤3 seconds) generated by the interplay of thalamic and thalamocortical believed to play an important role in cortical reorganization processes contributing to learning capability and overnight declarative memory consolidation.16,17 Several studies report age-associated declines in spindle density (number/minute), average frequency (Hz, oscillations/second), and amplitude (µV) in healthy and diseased populations.13,14,18 Lower spindle amplitude has been associated with earlier cognitive impairment in people with subjective cognitive complaints and MCI compared to controls with normal cognitive function.15 Another study reported associations between MCI and AD and lower parietal fast spindle density, suggesting aging may be associated with spindle abnormalities.19 Despite evidence supporting associations between spindle abnormalities and cognitive decline, longitudinal analyses in more extensive community-based studies remain warranted to determine the prognostic value of sleep spindles as markers of cognitive functional decline.
While the emerging literature supports that qEEG (EEG spectral power, sleep spindles, and EEG slowing) may be a particularly sensitive and robust cognitive function marker, no community-based cohort studies are available to determine the prognostic value of sleep qEEG markers for predicting future cognitive impairment. Identifying sleep qEEG markers sensitive to cognitive functional decline could elucidate disease mechanisms and modifiable markers of cognitive impairment.20,21 Therefore, this study aimed to investigate independent associations between baseline sleep microarchitecture parameters and cognitive function after 8 years among a sample of community-dwelling middle-aged and older men. It was hypothesized that sleep microarchitecture would be independently associated with cognitive function at 8 years follow-up after controlling for baseline obstructive sleep apnoea, other relevant risk factors, and cognitive task performance.
Materials and Methods
Study Participants
The Men Androgen Inflammation Lifestyle Environment and Stress (MAILES) Study includes 2569 urban community-dwelling men harmonized from two prospective community-based cohort studies: the Florey Adelaide Male Ageing Study (FAMAS) and North West Adelaide Health Study (NWAHS). The present prospective study included FAMAS participants aged 35–80 years at baseline (2002–2006) residing in north-west Adelaide.22,23
During a computer-assisted telephone interview follow-up in 2010 (n=858), FAMAS participants reporting no previous OSA diagnosis (n=767) were invited to undergo home-based eight-channel ambulatory polysomnography (PSG) (2010–2011) as part of a sub-study of the MAILES Study.24,25 Approximately 75% of the eligible participants (n=575) agreed to participate, with time and budget constraints resulting in a final sample of 477 (Figure 1). FAMAS was conducted in accordance with the Declaration of Helsinki and approved by the Royal Adelaide Hospital Human Research Ethics Committee. All participants provided written informed consent.
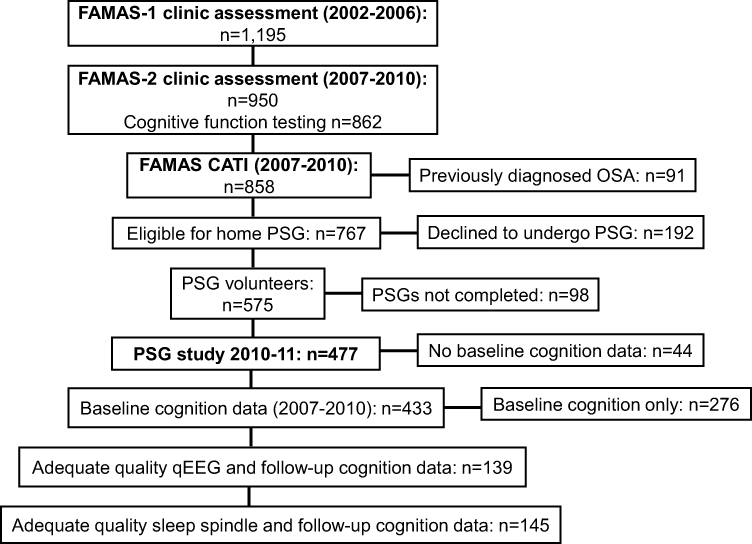 |
Figure 1 FAMAS clinic and sleep study assessments and cognitive function testing. Abbreviations: FAMAS, Florey Adelaide Male Ageing Study; CATI, computer-assisted telephone interview; PSG, polysomnography. |
Baseline Sleep Study Assessment
As described previously,3,6,26 ambulatory PSG (Embletta X100, Embla Systems, Broomfield, Colorado, USA) recorded electrical brain activity (EEG, F4-M1) and left electrooculography with 12-bit signal resolution, 200 Hz sampling rate, and band-pass filters (0.3–35 Hz) together with submental electromyography, nasal cannula pressure, thoracic and abdominal motion, finger pulse oximetry, and body position. Trained staff attached the PSG equipment and obtained anthropometric measures (height, weight, and body mass index [BMI, kg/m2]).
A single experienced sleep technician manually scored all PSG measures according to 2007 American Academy of Sleep Medicine (AASM) Alternative scoring criteria,27 recommended by an Australasian Sleep Association expert panel for use in prospective epidemiological studies.28 The sleep technician participated in quarterly external Qsleep scoring concordance assessments, a national external proficiency testing program (www.qsleep.com.au), where performance was consistent within two quartiles of national assessments.
OSA was identified by an apnea–hypopnea index (AHI) ≥10/h and categorised as mild (10–19/h), moderate (20–29/h), or severe (≥30/h). An AHI ≥5/h used to define sleep-disordered breathing by the AASM 2007 Recommended scoring criteria is approximately equivalent to ≥10/h using the Alternative and ≥15/h using the older 1999 Chicago criteria.27 Therefore, an AHI cut-off of 10/h was chosen to maintain comparability with previous work. Apnea was defined as complete or near-complete airflow cessation (≥90%) measured using nasal cannula pressure excursions lasting ≥10 seconds. Hypopnoea was defined as a ≥50% decrease in nasal cannula pressure excursions and an associated ≥3% oxygen desaturation or EEG arousal.27 Nocturnal hypoxemia was assessed from the oxygen desaturation index 3% and the percentage of total sleep time with oxygen saturation <90%. Sleep studies were considered acceptable for analysis based on ≥3.5 hours of sleep and ≥5.5 hours of total-recorded study time with technically acceptable respiratory and EEG signal quality.
EEG Data Processing
A detailed description of qEEG analysis used in this study has been described previously.29,30 European Data Format and sleep stage files were generated using Embla REMLogic PSG Software (Natus Medical, Inc., Pleasanton, California). Of the 477 men who underwent sleep studies, PSG data were of adequate quality for qEEG analysis in 415. Of these, 139 men who completed follow-up cognitive testing had adequate quality baseline qEEG data. An algorithm identified artifactual EEG data over consecutive non-overlapping 5-second epochs based on previously validated artifact detection threshold parameters.29 Contaminated 5-second epochs, including arousals where EEG traces went outside the amplitude boundaries, were subsequently excluded from qEEG analysis.
EEG Power Spectral Analysis
After rejecting artifactual epochs, power spectra were obtained from F4-M1 EEG recordings using a standard fast Fourier transform algorithm with a rectangular weighting window for each non-overlapping 5-second epoch. Absolute spectral power (µV2) was calculated in the delta, theta, alpha, sigma, and beta frequency bands defined as EEG activity of 0.5–4.5, 4.5–8, 8–12, 12–15, and 15–32 Hz, respectively, during NREM and REM sleep. EEG power for each sleep-staged 30-second epoch was calculated by averaging data from six artifact-free 5-second epochs comprising each 30-second recording segment.29 Average µV2 over the frequency interval within the defined bands was computed for NREM (N2 and N3) and REM sleep, from which relative spectral power (eg, delta/delta+theta+alpha+sigma+beta) was calculated. A global measure of EEG slowing (ie, a ratio of slow to fast frequencies [(delta+theta)/(alpha+sigma+beta)]) was also calculated. As reported previously,6 manual verification of automated artifact scoring accuracy was performed in 10% of the randomly selected PSGs. Manual verification revealed excellent accuracy (mean ± SD) (96.6% ± 4.4%) and specificity (99.9% ± 28.1%) and good to moderate sensitivity (59.1% ± 0.1%) and agreement (Cohen’s kappa [k]=0.68 ± 0.26).
Sleep Spindle Detection Algorithm and Metrics of Interest
Spindle events were visually identified using an automated detection tool developed and written in Java, version 1.6 (Oracle, Santa Clara, California, USA), and previously validated in OSA samples.31 A 128-order band-passing Finite-Impulse-Response filter was applied to the raw EEG signal, yielding a time course of sigma activity (11–16 Hz, ≥0.5 ≤3 seconds).32 Spindle events were marked from onset to offset and exported with start time and duration details. Spindle events were recorded where the edges of the amplitude threshold crossings showed a threshold of 20% and tolerance of 50% of spindle amplitude. Spindles meeting criteria of duration 0.5–3 seconds and an inter-event interval >1 second were counted as events. Occurrence (11–16 Hz total events), average frequency (Hz), and amplitude (µV) of overall spindle events and overall (11–16 Hz), slow (11–13 Hz), and fast (13–16 Hz) spindle density (events/minute of sleep) were calculated during N2 and N3 sleep.26 Of men who completed follow-up cognitive testing, 145 had adequate quality sleep spindle data at baseline.
Baseline and Follow-Up Cognitive Assessments
Three standardized, validated, and well-established cognitive tests, described previously,3,33–35 were administered during the 2007–2010 follow-up and repeated at the 2018–2019 follow-up examination, including trail-making tests A and B and the 30-point mini-mental state examination.
Trail-Making Test
The trail-making test (TMT) assesses visual search, processing speed, mental flexibility, visual attention, and executive function.33,34 Part A (TMT-A) assesses visual attention and processing speed and requires participants to connect encircled numbers (1–25) in sequence. Part B (TMT-B) assesses executive function and requires participants to connect encircled numbers with corresponding encircled letters in the appropriate sequence (1 – A, 2 – B, 3 – C, etc).35 The time in seconds to complete each path is scored, with higher scores indicating inferior performance.35
Standardized Mini-Mental State Examination
The standardized mini-mental state examination (SMMSE) is a quantitative measure of cognitive status consisting of a 30-point questionnaire designed to assess orientation, registration and recall, attention and calculation, language, and the ability to follow simple verbal and written commands.36,37 The total score from these questions scales an individual on cognitive ability. The maximum possible score is 30, with <28 indicating cognitive impairment, classified as mild (22–27), moderate (17–21), or severe (<17).38
Baseline Covariate Assessments
Self-completed questionnaires assessed demographic factors (age, financial stress, education, and marital status). Relative social disadvantage, based on residential postcode, was determined using the Australian Bureau of Statistics Socio-Economic Indexes for Areas Index of Relative Socio-Economic Disadvantage.39 Clinic assessments (2007–2010) included anthropometry, seated sphygmomanometer blood pressure, and a fasting blood sample to assess glucose and haemoglobin A1C (HbA1c).23 Composite cardiovascular disease (self-reported doctor-diagnosed myocardial infarction, angina, transient ischemic attack, or stroke) and diabetes mellitus (self-reported doctor-diagnosed diabetes or fasting plasma glucose ≥7.0 mmol/L [126 mg/dL], HbA1c ≥6.5%, or reported antidiabetic medication use [oral hypoglycaemic agents and/or insulin]) were also determined. Men were classified as having insomnia symptoms if they reported difficulty initiating or maintaining sleep at least three nights/week (Pittsburgh Sleep Quality Index dimensions) and significant daytime fatigue, defined as a score one SD below the mean on the 36-item short-form survey instrument (SF-36) Vitality Scale.40 Hypertension was defined as systolic blood pressure ≥140 mmHg and/or diastolic blood pressure ≥90 mmHg or reported antihypertensive medication use.41 Self-completed questionnaires assessed chronic disease risk factors (smoking status, alcohol risk, and physical activity) and health-related quality of life (SF-36). Body mass index (BMI) was categorized according to international criteria from the World Health Organization (<25 [underweight/normal], 25–29.9 [overweight], and ≥30 [obese]).42
Statistical Analysis Methodology
Data were analyzed using IBM SPSS version 25.0 (IBM Corporation, Armonk, New York, USA). Baseline participant characteristics are reported as mean (SD) for normally distributed continuous variables, median (IQR) for skewed continuous variables, and percentage (frequency) for dichotomous and categorical variables.
Baseline participant characteristics were stratified by cognitive follow-up examination participation and performance status to examine possible responder bias. Impaired performance was defined as a ≥0.5 SD change in TMT score between baseline and follow-up.43 Between-group differences were assessed using Pearson’s chi-squared tests for dichotomous and categorical variables, independent samples t-tests for normally distributed continuous variables, and Mann–Whitney U-tests for skewed continuous variables. Standardized z-scores were calculated using logarithmic base 10 transformed test scores, subtracting the mean, and dividing by the sample SD.43–46
Univariable and multivariable linear regression analyses were performed to examine associations between baseline sleep microarchitecture parameters (NREM and REM sleep EEG relative spectral power, EEG slowing ratio, and sleep spindle metrics) and standardized TMT-A and TMT-B performance at 8 years follow-up. Results are presented as unstandardized beta (B) coefficients (95% confidence interval [CI]). EEG slowing ratios were normalized by applying logarithmic base 10 transformations. Three regression models were constructed, including 1) unadjusted; 2) adjusted for age, AHI, highest educational attainment, socio-economic disadvantage, marital status, BMI, and cardio-metabolic conditions (one or more of hypertension, diabetes mellitus, or cardiovascular disease); and 3) additionally adjusted for baseline cognitive task performance.
Purposeful covariate selection6,47 ensured retainment of robust covariates. Covariates in multivariable adjustment are previously reported risk factors for cognitive decline.20,35,48,49 Principal assumptions of linear regression modelling were checked and satisfied, including linearity, normality, and homoscedasticity. Multicollinearity was assessed by examining the variance inflation factor.
Binary logistic regression models were constructed to examine associations between baseline sleep microarchitecture parameters and dichotomized values of change in TMT times (cut-offs for cognitive change; normal [≤0.5 SD] and impaired [>0.5 SD] performers)43 and follow-up SMMSE scores, with <28/30 corresponding to cognitive impairment.38 Results are presented as odds ratios (95% CI). The principal assumptions of logistic regression modelling were checked and satisfied, including independence, linearity, and absence of multicollinearity and outliers. Covariates in multivariable adjustment were consistent with linear regression analyses.
As a supplementary analysis, associations were examined between baseline sleep microarchitecture parameters and cognitive function at 8 years follow-up after excluding participants who reported using psychoactive medication(s), including opiates, antipsychotics, antiepileptics, or benzodiazepines (n=14). For all analyses, a two-sided p<0.05 was considered statistically significant. Based on previously reported practical considerations50,51 and the exploratory nature of the analyses, multiple comparison adjustments were not performed.
Results
Of men with baseline PSG and cognitive data (n=433), 36.3% (n=157) participated in the 2018–2019 follow-up examination (Figure 1). The mean (SD) age at baseline of those who participated in follow-up was 58.9 (8.9) (41–81) years. Median (IQR) follow-up time was 8.3 (7.9, 8.6) years.
Baseline Participant Characteristics Stratified by Follow-Up Status
At baseline, compared to non-participants, follow-up examination participants were younger and showed higher N3 sleep spindle frequency. However, there were no differences in chronic diseases or risk factors (Table 1). Of participants in the follow-up examination, 13.4% (n=21) showed cognitive impairment (SMMSE <28/30) at baseline, 14.0% (n=22) showed cognitive impairment at follow-up, and 8.9% (n=14) showed incident MCI (≥28/30 at baseline but <28/30 at follow-up).
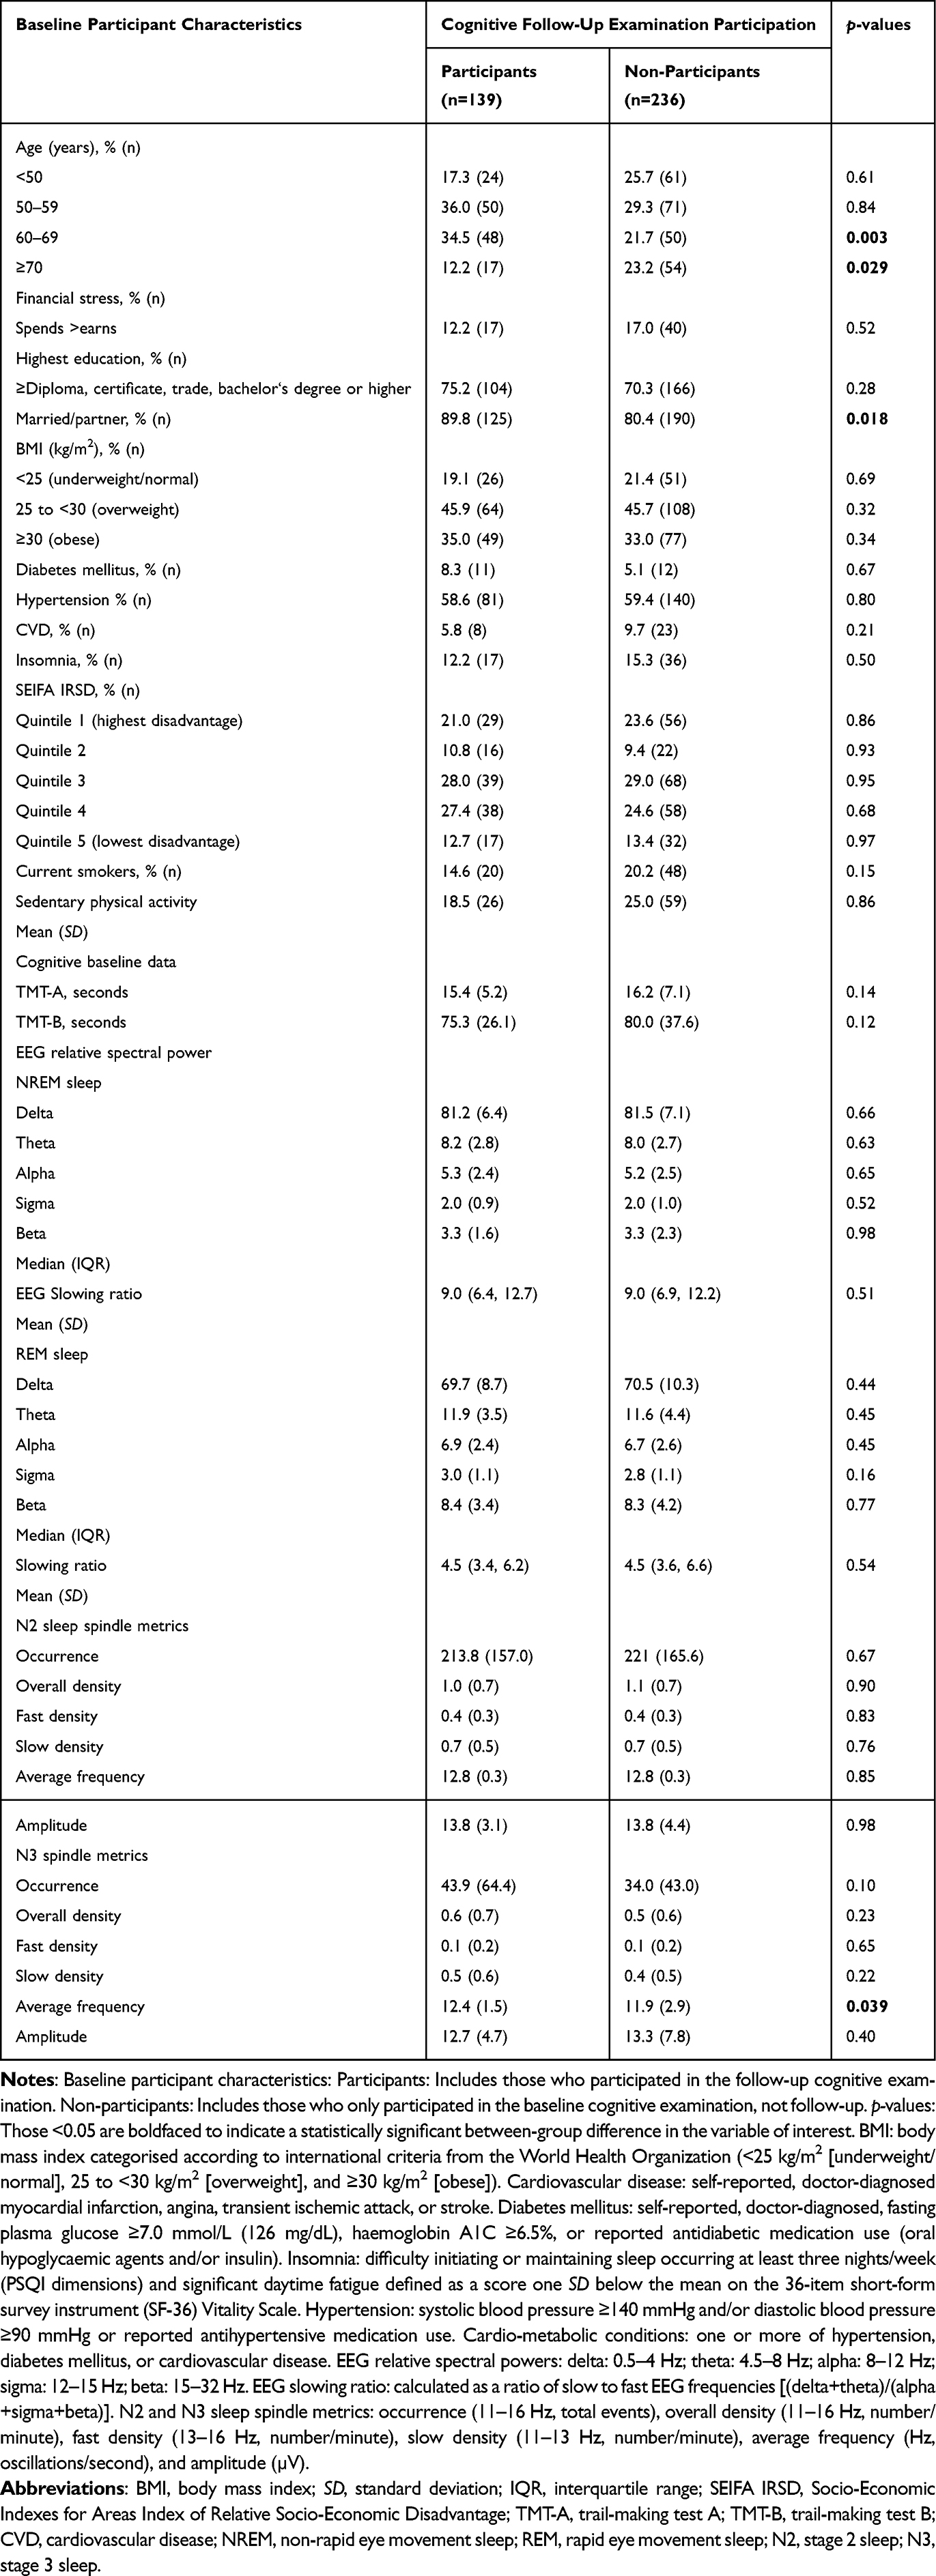 |
Table 1 Baseline Participant Characteristics Stratified by Participation in Cognitive Follow-Up Examination |
TMT Scores Relative to Normative Values of Age and Education
At baseline, the sample was mostly non-impaired on TMT-A relative to previously published normative values of similar age and highest educational attainment.35 However, a considerable proportion showed impairment in TMT-A at follow-up (Supplementary Figure 1). Most participants recorded worse TMT-B scores at baseline and follow-up relative to previously published normative values of age and highest educational attainment (Supplementary Figure 2).
Baseline Sleep Microarchitecture Parameters Stratified by Baseline to Follow-Up Change in Cognitive Function
Participants who showed a ≥0.5 SD reduction on TMT-A and TMT-B were older than those who did not show a ≥0.5 SD reduction (Supplementary Table 1). Participants who showed a ≥0.5 SD reduction on TMT-A recorded lower N2 sleep spindle occurrence and N2 and N3 sleep overall and slow spindle density than those who did not show a ≥0.5 SD reduction. Moreover, participants who showed a ≥0.5 SD reduction on TMT-B recorded lower N2 sleep spindle amplitude than those who did not show a ≥0.5 SD reduction (Table 2).
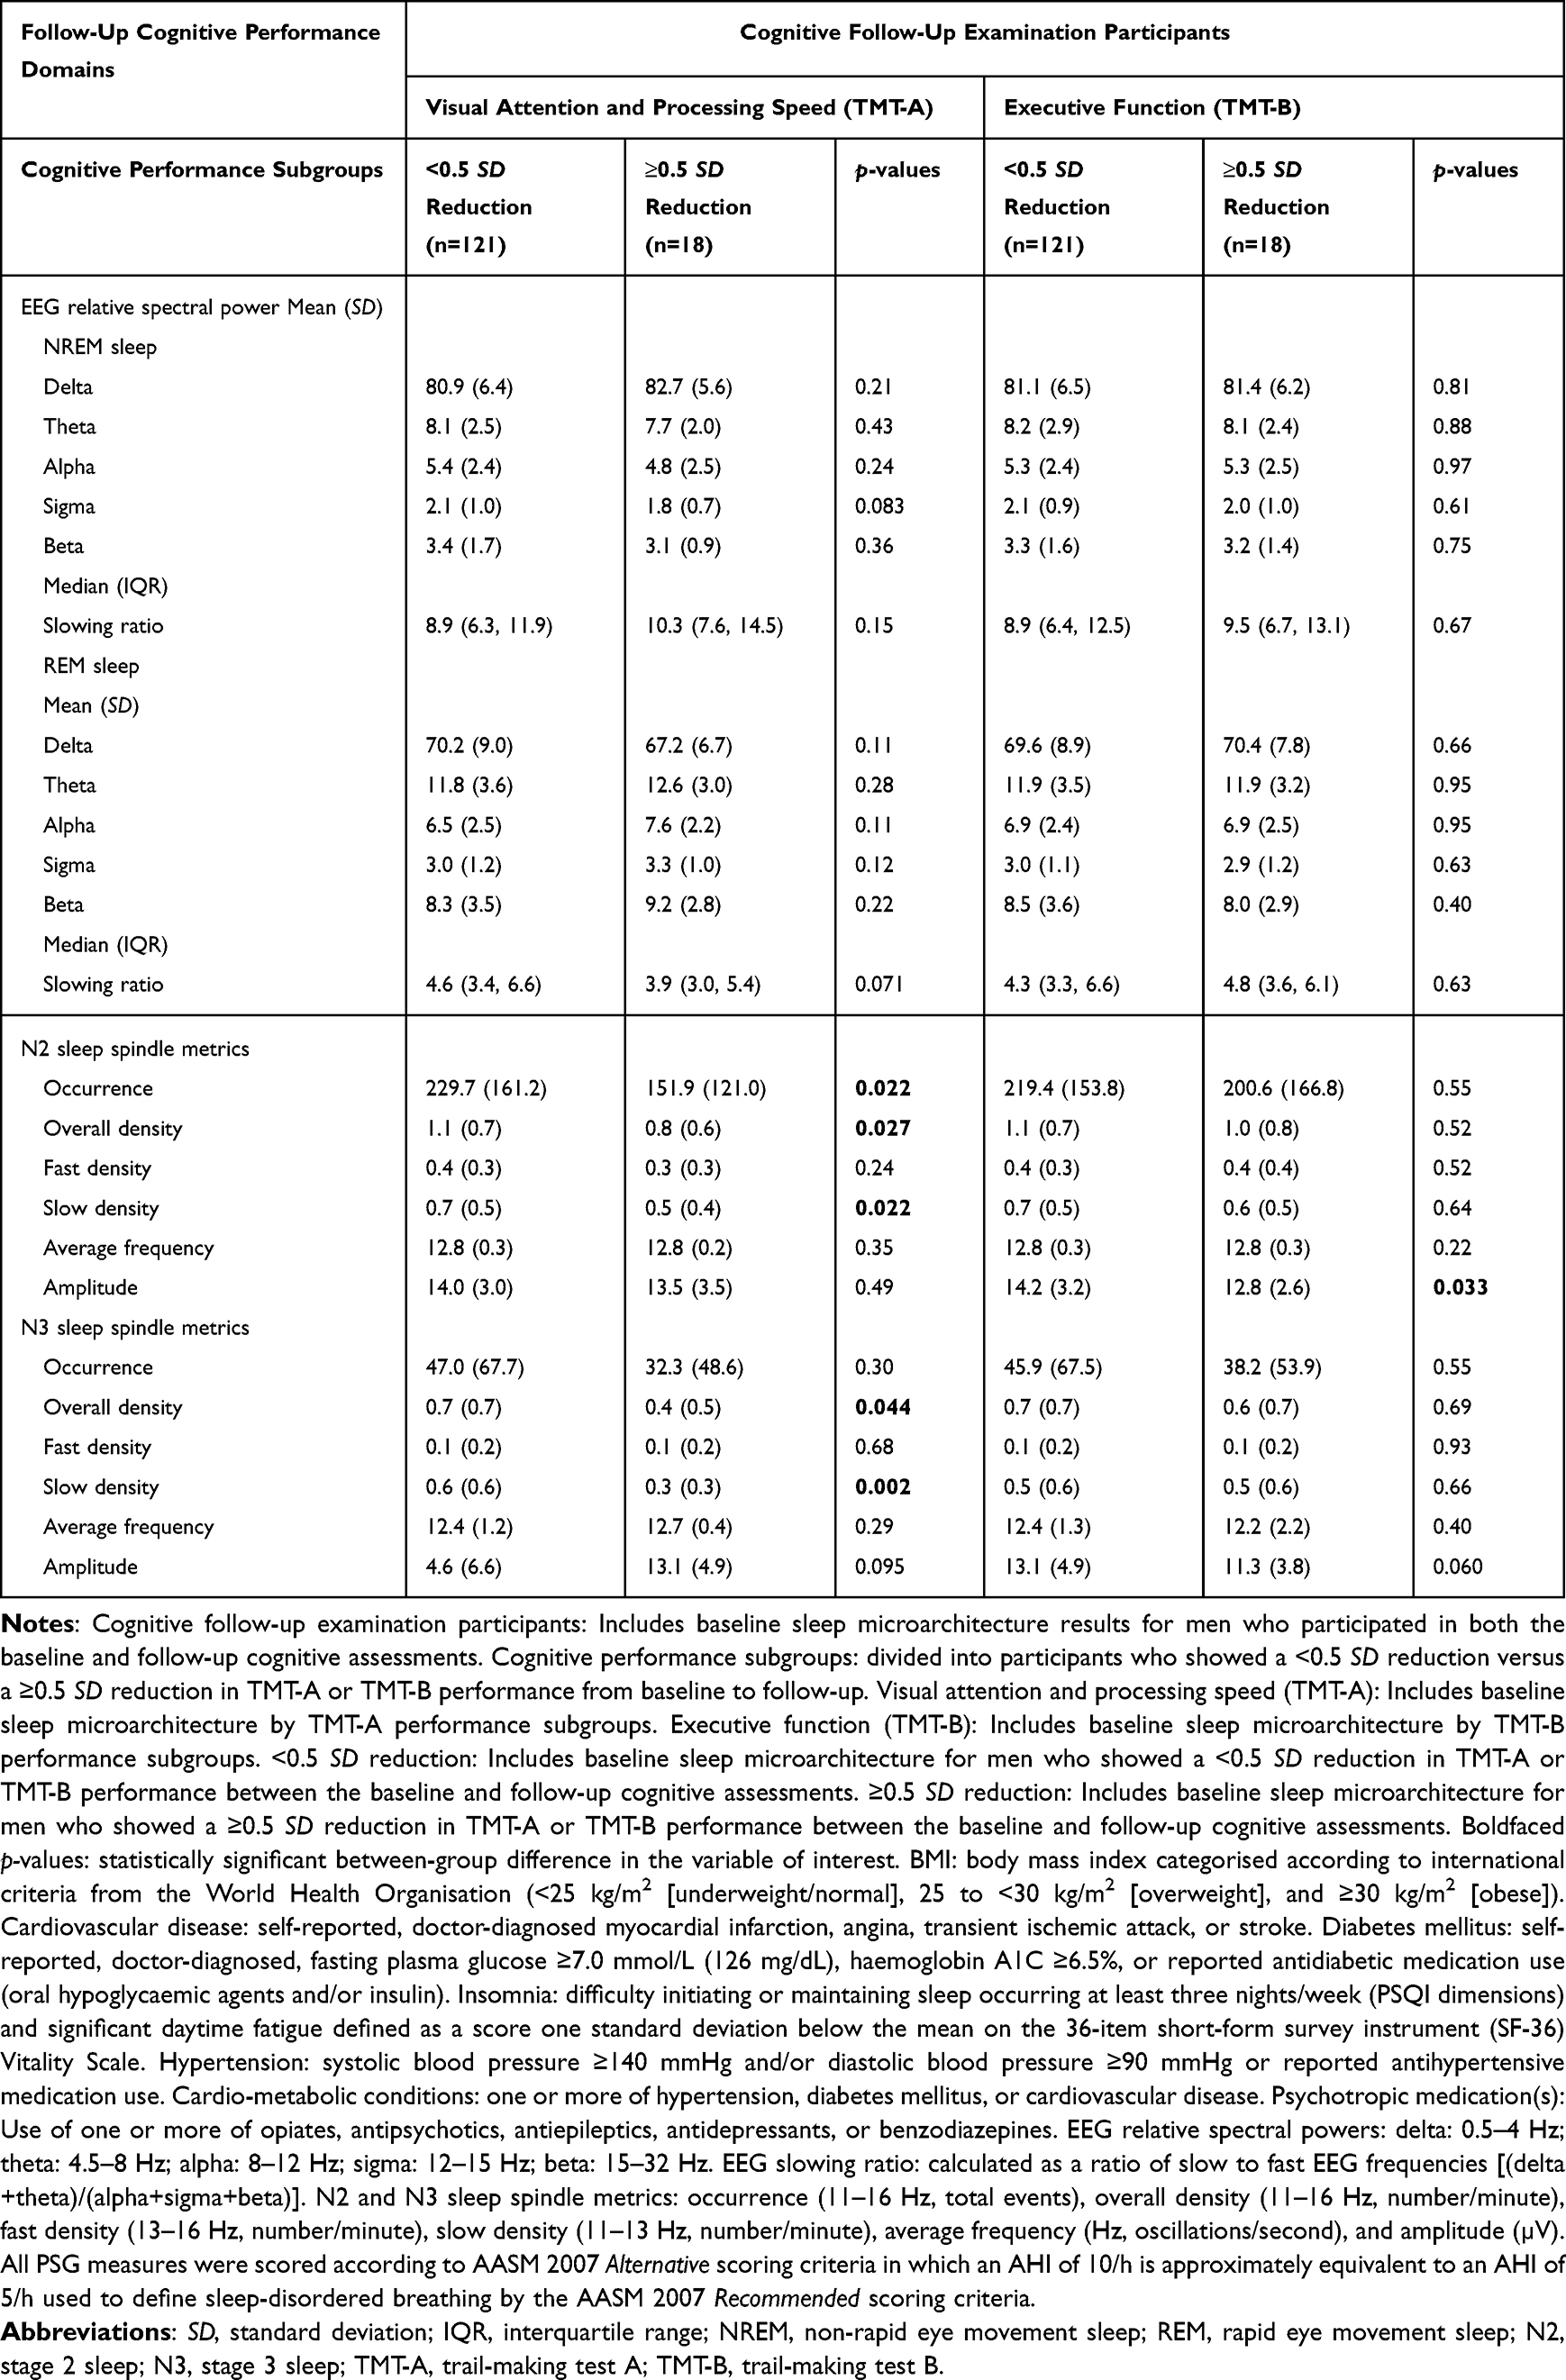 |
Table 2 Baseline Sleep Microarchitecture Parameters Stratified by Standard Deviation Reduction in TMT Performance from Baseline to Follow-Up |
Associations Between Baseline Sleep Microarchitecture Parameters and Future Cognitive Function
In an unadjusted model, a one-unit increase in REM sleep delta power was associated with a −0.02 SD decrease in TMT-A completion time (better performance) at follow-up. However, this association was not observed after excluding participants who reported using psychoactive medication(s) (Supplementary Table 2). Conversely, a one-unit increase in REM sleep alpha power was associated with a 0.08 SD increase in TMT-A completion time (worse performance) at follow-up.
In unadjusted models, worse TMT-A performance at follow-up was associated with lower N2 and N3 sleep overall and slow spindle density and N2 sleep spindle occurrence (Table 3). Worse TMT-A performance at follow-up was also associated with lower N3 sleep spindle occurrence after excluding participants who reported using psychoactive medication(s) (Supplementary Table 2). However, these associations did not persist after adjusting for age, other risk factors, and baseline cognition.
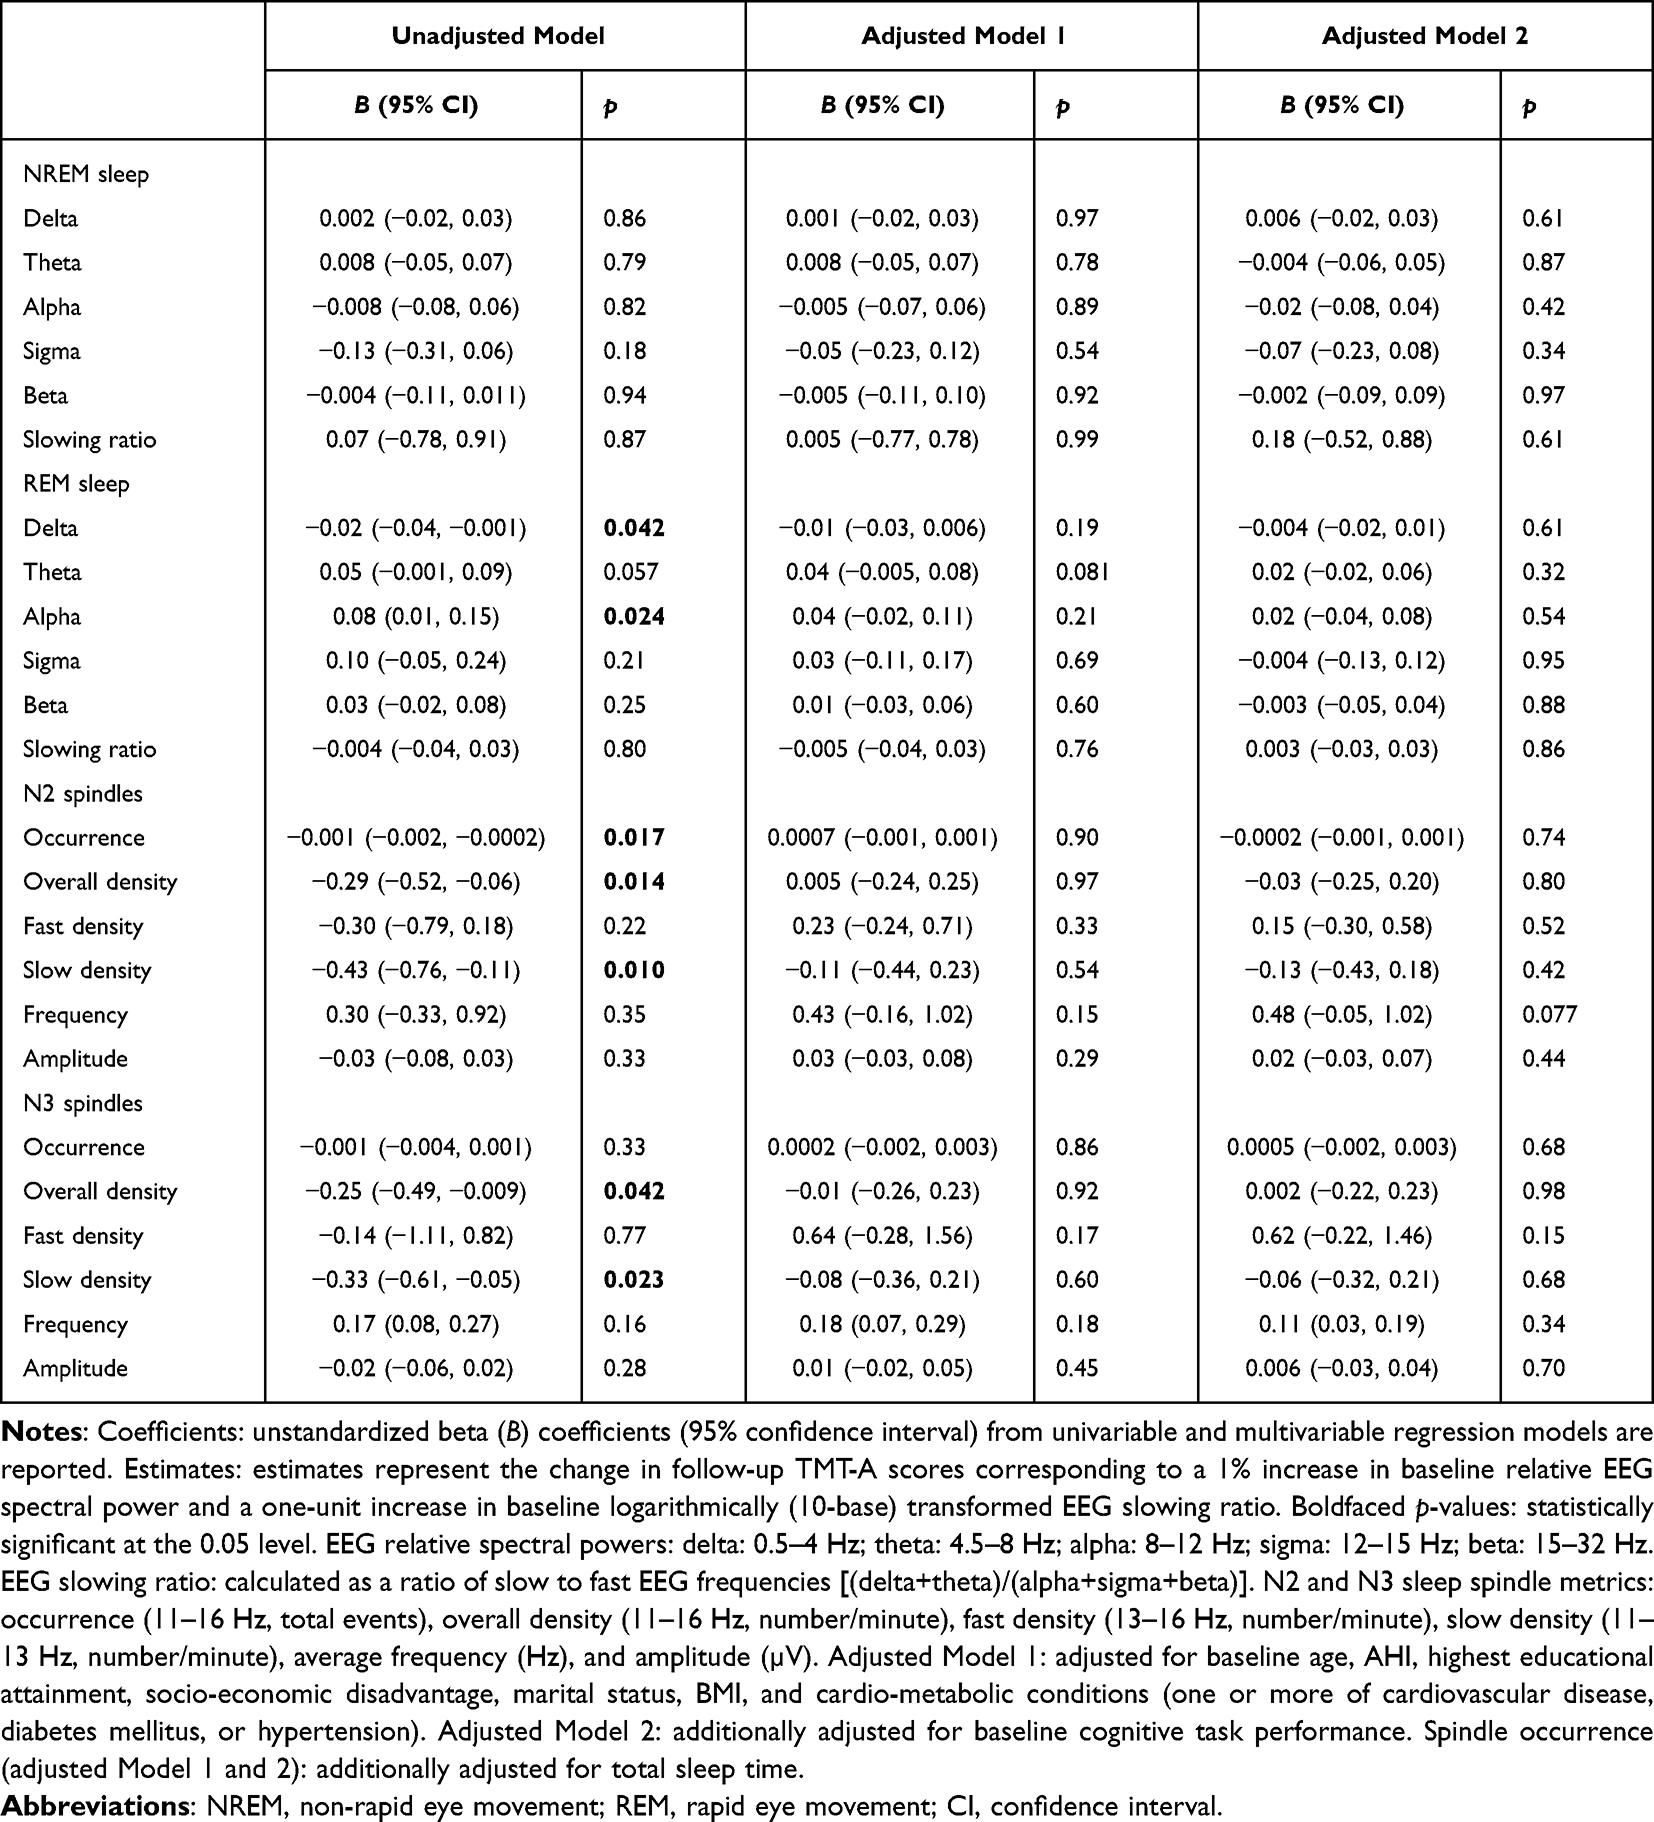 |
Table 3 Unadjusted and Adjusted Associations of Baseline Sleep Microarchitecture Parameters with Standardized (z-Score) Follow-Up TMT-A Performance |
In an adjusted model, a one-unit increase in N3 sleep fast spindle density was associated with a 1.06 SD increase in TMT-B completion time (worse performance) at follow-up (Table 4 and Supplementary Table 3). However, this association did not persist following adjustment for baseline TMT-B performance. SMMSE performance at follow-up was not associated with baseline sleep microarchitecture parameters (Supplementary Table 4). Excluding participants who reported using psychoactive medication(s) did not influence these results (Supplementary Table 5).
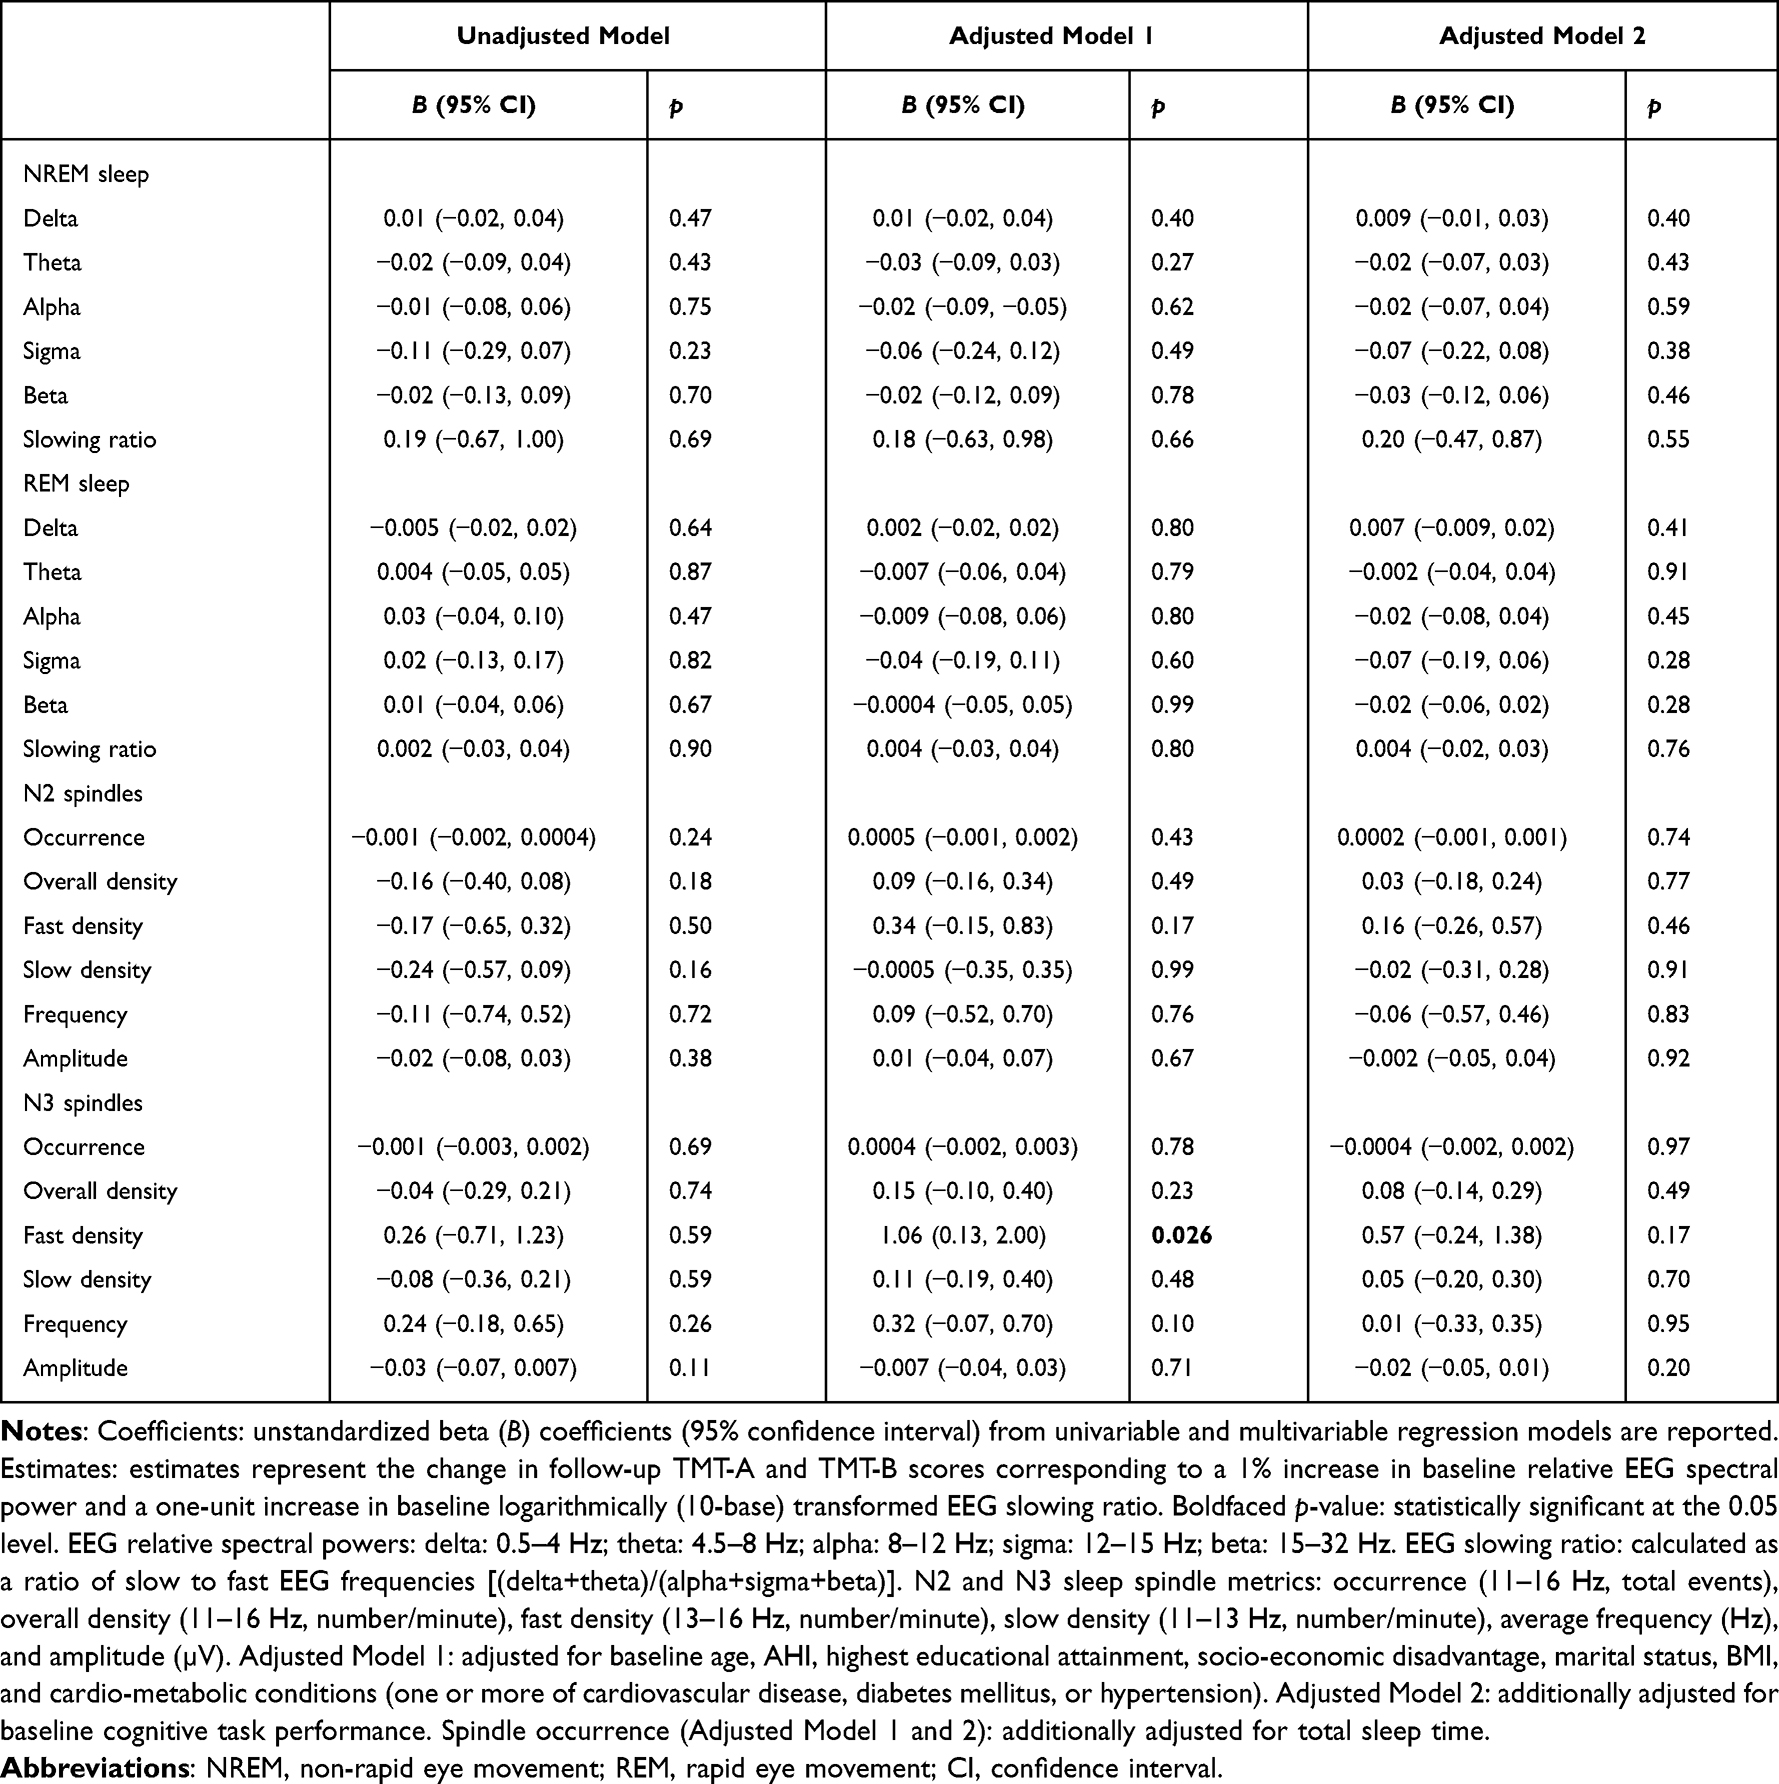 |
Table 4 Unadjusted and Adjusted Associations of Baseline Sleep Microarchitecture Parameters with Standardized (z-Score) Follow-Up TMT-B Performance |
Associations Between Baseline Sleep Microarchitecture and Baseline to Follow-Up Change in Cognitive Function
In unadjusted models, higher N2 and N3 sleep overall and slow spindle density, spindle occurrence (N2 sleep only), and spindle amplitude (N3 sleep only) were associated with reduced odds of a significant decline in TMT-A performance (Table 5). Higher N2 sleep spindle amplitude was associated with reduced odds of a significant decline in TMT-B performance (Table 6). These associations did not persist in models adjusted for age, other risk factors, and baseline cognition.
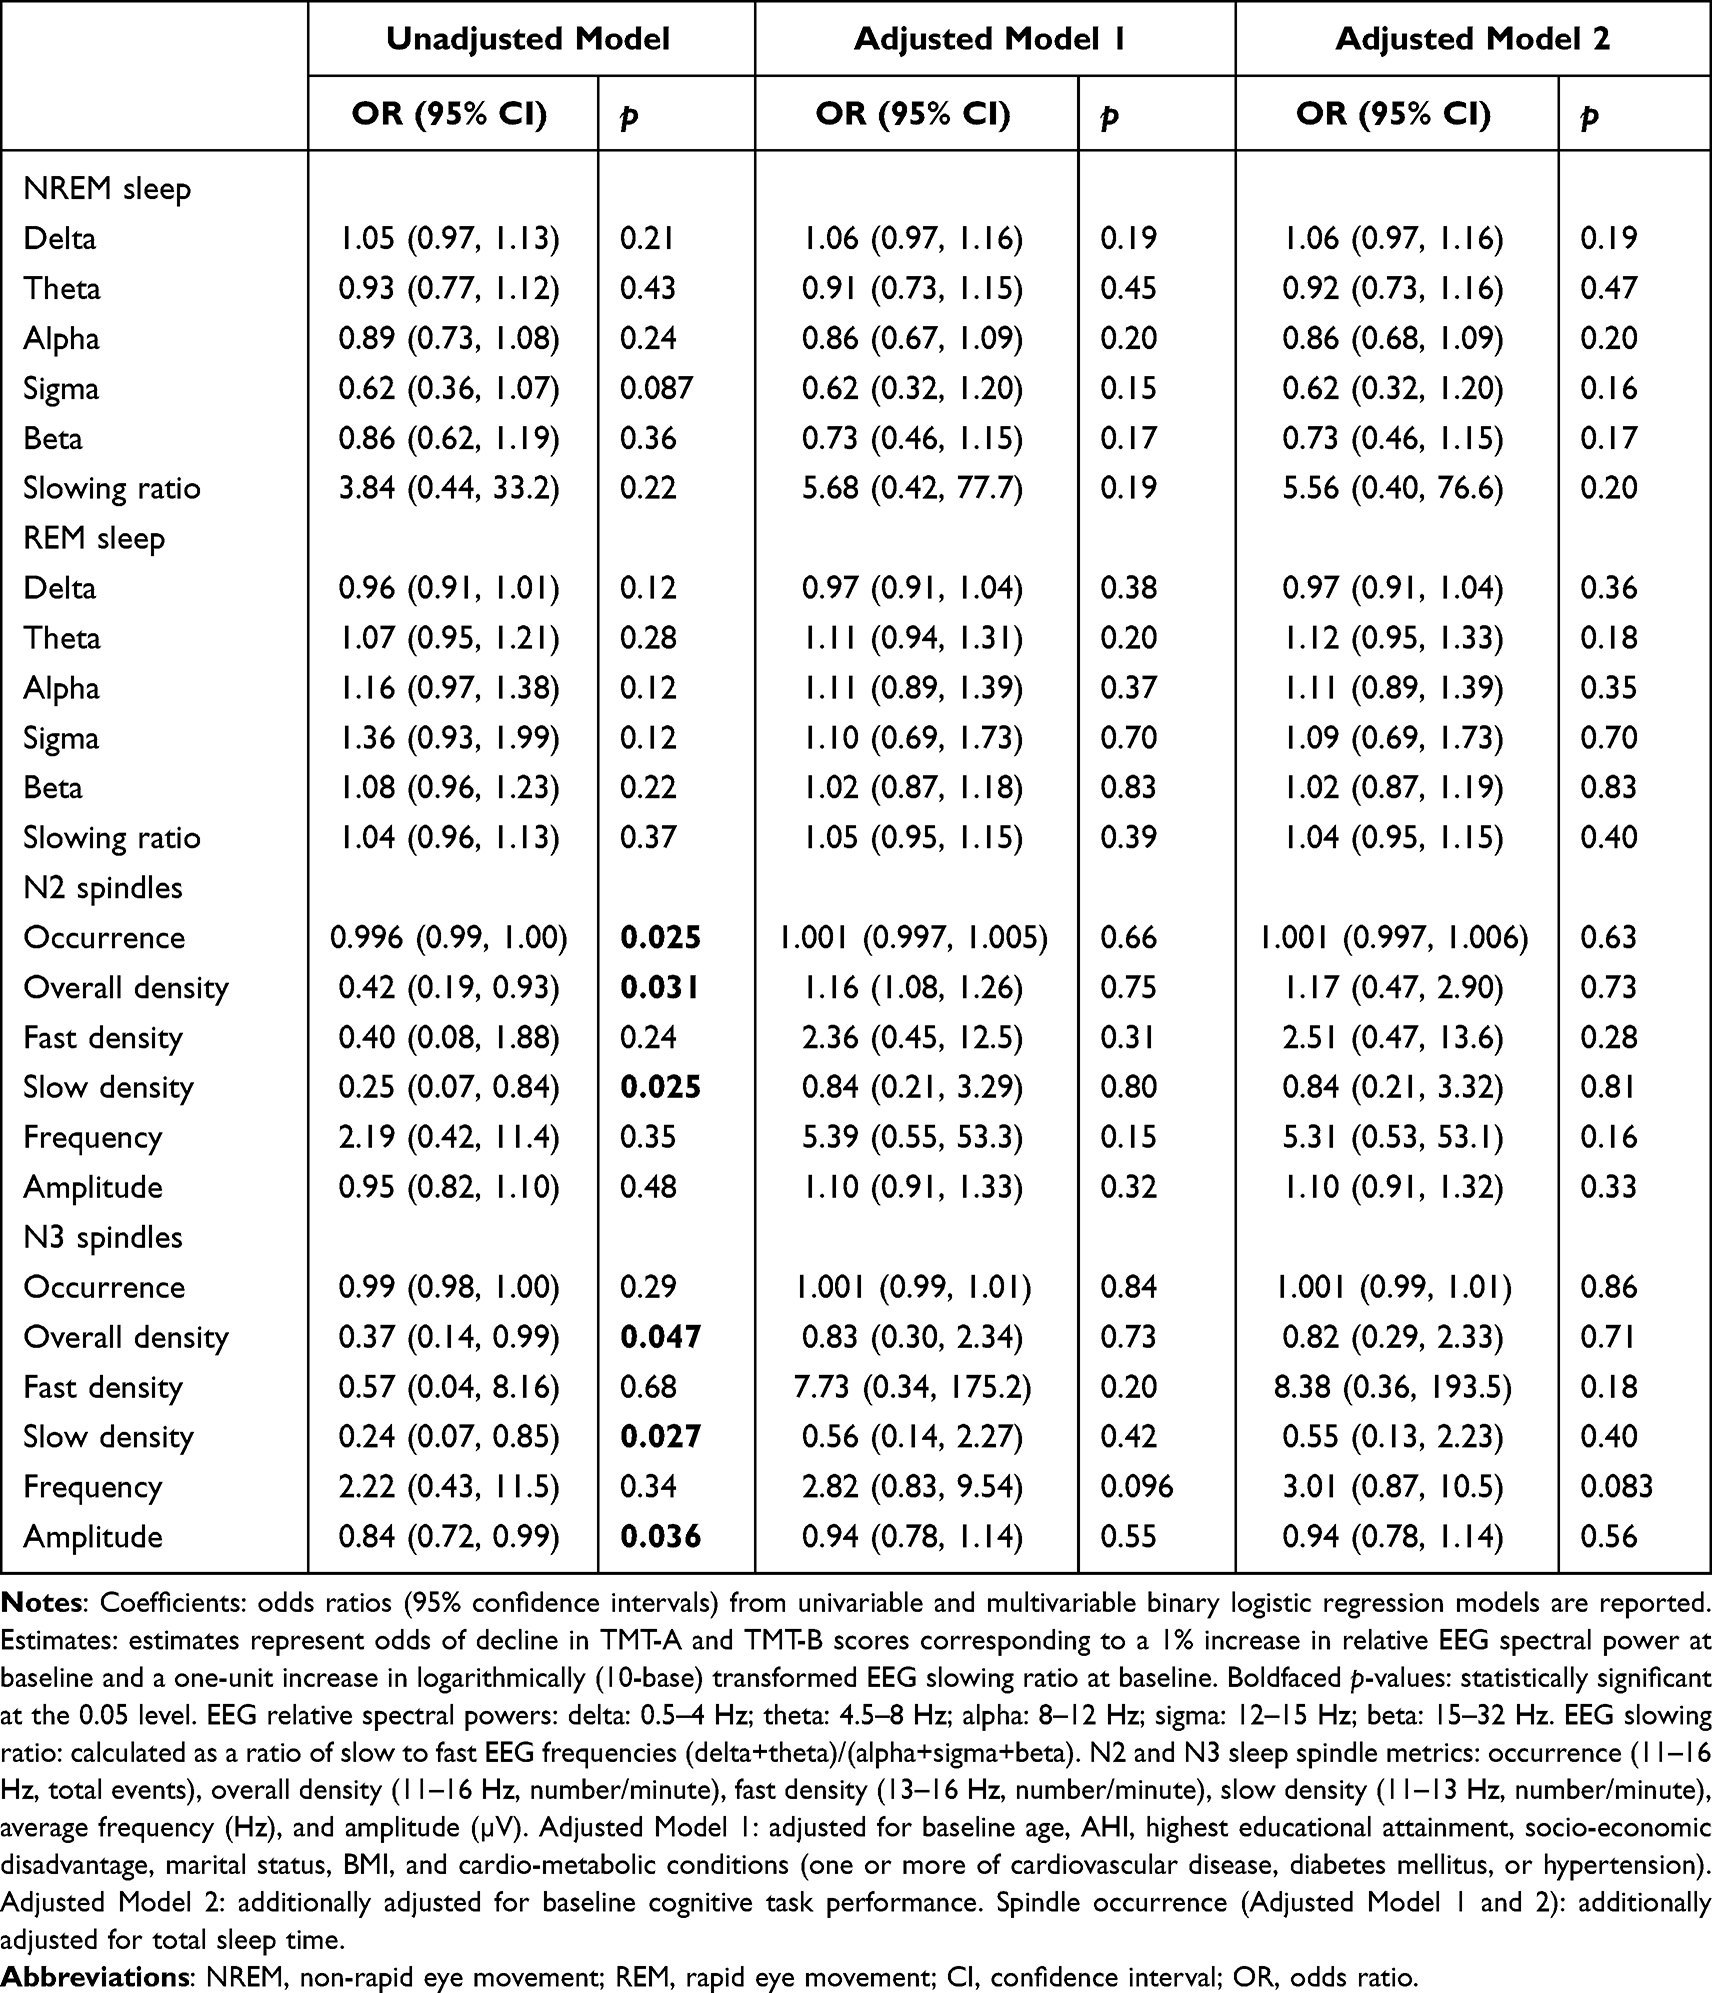 |
Table 5 Unadjusted and Adjusted Associations of Baseline Sleep Microarchitecture Parameters with Baseline to Follow-Up Change in TMT-A Performance |
 |
Table 6 Unadjusted and Adjusted Associations of Baseline Sleep Microarchitecture Parameters with Baseline to Follow-Up Change in TMT-B Performance |
Discussion
This study is the first to examine associations between baseline sleep microarchitecture and future cognitive function and decline in community-dwelling men. Sleep EEG microarchitecture parameters (relative spectral power, global EEG slowing, and sleep spindles) were not independently associated with cognitive function change (visual attention, processing speed, and executive function) after 8 years. These findings extend smaller prospective studies of sleep microarchitecture and cognitive decline,5,7–11,13 suggesting sleep qEEG has limited prognostic value as an early marker of cognitive decline.
Our group reported independent cross-sectional associations between sleep microarchitecture (lower NREM sleep delta power and higher REM sleep theta and alpha power) and cognitive dysfunction (worse TMT-A [lower NREM sleep delta power only] and TMT-B performance) in community-dwelling men ≥65 years.6 Other authors5,7,19,52–54 report differences in sleep microarchitecture between patients with mild cognitive impairment and age- and gender-matched controls. However, prospective studies examining associations between sleep microarchitecture and future cognitive function and decline were predominantly conducted in smaller samples of older participants (≥60 years), many with mild cognitive impairment/Alzheimer’s disease at baseline,7–11 or a comparatively larger study including older (≥65 years) community-dwelling women.12 The novel contribution of our study is the inclusion of a larger and younger sample of community-dwelling men with a longer follow-up to capture the prognostic value of sleep qEEG as a marker of cognitive impairment.
Unadjusted associations between lower REM sleep delta and greater REM sleep alpha power and worse TMT-A performance at follow-up did not persist in adjusted analyses. In a supplementary analysis, however, excluding participants who reported using psychoactive medication(s) (n=14) diluted the unadjusted association between lower REM sleep alpha power and worse TMT-A performance. This finding suggests psychoactive medication influences the association between sleep microarchitecture and cognitive function, specifically in REM sleep. However, this hypothesis requires further investigation.
Small prospective studies report associations between higher NREM sleep alpha and theta power and future cognitive decline.8–10,55 Conversely, in the present study, EEG power during NREM sleep was not associated with any domains of cognitive function. Djonlagic et al12 reported significant differences in baseline qEEG markers during NREM sleep between community-dwelling women ≥65 years who developed mild cognitive impairment 5 years after their baseline sleep study and women who did not develop mild cognitive impairment. As such, the present analysis of community-dwelling men expands on findings from the prospective study by Djonlagic et al,12 as longitudinal associations between sleep microarchitecture and future cognitive function were examined. In contrast, Djonlagic et al12 only investigated between-group differences in sleep microarchitecture and cognitive decline.
Our cohort consists of community-dwelling men who are, on average, younger than participants of smaller studies8–10,55 and the Study of Osteoporotic Fractures.56 As such, previously reported age and sex differences in sleep microarchitecture could account for discrepant findings between our study and prior studies. Previous reports suggest women typically show higher slow-frequency EEG activity during NREM sleep, particularly in the delta and theta frequency ranges, compared to age-matched men.56,57 Moreover, slow-wave activity (0.5–4 Hz) typically decreases with age, and aging is also associated with higher power in the fast-frequency beta range (15–32 Hz).58,59 Given the previously reported age and sex differences in sleep microarchitecture, future studies should extend our findings in men to determine whether differences exist in associations between baseline sleep microarchitecture and cognitive function in older versus younger adults and community-dwelling men versus women.
Although our cohort of men was largely free of mild cognitive impairment and Alzheimer’s disease at baseline (median SMMSE score = 29/30), most scored worse than previously reported normative values of age and highest educational attainment on TMT-A and TMT-B at follow-up.35 Therefore, unadjusted associations between lower REM sleep delta and greater REM sleep alpha power with worse TMT-A performance could relate to the sample overall showing cognitive impairment at follow-up as sleep qEEG markers may have been sensitive for detecting impairment.
Along with EEG spectral power, it is important to investigate the prognostic value of sleep spindles as markers of cognitive decline. Small prospective studies have identified potential links between aging, spindle abnormalities, including lower occurrence, density, frequency, and amplitude, and cognitive impairment.13–15,18 While we observed several unadjusted associations of higher overall and slow spindle density during N2 sleep with worse TMT-A performance at follow-up, these did not persist in adjusted analyses, suggesting these metrics might not be robust markers of cognitive impairment. Along with these unadjusted associations, our supplementary analysis showed that excluding participants who reported using psychoactive medication(s) revealed an association of lower N3 sleep spindle occurrence with worse TMT-A performance at follow-up. Removing these participants may have unmasked the unadjusted association when more people had worse TMT-A performance and fewer spindles.
The adjusted association between higher N3 sleep fast spindle density and worse TMT-B performance at follow-up did not persist after adjustment for baseline TMT-B performance. No other adjusted associations were observed. A prospective study examined the topographical distribution of fast spindle density in healthy controls and patients with mild cognitive impairment and Alzheimer’s disease and identified lower parietal N2 sleep fast spindle density in patients with mild cognitive impairment and Alzheimer’s disease compared to healthy controls.19 Fast spindles are typically studied during N2 sleep, particularly prominent in the centroparietal brain region, and believed to be important for learning and memory.16
The unadjusted associations between lower N2 and N3 slow spindle density at baseline and worse TMT-A performance at follow-up might reflect the assessment of spindles at the frontal (F4-M1) derivation where slow spindle events are mainly detected. Thus, the lack of central and parietal EEG derivations might mean the number of fast spindle events was underestimated. Further studies in community samples assessing sleep spindle events derived from multiple electrode derivations remain warranted to provide more robust evidence of the presence or absence of associations between fast spindle density during N2 and N3 sleep and future cognitive decline.
There may be several reasons for the lack of adjusted associations between baseline sleep microarchitecture and future cognitive function. Participants lost to follow-up were younger, which could have resulted in less cognitive decline over time. Another potential explanation is the influence of uncontrolled factors, including unknown OSA treatment modality (continuous positive airway pressure mandibular advancement splint or pharyngeal surgery and participant adherence) and selection bias (eg, mortality or lack of consent for follow-up assessments). Also, while several cognitive domains were assessed, a comprehensive test battery was not administered. As such, the present study might not have captured the cognitive dimensions most strongly influenced by sleep microarchitecture. Assessing performance across a more comprehensive range of cognitive domains, particularly learning, language, and various memory domains, remains warranted to obtain a complete picture of the possible associations between baseline sleep microarchitecture and future cognitive function and decline.
Our findings could be influenced by men declining to participate in a second sleep study due to sleep disruption. Men vulnerable to sleep loss may have had a different cognitive profile that could not be captured compared to those less vulnerable to sleep loss. If present, this difference in cognitive profile could have influenced the lack of associations observed. Future prospective studies should consider the potential influence of this factor on associations observed or not observed between baseline sleep microarchitecture and future cognitive function.
Given that age is a significant risk factor for cognitive decline,1 future studies in large samples should investigate differences in associations between baseline sleep microarchitecture and future cognitive function and decline in older versus younger participants. Cornelis et al60 recently investigated the impact of age on cognitive decline in participants aged 38–73 years from the UK Biobank (n=between 100,352 and 468,534) and reported a significant decline in cognitive abilities, including prospective memory, reaction time, and fluid intelligence with advancing age, particularly in participants >65 years. Also, our group reported that higher relative NREM sleep theta power and REM sleep theta and alpha power were cross-sectionally associated with worse visual attention and processing speed (TMT-A performance) and executive function (TMT-B performance) in community-dwelling men ≥65 years but not in men <65 years).6 These associations and prior literature reporting significant cognitive decline after age 65 highlight the value of determining if age influences longitudinal associations between baseline sleep microarchitecture and future cognitive function.
This study has several strengths. First, it includes a comparatively younger community-based sample representative of an understudied adult male population. Second, data included cognitive function at baseline and follow-up assessed by standardized and validated tests with well-established performance parameters.3,35,61 Third, extensive survey and biomedical data22,23,25 provided the means to control for multiple relevant potential confounders.
Along with these strengths, several limitations need to be acknowledged. Considerable loss to follow-up could have reduced the power to detect significant associations between sleep qEEG markers and cognitive function and decline. Sleep microarchitecture parameters were acquired using a single frontal EEG derivation (F4–M1). Consequently, potentially significant topographical differences in sleep microarchitecture parameters may have been missed. The sleep sub-study was performed in men, with results in women remaining unknown. Due to the low follow-up study response rate, multivariable models were not adjusted for waist circumference, which is reported to impact cognitive function.62,63 However, in the sample, body mass index and waist circumference were highly correlated (Pearson’s r=0.89).
Although this study adjusted for multiple potential confounders, residual and unknown factors could have influenced the findings. While we conducted supplementary analyses excluding participants who reported using one or more psychoactive medications, this only included 8.9% of the final analytic sample. As such, the potential influence of a wide range of psychoactive medications on the associations between sleep microarchitecture and cognitive function warrants additional investigation. Finally, as a limited number of cognitive tests were completed at baseline and follow-up, it remains unknown whether sleep microarchitecture was associated with future cognitive function and decline in domains that were not assessed, which requires further longitudinal investigation.
Conclusion
In summary, among this sample of community-dwelling men with normal baseline cognitive function, sleep microarchitecture parameters assessed through qEEG power spectral analysis at baseline were not independently associated with cognitive function or decline after 8 years. These findings suggest qEEG has limited prognostic value as an early marker of cognitive decline. If associations exist between baseline sleep microarchitecture and future cognitive function and decline, then further prospective investigation in studies with a longer follow-up to capture greater cognitive decline and more extensive cognitive tests that could be more sensitive to nocturnal hypoxemia or sleep disruption might reveal these associations. Accordingly, further longitudinal qEEG studies in larger samples of community-dwelling men and women with a longer follow-up and more extensive cognitive tests remain warranted. Lastly, individuals at risk of future cognitive dysfunction and decline are not necessarily a heterogeneous population, and future studies of cognitive decline should attempt to delineate specific at-risk phenotypes, including age, sex, and various sleep characteristic and disorder phenotypes.
Acknowledgments
The author thanks Prof Gary Wittert and Dr Sean Martin for granting use of FAMAS data for analysis and their input on the statistical approaches, Dr Yohannes Adama Melaku for guidance with statistical analysis and reporting of results, Dr Angela D’Rozario for providing useful input on descriptions of EEG data processing and spindle detection, Prof Peter Catcheside, Dr Sarah Appleton, and Prof Robert Adams for their contribution to conducting the sleep studies, Dr Bastien Lechat for complimentary work and informed input, Ms Alison Teare for scoring the spindle data, Ms Barbara Toson for her statistical input and assistance with data analysis, and A/Prof Andrew Vakulin for his supervision.
Funding
This study was funded by a National Health and Medical Research Council of Australia Project Grant (627227) 2010-12. Financial support for the conduct of sleep studies (2011) and quantitative EEG analysis was obtained from the ResMed Foundation, California, USA.
Disclosure
A.V and R.J.A have received funding from the National Health and Medical Research Council of Australia (Centre for Research Excellence Grant – 1134954). A.V also reports grants from ResMed and Philips Respironics. R.J.A also reports grants from The Hospital Research Foundation, ResMed Foundation, Philips, Flinders Foundation, and Freemasons Foundation for Men’s Health. G.A.W has received research funding from the ResMed Foundation. P.G.C has research grants from Australian Government National Health and Medical Research and Defence Science and Technology, and equipment support in-kind or at reduced cost for unrelated trials from Air Liquide, Phillips, and Gorman ProMed Pty Ltd. In addition, P.G.C has a patent US-2021/0327584-A1 licensed to Philips. S.L.A reports grants from National Health and Medical Research Council of Australia and The Hospital Research Foundation. The authors report no other conflicts of interest in this work.
References
1. Murman DL. The Impact of Age on Cognition. Semin Hear. 2015;36(3):111–121. doi:10.1055/s-0035-1555115
2. Benjafield AV, Ayas NT, Eastwood PR, et al. Estimation of the global prevalence and burden of obstructive sleep apnoea: a literature-based analysis. Lancet Respir Med. 2019;7(8):687–698. doi:10.1016/S2213-2600(19)30198-5
3. Parker JL, Appleton SL, Melaku YA, et al. Sleep macroarchitecture but not obstructive sleep apnea is independently associated with cognitive function in only older men of a population-based cohort. J Sleep Res. 2021;30:e13370. doi:10.1111/jsr.13370
4. Bucks RS, Olaithe M, Eastwood P. Neurocognitive function in obstructive sleep apnoea: a meta-review. Respirology. 2013;18(1):61–70. doi:10.1111/j.1440-1843.2012.02255.x
5. D’Rozario AL, Cross NE, Vakulin A, et al. Quantitative electroencephalogram measures in adult obstructive sleep apnea - Potential biomarkers of neurobehavioural functioning. Sleep Med Rev. 2017;36:29–42. doi:10.1016/j.smrv.2016.10.003
6. Parker JL, Appleton SL, Melaku YA, et al. The association between sleep microarchitecture and cognitive function in middle-aged and older men: a community-based cohort study. J Clin Sleep Med. 2022;18:1593–1608. doi:10.5664/jcsm.9934
7. D’Rozario AL, Chapman JL, Phillips CL, et al. Objective measurement of sleep in mild cognitive impairment: a systematic review and meta-analysis. Sleep Med Rev. 2020;52:101308. doi:10.1016/j.smrv.2020.101308
8. Luckhaus C, Grass-Kapanke B, Blaeser I, et al. Quantitative EEG in progressing vs stable mild cognitive impairment (MCI): results of a 1-year follow-up study. Int J Geriatr Psychiatry. 2008;23(11):1148–1155. doi:10.1002/gps.2042
9. Jelic V, Johansson SE, Almkvist O, et al. Quantitative electroencephalography in mild cognitive impairment: longitudinal changes and possible prediction of Alzheimer’s disease. Neurobiol Aging. 2000;21(4):533–540. doi:10.1016/s0197-4580(00)00153-6
10. Prichep LS, John ER, Ferris SH, et al. Prediction of longitudinal cognitive decline in normal elderly with subjective complaints using electrophysiological imaging. Neurobiol Aging. 2006;27(3):471–481. doi:10.1016/j.neurobiolaging.2005.07.021
11. Hamilton CA, Schumacher J, Matthews F, et al. Slowing on quantitative EEG is associated with transition to dementia in mild cognitive impairment. Int Psychogeriatr. 2021;33(12):1321–1325. doi:10.1017/S1041610221001083
12. Djonlagic I, Aeschbach D, Harrison SL, et al. Associations between quantitative sleep EEG and subsequent cognitive decline in older women. J Sleep Res. 2019;28(3):e12666. doi:10.1111/jsr.12666
13. Martin N, Lafortune M, Godbout J, et al. Topography of age-related changes in sleep spindles. Neurobiol Aging. 2013;34(2):468–476. doi:10.1016/j.neurobiolaging.2012.05.020
14. Crowley K, Trinder J, Kim Y, Carrington M, Colrain IM. The effects of normal aging on sleep spindle and K-complex production. Clin Neurophysiol. 2002;113(10):1615–1622. doi:10.1016/s1388-2457(02)00237-7
15. Taillard J, Sagaspe P, Berthomier C, et al. Non-REM sleep characteristics predict early cognitive impairment in an aging population. Front Neurol. 2019;10:197. doi:10.3389/fneur.2019.00197
16. Fernandez LMJ, Luthi A. Sleep spindles: mechanisms and functions. Physiol Rev. 2020;100(2):805–868. doi:10.1152/physrev.00042.2018
17. Purcell SM, Manoach DS, Demanuele C, et al. Characterizing sleep spindles in 11,630 individuals from the national sleep research resource. Nat Commun. 2017;8:15930. doi:10.1038/ncomms15930
18. Lloret MA, Cervera-Ferri A, Nepomuceno M, Monllor P, Esteve D, Lloret A. Is sleep disruption a cause or consequence of Alzheimer. s disease? Reviewing its possible role as a biomarker. Int J Mol Sci. 2020;21(3):
19. Gorgoni M, Lauri G, Truglia I, et al. Parietal fast sleep spindle density decrease in Alzheimer’s disease and amnesic mild cognitive impairment. Neural Plast. 2016;2016:8376108. doi:10.1155/2016/8376108
20. Legdeur N, Heymans MW, Comijs HC, Huisman M, Maier AB, Visser PJ. Age dependency of risk factors for cognitive decline. BMC Geriatr. 2018;18(1):187. doi:10.1186/s12877-018-0876-2
21. Knopman D, Boland LL, Mosley T, et al. Cardiovascular risk factors and cognitive decline in middle-aged adults. Neurology. 2001;56(1):42–48. doi:10.1212/wnl.56.1.42
22. Martin S, Haren M, Taylor A, Middleton S, Wittert G. Cohort profile: the Florey Adelaide Male Ageing Study (FAMAS). Int J Epidemiol. 2007;36(2):302–306. doi:10.1093/ije/dyl279
23. Martin SA, Haren MT, Middleton SM, Wittert GA. Members of the Florey Adelaide male Ageing S. The Florey Adelaide Male Ageing Study (FAMAS): design, procedures & participants. BMC Public Health. 2007;7:126. doi:10.1186/1471-2458-7-126
24. Adams R, Appleton S, Taylor A, McEvoy D, Wittert G. Are the ICSD-3 criteria for sleep apnoea syndrome too inclusive? Lancet Respir Med. 2016;4(5):e19–20. doi:10.1016/S2213-2600(16)00109-0
25. Grant JF, Martin SA, Taylor AW, et al. Cohort profile: the men androgen inflammation lifestyle environment and stress (MAILES) study. Int J Epidemiol. 2014;43(4):1040–1053. doi:10.1093/ije/dyt064
26. Parker JL, Melaku YA, D. Rozario AL, et al. The association between obstructive sleep apnea and sleep spindles in middle-aged and older men: a community-based cohort study. Sleep. 2021;30. doi:10.1093/sleep/zsab282
27. Ruehland WR, Rochford PD, O. Donoghue FJ, Pierce RJ, Singh P, Thornton AT. The new AASM criteria for scoring hypopneas: impact on the apnea hypopnea index. Sleep. 2009;32(2):150–157. doi:10.1093/sleep/32.2.150
28. ASTA/ASA. Commentary on AASM manual for the scoring of sleep and associated events; 2010. Available from: http://www.sleep.org.au/information/sleep-documents/astaasa-commentary-on-aasm-manual-for-scoring-of-sleep-associated-events-december-2010.
29. D. Rozario AL, Dungan GC 2nd, Banks S, et al. An automated algorithm to identify and reject artefacts for quantitative EEG analysis during sleep in patients with sleep-disordered breathing. Sleep Breath. 2015;19(2):607–615. doi:10.1007/s11325-014-1056-z
30. Vakulin A, D. Rozario A, Kim JW, et al. Quantitative sleep EEG and polysomnographic predictors of driving simulator performance in obstructive sleep apnea. Clin Neurophysiol. 2016;127(2):1428–1435. doi:10.1016/j.clinph.2015.09.004
31. Lam A, Haroutonian C, Grummitt L, et al. Sleep-dependent memory in older people with and without MCI: the relevance of sleep microarchitecture, OSA, hippocampal subfields, and episodic memory. Cereb Cortex. 2021;31(6):2993–3005. doi:10.1093/cercor/bhaa406
32. D. Rozario AL, Hoyos CM, Wong KKH, et al. Improvements in cognitive function and quantitative sleep electroencephalogram in obstructive sleep apnea after six months of continuous positive airway pressure treatment. Sleep. 2022;45(6). doi:10.1093/sleep/zsac013
33. Salthouse TA, Toth J, Daniels K, et al. Effects of aging on efficiency of task switching in a variant of the trail making test. Neuropsychology. 2000;14(1):102–111. doi:10.1037/0894-4105.14.1.102
34. Salthouse TA. What cognitive abilities are involved in trail-making performance? Intelligence. 2011;39(4):222–232. doi:10.1016/j.intell.2011.03.001
35. Tombaugh TN. Trail Making Test A and B: normative data stratified by age and education. Arch Clin Neuropsychol. 2004;19(2):203–214. doi:10.1016/S0887-6177(03)00039-8
36. Mitchell AJ. A meta-analysis of the accuracy of the mini-mental state examination in the detection of dementia and mild cognitive impairment. J Psychiatr Res. 2009;43(4):411–431. doi:10.1016/j.jpsychires.2008.04.014
37. Arevalo-Rodriguez I, Smailagic N, Roque-Figuls M, et al. Mini-Mental State Examination (MMSE) for the early detection of dementia in people with mild cognitive impairment (MCI). Cochrane Database Syst Rev. 2021;7:CD010783. doi:10.1002/14651858.CD010783.pub3
38. Trzepacz PT, Hochstetler H, Wang S, Walker B, Saykin AJ. Alzheimer’s Disease Neuroimaging I. Relationship between the Montreal cognitive assessment and mini-mental state examination for assessment of mild cognitive impairment in older adults. BMC Geriatr. 2015;15:107. doi:10.1186/s12877-015-0103-3
39. Statistics ABo. 2033.0.55.001- Census of Population and Housing. Australia: Socio-Economic Indexes for Areas (SEIFA); 2016. Available from: http://www.abs.gov.au/ausstats/[email protected]/Lookup/by%20Subject/2033.0.55.001~2016~Main%20Features~IRSD~19.
40. Lang CJ, Appleton SL, Vakulin A, et al. Co-morbid OSA and insomnia increases depression prevalence and severity in men. Respirology. 2017;22(7):1407–1415. doi:10.1111/resp.13064
41. Chobanian AV, Bakris GL, Black HR, et al. The seventh report of the joint national committee on prevention, detection, evaluation, and treatment of high blood pressure: the JNC 7 report. JAMA. 2003;289(19):2560–2572. doi:10.1001/jama.289.19.2560
42. Nuttall FQ. Body mass index: obesity, BMI, and health: a critical review. Nutr Today. 2015;50(3):117–128. doi:10.1097/NT.0000000000000092
43. Saint Martin M, Sforza E, Thomas-Anterion C, Barthélémy JC, Roche F, Group PS. Baroreflex sensitivity, vascular risk factors, and cognitive function in a healthy elderly population: the PROOF cohort. J Am Geriatr Soc. 2013;61(12):2096–2102. doi:10.1111/jgs.12548
44. Martin MS, Sforza E, Roche F, Barthelemy JC, Thomas-Anterion C; Group Ps. Sleep breathing disorders and cognitive function in the elderly: an 8-year follow-up study. the proof-synapse cohort. Sleep. 2015;38(2):179–187. doi:10.5665/sleep.4392
45. Ramos AR, Tarraf W, Wu B, et al. Sleep and neurocognitive decline in the Hispanic community health study/study of latinos. Alzheimers Dement. 2020;16(2):305–315. doi:10.1016/j.jalz.2019.08.191
46. Reijmer YD, van den Berg E, Dekker JM, et al. The metabolic syndrome, atherosclerosis and cognitive functioning in a non-demented population: the Hoorn Study. Atherosclerosis. 2011;219(2):839–845. doi:10.1016/j.atherosclerosis.2011.08.032
47. Bursac Z, Gauss CH, Williams DK, Hosmer DW. Purposeful selection of variables in logistic regression. Source Code Biol Med. 2008;3:17. doi:10.1186/1751-0473-3-17
48. Okamoto S. Socioeconomic factors and the risk of cognitive decline among the elderly population in Japan. Int J Geriatr Psychiatry. 2019;34(2):265–271. doi:10.1002/gps.5015
49. Dye L, Boyle NB, Champ C, Lawton C. The relationship between obesity and cognitive health and decline. Proc Nutr Soc. 2017;76(4):443–454. doi:10.1017/S0029665117002014
50. Althouse AD. Adjust for multiple comparisons? It’s not that simple. Ann Thorac Surg. 2016;101(5):1644–1645. doi:10.1016/j.athoracsur.2015.11.024
51. Rothman KJ. No adjustments are needed for multiple comparisons. Epidemiology. 1990;1(1):43–46. doi:10.1097/00001648-199001000-00010
52. Westerberg CE, Mander BA, Florczak SM, et al. Concurrent impairments in sleep and memory in amnestic mild cognitive impairment. J Int Neuropsychol Soc. 2012;18(3):490–500. doi:10.1017/S135561771200001X
53. Brayet P, Petit D, Frauscher B, et al. Quantitative EEG of rapid-eye-movement sleep: a marker of amnestic mild cognitive impairment. Clin EEG Neurosci. 2016;47(2):134–141. doi:10.1177/1550059415603050
54. Djonlagic I, Mariani S, Fitzpatrick AL, et al. Macro and micro sleep architecture and cognitive performance in older adults. Nat Hum Behav. 2021;5(1):123–145. doi:10.1038/s41562-020-00964-y
55. Raicher I, Takahashi DY, Kanda PAM, Nitrini R, Anghinah R. qEEG spectral peak in Alzheimer. s disease: a possible tool for treatment follow-up. Dement Neuropsychol. 2008;2(1):9–12. doi:10.1590/S1980-57642009DN20100003
56. Carrier J, Land S, Buysse DJ, Kupfer DJ, Monk TH. The effects of age and gender on sleep EEG power spectral density in the middle years of life (ages 20–60 years old). Psychophysiology. 2001;38(2):232–242. doi:10.1111/1469-8986.3820232
57. Petit D, Gagnon JF, Fantini ML, Ferini-Strambi L, Montplaisir J. Sleep and quantitative EEG in neurodegenerative disorders. J Psychosom Res. 2004;56(5):487–496. doi:10.1016/j.jpsychores.2004.02.001
58. Landolt HP, Dijk DJ, Achermann P, Borbely AA. Effect of age on the sleep EEG: slow-wave activity and spindle frequency activity in young and middle-aged men. Brain Res. 1996;738(2):205–212. doi:10.1016/s0006-8993(96)00770-6
59. Munch M, Silva EJ, Ronda JM, Czeisler CA, Duffy JF. EEG sleep spectra in older adults across all circadian phases during NREM sleep. Sleep. 2010;33(3):389–401. doi:10.1093/sleep/33.3.389
60. Cornelis MC, Wang Y, Holland T, Agarwal P, Weintraub S, Morris MC. Age and cognitive decline in the UK Biobank. PLoS One. 2019;14(3):e0213948. doi:10.1371/journal.pone.0213948
61. Eisma YB, de Winter J. How do people perform an inspection time task? An examination of visual illusions, task experience, and blinking. J Cogn. 2020;3(1):34. doi:10.5334/joc.123
62. Waki T, Tanaka-Mizuno S, Takashima N, et al. Waist circumference and domain-specific cognitive function among non-demented Japanese older adults stratified by sex: results from the Takashima cognition study. J Alzheimers Dis. 2020;73(3):887–896. doi:10.3233/JAD-190395
63. Smith E, Bailey PE, Crawford J, et al. Adiposity estimated using dual energy X-ray absorptiometry and body mass index and its association with cognition in elderly adults. J Am Geriatr Soc. 2014;62(12):2311–2318. doi:10.1111/jgs.13157
 © 2023 The Author(s). This work is published and licensed by Dove Medical Press Limited. The
full terms of this license are available at https://www.dovepress.com/terms
and incorporate the Creative Commons Attribution
- Non Commercial (unported, 3.0) License.
By accessing the work you hereby accept the Terms. Non-commercial uses of the work are permitted
without any further permission from Dove Medical Press Limited, provided the work is properly
attributed. For permission for commercial use of this work, please see paragraphs 4.2 and 5 of our Terms.
© 2023 The Author(s). This work is published and licensed by Dove Medical Press Limited. The
full terms of this license are available at https://www.dovepress.com/terms
and incorporate the Creative Commons Attribution
- Non Commercial (unported, 3.0) License.
By accessing the work you hereby accept the Terms. Non-commercial uses of the work are permitted
without any further permission from Dove Medical Press Limited, provided the work is properly
attributed. For permission for commercial use of this work, please see paragraphs 4.2 and 5 of our Terms.