Back to Journals » Eye and Brain » Volume 15
Associations Between Thinner Retinal Neuronal Layers and Suboptimal Brain Structural Integrity in a Middle-Aged Cohort
Authors Barrett-Young A ![]() , Abraham WC, Cheung CY, Gale J, Hogan S, Ireland D, Keenan R, Knodt AR, Melzer TR
, Abraham WC, Cheung CY, Gale J, Hogan S, Ireland D, Keenan R, Knodt AR, Melzer TR ![]() , Moffitt TE, Ramrakha S, Tham YC, Wilson GA, Wong TY, Hariri AR, Poulton R
, Moffitt TE, Ramrakha S, Tham YC, Wilson GA, Wong TY, Hariri AR, Poulton R
Received 12 January 2023
Accepted for publication 28 February 2023
Published 11 March 2023 Volume 2023:15 Pages 25—35
DOI https://doi.org/10.2147/EB.S402510
Checked for plagiarism Yes
Review by Single anonymous peer review
Peer reviewer comments 2
Editor who approved publication: Professor Margaret Wong-Riley
Ashleigh Barrett-Young,1 Wickliffe C Abraham,1 Carol Y Cheung,2 Jesse Gale,3 Sean Hogan,1 David Ireland,1 Ross Keenan,4– 6 Annchen R Knodt,7 Tracy R Melzer,6,8,9 Terrie E Moffitt,7,10 Sandhya Ramrakha,1 Yih Chung Tham,11,12 Graham A Wilson,13 Tien Yin Wong,12,14 Ahmad R Hariri,7 Richie Poulton1
1Department of Psychology, University of Otago, Dunedin, New Zealand; 2Department of Ophthalmology and Visual Sciences, Faculty of Medicine, the Chinese University of Hong Kong, Hong Kong; 3Department of Surgery & Anaesthesia, University of Otago, Wellington, New Zealand; 4Department of Radiology, Christchurch Hospital, Christchurch, New Zealand; 5Pacific Radiology Group, Christchurch, New Zealand; 6New Zealand Brain Research Institute, Christchurch, New Zealand; 7Department of Psychology and Neuroscience, Duke University, Durham, NC, USA; 8Department of Medicine, University of Otago, Christchurch, New Zealand; 9School of Psychology, Speech and Hearing, University of Canterbury, Christchurch, New Zealand; 10Social, Genetic and Developmental Psychiatry Centre, Institute of Psychiatry, Psychology and Neuroscience, King’s College London, London, UK; 11Singapore Eye Research Institute, Singapore National Eye Centre, Duke-NUS Medical School, Singapore; 12Department of Ophthalmology, Yong Loo Lin School of Medicine, National University of Singapore, Singapore; 13Department of Medicine, University of Otago, Dunedin, New Zealand; 14Tsinghua Medicine, Tsinghua University, Beijing, People’s Republic of China
Correspondence: Ashleigh Barrett-Young, Department of Psychology, University of Otago, PO Box 56, Dunedin, 9054, New Zealand, Email [email protected]
Purpose: The retina has potential as a biomarker of brain health and Alzheimer’s disease (AD) because it is the only part of the central nervous system which can be easily imaged and has advantages over brain imaging technologies. Few studies have compared retinal and brain measurements in a middle-aged sample. The objective of our study was to investigate whether retinal neuronal measurements were associated with structural brain measurements in a middle-aged population-based cohort.
Participants and Methods: Participants were members of the Dunedin Multidisciplinary Health and Development Study (n=1037; a longitudinal cohort followed from birth and at ages 3, 5, 7, 9, 11, 13, 15, 18, 21, 26, 32, 38, and most recently at age 45, when 94% of the living Study members participated). Retinal nerve fibre layer (RNFL) and ganglion cell-inner plexiform layer (GC-IPL) thickness were measured by optical coherence tomography (OCT). Brain age gap estimate (brainAGE), cortical surface area, cortical thickness, subcortical grey matter volumes, white matter hyperintensities, were measured by magnetic resonance imaging (MRI).
Results: Participants with both MRI and OCT data were included in the analysis (RNFL n=828, female n=413 [49.9%], male n=415 [50.1%]; GC-IPL n=825, female n=413 [50.1%], male n=412 [49.9%]). Thinner retinal neuronal layers were associated with older brain age, smaller cortical surface area, thinner average cortex, smaller subcortical grey matter volumes, and increased volume of white matter hyperintensities.
Conclusion: These findings provide evidence that the retinal neuronal layers reflect differences in midlife structural brain integrity consistent with increased risk for later AD, supporting the proposition that the retina may be an early biomarker of brain health.
Keywords: optical coherence tomography, retina, Alzheimer’s, magnetic resonance imaging, brain aging
Introduction
The retina has potential as a biomarker of brain health and cognitive functioning as well as age-related neurodegenerative diseases, including Alzheimer’s disease (AD). This is because the retina shares many similarities with the brain, such as shared embryological development and similarities between the retinal ganglion cells and other central nervous system neurons; it also has a particular advantage in that it can be easily, repeatedly, and non-invasively imaged with high precision using technology which is already widely available.1–4 Diffuse cortical atrophy occurs in normal ageing but is more pronounced in AD, beginning in the medial temporal lobes in preclinical AD and gradually progressing throughout the brain.5–7 The neuropathological changes of AD begin more than a decade prior to the onset of clinical symptoms,8 and existing treatments for AD may be most effective in the earliest stages of the disease.9 Thus, biomarkers that can identify people with preclinical AD or at high risk of developing AD, and that are able to be widely implemented for population screening, are imperative to initiating treatments at the optimal stage.
The retinal ganglion cells send axons across the retinal surface to form the optic nerve, which projects posteriorly to targets in the brain.1,10 Normal ageing is associated with gradual optic nerve thinning; in AD more profound loss of optic nerve axons occurs in a diffuse and non-specific pattern,11 which can be detected in early stages as thinning of the retinal nerve fibre layer (RNFL) and ganglion cell-inner plexiform layer (GC-IPL).12–14 The retina may be an early site for amyloid formation;15,16 subclinical retinal measures of optic nerve thinning may occur in preclinical AD and have been associated with amyloid burden,17–19 genetic risk for AD,18 and cognitive performance.17,20 This suggests that the retina may be a site where the early pathological processes of AD can be observed.
A small number of studies have found associations between structural brain measurements with retinal measurements although these studies, with the exception of the UK Biobank,21 have tended to involve older participants (≥65 years) or patients with diagnosed AD.22–31 The UK Biobank study included participants aged 40–69 years old (M=55) and global MRI measures, plus hippocampal volume, were used; the participants in our study were all aged 45 and MRI measures were taken from ten subcortical regions of interest as well as parcellations for analysis of sub-regional volume and surface area.
However, the maximum clinical utility of retinal imaging in AD is in the pre-diagnosis stages, before daily living is affected and irreversible neurological damage has occurred. Retinal imaging, being widely available even in primary care settings as well as being repeatable and non-invasive, offers an attractive screening option for preclinical AD. Therefore, the question of interest is whether thinning of the retinal neuronal layers is associated with risk-related alterations in structural brain integrity in the decades before an AD diagnosis.
Recent studies have investigated these associations in cognitively unimpaired individuals, finding associations between retinal layers including the RNFL and GC-IPL and a number of structural brain measures, most commonly hippocampal volume,21,32,33 but also the lingual gyrus33 and grey and white matter volumes.21 A recent study found correlations between RNFL, GC-IPL, and other retinal thickness measures with a large number of cortical thicknesses and volumes, in participants both with and without increased familial and genetic risk for AD.34 While most previous studies focus on elderly individuals, the current study contributes to the growing literature on this topic by examining a population-based sample of same-aged adults in midlife (aged 45 years at assessment), thus allowing us to examine the natural variations in the population without the effects of age. Our study design enables a unique opportunity to investigate early detectable changes in age-related neurological diseases in a sample currently free of AD diagnoses.
We hypothesised that thinner RNFL and GC-IPL measured by optical coherence tomography (OCT) would be associated with diminished structural brain integrity in midlife as reflected by thinner average cortex, smaller cortical surface area, smaller subcortical grey matter volumes and older looking brains as estimated using a machine learning-based estimate of chronological age based on MRI-derived measures.35 We also hypothesised that thinner RNFL and GC-IPL would be associated with a higher volume of white matter hyperintensities, a commonly-used clinical marker of AD risk.
Method
Participants
Participants were members of the Dunedin Multidisciplinary Health and Development Study, a representative birth cohort (n=1037; 91% of eligible births, 51.6% male) born between 1 April 1972 and 31 March 1973 in Aotearoa New Zealand. The cohort represents the full range of socioeconomic status in the general population of New Zealand and is predominantly New Zealand European (Pākehā; 93%). The study design and participant characteristics have been described extensively elsewhere.36,37 Assessments have been carried out since birth with data used in the present study collected at age 45 (2017–2019), when 94% of the 997 living Study members participated. The Dunedin Study was approved by the Health and Disability Ethics Committee, Ministry of Health, New Zealand. Study members gave informed consent before participating. This study complies with the Declaration of Helsinki.
Optical Coherence Tomography (OCT)
OCT measurements were taken at age 45, between April 2017 and April 2019. OCT scans were performed in the morning by trained technicians using a spectral domain OCT machine (Cirrus HD-OCT, model 5000; Carl Zeiss Meditec). Mean peripapillary retinal nerve fibre layer (RNFL) and mean macular ganglion cell-inner plexiform layer (GC-IPL) thickness were calculated using the software on the device (Figure 1). RNFL thicknesses were generated on a 3.5mm circle from the optic disc; GC-IPL was calculated on a ellipsis formed around the macula. Trained graders checked all scans for quality. Scans were removed from the final dataset due to insufficient OCT image quality (eg signal strength below 6, scan not correctly positioned, or image artefacts). Seven Study members were removed due to diseases affecting the retina (multiple sclerosis, retinitis pigmentosa, brain tumours, diabetic laser pan-retinal photocoagulation, and an anomalous optic nerve head). Another seven Study members were assessed by two ophthalmologists as having glaucoma;38 glaucomatous eyes were removed from the dataset and non-glaucomatous eyes were retained. When data from one eye were available, that eye was used; when both eyes were available, an average of the measurements from both eyes was used. Axial length was used as a covariate as it influences RNFL and GC-IPL thickness measurements.39 Axial length was measured using Zeiss IOL Master (Germany). The machine was calibrated weekly, with room lighting set at 520 lux and no pupil dilation. Mean axial length was calculated from both eyes.
 |
Figure 1 Retinal measurements of optic nerve structure. (A) Fundus photograph of a normal eye showing the areas scanned. (B) Ganglion cell-inner plexiform layer (GC-IPL) map showing a normal pattern. The GC-IPL thickness used for analysis was the average across the donut shaped area between the two ovals. (C) OCT cross-section through the fovea (indicated on main photo by dotted line), with automated segmentation lines showing the GC-IPL layer thickness measurement (indicated by the white line). (D) The retinal nerve fibre layer (RNFL) map shows thickest part of the nerve fibre layer close to the optic disc and at the superior and inferior Poles. The thickness is calculated on a circle of 3.5mm diameter (indicated by red line, and on main photo by dotted line). (E) The retinal cross section on the 3.5mm circle, showing automated segmentation and the RNFL thickness measurement (indicated by white line). The RNFL thickness used for analysis was the average thickness around the 3.5mm circle. |
Magnetic Resonance Imaging (MRI)
Briefly, Study members were scanned using a MAGNETOM Skyra 3T scanner (Siemens Healthcare, Erlangen, Germany) equipped with a 64-channel head and neck coil between August 2016 and April 2019. Measurements derived from MRI were brain age gap estimate (brainAGE; a score that represents the difference between a person’s chronological age and their estimated age based on multiple measures of brain structure);35 white matter hyperintensities (WMH); grey matter volumes (GMV) of 10 subcortical structures; and cortical surface areas and thicknesses for 360 cortical areas (see Supplementary Materials for details on image acquisition and processing).
Data Analysis
Analyses were conducted in Stata/SE 17.0 between February and July 2022. First, linear regression models were constructed where each retinal variable was entered as a predictor of brainAGE; next, mean RNFL and mean GC-IPL were used to predict global structural measures. WMH volume was log transformed as the data were non-normal; all other variables met criteria for parametric testing without adjustment. Next, we used mean RNFL and mean GC-IPL to predict the GMV of 10 subcortical structures. Finally, to explore the distribution patterns of associations, parcel-wise analyses were conducted when statistically significant associations were observed with global cortical surface area and average cortical thickness. In these post-hoc analyses, we ran linear regressions using mean RNFL and mean GC-IPL to predict the surface area and cortical thickness each of the 360 regions comprising the parcellation scheme described above.40 As mean RNFL was not significantly associated with average cortical thickness, parcel-wise analysis with mean RNFL was only conducted with surface area. We corrected for multiple comparisons across the subcortical and parcel-wise analyses performed using a false discovery rate (FDR) procedure;41 for analyses with global variables we used an alpha level of 0.05. All tests were two-sided. Sex and axial length were included as covariates in all analyses. Analyses with regional subcortical structures were repeated controlling for total brain volume, which tests relative size of a region rather than absolute size.42 The premise and analysis plan for this study was preregistered in December 2021 (https://dunedinstudy.otago.ac.nz/files/1639953449_Barrett-Young_CP_OCT%20and%20MRI_revised_final.pdf). Analyses were checked for reproducibility by an independent data analyst, who recreated the code by working from the manuscript and applying it to a fresh dataset.
Results
Data collection of retinal and MRI data was at 45 years, between August 2016 and April 2019. The median number of days between OCT and MRI data collection for each participant was 77.5 days. The final dataset included Study members with both RNFL and MRI data available (n=828, female n=413 [49.9%], male n=415 [50.1%]) for analyses using RNFL variables, and Study members with both GC-IPL and MRI data available (n=825, female n=413 [50.1%], male n=412 [49.9%]) for analyses using GC-IPL variables (Table 1).
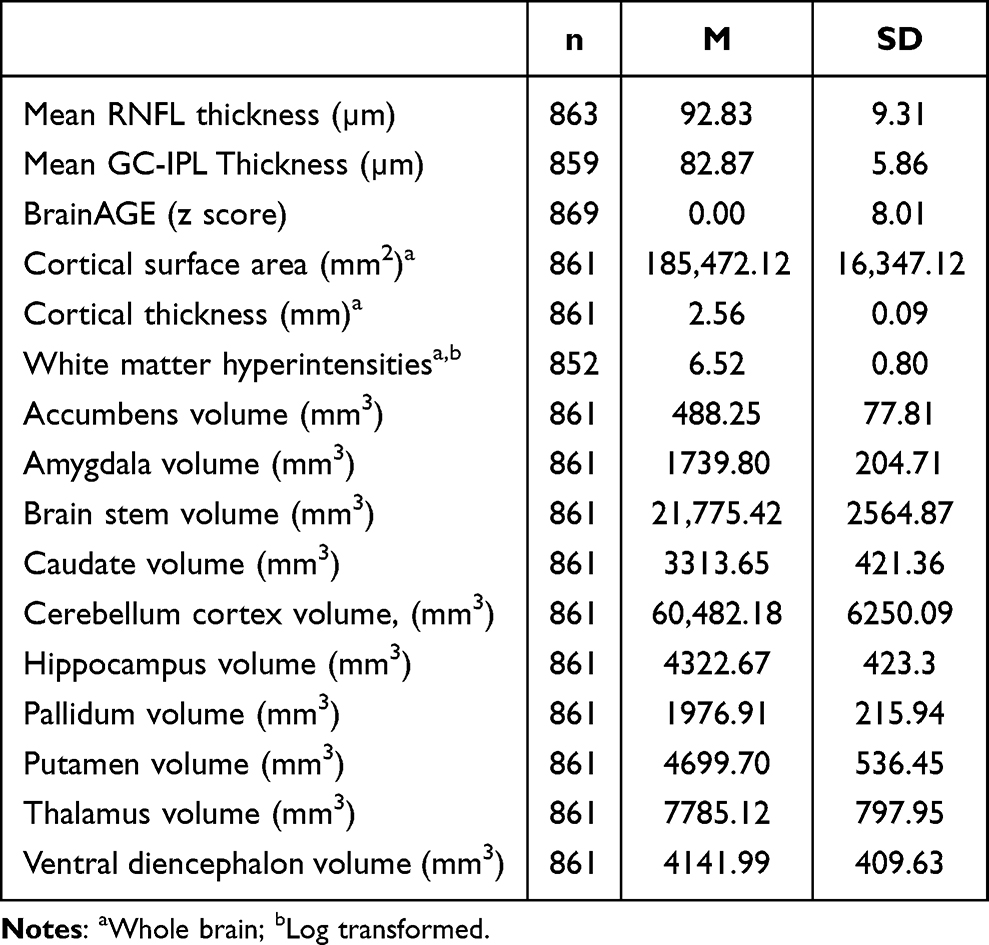 |
Table 1 Descriptive Statistics |
Retinal Predictors of Brain Age and Cortical Brain Structure
Study members with thinner mean RNFL (β=−.119, p<0.001) and thinner mean GC-IPL (β=−.111, p=0.001) had larger brainAGE35 after adjustment for sex and axial length, indicating an older looking brain (Figure 2). Study members with thinner mean RNFL (β=0.140, p<0.001) and thinner mean GC-IPL (β=0.095, p<0.001) had smaller total cortical surface area. Study members with thinner mean GC-IPL (β=0.072, p=0.043) but not mean RNFL (β=0.036, p=0.328) had thinner average cortex. Study members with thinner mean GC-IPL (β=−.071, p=0.045) but not mean RNFL (β=−.068, p=0.061) had greater WMH volume.
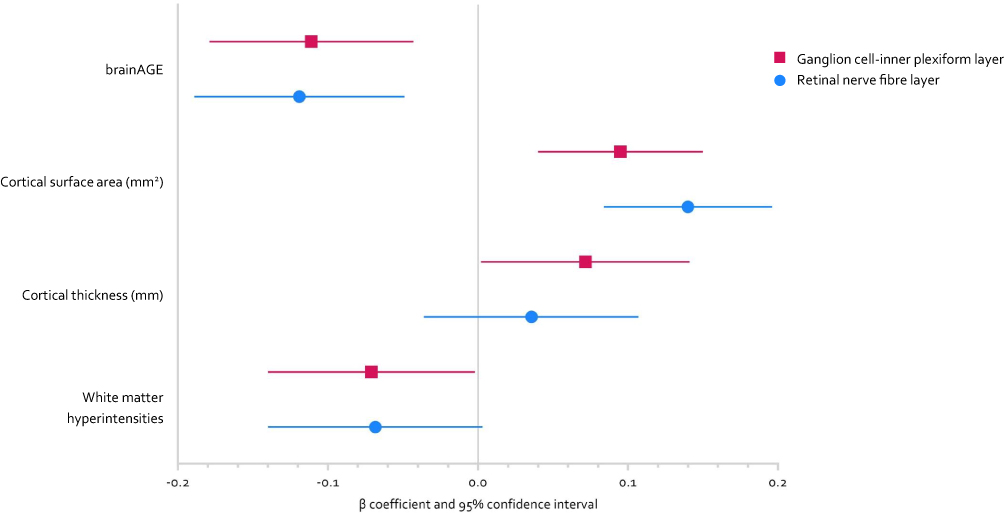 |
Figure 2 Forest plot showing standardised effect sizes (beta coefficients with 95% confidence intervals) for the associations between retinal nerve fibre layer (RNFL; blue circles) and ganglion cell-inner plexiform layer (GCL; pink squares) and whole brain variables. All models were adjusted for sex and axial length. Number of observations for each analysis differs due to differing quality control criteria (brainAGE and RNFL n=828; cortical SA/CT and RNFL n=821; WMH and RNFL n=814; brainAGE and GC-IPL n=825; cortical SA/CT and GC-IPL n=818; WMH and GC-IPL n=812). |
Retinal Predictors of Subcortical Grey Matter Volume (GMV)
Study members with thinner mean RNFL and mean GC-IPL had smaller GMV of all ten subcortical structures after false discovery rate correction, indicating that retinal thinning corresponds to non-localised, rather than specific regional, subcortical GMV loss (Figure 3). Adding total brain volume as a covariate attenuated the associations between some subcortical GMVs and RNFL and GC-IPL, but associations remained significant between both retinal variables and GMV of brain stem, cerebellum, hippocampus, pallidum, and ventral diencephalon; as well as between RNFL and GMV of the putamen and thalamus (Figure 3).
 |
Figure 3 Forest plot showing standardised effect sizes (beta coefficients with 95% confidence intervals) for the associations between retinal nerve fibre layer (RNFL; blue circles) and ganglion cell-inner plexiform layer (GC-IPL; pink squares) and grey matter volume of ten subcortical regions. Closed shapes indicate model was adjusted for sex and axial length; open shapes indicate model was adjusted for total brain volume as well as sex and axial length. A false discovery rate procedure was used to correct for multiple comparisons. Number of observations for analyses with RNFL n=821; GC-IPL n=818. |
Exploratory Parcel-Wise Analysis
Based on significant associations observed between RNFL and GC-IPL and total cortical surface area, and GC-IPL and average cortical thickness, exploratory parcel-wise analyses were conducted to determine whether the associations were largely distributed or localised (Figure 4). Study members with thinner RNFL had lower surface area in 274 of 360 parcels after FDR correction, which were widely distributed across the cortex. Study members with thinner GC-IPL had lower surface area in 112 parcels, again widely distributed across the cortex. Study members with thinner GC-IPL had thinner cortex in 5 parcels, which tended to be localised to the occipital and temporal lobes but were not widely distributed across these lobes.
 |
Figure 4 Associations between retinal thickness and parcel-wise measures of cortical surface area and thickness. (A) Retinal nerve fibre layer thickness and cortical surface area (n=821); (B) Ganglion cell-inner plexiform layer thickness and cortical surface area (n=818); (C) Ganglion cell-inner plexiform layer thickness and cortical thickness (n=818). All models were adjusted for sex and axial length. Coloured parcels represent standardised coefficients with p<0.05 after false discovery rate correction. |
Discussion
We found that thinner retinal neuronal layers measured by OCT were associated with suboptimal MRI-measured brain structure and integrity in a sample of largely healthy community-based middle-aged people. Specifically, thinner RNFL and GC-IPL were associated with diminished structural brain integrity in midlife, as well as lower total cortical surface area and lower subcortical GMV and older looking brains. Study members with thinner GC-IPL, but not RNFL, also had thinner average cortex and greater white matter hyperintensities volume. Exploratory analyses of parcel-wise surface area and thickness revealed that associations with RNFL and GC-IPL were widely distributed across the cortex, rather than regionally-specific. These findings provide evidence that the retinal neuronal layers reflect alterations found in midlife structural brain integrity associated with later risk for AD, supporting the proposition that the retina may be a useful biomarker for brain health as early as midlife, and that non-invasive retinal imaging using OCT may potentially be useful to detect early preclinical disease.
One of the largest studies to investigate whether retinal neuronal measurements are associated with brain measurements in AD, the Singapore Epidemiology of Eye Diseases Study, found that thinner GC-IPL was associated with reduced total brain volume and GMV in two out of five lobes, but thinner RNFL was associated with GMV in the temporal lobe only.25 This aligns with our findings, where GC-IPL was associated with more MRI measurements than RNFL, although different regions were evaluated in each study. Another study found that RNFL and GC-IPL thickness were associated with grey and white matter measurements in the visual pathway, but not globally.43 This is somewhat contradictory to our findings, which suggest a more global association pattern, but when cortical thickness was examined at the parcel level, the largest associations with GC-IPL thickness tended to be in the occipital and temporal lobe, including the visual cortex. A recent study from the UK Biobank suggests that retinal measures are associated with smaller cortical and hippocampal volume in a large middle-aged volunteer sample.21 However, this sample is biased in favour of higher education, socioeconomic status, and lower levels of adversity; our findings thus add to those of the UK Biobank by examining a more widely-representative, population-based sample.44
Retinal imaging technologies have potential as a biomarker and predictive tool in preclinical AD, particularly with the development of artificial intelligence approaches.45 There has been rapid development of hardware (eg, cheaper, higher resolution, and faster scanning speed OCT devices) and software (eg artificial intelligence algorithms), for retinal imaging. Recent advances have included reliable diagnosis of optic disease and risk stratification of morbidity and mortality using artificial intelligence and deep learning.46,47 However, retinal thinning is not specific for AD and may occur in ageing and in other neurodegenerative diseases. The retina is likely to contain more numerous and specific biomarkers of ageing and AD, such as vascular abnormalities, angiography, and thinning of other retinal layers that can be captured with emerging technologies such as hyperspectral or amyloid imaging of the retina. Combining these retinal biomarkers and other risk factors to predict risk could leverage an artificial intelligence approach to integrate and differentiate these risk factors for accelerated ageing and AD.45
It is notable that between-subjects differences in both brain and retinal health were evident in this sample of middle-aged participants who were all the same chronological age. This suggests that anatomical changes typical of age-related diseases are detectable in midlife, decades before any expected symptom onset or diagnosis. Structural brain alterations, including WMH and older looking brains, have been associated with cognitive decline from childhood to age 45 in the current sample,48,49 as has retinal thinning,20 suggesting that neuropathological processes are associated with subclinical cognitive decline decades before AD diagnosis. Accelerated thinning of the optic nerve in preclinical AD could be anterograde, from retinal ganglion cell pathology in the inner retina (where the vascular tree is sparse with low oxygen tensions50 and amyloid deposits have been found15), or retrograde, from loss of destination cells in the thalamus and other brain targets of the optic nerve. Our study did not detect a close association between thalamus volume and retinal measures.
We found that the pattern of subcortical associations was widely distributed. This is notable because it could be hypothesised that retinal neuronal degeneration would be primarily reflective of neurodegeneration in the areas which are most closely connected to the retinal ganglion cells, ie, lateral geniculate nucleus or occipital cortex. Alternatively, it could be hypothesised that regions known to atrophy in AD may be preferentially targeted by the same neuropathology as that affecting the retina, eg, the hippocampus. Such specific hypotheses would, however, result in missing any broader patterns of associations. Although these specific areas were associated with lower retinal thickness, our findings suggest that links between the retina and the brain in midlife are not restricted to particular regions, but that retinal neuronal measurements from OCT are instead reflective of overall brain integrity. In addition, we found evidence of targeted associations in the hippocampus, cerebellum, and ventral diencephalon that were independent of globally smaller total brain volume. Future studies should thus consider whether global or regional effects are driving any associations with retinal thickness, including whether global or region-specific effects discriminate between neurodegenerative disorders.
Limitations of this study are that the analyses conducted were cross-sectional, as MRI and OCT were conducted during the age 45 assessment. It is likely longitudinal studies with repeated OCT and MRI measures are required to determine the nature of this association, and we plan to repeat these measures in the coming years to investigate changes as the participants age. Furthermore, the sample is predominantly New Zealand European, so whether these findings generalise to people of non-white ethnicities is unknown. We were unable to confirm a diagnosis of preclinical AD in this cohort through established biomarkers, such as amyloid beta (Aβ40, Aβ42) or hyperphosphorylated tau. There are other explanations for associations between retinal thinning and structural brain integrity which do not presuppose that a person will develop AD, such as other neurodegenerative diseases, substance or alcohol abuse, or traumatic brain injury. As this is a population-based cohort, we did not exclude any participants on the basis of health status, except for those with diseases directly affecting the retinal layers or MRI brain measurements.
The overarching goal of this paper was to provide further evidence for the potential of OCT as a clinically-useful screening tool for identifying preclinical disease in the community, particularly those at risk of developing AD, and for monitoring disease progression. These findings should inform applications to improve screening of AD risk at an early stage of the disease and to ensure equitable access to such screening through the use of existing retinal imaging technology. OCT technology is already widely available in eye clinics, some primary care facilities, and most retail optometrists. Work is progressing on using OCT images in artificial intelligence/machine learning applications for the diagnosis of AD, and manufacturers of commercial ophthalmology imaging tools are likely to implement models into their devices when evidence of efficacy is clear. Potential incorporation of machine learning into OCT technology would widen the availability of retinal AD screening to regional and marginalised populations, as well as establishing and expanding large and validated normalised databases to which each individual can be compared.
Conclusion
In our population-based sample of middle-aged adults, we found that thinner retinal neuronal layers (both mean RNFL and mean GC-IPL) were associated with alterations in structural brain integrity associated with increased risk for later AD. These associations were evident at the whole-brain, regional, and parcel levels, suggesting that RNFL and GC-IPL reflect widespread patterns of at-risk brain structure, rather than preferentially in regions involved in the visual pathway. These findings suggest that RNFL and GC-IPL may be readily-measured indices of brain health, further supporting their possible adoption as potential early biomarkers of later AD risk.
Data Sharing Statement
Proposed data‐analysis projects from qualified scientists must have a concept paper describing the purpose of data access, IRB approval at the applicants’ university, and provision for secure data access. We offer secure access on the Duke and Otago campuses. These access requirements parallel those used by dbGap and the Health and Retirement Study.
Acknowledgments
We thank the Dunedin Study members and their families and friends for their long-term involvement. We also thank the members of the Advisory Board for the Dunedin Neuroimaging Study, all Unit research staff, and Dunedin Study founder Dr Phil A. Silva. The Dunedin Multidisciplinary Health and Development Research Unit is based at the University of Otago within the Ngāi Tahu tribal area whom we acknowledge as first peoples, tangata whenua (trans. people of this land).
The Dunedin Multidisciplinary Health and Development Research Unit is supported by the New Zealand Health Research Council (grant number 16-604), and also received funding from the New Zealand Ministry of Business, Innovation, and Employment. Funding support was also received from the US National Institute of Aging (grant numbers R01AG069939, R01AG032282, and R01AG049789) and the UK Medical Research Council (grant number MR/P005918/1). Dr Barrett-Young’s work is funded by the Rapanui Trust. The University of Otago Department of Psychology provided funding to Prof Poulton for the OCT machine.
Disclosure
Professor Tien Yin Wong reports personal fees from Bayer, Boehringer-Ingelheim, Eden Ophthalmic, Genentech, Iveric Bio, Novartis, Oxurion, Roche, Samsung, Shanghai Henlius, Zhaoke Pharmaceutical, Plano; he is an inventor, hold patents and co-founder of EyRIS and VisRE which have interests in, and develop digital solutions for eye diseases, including diabetic retinopathy, outside the submitted work. The authors report no other conflicts of interest in this work.
References
1. London A, Benhar I, Schwartz M. The retina as a window to the brain—from eye research to CNS disorders. Nat Rev Neurol. 2013;9(1):44–53. doi:10.1038/nrneurol.2012.227
2. Cheung CY, Mok V, Foster PJ, Trucco E, Chen C, Wong TY. Retinal imaging in Alzheimer’s disease. J Neurol Neurosurg Psychiatry. 2021;92(9):983–994. doi:10.1136/jnnp-2020-325347
3. Alber J, Goldfarb D, Thompson LI, et al. Developing retinal biomarkers for the earliest stages of Alzheimer’s disease: what we know, what we don’t, and how to move forward. Alzheimers Dement. 2020;16(1):229–243. doi:10.1002/alz.12006
4. Cheung CY, Ikram MK, Chen C, Wong TY. Imaging retina to study dementia and stroke. Prog Retin Eye Res. 2017;57:89–107. doi:10.1016/j.preteyeres.2017.01.001
5. Eckerström C, Klasson N, Olsson E, Selnes P, Rolstad S, Wallin A. Similar pattern of atrophy in early- and late-onset Alzheimer’s disease. Alzheimers Dement Diagn Assess Dis Monit. 2018;10:253–259. doi:10.1016/j.dadm.2018.02.001
6. Kulason S, Xu E, Tward DJ, et al. Entorhinal and Transentorhinal Atrophy in Preclinical Alzheimer’s Disease. Front Neurosci. 2020;14. doi:10.3389/fnins.2020.00804
7. Pini L, Pievani M, Bocchetta M, et al. Brain atrophy in Alzheimer’s Disease and aging. Ageing Res Rev. 2016;30:25–48. doi:10.1016/j.arr.2016.01.002
8. Sperling R, Mormino E, Johnson K. The evolution of preclinical Alzheimer’s disease: implications for prevention trials. Neuron. 2014;84(3):608–622. doi:10.1016/j.neuron.2014.10.038
9. Musiek ES, Morris JC. Possible Consequences of the Approval of a Disease-Modifying Therapy for Alzheimer Disease. JAMA Neurol. 2021;78(2):141. doi:10.1001/jamaneurol.2020.4478
10. Chan VTT, Sun Z, Tang S, et al. Spectral-Domain OCT measurements in Alzheimer’s disease: a systematic review and meta-analysis. Ophthalmology. 2019;126(4):497–510. doi:10.1016/j.ophtha.2018.08.009
11. Hinton DR, Sadun AA, Blanks JC, Miller CA. Optic-Nerve Degeneration in Alzheimer’s Disease. N Engl J Med. 1986;315(8):485–487. doi:10.1056/NEJM198608213150804
12. Ge YJ, Xu W, Ou YN, et al. Retinal biomarkers in Alzheimer’s disease and mild cognitive impairment: a systematic review and meta-analysis. Ageing Res Rev. 2021;69:101361. doi:10.1016/j.arr.2021.101361
13. Mejia-Vergara AJ, Restrepo-Jimenez P, Pelak VS. Optical Coherence Tomography in Mild Cognitive Impairment: a Systematic Review and Meta-Analysis. Front Neurol. 2020;11. doi:10.3389/fneur.2020.578698
14. Ikram MK, Cheung CY, Wong TY, Chen CPLH. Retinal pathology as biomarker for cognitive impairment and Alzheimer’s disease. J Neurol Neurosurg Psychiatry. 2012;83(9):917–922. doi:10.1136/jnnp-2011-301628
15. Koronyo Y, Salumbides BC, Black KL, Koronyo-Hamaoui M. Alzheimer’s disease in the retina: imaging retinal aβ plaques for early diagnosis and therapy assessment. Neurodegener Dis. 2012;10(1–4):285–293. doi:10.1159/000335154
16. Hadoux X, Hui F, Lim JKH, et al. Non-invasive in vivo hyperspectral imaging of the retina for potential biomarker use in Alzheimer’s disease. Nat Commun. 2019;10(1):4227. doi:10.1038/s41467-019-12242-1
17. Ko F, Muthy ZA, Gallacher J, et al. Association of retinal nerve fiber layer thinning with current and future cognitive decline: a study using optical coherence tomography. JAMA Neurol. 2018;75(10):1198–1205. doi:10.1001/jamaneurol.2018.1578
18. Santos CY, Johnson LN, Sinoff SE, Festa EK, Heindel WC, Snyder PJ. Change in retinal structural anatomy during the preclinical stage of Alzheimer’s disease. Alzheimers Dement Diagn Assess Dis Monit. 2018;10(1):196–209. doi:10.1016/j.dadm.2018.01.003
19. Asanad S, Fantini M, Sultan W, et al. Retinal nerve fiber layer thickness predicts CSF amyloid/tau before cognitive decline. PLoS One. 2020;15(5):e0232785. doi:10.1371/journal.pone.0232785
20. Barrett-Young A, Ambler A, Cheyne K, et al. Associations between retinal nerve fiber layer and ganglion cell layer in middle age and cognition from childhood to adulthood. JAMA Ophthalmol. 2022;140(3):262–268. doi:10.1001/jamaophthalmol.2021.6082
21. Chua SYL, Lascaratos G, Atan D, et al. Relationships between retinal layer thickness and brain volumes in the UK Biobank cohort. Eur J Neurol. 2021;28(5):1490–1498. doi:10.1111/ene.14706
22. Donix M, Wittig D, Hermann W, et al. Relation of retinal and hippocampal thickness in patients with amnestic mild cognitive impairment and healthy controls. Brain Behav. 2021;11(5):e02035. doi:10.1002/brb3.2035
23. Mejia-Vergara AJ, Karanjia R, Sadun AA. OCT parameters of the optic nerve head and the retina as surrogate markers of brain volume in a normal population, a pilot study. J Neurol Sci. 2021;420:117213. doi:10.1016/j.jns.2020.117213
24. Méndez-Gómez JL, Pelletier A, Rougier MB, et al. Association of Retinal Nerve Fiber Layer Thickness With Brain Alterations in the Visual and Limbic Networks in Elderly Adults Without Dementia. JAMA Netw Open. 2018;1(7):e184406. doi:10.1001/jamanetworkopen.2018.4406
25. Ong YT, Hilal S, Cheung CY, et al. Retinal neurodegeneration on optical coherence tomography and cerebral atrophy. Neurosci Lett. 2015;584:12–16. doi:10.1016/j.neulet.2014.10.010
26. Uchida A, Pillai JA, Bermel R, et al. Correlation between brain volume and retinal photoreceptor outer segment volume in normal aging and neurodegenerative diseases. PLoS One. 2020;15(9):e0237078. doi:10.1371/journal.pone.0237078
27. Casaletto KB, Ward ME, Baker NS, et al. Retinal thinning is uniquely associated with medial temporal lobe atrophy in neurologically normal older adults. Neurobiol Aging. 2017;51:141–147. doi:10.1016/j.neurobiolaging.2016.12.011
28. den Haan J, Csinscik L, Parker T, et al. Retinal thickness as potential biomarker in posterior cortical atrophy and typical Alzheimer’s disease. Alzheimers Res Ther. 2019;11(1):62. doi:10.1186/s13195-019-0516-x
29. Jorge L, Canário N, Martins R, et al. The Retinal Inner Plexiform Synaptic Layer Mirrors Grey Matter Thickness of Primary Visual Cortex with Increased Amyloid β Load in Early Alzheimer’s Disease. Neural Plast. 2020;2020. doi:10.1155/2020/8826087
30. Shi Z, Zheng H, Hu J, et al. Retinal nerve fiber layer thinning is associated with brain atrophy: a longitudinal study in nondemented older adults. Front Aging Neurosci. 2019;11(Article):69. doi:10.3389/fnagi.2019.00069
31. Ueda E, Hirabayashi N, Ohara T, et al. Association of Inner Retinal Thickness with Prevalent Dementia and Brain Atrophy in a General Older Population. Ophthalmol Sci. 2022;2(2):100157. doi:10.1016/j.xops.2022.100157
32. López-de-Eguileta A, López-García S, Lage C, et al. The retinal ganglion cell layer reflects neurodegenerative changes in cognitively unimpaired individuals. Alzheimers Res Ther. 2022;14(1):57. doi:10.1186/s13195-022-00998-6
33. Shi Z, Cao X, Hu J, et al. Retinal nerve fiber layer thickness is associated with hippocampus and lingual gyrus volumes in nondemented older adults. Prog Neuropsychopharmacol Biol Psychiatry. 2020;99:109824. doi:10.1016/j.pnpbp.2019.109824
34. López-Cuenca I, Marcos-Dolado A, Yus-Fuertes M, et al. The relationship between retinal layers and brain areas in asymptomatic first-degree relatives of sporadic forms of Alzheimer’s disease: an exploratory analysis. Alzheimers Res Ther. 2022;14(1):79. doi:10.1186/s13195-022-01008-5
35. Liem F, Varoquaux G, Kynast J, et al. Predicting brain-age from multimodal imaging data captures cognitive impairment. NeuroImage. 2017;148:179–188. doi:10.1016/j.neuroimage.2016.11.005
36. Poulton R, Moffitt TE, Silva PA. The Dunedin Multidisciplinary Health and Development Study: overview of the first 40 years, with an eye to the future. Soc Psychiatry Psychiatr Epidemiol. 2015;50(5):679–693. doi:10.1007/s00127-015-1048-8
37. Poulton R, Guiney H, Ramrakha S, Moffitt TE. The Dunedin study after half a century: reflections on the past, and course for the future. J R Soc N Z. 2022;1–20. doi:10.1080/03036758.2022.2114508
38. Singh A, Gale J, Cheyne K, Ambler A, Poulton R, Wilson G. The prevalence of glaucoma among 45-year-old New Zealanders. N Z Med J. 2022;8:548.
39. Röck T, Bartz-Schmidt KU, Bramkamp M, Röck D. Influence of Axial Length on Thickness Measurements Using Spectral-Domain Optical Coherence Tomography. Invest Ophthalmol Vis Sci. 2014;55(11):7494–7498. doi:10.1167/iovs.14-14043
40. Glasser MF, Coalson TS, Robinson EC, et al. A multi-modal parcellation of human cerebral cortex. Nature. 2016;536(7615):171–178. doi:10.1038/nature18933
41. Benjamini Y, Hochberg Y. Controlling the False Discovery Rate: a Practical and Powerful Approach to Multiple Testing. J R Stat Soc Ser B Methodol. 1995;57(1):289–300. doi:10.1111/j.2517-6161.1995.tb02031.x
42. Hariri AR On the use of global covariates in analyses of regional measures of brain structure; 2020. Available from: https://haririlab.com/methods/GlobalCovariates.html.
43. Mutlu U, Ikram MK, Roshchupkin GV, et al. Thinner retinal layers are associated with changes in the visual pathway: a population-based study. Hum Brain Mapp. 2018;39(11):4290–4301. doi:10.1002/hbm.24246
44. Brayne C, Moffitt TE. The limitations of large-scale volunteer databases to address inequalities and global challenges in health and aging. Nat Aging. 2022;2(9):775–783. doi:10.1038/s43587-022-00277-x
45. Ng WY, Cheung CY, Milea D, Ting DSW. Artificial intelligence and machine learning for Alzheimer’s disease: let’s not forget about the retina. Br J Ophthalmol. 2021;105(5):593–594. doi:10.1136/bjophthalmol-2020-318407
46. Milea D, Najjar RP, Jiang Z, et al. Artificial Intelligence to Detect Papilledema from Ocular Fundus Photographs. N Engl J Med. 2020;382(18):1687–1695. doi:10.1056/NEJMoa1917130
47. Nusinovici S, Rim TH, Yu M, et al. Retinal photograph-based deep learning predicts biological age, and stratifies morbidity and mortality risk. Age Ageing. 2022;51(4):afac065. doi:10.1093/ageing/afac065
48. d’Arbeloff T, Elliott ML, Knodt AR, et al. White matter hyperintensities are common in midlife and already associated with cognitive decline. Brain Commun. 2019;1(1):Articlefcz041. doi:10.1093/braincomms/fcz041
49. Elliott ML, Belsky DW, Knodt AR, et al. Brain-age in midlife is associated with accelerated biological aging and cognitive decline in a longitudinal birth cohort. Mol Psychiatry. 2019;26(8):3829–3838. doi:10.1038/s41380-019-0626-7
50. Casson RJ, Chidlow G, Crowston JG, Williams PA, Wood JPM. Retinal energy metabolism in health and glaucoma. Prog Retin Eye Res. 2021;81:100881. doi:10.1016/j.preteyeres.2020.100881
 © 2023 The Author(s). This work is published and licensed by Dove Medical Press Limited. The
full terms of this license are available at https://www.dovepress.com/terms
and incorporate the Creative Commons Attribution
- Non Commercial (unported, 3.0) License.
By accessing the work you hereby accept the Terms. Non-commercial uses of the work are permitted
without any further permission from Dove Medical Press Limited, provided the work is properly
attributed. For permission for commercial use of this work, please see paragraphs 4.2 and 5 of our Terms.
© 2023 The Author(s). This work is published and licensed by Dove Medical Press Limited. The
full terms of this license are available at https://www.dovepress.com/terms
and incorporate the Creative Commons Attribution
- Non Commercial (unported, 3.0) License.
By accessing the work you hereby accept the Terms. Non-commercial uses of the work are permitted
without any further permission from Dove Medical Press Limited, provided the work is properly
attributed. For permission for commercial use of this work, please see paragraphs 4.2 and 5 of our Terms.
Recommended articles
Intravitreal Injections for Macular Edema in Silicone Oil Filled Eyes
Safadi K, Eshel Y, Levy J, Tiosano L, Jaouni T, Khateb S
Clinical Ophthalmology 2024, 18:3405-3416
Published Date: 22 November 2024
Retinal Assessment and the Retina–Choroid Link in Precapillary Pulmonary Hypertension: A Single-Center Cross-Sectional Study
Leoniuk A, Ptaszynska K, Szwedowicz A, Sawicka-Smiarowska E, Kazimierczyk R, Zonenberg A, Pieklarz B, Baldyga D, Obuchowska I, Konopinska J, Kaminski KA, Dmuchowska DA
Clinical Ophthalmology 2026, 20:590272
Published Date: 19 March 2026