Back to Journals » Journal of Multidisciplinary Healthcare » Volume 18
Associations Between the Triglyceride-Glucose Index Along with Its Combinations with Obesity Indicators and Kidney Stone Among American Adults
Authors Hu X ![]() , Wang L, Min S, Tang X
, Wang L, Min S, Tang X ![]() , Lu B, Lei M, Shang S, Yang Z, He Q
, Lu B, Lei M, Shang S, Yang Z, He Q ![]()
Received 8 July 2025
Accepted for publication 18 September 2025
Published 30 September 2025 Volume 2025:18 Pages 6233—6244
DOI https://doi.org/10.2147/JMDH.S552357
Checked for plagiarism Yes
Review by Single anonymous peer review
Peer reviewer comments 2
Editor who approved publication: Dr Scott Fraser
Video abstract of “Triglyceride-glucose index with obesity indicators and kidney stone” [552357].
Views: 91
Xinyu Hu,1– 3,* Linqun Wang,1– 3,* Shuqi Min,4,* Xialin Tang,2,3 Bowen Lu,1,3 Mingyan Lei,2 Shiyan Shang,1 Zhihui Yang,1 Qiwang He1– 3
1Hubei University of Chinese Medicine, Wuhan, 430061, People’s Republic of China; 2Hubei Provincial Hospital of Traditional Chinese Medicine, Affiliated Hospital of Hubei University of Chinese Medicine, Hubei Key Laboratory of Theory and Application Research of Liver and Kidney in Traditional Chinese Medicine, Hubei Province Academy of Traditional Chinese Medicine, Wuhan, 430061, People’s Republic of China; 3Hubei Shizhen Laboratory, Wuhan, 430061, People’s Republic of China; 4Changzhou Hospital of Traditional Chinese Medicine, Affiliated Hospital of Nanjing University of Chinese Medicine, Changzhou, 213000, People’s Republic of China
*These authors contributed equally to this work
Correspondence: Qiwang He, Email [email protected]
Objective: Relationships of triglyceride-glucose (TyG) index and TyG combined with obesity indicators [TyG-waist circumference (TyG-WC), TyG-waist height ratio (TyG-WHtR), TyG-body mass index (TyG-BMI)] with kidney stone (KS) have been infrequently investigated among the American. This study aimed to examine these relationships within a substantial, nationwide population.
Methods: The current cross-sectional study recruited totally 9,808 adult participants in National Health and Nutrition Examination Survey (NHANES) 2007– 2018. For investigating relations of the TyG index, TyG-WC, TyG-WHtR, and TyG-BMI with KS, multivariate logistic regression, restricted cubic spline (RCS), mediation, sensitivity, subgroup and interaction analyses were used.
Results: This analysis indicated that TyG combined with obesity indicators [TyG-WC, (odds ratio (OR) = 2.19, 95% CI: 1.69– 2.84, P < 0.001); TyG-WHtR, (OR = 2.26, 95% CI: 1.73– 2.95, P < 0.001); TyG-BMI, (OR = 1.88, 95% CI: 1.48– 2.39, P < 0.001)] exhibited a stronger correlation with KS compared to the TyG index alone (OR = 1.40, 95% CI: 1.10– 1.78, P = 0.006). Based on RCS analysis, TyG index and TyG combined with obesity indicators were linearly related to KS (P-overall < 0.0001, P-nonlinear > 0.05). Mediation analysis indicated that high-density lipoprotein cholesterol (HDL-C) had a significant mediating effect.
Conclusion: In this study, TyG index and TyG combined with obesity indicators (TyG-WC, TyG-WHtR and TyG-BMI) show a significantly positive relationship to KS. Furthermore, in comparison to the TyG index alone, TyG combined with obesity indicators exhibited enhanced diagnostic relevance.
Keywords: triglyceride, glucose index, TyG, triglyceride glucose, waist circumference, TyG, WC, Triglyceride glucose, waist height ratio, TyG, WHtR, Triglyceride glucose, body mass index, TyG, BMI, kidney stone, NHANES
Introduction
Kidney stone (KS) result from the abnormal accumulation of mineral deposits within the renal pelvis and calyces free-floating or affixed to renal papillae, making it a common disorder of the urinary system.1 In the last several decades, the incidence of KS has consistently increased globally, showing significant regional variations; reported rates range from 1% to 5% in Asia and up to 13% in North America.2,3 Furthermore, KS has been linked to a recurrence rate of 67%.4 It is also linked to various metabolic disorders including obesity, hyperglycemia, gout, and gallstones. KS has imposed significant strain on global public health systems, with the projected annual cost of KS prevention and management in the USA alone expected to rise to $36 billion by 2030.5 Consequently, identifying risk factors related to the development of KS is essential for effective prevention.
In 2008, Professor Luis E. Simental-Mendía was the first to employ the Triglyceride-Glucose (TyG) index as the emerging marker for insulin resistance (IR), calculated using the formula Ln [fasting triglyceride (TG, mg/dL) × fasting blood glucose (FBG, mg/dL)/2].6 Compared to traditional IR indicators, like Homeostasis Model Assessment of IR (HOMA-IR), the TyG index provides advantages of easier accessibility, lower cost, and greater sensitivity, which have led to its widespread adoption in clinical settings.7 The TyG index is closely associated with chronic kidney disease (CKD),8 as well as various metabolic disorders including obesity,9 diabetes,10 gout,11 and gallstones.12 Furthermore, scholars, including Yildirim, have suggested that the TyG index offers reliability and convenience as a prognostic indicator for adverse outcomes in individuals with renal diseases.13 Thus, exploring whether the TyG index can predict KS is of interest.
Obesity is linked to IR, compensatory hyperinsulinemia, and metabolic disturbances, and it, along with a larger body size, may contribute to the formation of calcium-containing KS.14,15 Existing evidence suggests that the TyG combined with obesity indicators [TyG-waist circumference (TyG-WC), TyG-waist height ratio (TyG-WHtR), TyG-body mass index (TyG-BMI)] demonstrates superior predictive ability compared to the TyG index alone in forecasting hyperuricemia, gallstones, and cardiovascular diseases in patients.16–18 However, the relationship between the TyG combined with obesity indicators and KS over the general population remains unclear. Therefore, in this study, we aimed to address this knowledge gap by investigating the correlation between the TyG combined with obesity indicators and KS, utilizing the National Health and Nutrition Examination Survey (NHANES) database-the public accessible, comprehensive, and large-sample database.
Methods
Study Population
The extensive, multiphase NHANES was conducted by the National Center for Health Statistics (NCHS) of the Centers for Disease Control and Prevention (CDC) among the US non-institutionalized civilian demographic to examine health and nutrition-associated risk factors within the American populace.19 The cross-sectional work collected data from 2007 to 2018 and recruited a total of 59,842 participants for the health examination survey. Specific exclusion criteria were used to ensure that our study results were valid and reliable, including (1) age < 18 years, (2) lack of outcome index (KS) data, (3) lack of exposure-related indices (TyG, TyG-WC, TyG-WHtR, TyG-BMI) data, and (4) missing covariate data. Finally, 9,808 participants were recruited for this study (Figure 1). The NCHS Research Ethics Review Board approved the NHANES protocols. Written informed consent was obtained from every participant.
 |
Figure 1 Participant screening flowchart. Abbreviations: NHANES, National Health and Nutrition Examination Survey; TyG, triglyceride-glucose; TyG-WC, triglyceride glucose-waist circumference; TyG-WHtR, triglyceride glucose-waist height ratio; TyG-BMI, triglyceride glucose-body mass index. |
Definition of Exposure
The TyG index was determined by TG and FBG concentrations. FBG and TG were measured according to standardized NHANES laboratory protocols. Venous blood samples were collected in the Mobile Examination Center after an overnight fast and processed in central laboratories. FBG was determined using the hexokinase enzymatic method (hexokinase/G-6-PD) on the Roche/Hitachi Modular P chemistry analyzer (2007–2012), the Roche Cobas c501 (2013–2014), and the Roche Cobas c311 (2015–2018). TG concentrations were assessed using the enzymatic colorimetric method based on the Wahlefeld procedure, with analyses performed on the Roche/Hitachi Modular P (2007–2012) and the Roche Cobas 6000 (2013–2018) chemistry analyzers.
We obtained WC, height and weight data through a mobile examination center and computed TyG, TyG-WC, TyG-WHtR, and TyG-BMI values as follows: (1) TyG = ln[TG (mg/dL) × FBG (mg/dL)/2], (2) TyG-WC = TyG × WC, (3) TyG-WHtR = TyG × WHtR (WHtR = WC/height), and (4) TyG-BMI = TyG × BMI.18 Subsequently, patients were classified into 4 groups (Q1-Q4) according to TyG, TyG-WC, TyG-WHtR, and TyG-BMI quartiles, separately, with group Q1 being a control.
Definition of Outcome
KS was confirmed on the basis of the health questionnaire in which the subjects were asked, “Have you ever had a kidney stone?”, and KS was confirmed with the answer of “yes”.20
Assessment of Covariates
The current study identified relevant covariates based on prior research to serve as candidate confounders. Continuous variables included age (years), BMI (kg/m2), WC (cm), height (cm), high-density lipoprotein cholesterol (HDL-C, mmol/L), low-density lipoprotein cholesterol (LDL-C, mmol/L), total cholesterol (TC, mmol/L), insulin (pmol/L), alanine aminotransferase (ALT, U/L), aspartate aminotransferase (AST, U/L), γ-glutamyl transferase (GGT, U/L), serum calcium (mmol/L), serum phosphorus (mmol/L), serum creatinine (Scr, µmol/L), and serum uric acid (SUA, µmol/L). Among these, age was categorized into two groups: less than 60 years and 60 years or older for subsequent analyses. Categorical variables encompassed gender, race, education, marital status, household income, smoking status, alcohol consumption, hypertension, and diabetes, as outlined below. Household income was classified into two groups based on the ratio of family income to poverty, with values greater than one categorized as the poverty or richer group. Smoking status was divided into two categories according to cotinine concentration, with a threshold of greater than 14 ng/mL. Alcohol consumption was classified based on responses to the question, “Had at least 12 alcoholic drinks in the past year”. Hypertension was categorized based on responses to the question, “Ever told you had high blood pressure”. Diabetes status was divided into three groups: diabetes (defined as “Doctor told you have diabetes” answered “Yes” or HbA1c ≥ 6.5% or FBG ≥ 126 mg/dL), prediabetes (defined as “Ever told you have prediabetes” answered “Yes” or 5.7% ≤ HbA1c < 6.5% or 100 mg/dL ≤ FBG < 126 mg/dL), and normal.
Statistical Analysis
Data were analyzed in accordance with CDC guidelines (https://wwwn.cdc.gov/nchs/nhanes/tutorials/default.aspx), utilizing weighted data for the analysis. Baseline characteristics of participants were presented according to the quartiles of the TyG index, TyG-WC, TyG-WHtR, and TyG-BMI. Continuous data were expressed as mean ± standard deviation (SD), while categorical data were presented as frequency (percentage). Comparisons of continuous and categorical data between groups were performed using one-way ANOVA or Kruskal–Wallis tests, as well as Chi-square or Fisher’s tests.
Also, we tested relations of the TyG index and TyG combined with obesity indicators with KS through multivariate logistic regression. The results were expressed as odds ratios (ORs) along with 95% confidence intervals (CIs) for three models. The median value in each quartile was utilized as a continuous variable to evaluate linear trends among the TyG index, TyG-WC, TyG-WHtR, and TyG-BMI quartiles. In Model 1, no covariates were adjusted. In Model 2, adjustments were made for age, gender, and race. In Model 3, the adjustments included age, gender, race, HDL-C, LDL-C, ALT, AST, GGT, serum calcium, serum phosphorus, Scr, SUA, education level, marital status, household income, smoking status, alcohol consumption, hypertension, and diabetes.
We used a restricted cubic spline (RCS) to explore the dose-response relationships of the TyG index, TyG combined with obesity indicators, and KS. Mediation analysis was conducted to examine whether the correlation between the TyG index and TyG combined with obesity indicators and KS could be explained by HDL-C, with covariates adjusted in Model 3. Additionally, subgroup analyses were performed based on stratified factors, including age (<60, ≥60 years), gender (male, female), smoking status (yes, no), and alcohol consumption (yes, no).
Furthermore, sensitivity analyses were utilized to assess the robustness of the results: (1) excluding individuals with diabetes, (2) excluding individuals with diabetes and prediabetes, and (3) excluding individuals with hypertension. Statistical analyses were performed using the R programming language (version 4.4.1). A P-value of less than 0.05 was considered indicative of a significant difference in two-tailed statistical assessments.
Results
Basic Characteristics of the Participants According to TyG Index, TyG‑WC, TyG‑WHtR and TyG‑BMI Quartiles
Table 1 and Supplementary Tables S1–S3 present the baseline characteristics of the participants. A total of 9,808 participants were recruited, with an average age of 49.62 years (SD 17.63), comprising 4,825 (49.19%) males and 944 (9.62%) KS patients. Individuals with higher levels of the TyG index, TyG-WC, TyG-WHtR, and TyG-BMI were generally older and exhibited increased BMI, WC, LDL-C, TC, insulin, ALT, GGT, Scr, and SUA levels, while displaying reduced HDL-C and serum phosphorus levels. As the TyG index and TyG-WC levels increased, the proportion of males also rose. Conversely, as TyG-WHtR and TyG-BMI levels increased, the proportion of females correspondingly increased. An overall increasing trend was observed in the proportion of patients with lower education levels, those with partners, and those with hypertension, diabetes, prediabetes, and KS as the TyG index and its combined with obesity indicators increased.
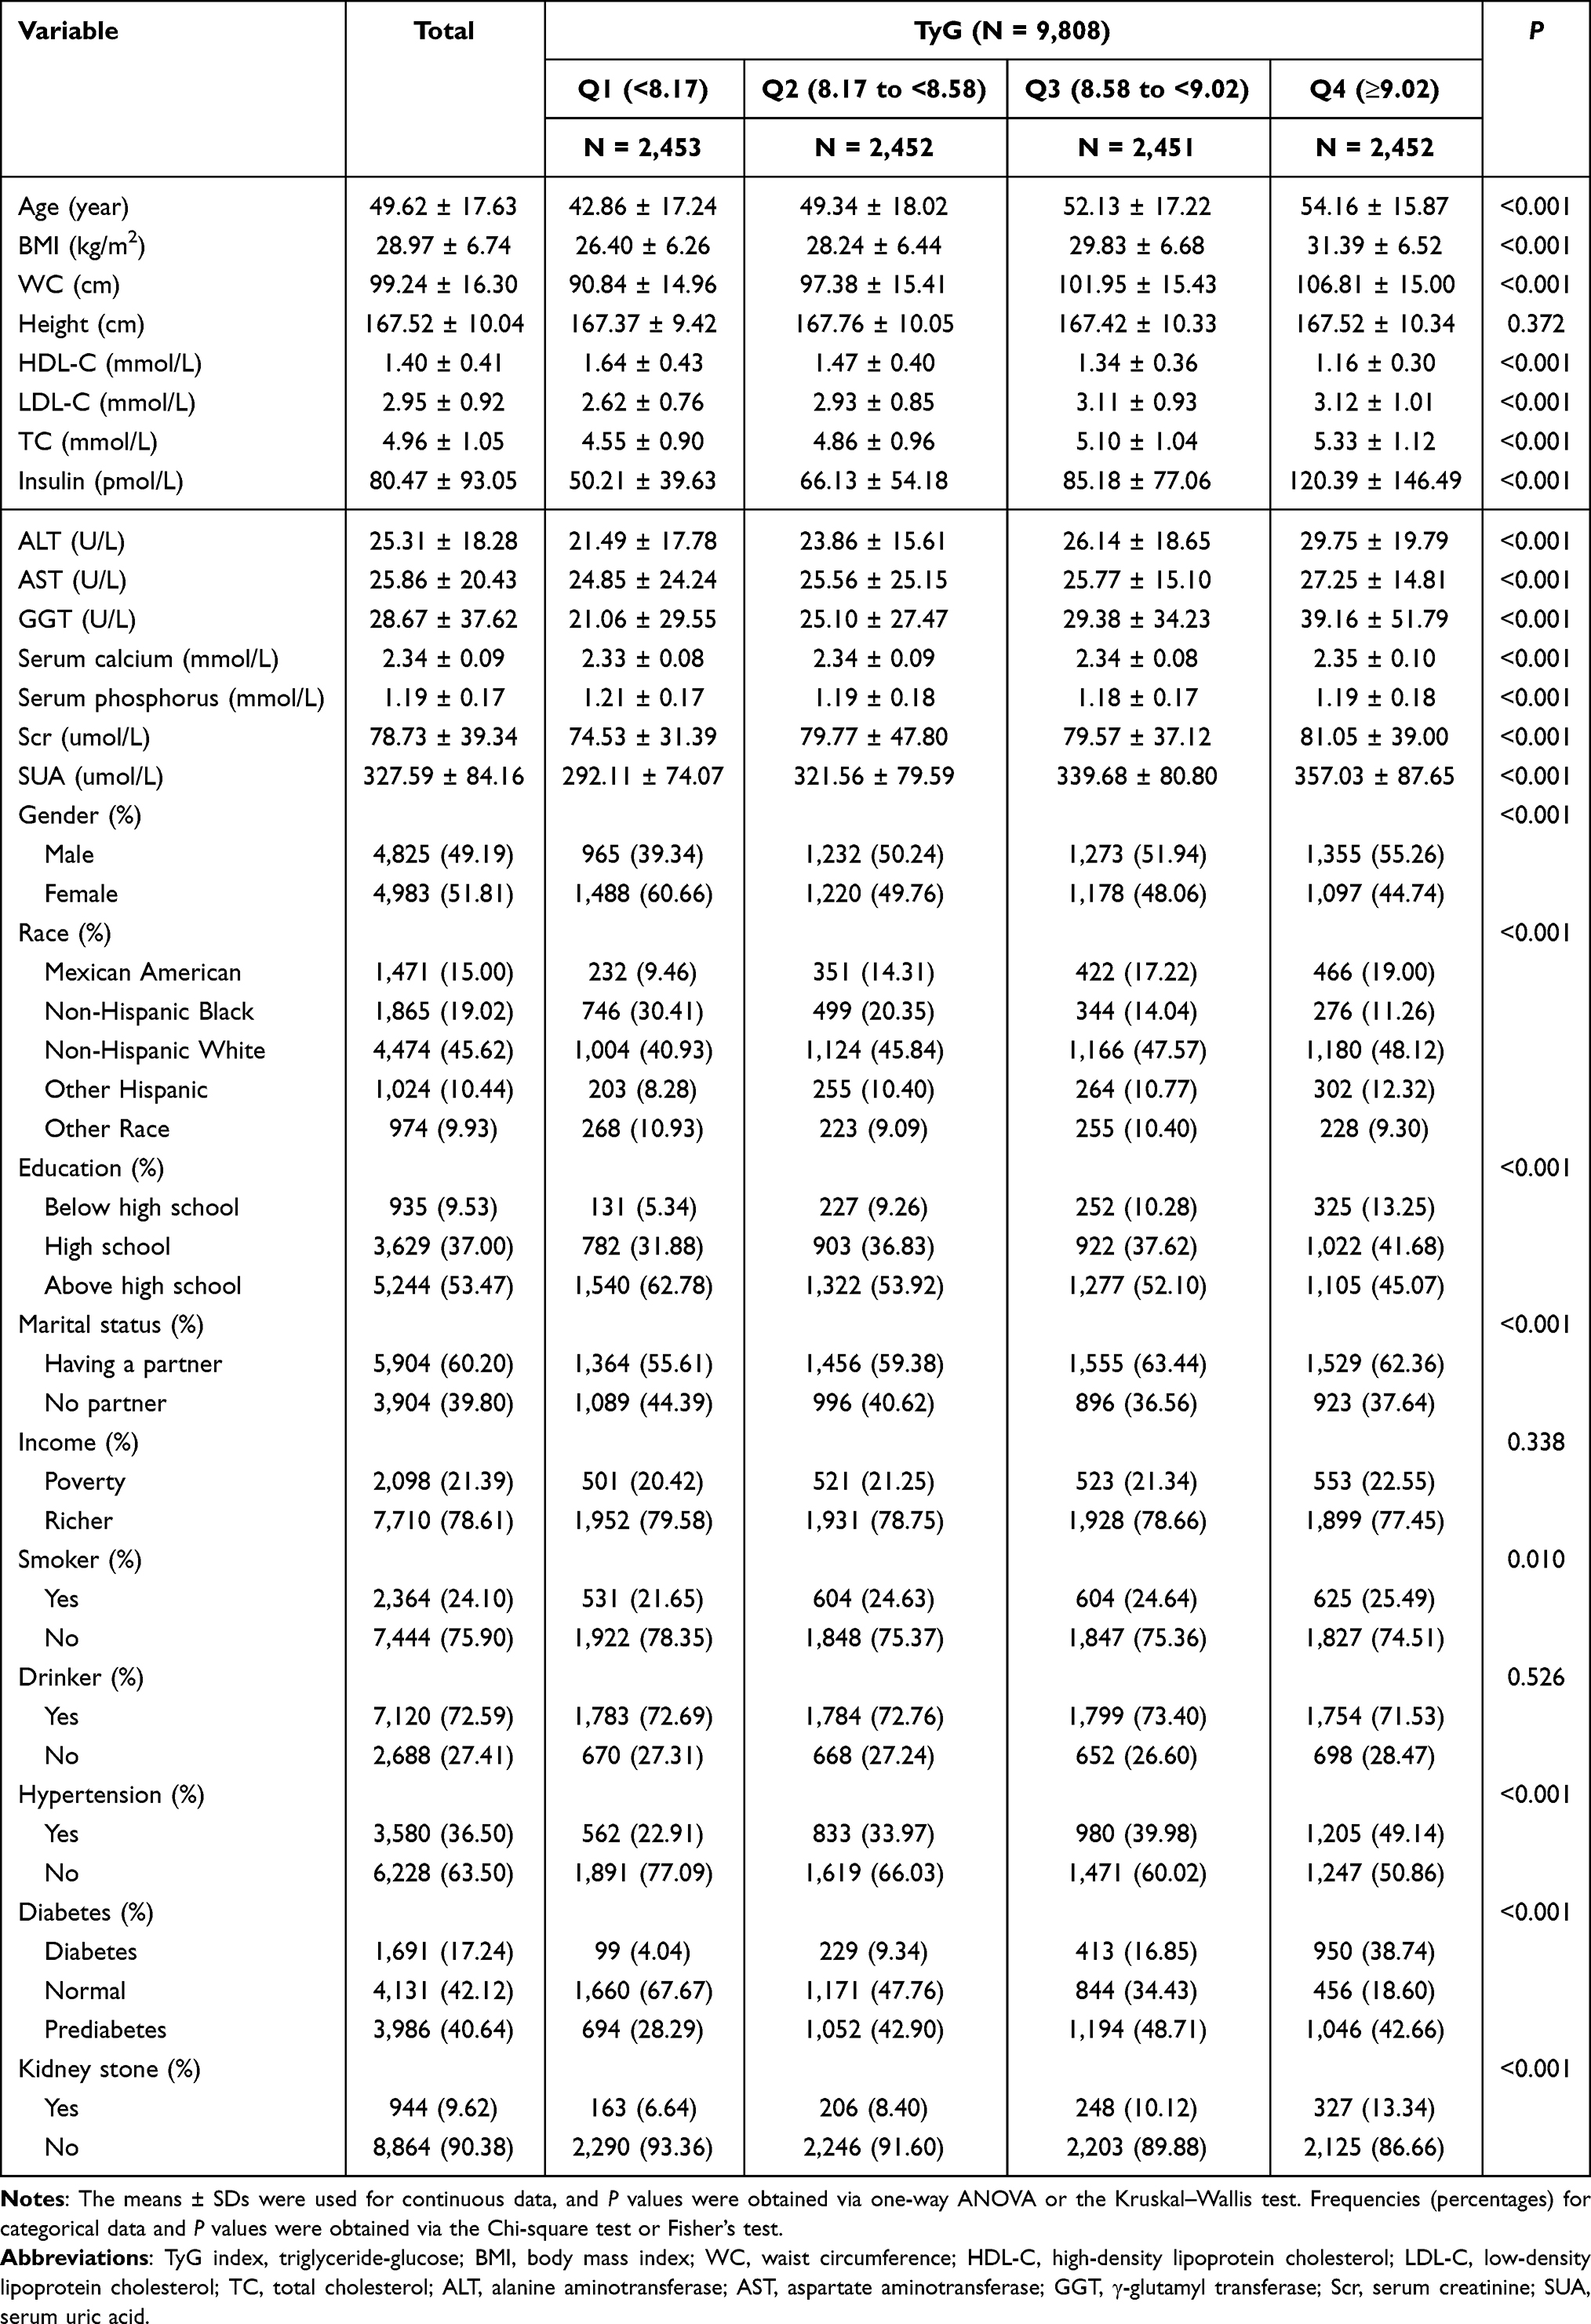 |
Table 1 Baseline Characteristics of the Study Population Based on TyG Quartiles |
Associations of the TyG Index, TyG-WC, TyG-WHtR, and TyG-BMI with KS
Table 2 and Supplementary Tables S4–S6 present the relationships between the TyG index, its combined with obesity indicators, and KS. When covariates were adjusted, all four indicators were significantly positively associated with KS. For the TyG index, Q4 was significantly positively correlated with Q1 (OR = 1.40; 95% CI: 1.10–1.78; P = 0.006). For TyG-WC, Q4 shows a significant positive correlation compared with Q1 (OR = 2.19; 95% CI: 1.69–2.84; P < 0.001). For TyG-WHtR, Q4 was significantly positively correlated with Q1 (OR = 2.26; 95% CI: 1.73–2.95; P < 0.001). For TyG-BMI, Q4 was significantly positively related to Q1 (OR = 1.88; 95% CI: 1.48–2.39; P < 0.001). Analysis of these four indicators as continuous variables yielded results consistent with those obtained earlier.
 |
Table 2 Association Between TyG and KS |
RCS Analysis on Relations Between the TyG Index, TyG Combined with Obesity Indicators and KS
Figure 2 illustrates that RCS was utilized for flexible modeling and visualizing the relationships between the TyG index, its combined with obesity indicators, and KS. After adjusting for the covariates in Model 3, all four indicators were found to be linearly associated with KS (P-overall < 0.0001, P-nonlinear > 0.05). For the TyG index, there is a significant linear positive association (P-nonlinear = 0.594, P-overall < 0.0001), with a breakpoint at 8.57. For TyG-WC, there existed a significant linear positive association (P-nonlinear = 0.869, P-overall < 0.0001), with a breakpoint at 848.60. For TyG-WHtR, there existed a significant linear positive association (P-nonlinear = 0.796, P-overall < 0.0001), with a breakpoint at 5.05. For TyG-BMI, a significant linear positive association (P-nonlinear = 0.548, P-overall < 0.0001) was observed, with a breakpoint at 239.86.
 |
Figure 2 RCS curve for relations of TyG and TyG combined with obesity indicators with KS. (A) TyG. (B) TyG-WC. (C) TyG-WHtR. (D) TyG-BMI. The solid red lines represent ORs, whereas red-shaded regions indicate 95% CIs. Abbreviations: RCS, restricted cubic spline; TyG, triglyceride-glucose; TyG-WC, triglyceride glucose-waist circumference; TyG-WHtR, triglyceride glucose-waist height ratio; TyG-BMI, triglyceride glucose-body mass index; KS, kidney stone; OR, odds ratio; CI, confidence interval. |
Mediation Analysis on Relations Between TyG, TyG Combined with Obesity Indicators and KS
Supplementary Figure S1 shows that HDL-C partially mediated the correlations of the TyG index, TyG-WC, and TyG-BMI combined with obesity indicators with KS. For the TyG index, HDL-C mediated a 30.3% (P < 0.01) association between it and KS. For TyG-WC, HDL-C mediated 10.8% (P < 0.05) of the association between it and KS. For TyG-BMI, HDL-C mediated a 13.8% (P < 0.01) association between it and KS. However, for TyG-WHtR, the relationship between HDL-C and KS was not statistically significant (P = 0.06).
Subgroup Analysis for Relations of TyG Index and TyG Combined with Obesity Indicators with KS
Figure 3 and Supplementary Figures S2–S4 present the results of the subgroup analysis for the TyG index and its combined with obesity indicators. After controlling for variables, segmented analysis was performed based on age (<60, ≥60 years), gender (male, female), smoking status (yes, no), and alcohol consumption (yes, no).
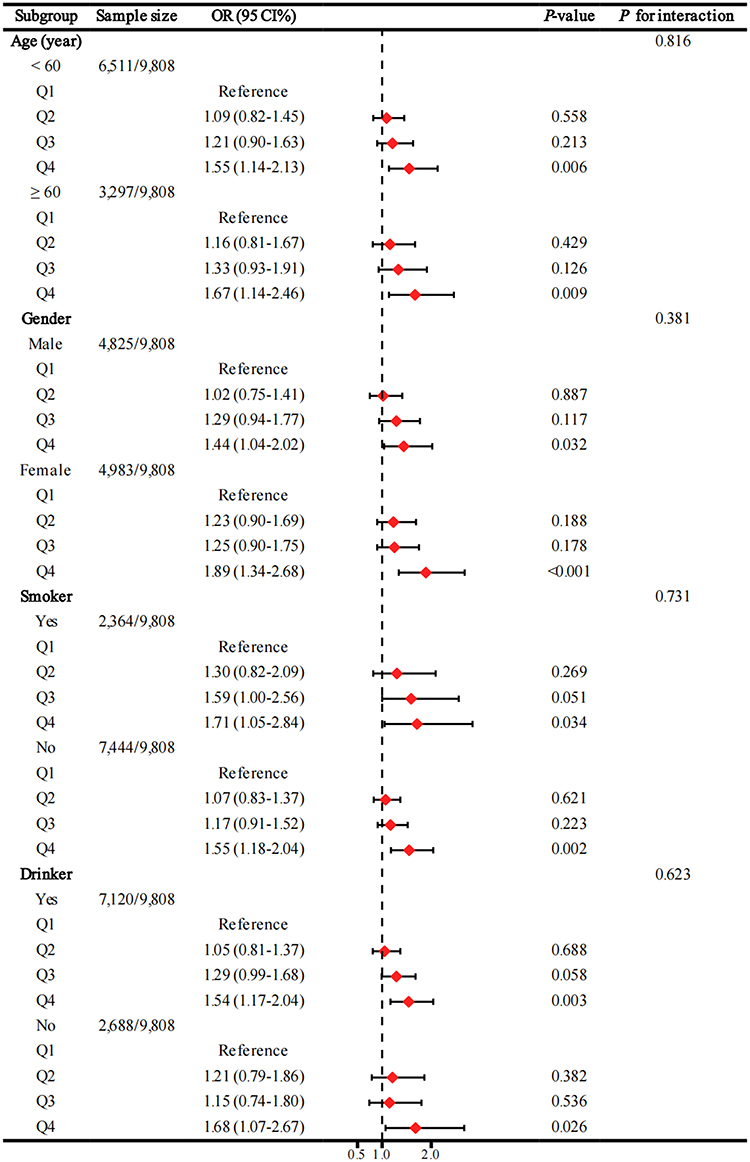 |
Figure 3 Forest plot showing the TyG index association with KS. Model 3 was used for subgroup analysis. Abbreviations: TyG, triglyceride-glucose; KS, kidney stone; OR, odds ratio; CI, confidence interval. |
In the subgroups stratified by age, gender, smoking status, and alcohol consumption, all four indicators were significantly associated with KS (all P < 0.05). The interaction tests indicated no significant differences based on age, gender, smoking status, or alcohol consumption (all P for interaction > 0.05).
Sensitivity Analysis for Relations of TyG Index and TyG Combined with Obesity Indicators with KS
Supplementary Figures S5–S7 illustrate the results of the sensitivity analysis concerning the TyG index, TyG-WC, TyG-WHtR, TyG-BMI, and KS, which aligned with the conclusions of the main analysis. Both analyses indicated that TyG combined with obesity indicators exhibited positive associations with KS risk.
In sensitivity analysis 1 (excluding the populations with diabetes), TyG combined with obesity indicators demonstrated a significant positive association with KS, whereas the TyG index did not show a statistically significant difference from KS. Specifically, for the TyG index, compared with Q1, Q4 did not show any obvious association (OR = 1.29; 95% CI: 0.97–1.72; P = 0.083). For TyG-WC, Q4 shows a significant positive correlation compared with Q1 (OR = 1.96; 95% CI: 1.45–2.66; P < 0.001). For TyG-WHtR, Q4 shows a significant positive correlation compared with Q1 (OR = 1.82; 95% CI: 1.34–2.48; P < 0.001). For TyG-BMI, Q4 shows a significant positive correlation compared with Q1 (OR = 1.70; 95% CI: 1.28–2.26; P < 0.001).
In sensitivity analysis 2 (excluding the populations with diabetes and prediabetes), TyG combined with obesity indicators was positively linked to KS, although no statistical difference was found between the TyG index and KS. Specifically, for the TyG index, compared with Q1, there was no significant association in Q4 (OR = 1.30; 95% CI: 0.86–1.98; P = 0.221). For TyG-WC, Q4 shows a positive correlation compared with Q1 (OR = 1.56; 95% CI: 1.01–2.44; P = 0.049). For TyG-WHtR, Q4 shows a positive correlation compared with Q1 (OR = 1.86; 95% CI: 1.18–2.95; P = 0.008). For TyG-BMI, Q4 shows the positive relation relative to Q1 (OR = 1.66; 95% CI: 1.10–2.54; P = 0.017).
In sensitivity analysis 3 (excluding the hypertension population), significant positive associations were found for the TyG index, TyG-WC, TyG-WHtR, and TyG-BMI with KS. Specifically, for the TyG index, Q4 shows a significant positive correlation compared with Q1 (OR = 1.48; 95% CI: 1.05–2.09; P = 0.026). For TyG-WC, Q4 shows a significant positive correlation compared with Q1 (OR = 2.59; 95% CI: 1.81–3.76; P < 0.001). For TyG-WHtR, Q4 shows a significant positive correlation compared with Q1 (OR = 2.60; 95% CI: 1.80–3.76; P < 0.001). For TyG-BMI, Q4 shows a significant positive correlation compared with Q1 (OR = 2.33; 95% CI: 1.66–3.29; P < 0.001).
Discussion
This study’s results revealed a positive correlation between the TyG index, TyG combined with obesity indicators (TyG-WC, TyG-WHtR, and TyG-BMI), and KS. Notably, the association between TyG combined with obesity indicators and KS was more pronounced than the TyG index alone. RCS analysis confirmed a significant linear relationship between the four indicators and KS. Mediation analysis indicated that HDL-C played a crucial mediating role. Furthermore, sensitivity analysis revealed that the combined index exhibited enhanced robustness and broader population applicability.
Currently, only a few scholars have investigated the relation of TyG index with KS. In the cross-sectional study conducted by Jiang et al,21 the dose-response curve revealed that the TyG index was positively correlated with KS, with the higher TyG index group having a 19% higher risk of KS than the lower TyG index group [adjusted odds ratio (OR) = 1.19, 95% CI: 1.02–1.38, P = 0.03]. As found by Qin et al,22 each one extra unit in the TyG index corresponded to a 12% rise in KS risk (OR = 1.12; 95% CI: 1.02–1.22; P = 0.02). Our findings align with those of previous studies. Furthermore, Lv et al, utilizing the NHANES database, analyzed WC, WHtR, and BMI indicators among individuals from 2007 to 2020 and discovered that these indicators were positively related to KS.23 Nonetheless, whether the TyG combined with obesity indicators is more strongly correlated with the incidence of KS remains unexplored.
The effect of the TyG index on predicting KS occurrence remains incompletely understood, despite existing research. However, several potential explanations have been proposed. Considering the calculation formula of the TyG index, FPG and TG are potential factors affecting the occurrence of KS. Kim et al found that even if the FPG level was elevated within the normal range, it was still associated with an increased risk of KS in men.24 In a Korean cohort study on urinary stones, Kang et al reported that hypertriglyceridemia was independently related to stone recurrence (HR = 1.857; 95% CI: 1.211–2.847; P < 0.01).25 In addition, the TyG index is closely related to the assessment of IR. Insulin exerts an important effect on modulating ammonium balance. On the one hand, in vitro experiments by Chobanian et al confirmed that insulin can enhance ammonia production in proximal tubular segments.26 On the other hand, insulin can directly trigger Na+/H+ exchanger (NHE3) within proximal tubules, thereby affecting the excretion and reabsorption of renal ammonium.27,28 Given these extensive correlations, further experimental studies are warranted to elucidate the intrinsic mechanisms underlying the TyG index’s predictive value for KS and to identify key risk factors among human metabolic indicators.
Obesity and IR are integral components of metabolic syndrome (MS), exhibiting complex and intimate interconnections. Bulbul et al indicate that expanded adipose tissue releases excessive free fatty acids, ROS, as well as pro-inflammatory factors, thereby impeding insulin’s role in the insulin signaling pathway and disrupting glucose homeostasis.29 During the progression of obesity, adipose tissue macrophages may undergo a polarization transition from M2 phenotype to M1 counterpart, contributing to IR.30 Mouse experiments conducted by Ja et al demonstrated that S273 phosphorylation of obesity-related PPARγenhanced IR via growth differentiation factor 3. These findings indicate a potentially stronger link between obesity and IR than currently understood. Consequently, incorporating obesity indicators may significantly improve the reliability and sensitivity of kidney stone prediction models.
More researchers have recently utilized adjustments to indicators such as height, weight, and waist circumference, in contrast to the traditional obesity measure BMI, leading to additional metrics like WHtR and weight-adjusted waist circumference index, all of which positively correlated with KS.31,32 He et al utilized an obesity-induced MS rat model, revealing that male Sprague-Dawley rats with MS were more likely to develop KS.33 Furthermore, the quantity and distribution of body fat in humans also have a certain connection with KS. A cross-sectional study pointed out that parameters of total fat and trunk fat were associated with increased KS incidence in adults over 40 years old.34 Kelly et al noted that fat might facilitate stone formation by reducing the ammonia secretion capability of renal tubular cells, thereby acidifying urine.35 Thus, obesity acts as an unseen force propelling the progression of KS formation.
Our research further revealed that HDL-C plays a crucial mediating role in the relationship between the TyG combined with obesity indicators and KS. HDL-C, a plasma homeostasis nanoparticle with multifaceted functions, can facilitate cholesterol absorption by cell membranes and plays a pivotal role in reverse cholesterol transport.36 Adipose tissue in obese individuals may further decrease HDL-C levels through the action of adipokines, such as adiponectin and endothelial lipase.37 A study by Du et al, involving 21,084 participants, indicated a significant positive relation of non-HDL to HDL cholesterol ratio (NHHR) with KS incidence.38 The results are consistent with previous findings, which to some extent supports the positive correlation of TyG combined with obesity indicators with KS.
Strengths and Limitations
The present study possesses several strengths. Firstly, it pioneered the exploration of relationships between the TyG index combined with obesity indicators (TyG-WC, TyG-WHtR, and TyG-BMI) and KS incidence. Secondly, a comparative analysis of the relationships between TyG, TyG combined with obesity indicators, and KS was conducted. Thirdly, utilizing data from the NHANES database ensured a large sample size and robust population representation.
However, several limitations warrant consideration. Firstly, the cross-sectional design precluded the determination of causal relationships between TyG, TyG combined with obesity indicators, and KS. Secondly, this observational study made it impossible to excluded confounders probably affecting our findings, but we adjusted for available covariates including demographic characteristics, relevant hematologic measures, and lifestyle factors, aiming to enhance the result reliability and accuracy. Thirdly, reliance on self-reported questionnaire data for outcome diagnosis and covariate information introduced potential recall bias. This also leads to many regrets in information collection, such as whether the diagnosis was missed due to the small size of the sand and stones or their automatic discharge, and the inability to identify the type of kidney stones, etc. Nevertheless, numerous high-quality studies utilizing NHANES data have employed similar methods,39–41 and we obtained information in the same way. Fourthly, generalizability to other countries or ethnicities is uncertain due to potential genetic, environmental, and lifestyle differences specific to the United States population. In light of these limitations, future well-designed, large-scale studies with higher levels of evidence are necessary to validate these findings and provide more definitive insights into the relationships between TyG, obesity indicators, and KS.
Conclusion
In conclusion, in the present study, TyG and TyG combined with obesity indicators (TyG-WC, TyG-WHtR and TyG-BMI) were significantly positively related to KS. Moreover, relative to TyG alone, the combined indicators showed superior diagnostic relevance. Therefore, TyG combined with obesity indicators and TyG are potential effective markers for KS risk differentiation.
Abbreviations
KS, Kidney stone; TyG, triglyceride-glucose; IR, insulin resistance; TG, fasting triglyceride; FBG, fasting blood glucose; TyG-WC, TyG-waist circumference; TyG-WHtR, TyG-waist height ratio; TyG-BMI, TyG-body mass index; NHANES, National Health and Nutrition Examination Survey; NCHS, National Center for Health Statistics; CDC, Centers for Disease Control and Prevention; BMI, body mass index; WC, waist circumference; HDL-C, high-density lipoprotein cholesterol; LDL-C, low-density lipoprotein cholesterol; TC, total cholesterol; ALT, alanine aminotransferase; AST, aspartate aminotransferase; GGT, γ-glutamyl transferase; Scr, serum creatinine; SUA, serum uric acid; CIs, confidence intervals; RCS, restricted cubic spline; MS, metabolic syndrome; NHHR, non-HDL to HDL cholesterol ratio.
Data Sharing Statement
Publicly available datasets were analyzed in this study. This data can be found here: Centers for Disease Control and Prevention (CDC), National Center for Health Statistics (NCHS), National Health and Nutrition Examination Survey (NHANES), https://www.cdc.gov/nchs/nhanes/.
Ethics Approval and Consent to Participate
This study was conducted using publicly available datasets (NHANES) in which informed consent and ethics approval were already obtained by the original investigators. In accordance with the Measures for Ethical Review of Life Science and Medical Research Involving Human Subjects (China, February 18, 2023, Article 32, Items 1 and 2), secondary analysis of de-identified, publicly accessible human data is exempt from further Institutional Review Board approval.
Acknowledgments
The authors thank all the participants and staff of the National Health and Nutrition Examination Survey for their valuable contributions.
Author Contributions
All authors made a significant contribution to the work reported, whether that is in the conception, study design, execution, acquisition of data, analysis and interpretation, or in all these areas; took part in drafting, revising or critically reviewing the article; gave final approval of the version to be published; have agreed on the journal to which the article has been submitted; and agree to be accountable for all aspects of the work.
Funding
The authors declare financial support was received for the research, authorship, and/or publication of this article. This work was supported by the Natural Science Foundation of Hubei Province (2023AFD149), the Chinese Medicine Scientific Research Projects of Hubei Provincial administration of Traditional Chinese Medicine (ZY2023Q003), the Natural Science Foundation of Hubei Province for Youths (2022CFB923), the Wuhan Natural Science Foundation Exploration Plan (Morning Light Program, NO. 2024040801020359), and the Postgraduate Research & Practice Innovation Program of Jiangsu Province (SJCX24_1026).
Disclosure
The authors declare that they have no competing interests in this work.
References
1. Dhayat NA, Bonny O, Roth B, et al. Hydrochlorothiazide and prevention of kidney-stone recurrence. N Engl J Med. 2023;388(9):781–791. doi:10.1056/NEJMoa2209275
2. Siener R. Nutrition and kidney stone disease. Nutrients. 2021;13(6):1917. doi:10.3390/nu13061917
3. Sorokin I, Mamoulakis C, Miyazawa K, Rodgers A, Talati J, Lotan Y. Epidemiology of stone disease across the world. World J Urol. 2017;35(9):1301–1320. doi:10.1007/s00345-017-2008-6
4. Thongprayoon C, Krambeck AE, Rule AD. Determining the true burden of kidney stone disease. Nat Rev Nephrol. 2020;16(12):736–746. doi:10.1038/s41581-020-0320-7
5. Ma Y, Cheng C, Jian Z, et al. Risk factors for nephrolithiasis formation: an umbrella review. Int J Surg Lond Engl. 2024;110(9):5733–5744. doi:10.1097/JS9.0000000000001719
6. Simental-Mendía LE, Rodríguez-Morán M, Guerrero-Romero F. The product of fasting glucose and triglycerides as surrogate for identifying insulin resistance in apparently healthy subjects. Metab Syndr Relat Disord. 2008;6(4):299–304. doi:10.1089/met.2008.0034
7. Tao LC, Xu JN, Wang TT, Hua F, Li JJ. Triglyceride-glucose index as a marker in cardiovascular diseases: landscape and limitations. Cardiovasc Diabetol. 2022;21(1):68. doi:10.1186/s12933-022-01511-x
8. Kunutsor SK, Seidu S, Kurl S, Laukkanen JA. Baseline and usual triglyceride-glucose index and the risk of chronic kidney disease: a prospective cohort study. GeroScience. 2024;46(3):3035–3046. doi:10.1007/s11357-023-01044-5
9. Weyman-Vela Y, Guerrero-Romero F, Simental-Mendía LE. The triglycerides and glucose index is more strongly associated with metabolically healthy obesity phenotype than the lipid and obesity indices. J Endocrinol Invest. 2024;47(4):865–871. doi:10.1007/s40618-023-02201-5
10. Lee MJ, Bae JH, Khang AR, Yi D, Yun MS, Kang YH. Triglyceride-glucose index predicts type 2 diabetes mellitus more effectively than oral glucose tolerance test-derived insulin sensitivity and secretion markers. Diabet Res Clin Pract. 2024;210:111640. doi:10.1016/j.diabres.2024.111640
11. Cao S, Hu Y. Interpretable machine learning framework to predict gout associated with dietary fiber and triglyceride-glucose index. Nutr Metab. 2024;21(1):25. doi:10.1186/s12986-024-00802-2
12. Li H, Zhang C. Association between triglyceride-glucose index and gallstones: a cross-sectional study. Sci Rep. 2024;14(1):17778. doi:10.1038/s41598-024-68841-6
13. Yildirim F, Yildiz AB, Kanbay M. A promising tool: triglyceride-glucose index to stratify the risk of cardiovascular events in chronic kidney disease. Clin Kidney J. 2022;15(9):1653–6.
14. Taylor EN, Stampfer MJ, Curhan GC. Obesity, weight gain, and the risk of kidney stones. JAMA. 2005;293(4):455–462. doi:10.1001/jama.293.4.455
15. Lavie CJ, Laddu D, Arena R, Ortega FB, Alpert MA, Kushner RF. Healthy weight and obesity prevention. JACC Health Promotion Series J Am Coll Cardiol. 2018;72(13):1506–1531.
16. Gou R, Dou D, Tian M, et al. Association between triglyceride glucose index and hyperuricemia: a new evidence from China and the United States. Front Endocrinol. 2024;15:1403858. doi:10.3389/fendo.2024.1403858
17. Fu C, Li X, Wang Y, Chen J, Yang Y, Liu K. Association between triglyceride glucose index-related indices with gallstone disease among US adults. Lipids Health Dis. 2024;23(1):203. doi:10.1186/s12944-024-02194-x
18. Dang K, Wang X, Hu J, et al. The association between triglyceride-glucose index and its combination with obesity indicators and cardiovascular disease: NHANES 2003-2018. Cardiovasc Diabetol. 2024;23(1):8. doi:10.1186/s12933-023-02115-9
19. He Q, Chen B, Liang F, Zhang Z. Association between the atherogenic index of plasma and bone mineral density among adult women: NHANES (2011-2018). Front Endocrinol. 2024;15:1363889. doi:10.3389/fendo.2024.1363889
20. Li Y, Di X, Liu M, Wei J, Li T, Liao B. Association between daily sitting time and kidney stones based on the National Health and Nutrition Examination Survey (NHANES) 2007-2016: a cross-sectional study. Int J Surg Lond Engl. 2024;110(8):4624–4632. doi:10.1097/JS9.0000000000001560
21. Jiang H, Li L, Liu J, et al. Triglyceride-glucose index as a novel biomarker in the occurrence of kidney stones: a cross-sectional population-based study. Int J Gen Med. 2021;14:6233–6244. doi:10.2147/IJGM.S334821
22. Qin Z, Zhao J, Geng J, Chang K, Liao R, Su B. Higher triglyceride-glucose index is associated with increased likelihood of kidney stones. Front Endocrinol. 2021;12:774567. doi:10.3389/fendo.2021.774567
23. Lv G, Li X, Zhou X, Wang Y, Gu Y, Yang X. Predictive ability of novel and traditional anthropometric measurement indices for kidney stone disease: a cross-sectional study. World J Urol. 2024;42(1):339. doi:10.1007/s00345-024-05035-9
24. Kim S, Chang Y, Jung HS, et al. Glycemic status, insulin resistance, and the risk of nephrolithiasis: a cohort study. Am J Kidney Dis off J Natl Kidney Found. 2020;76(5):658–668.e1. doi:10.1053/j.ajkd.2020.03.013
25. Kang HW, Seo SP, Kim WT, et al. Hypertriglyceridemia is associated with increased risk for stone recurrence in patients with urolithiasis. Urology. 2014;84(4):766–771. doi:10.1016/j.urology.2014.06.013
26. Chobanian MC, Hammerman MR. Insulin stimulates ammoniagenesis in canine renal proximal tubular segments. Am J Physiol. 1987;253(6):F1171–7. (). doi:10.1152/ajprenal.1987.253.6.F1171
27. Klisic J, Hu MC, Nief V, et al. Insulin activates Na(+)/H(+) exchanger 3: biphasic response and glucocorticoid dependence. Am J Physiol Renal Physiol. 2002;283(3):F532–539. doi:10.1152/ajprenal.00365.2001
28. Weiner ID, Verlander JW. Role of NH3 and NH4+ transporters in renal acid-base transport. Am J Physiol Renal Physiol. 2011;300(1):F11–23. doi:10.1152/ajprenal.00554.2010
29. Ahmed B, Sultana R, Greene G. Adipose tissue and insulin resistance in obese. Biomed Pharmacother Biomedecine Pharmacother. 2021;137:111315.
30. Azzimato V, Jager J, Chen P, et al. Liver macrophages inhibit the endogenous antioxidant response in obesity-associated insulin resistance. Sci Transl Med. 2020;12(532):eaaw9709.
31. Lee MR, Ke HL, Huang JC, Huang SP, Geng JH. Obesity-related indices and its association with kidney stone disease: a cross-sectional and longitudinal cohort study. Urolithiasis. 2022;50(1):55–63. doi:10.1007/s00240-021-01288-w
32. Gui Z, Yu L, Chen Y, Zhang M, He J, Hao Y. Study from the United States: increased prevalence of kidney stones in patients with high weight-adjusted waist index. Front Nutr. 2023;10:1171775. doi:10.3389/fnut.2023.1171775
33. He Q, Tang Y, Li Y, Wang F, Bao J, Gupta S. A pilot dynamic analysis of formative factors of nephrolithiasis related to metabolic syndrome: evidence in a rat model. Ren Fail. 2022;44(1):1134–1143. doi:10.1080/0886022X.2022.2097922
34. Abufaraj M, Siyam A, Xu T, et al. Association between body fat mass and kidney stones in US adults: analysis of the national health and nutrition examination survey 2011-2018. Eur Urol Focus. 2022;8(2):580–587. doi:10.1016/j.euf.2021.03.010
35. Kelly C, Geraghty RM, Somani BK. Nephrolithiasis in the obese patient. Curr Urol Rep. 2019;20(7):36. doi:10.1007/s11934-019-0898-0
36. Kudinov VA, Alekseeva OY, Torkhovskaya TI, et al. High-Density lipoproteins as homeostatic nanoparticles of blood plasma. Int J Mol Sci. 2020;21(22):8737. doi:10.3390/ijms21228737
37. Stadler JT, Marsche G. Obesity-Related changes in high-density lipoprotein metabolism and function. Int J Mol Sci. 2020;21(23):8985. doi:10.3390/ijms21238985
38. Du YZ, Dong QX, Hu HJ, et al. A cross-sectional analysis of the relationship between the non-high density to high density lipoprotein cholesterol ratio (NHHR) and kidney stone risk in American adults. Lipids Health Dis. 2024;23(1):158. doi:10.1186/s12944-024-02150-9
39. Shringi S, Raker CA, Chonchol M, Tang J. Alcohol intake and prevalent kidney stone: the national health and nutrition examination survey 2007-2018. Nutrients. 2024;16(17):2928. doi:10.3390/nu16172928
40. Deng Z, Wei Y, Dai F, et al. Association between parity and female mortality: the mediative role of depressive symptoms. Hum Reprod Oxf Eng. 2024;39(10):2341–2352. doi:10.1093/humrep/deae196
41. Caceres BA, Sharma Y, Ravindranath R, et al. Differences in ideal cardiovascular health between sexual minority and heterosexual adults. JAMA Cardiol. 2023;8(4):335–346. doi:10.1001/jamacardio.2022.5660
 © 2025 The Author(s). This work is published and licensed by Dove Medical Press Limited. The
full terms of this license are available at https://www.dovepress.com/terms
and incorporate the Creative Commons Attribution
- Non Commercial (unported, 4.0) License.
By accessing the work you hereby accept the Terms. Non-commercial uses of the work are permitted
without any further permission from Dove Medical Press Limited, provided the work is properly
attributed. For permission for commercial use of this work, please see paragraphs 4.2 and 5 of our Terms.
© 2025 The Author(s). This work is published and licensed by Dove Medical Press Limited. The
full terms of this license are available at https://www.dovepress.com/terms
and incorporate the Creative Commons Attribution
- Non Commercial (unported, 4.0) License.
By accessing the work you hereby accept the Terms. Non-commercial uses of the work are permitted
without any further permission from Dove Medical Press Limited, provided the work is properly
attributed. For permission for commercial use of this work, please see paragraphs 4.2 and 5 of our Terms.